Abstract
The increasing global focus on sustainability is bringing the question of the sustainability of transport systems—which are still exhibiting numerous negative effects as evidence of their unsustainability—to the fore. While sustainability is an often-discussed concept, tools to guide the practical implementation thereof are limited. This paper presents a framework for an inventory of indicators against which to measure the sustainability of transport systems. While the framework is validated for urban transport systems for increased mobility (here referenced as microtransit systems), the concept is investigated in the context of transport systems in general. A systematic review of the literature was used to develop a framework of 12 areas and 50 indicators of sustainability. Expert reviews, an Analytical Hierarchical Process (AHP), and an Equally Weighted Average (EWA) method were employed to allocate weights to the indicators and to validate the framework for microtransit systems. The framework contributes to the literature by identifying, categorizing, and integrating concepts related to sustainability in transport systems. It is intended to aid short-term decision-making in the design of urban transport systems, to continuously monitor the long-term progress of transport systems against sustainability goals, and to guide policy development. Future work would include enhanced empirical validation of the framework in the context of other types of transport systems, beyond microtransit.
1. Introduction
Transport is considered indispensable for human existence, development, and civilization [1], and is regarded as one of the primary facilitators of trade-based economic growth by connecting people to resources and markets [2]. Modern companies, industries, and society are all dependent on transport and transport infrastructure for global and urban economic survival [3]. While a variety of adequate transport systems is vital for social and economic development, a singular consideration of these developmental aspects would lead us to define transport as a means of encouraging activities that focus on seeking freedom of mobility and wealth creation, without consideration of environmental protection [2]. Since transport also triggers negative impacts regarding human and environmental health, it requires decisions-makers and policy-makers to consider possible negative impacts in addition to the social and economic benefits that it might bring.
Since the publication of Our Common Future (commonly referred to as the Brundtland Report) by the World Commission on Environment and Development [4], most societies have committed themselves explicitly or implicitly to the principles of sustainable development [5,6]. ‘Sustainability’, which reflects the fundamental human desire to protect and improve our planet [7], and ‘sustainable development’ are closely related to the values and value systems of those who attempt to define it [8]. While countries today consider sustainability as an integral part of every aspect of development [9], sustainability is a vast and complex concept with often conflicting goals, and of which the meaning changes according to the context in which it is applied [10].
The concept of sustainability was first applied to the transport sector in developed countries during the early 1990s. Two reports in particular played a vital role during these early stages of the sustainable transport debate [2], namely: 1) Urban Travel and Sustainable Development by the Organization for Economic Co-operative Development (OECD) Group on Urban Affairs and the European Conference of Ministers of Transport (ECMT) [11], and 2) Sustainable Transport: Priorities for Policy Reform by the World Bank [12].
Similar to the difficulty in defining sustainable development, the definition of sustainable transport is not an easy task due to the strong influence of human factors and the non-material aspects of life, including perception, morals, and behaviour [10]. The debate around this definition is ongoing.
Urban transport systems are considered as the engine for urban economic activities and the backbone for general mobility [2], with railways, waterways, airways, and road systems constituting the largest component [13]. Urban areas tend to develop at nodal points in transport networks with good road networks [14], and urbanization has driven large increases in transport demand and road traffic in many urban areas [13], leading to capacity deterioration and inefficient road network performance. Addressing these issues by the addition of road space is ineffective, since this development induces further travel growth, which cannot always be accommodated in already built-up and dense urban environments [15]. The unsustainability of urban transport systems is widely acknowledged [7,10,16,17] and, following from the above, most sustainable urban transport research efforts revolve around road transport [2].
‘Smart mobility’ modes of transport are increasingly emerging through technological advancements in ICTs, including intelligent transport systems (ITS) [18,19], shared mobility [20,21], and microtransit systems [22,23,24]. These initiatives challenge the traditional transport system concepts and support the claims that global economic sustainability cannot be accomplished sufficiently through incremental improvements in current transport systems [22,25,26].
Microtransit is characterised by the use of ICTs and IoT towards ITS and by shared mobility in sharing economies, applied to the urban transport sector. It has only recently emerged as a technology-enabled alternative transit service that incorporates flexible routing and/or flexible scheduling [21]. A key characteristic is the ability to connect supply and demand through the use of ICTs, specifically in a demand-responsive manner, and often with a focus on ’first-and-last-mile’ transit.
Despite these technologically driven attempts at improving the sustainability of transport systems, problems persist in practice. Most of the negative effects of transport systems that were identified by Rosén in 2001 are still encountered today: pollution, loss of community, car dependence and widespread ownership, social exclusion, land consumption, adverse economic, environmental and social impacts of traffic congestion, and non-renewable natural resource depletion [27].
Although it is widely acknowledged that innovations in the transport sector present innovative new (or re-emerging) modes of transport with great potential, the adoption thereof would require tools that decision-makers, policy-makers, and stakeholders can use to monitor and evaluate the system for its sustainability performance once it has been fully deployed and integrated with current traditional transport networks and infrastructure.
While there seems to be an abundance of research concerning the sustainability assessment of current modes of transport, little research exists regarding the sustainability evaluation of the contemporary ‘smart mobility’ transport alternatives [28,29,30,31,32,33,34,35,36]. Some research has been conducted on the sustainability potential of shared transport and ITS [21], but a dearth of research exists regarding the evaluation of the sustainability performance of contemporary ’smart mobility’ transport alternatives.
Methods for the assessment of transport system sustainability vary depending on context and the aspects that are assessed. In the case of transport infrastructure sustainability, popular assessments include environmental impact assessment, strategic environmental assessment, cost-benefit analysis, multi-criteria analysis, and life-cycle analysis [37]. The majority of researchers in the field of evaluating sustainable transport performance are in agreement that a system of indicators provides the most effective way of quantifying and assessing its sustainability performance [7]. A wide variety of indicators related to the triple bottom line has been developed and utilized for this purpose, based on the context of the research and the mode of transport under consideration [7,9,10,28,32]. Indicator systems are in some cases combined with other decision tools [38,39] to inform transport design, planning, assessment, and ongoing improvement [7,36].
This article presents a conceptual monitoring and evaluation framework for use as a decision support tool towards building realistic and profitable value propositions for urban transport systems from economic, social, and environmental perspectives. The framework is validated for microtransit systems. The following research question is addressed: What indicators should microtransit systems use for the evaluation of its sustainability? The framework comprises 12 areas and 50 indicators of sustainability. It forms a baseline that can be customized for specific urban areas, and from which frameworks for other modes of transport can be developed.
Applications include the validation of system design decisions, the facilitation of ongoing monitoring of the sustainability performance of transport systems, and policy development. It could assist businesses that deploy (micro)transit systems to penetrate public-sector verticals and to secure funding based on evidence-informed performance.
2. Materials and Methods
2.1. Method Overview
A grounded theory research approach was followed. A systematic literature review (SLR) process was adopted for the identification of a relevant body of literature, which was then used to identify an inventory framework for microtransit systems. The framework was validated through an expert review and surveys, after which indicators were weighted through an expert review, an Analytical Hierarchical Process (AHP), and the Equally Weighted Average (EWA) method. A four-stage process was followed, as summarised in Figure 1. Each stage is described in more detail below.
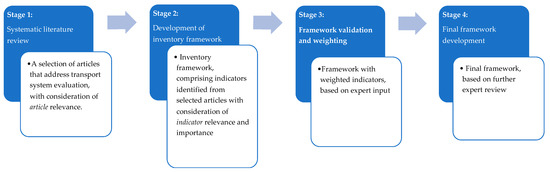
Figure 1.
Process of indicator development, with outcomes for each stage.
Stage 1. The systematic literature review: This process was selected for its objective, replicable, and transparent approach to reviewing a body of literature [40]. The objective was to confirm that a gap exists in the body of knowledge regarding the proposed topic of monitoring and evaluation of microtransit systems, based on the SLR. Research articles that were published between 1985 and 2017 were identified from ScienceDirect, Scopus, Emerald Insight, and Google Scholar, based on various combinations of the keywords Micro, Transit, Monitoring, Evaluation, Framework, Decision Support, Transit, Transportation, Urban, System, and Microtransport. A total of 301 related documents were analysed and assessed for relevance by reviewing the abstracts and keywords of each of the documents. Papers that were inaccessible, duplicates, or of a foreign language were excluded. Finally, a data set of 71 publications were included in the review.
A brief review of the literature that was published following the period of study indicated that articles were published that outlined decision frameworks and decision models for the planning and design of sustainable urban transport systems (e.g., [41,42,43,44,45]). However, recent articles could not be found to describe an indicator framework for microtransit systems, or that would significantly influence the results of this indicator framework.
Stage 2. Developing the inventory framework: An inventory framework of Key Performance Indicators (KPIs) was developed through extensive reading of the selected papers, and through identification, extraction, and categorization of specific data. All papers were considered equally, and a comprehensive list of 807 concepts or KPIs was identified. The identification of indicators considered the principles for adequate transport indictor selection as proposed by Litman [7] (see Section 3.2); further, indicators were selected for their relevance and importance to (micro)transport system sustainability.
KPIs were identified from each article, and their area of application was noted. The list of KPIs was categorised into a total of 12 areas of sustainability (AoS), 50 indicators, and 198 variables (see Figure 2).
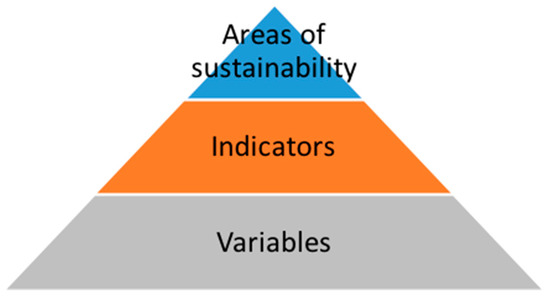
Figure 2.
Hierarchy of categories of concepts.
Stage 3. Framework validation and weighting: This was achieved through expert surveys and interviews [46]. These allowed the researcher to confirm that the list of indicators used in the adjusted framework is credible, confirmable, relevant, and needed. Indicator-weighting interviews allowed for an enhanced framework in which the importance of indicators were compared and weighted accordingly (i.e., reliable, useful, and important). Three weighting methods were utilized: the 12 Areas of Sustainability were weighted using a Likert scale, after which the 50 indicators were weighted through an AHP. Finally, the 188 variables were weighted using the EWA method.
The AHP is typically applied to smaller groups of respondents who are considered to be topic experts. Several studies reported findings from the AHP research that were based on small groups of experts: five respondents [47], five participants [48], seven participants [49], seven experts [9], and 18 participants [50]. Due to the shortage of possible experts, and the fact that only a small number of experts are commonly used during the AHP method, seven expert participants from academia and industry were interviewed. They included specialists in ITS and smart mobility, transport, microtransit, and a senior executive in the intelligent transport and energy sectors.
Stage 4. Final framework: Results from the expert reviews in Stage 4 were interpreted and integrated into the framework. Final weights were assigned to all areas of sustainability, indicators, and variables (see Section 3.3).
2.2. Weighting Methods
Indicators could have both direct and indirect impacts on each of the domains of sustainability (i.e., social, environmental, economic, etc.). Not only does each indicator contribute in different proportions to each domain, their relative importance for achieving overall transport system sustainability also differs and has to be determined. Weighting the components of the framework (AoS, indicators, and variables) is a complex process [32,33,36,51]. A study that evaluated 40 different composite indices concluded that the majority of cases (40%) used the EWA approach [52]. The AHP was also identified as a method that is commonly used [53].
2.2.1. Weighting Aos Using the Likert Scale Method
Of the 12 AoS, it was postulated that four AoS contribute mostly to economic development, four to social development, and four to environmental development. As indicated previously, these areas do overlap and in most cases contribute in some degree to all three pillars of sustainability. For this reason, the areas of sustainability were weighted by experts, based on a Likert scale of 1 to 7, according to their relative importance to each pillar of sustainability. Using weighted averages, the relative weights of every AoS were determined. The following 7-point importance Likert scale was used: (1—not at all important; 2—slightly important; 3—somewhat important; 4—moderately important (neutral); 5—quite important; 6—very important; 7—extremely important)
For every survey, , a Likert scale rating, , was obtained for all three domains of every AoS, regarding the relative importance of every AoS to each domain, namely: ; and These ratings were summed to obtain a total for every AoS, , per survey, , to obtain .
The ratings were used to determine the weights, , for all three domains of every AoS, , per survey, , and the overall proportional weights that each AoS, , contribute to the three domains respectively were determined by taking the average across all surveys:
The sum of the three domain ratings for every AoS, , per survey, , can be divided by the sum of all ratings obtained for all AoS in order to determine the relative weightings, , of each AoS per survey:
The above calculations used the Likert scale ratings assigned to the three domains of sustainability in order to determine weightings for every AoS.
Another approach could be to obtain Likert scale ratings, , directly for every AoS regarding its importance for overall sustainability. This would enable the interviewee to assign ratings, , according to which AoS he/she believes is more important for overall sustainability relative to the others:
These ratings could then be divided by their sum in order to determine weightings for every AoS per survey (weighted average):
Both approaches for establishing weightings for each AoS were used. This required the interviewees to provide Likert scale ratings for every AoS regarding their importance to social, economic, and environmental sustainability, as well as regarding the AoS’s importance for overall sustainability. These two AoS weights were expected to be similar to each other to some degree. However, a combination of these two weights would ensure comprehensively weighted ratings to be applied to each AoS. For every survey, the weights for each of the 12 AoS were determined by taking the average of the findings of these two approaches. The final weights assigned to each AoS were determined by taking the average across all surveys. With this approach, the interviewee can review whether s/he is satisfied with the relative weights of each AoS, as determined with the different Likert scale ratings.
2.2.2. Weighting Indicators Using the AHP Method
Indicators were weighted using the AHP method, which is also known as expert panel weighting [54]. This structured technique is used to analyse complex decisions by reducing them to a series of pairwise comparisons, and was employed in this study for its characteristic ability to address intangibles in the decision-making process [55]. Criteria weights were determined through expert judgements by considering each criterion’s relative importance [53], and each element was compared to every other element in the set through pairwise comparison, forcing a ‘trade-off’ between criteria to determining relative weightings. After weightings have been determined for every criterion, the consistency of the decision-maker’s judgements was determined to reduce bias throughout the decision-making process [54].
The pairwise comparisons imply that every criterion is compared to all other criteria in the set. Due to the exponential increase in the required number of comparisons as the number of criteria increases, the comparative approach of the AHP method is thus only useful and practical with smaller sets of criteria/indicators (say < 10) within a category. In the case of this research, the 50 indicators were categorized into 12 AoS.
The AHP method for determining the relative weights for the indicators in each AoS was determined by computing the vector criteria weights, and confirming the consistency of the expert judgment ratings, as summarised in Figure 3:
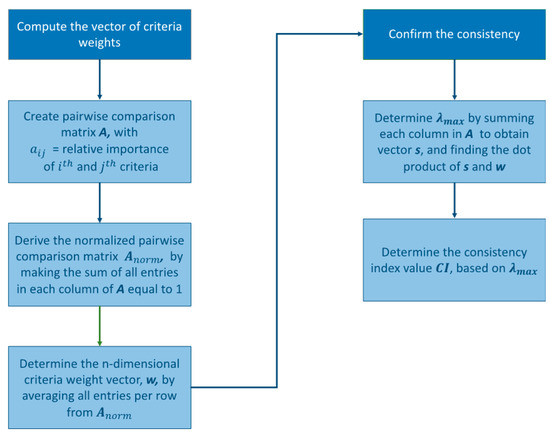
Figure 3.
Steps in the process to weight indicators using the AHP method.
With known, the consistency index value of can be determined. If the expert respondent is perfectly consistent a value of will be obtained. Since there will always be some inconsistencies, Saaty (1980) recommends that small values of inconsistencies may be tolerated for CR < 0.1 and can be considered reliable where:
The random index () values are the consistency index values when the entries of are entirely random. For small problems where the number of criteria, , are < 10, the values for n = 2 to 10 are as follows: 0, 0.58, 0.90, 1.12, 1.24, 1.32, 1.41, 1.45, and 1.51.
This approach of determining weights and checking their consistencies was completed for each set of indicators of every AoS in this research project. A spreadsheet was used during the indicator-weighting interviews to answer the AHP survey; this enabled the researcher to determine and provide values for each AoS immediately after it has been entered. The experts thus had to adjust their importance ratings if until they obtained a value below 0.1 for every AoS to ensure consistency.
2.2.3. Weighting Variables Using the Ewa Method
After establishing methods for ranking the AoS and indicator components, the variables had to be weighted. Neither the Likert scale method nor the AHP method would be a realistic choice for assigning weightings during interviews, since 188 variables would need to be weighted. Establishing accurate weightings for the AoS and the indicators is considered more critical than for the variables. These two components comprise the skeleton that accurately indicates which factors are the most important for achieving overall sustainability. For this reason, and due to the fact that the majority of research studies concerning composite indices use the equally weighted average (EWA) approach [48], the variables were weighted according to the EWA approach. This approach simplifies the addition or removal of variables, since they can easily be re-weighted without requiring expert interviews.
3. Results
The results from the indicator development process are outlined below. Since the systematic literature review formed an integral part of the process of indicator development (see Figure 1), it is reported as part of the Stage 1 results.
3.1. Stage 1—Systematic Review: Description of Literature
The systematic literature review identified 71 publications relevant to the assessment of the sustainability of microtransit systems (see Appendix A for the full list of articles). The 71 relevant publications were given unique identification (ID) numbers to be able to easily distinguish between them.
An in-depth qualitative analysis of the abstracts allowed the following classifications to be done: 1) descriptive characteristics of the article; 2) the application area in terms of transportation type; 3) monitoring and evaluation methods used; and 4) the sustainability impact areas considered—that is, economic, social, environmental, or political.
A matrix was then created to indicate which of the main recurring themes were identified in each of the 71 relevant publications. The papers in Figure 4 were firstly ranked according to their respective relevance ratings. Thereafter, the themes were ranked in each of the three categories according to frequency of appearance, with the most common themes listed first
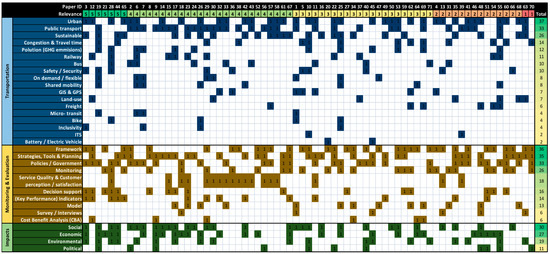
Figure 4.
Summary of publications analysis: relevance and main recurring themes.
Figure 5 summarizes the main focus areas of the selected articles, indicating the following three dominant themes that appear in approximately 50% of the publications: framework; strategies, tools and planning; and policies/government.
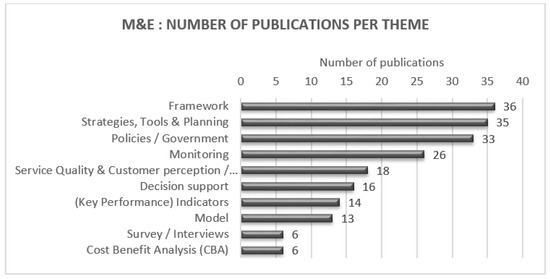
Figure 5.
Monitoring and Evaluation focus: Number of publication per theme.
In Figure 6, the main themes in the Impacts category are ranked according to frequency of appearance (social, economic, environmental, political). Note that environmental and political aspects were considered by the least number of articles.
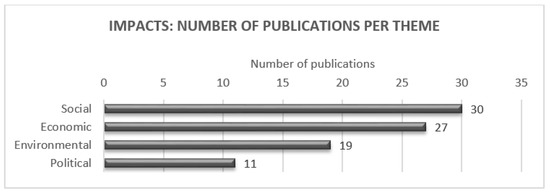
Figure 6.
Impacts: Number of publications per theme.
Following the thematic analysis of the articles, a more comprehensive analysis was undertaken to allocate a further relevance rating to each article in terms of its contribution to transport system indicators (KPIs), the objective of the paper (distinctive contribution), its methodology/analysis process, and its approach.
In addition to the relevance rating allocation, the approaches followed by each article were analysed. Table 1 summarizes approaches that were used in at least two articles. The following similar approaches are also included in the list: Importance-Satisfaction Analysis (ISA) and Importance-Performance Analysis (IPA). These were identified as possibilities for use as a management tool for future studies.

Table 1.
List of approaches followed by relevant articles.
From Table 1, it is clear that the most common approach adopted by authors was to determine or develop a measure of sustainability performance. This was either done through qualitative performance analysis, or through quantitative analysis (which mostly included the determination of a sustainability index). The latter is closely connected to the second most common approach, namely, KPI identification. The top five approaches also include public perception/customer satisfaction, service quality /level of service (LoS), and surveys.
The analysis of the articles, as outlined here, confirmed their relevance and appropriateness as a body of knowledge upon which to base further indicator development. The selection of indicators, as outlined in the next section, was based on the relevance and importance of individual indicators, rather than on the number of publications that were identified per theme. These ratings were informed by indicator selection principles, and validated by expert input.
3.2. Stage 2—Framework: Inventory of Indicators
During the detailed anlysis of articles, it was clear that there was significant variability in the classification schemes used by authors. Where some researchers classified a certain concept as an indicator, others classified it as a variable, an area of sustainability, or an evaluation category.
The sheer number of indicators explored by authors and the numerous classifications of concepts can be illustrated through the following examples: four impact categories, 12 variables [56]; eight categories, 37 variables [57]; four categories, 20 criteria [58]; four critical perspectives, 12 evaluation criteria [36]; 14 indicators [59]; four evaluation categories, 11 areas of investigation, 25 KPIs [35]; six impact categories, 85 KPIs [34]; six measures, 25 KPIs [60]; 11 criteria [51]; six dimensions of quality, 18 criteria [61]; three domains, 12 elements, 19 indicators, 22 variables [33]; nine domains, 37 themes, 87 indicators [32]; 18 concepts, indicators [31]; 10 impacts [29]; five domains, 174 indicators [28].
For this reason, all evaluation categories (areas of sustainability), indicators, metrics, and variables identified in the relevant publications were considered carefully and sifted thoroughly, as illustrated in Figure 7.
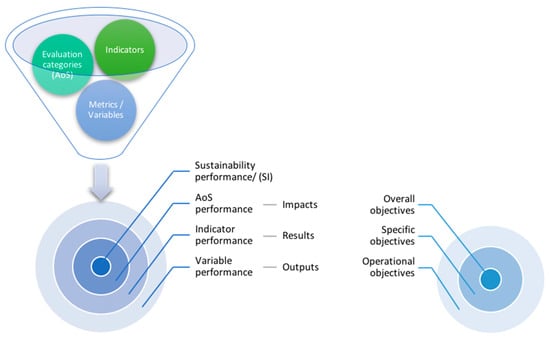
Figure 7.
Concept categorization and integration.
This process made use of the familiar logic model utilized in monitoring and evaluation (M&E) frameworks in which, in order to reach stated objectives, activities have to be completed towards achieving certain outputs. Thus, successful application of activities and achievement of their desired outputs will lead to results (outcomes), which ultimately lead to the desired impacts. These outputs, results (outcomes), and impacts are in line with operational, specific, and overall objectives, respectively, as indicated in Figure 7. This process was adopted in considering the elements presented by the various publications; it enabled identification, categorization, and integration of concepts into evaluation categories (areas of sustainability) that consist of indicators, which in turn comprise variables.
All of the 807 identified key concepts, referred to as KPIs for the purpose of this study, were deconstructed, categorized, and integrated by following the process in Figure 7, to establish the concept category hierarchy. The key principles in Table 2 were applied when selecting adequate transport indicators.
Table 2.
Key principles for adequate transport indicator selection (adapted from [7]).
In addition to the principles for indicator selection in Table 2, the criteria followed when choosing the final list of 12 areas of sustainability, 50 indicators, and 188 variables were based on each concept’s relevance to microtransit systems and the importance of considering the concept for microtransit system sustainability to ensure that they were representative. This approach gave preference to these criteria above the measurability of the concepts, and enabled identification of all factors that must be considered, regardless of its measurability.
An extract of the results of the process of indicator categorisation and integration is provided in Figure 8. It indicates the categorisation in terms of area of sustainability, indicator, and variable. The occurrence of each area, indicator, and variable is listed for each paper, as is the occurrence of each indicator per theme.
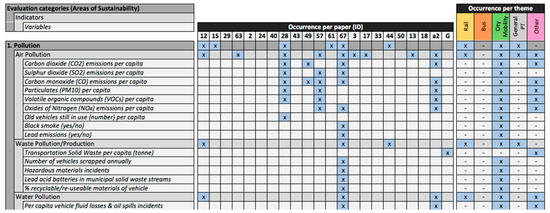
Figure 8.
Extract from results of indicator categorisation and integration.
The AoS and indicators included in the inventory framework are provided in Table 3; for brevity, the variables are not included.
Table 3.
List of areas of sustainability (AoS) and indicators in the inventory framework.
It is noteworthy that, in spite of the review of literature from the perspective of microtransit systems, the review did not yield any Areas of Sustainability or indicators that are exclusively relevant to microtransit systems. This points to the potential generalisation of the framework for other transport systems.
3.3. Stages 3 and 4–Indicator Weightings, Expert Review, and Final Framework
The main set of 50 key performance indicators was categorized into 12 areas of sustainability (Table 3), as outlined in Section 3.2. These areas were then weighted according to their relative importance for social, economic, and environmental sustainability, based on surveys that were conducted among experts. Instead of equally weighting the three spheres by means of the EWA method, the most important indicators and their AoS for achieving microtransit sustainability were identified and individually weighted according to their respective importance for each domain [33]. A Likert scale (for weighting the Aos) and the AHP method (for weighting the indicators) were utilized.
The expert review considered accessibility and availability, mobility, and financials as the most important areas of sustainability. Within each of these areas of sustainability, the following variables were respectively considered as the most important: general availability, time spent in the system, and affordability to the customer. The tables also include the average weights, standard deviation and coefficient of variance (CV) for each element.
As seen in Figure 9, this reduced the average standard deviation across all indicators and improved the coefficient of variance value as well.
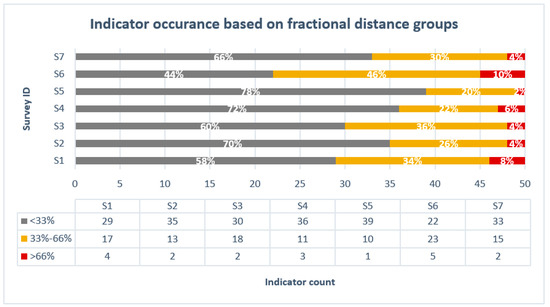
Figure 9.
Indicator occurrence based on fractional distance groups.
The domain weightings were multiplied by the AoS weights to determine the total priority of each domain towards overall sustainability. This is shown in Figure 10, where the importance of the 12 AoS are ranked, based on their relative priority weights. It is illustrated along with the proportion that each of these weights contributes towards each of the three sustainability domains. For the latter, it is noteworthy that the contribution to social and economic sustainability exceeds 20% for all Areas of Sustainability, while the contribution to environmental sustainability is less than or equal to 20% for seven of the Areas of Sustainability. While the reason for this relatively low contribution to environmental sustainability was not explored with the experts, it is possible that the emphasis on economic and social sustainability is a reflection of the relative priorities in a developing economy, where all experts were situated.
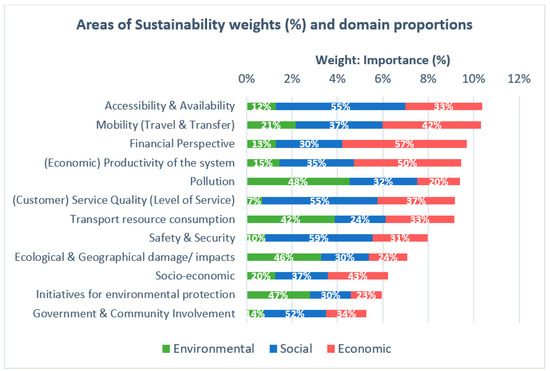
Figure 10.
Areas of sustainability (AoS) weights (%) and domain proportions.
From a domain perspective, Figure 11 illustrates the priority of each of the three sustainability domains, as well as the AoS proportions comprising each domain.
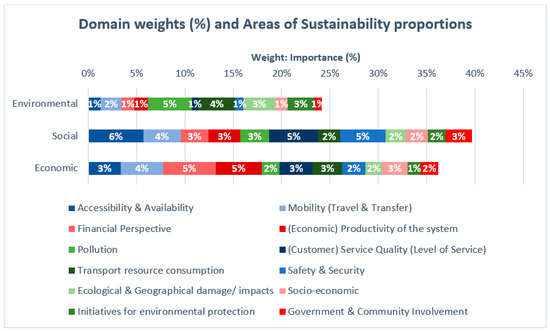
Figure 11.
Domain weights (%) and Areas of Sustainability proportions.
An extract of the enhanced evaluated and weighted framework (i.e., the final framework) is presented in Table 4; the full framework is available as supplementary material to this article (See Supplementary Materials).
Table 4.
Extract from enhanced and weighted conceptual framework (final framework).
The framework reflects a diverse range of variables, and possible units for measurement are included for each variable. By way of example, the variables that comprise the Air Pollution indicator in the Pollution evaluation category includes particle pollution, ground-level ozone, carbon monoxide, sulphur oxides, nitrogen oxides, lead emissions, and volatile organic compounds. In contrast, the Initiatives for environmental protection evaluation category contains the following indicators (the variable for each indicator is given in brackets): Studies of environmental impacts (number of studies); Investments dedicated to environmental protection (total sum of investments); and technological maturity of the transport system (technology readiness level rating).
Note that, although the enhanced weighted framework includes suggested variables for determining the respective indicators, the focus of this research was to develop a conceptual framework where the main concepts were identified for transport system sustainability, with specific reference to microtransit systems. The variables are presented as an extensive list that could be customized for different environments (geographies, types of systems, etc.).
4. Discussion
It is generally agreed that a system of indicators provides the most effective way of quantifying and assessing sustainability performance [7,10]. A wide variety of indicators related to the triple bottom line has been developed and utilized for the evaluation of transport systems [7,9,10,28,32,62,63,64]. These indicators are used to evaluate sustainability, guide decision-making processes, and assist planners and administrators by determining the effectiveness of policies in progressing sustainable development [7,36].
The SLR method developed for this research study (incorporating confirmatory factor analysis) enabled a comprehensive approach, in which development comprised a progression from data towards concepts and categories, and ultimately resulted in the development of a new theory for a novel transport system that has not been fully deployed. No framework of its kind existed prior to the one developed in this research. Although similar transport evaluation frameworks exist for other transport modes, none have a focus on the novel concept of microtransit systems, which serve as an example of systems that focus on ‘first-and-last-mile’ technology-enabled transport in an era of shared mobility, IoT, and a focus on ICT.
The framework contributes to the literature by identifying, categorizing, and integrating concepts related to sustainability through an extensive and comprehensive SLR. Key Performance Indicators were identified, and then weighted and validated through expert interviews and questionnaires. The novel conceptual weighted framework was determined comprehensively, and provides a foundation from which variables can easily be modified, removed, or added. This can be done by future researchers of microtransit systems, or by the policy-makers, decision-makers, and private companies that utilize the framework in its current form.
The tension between convenience (measurability) and comprehensiveness when selecting indicators is common in sustainability research [7]. Although a comprehensive and representative list of indicators was compiled, reliable indicators also need to be clear and measurable. Therefore, in future research efforts, a smaller set of indicators could be considered to ensure high quality and to provide a standardized and feasible sampling method. Future research could also focus on determining appropriate and measurable subsets of indicators for specific applications.
In addition, future work should also elucidate the consideration of measurability vs. comprehensiveness through case study applications, and could include the application of the framework in its current form as a management tool in a case study, so as to establish that the conceptual framework is efficient, effective, applicable, and valid.
Although the framework was developed to monitor and evaluate the sustainability of microtransit systems specifically, none of the Areas of Sustainability and indicators that were identified by the literature review are exclusively applicable to microtransit systems. It is therefore suggested that this comprehensive and modern framework could be considered across transport modes that are similar to microtransit, and could be validated and applied to these modes (e.g., smart mobility services (ITS), shuttle services, bike transport, minibus taxis, etc.) to determine how their sustainability performance would compare.
The method for the development of indicators, based on popular themes in the literature and expert opinion, develops in essence a reflection of current thinking with respect to the topic under consideration. It was here applied to sustainability of transport systems, which is an important topic that elicits multiple and (sometimes) conflicting perspectives from scholars—as is reflected by the comprehensive list of indicators that were identified. This method for indicator development could potentially be applied to other fields that have strong systemic impacts, and where the understanding of the systemic interactions is still emergent. This aspect could be explored in future work.
Supplementary Materials
The following are available online at https://www.mdpi.com/2071-1050/11/21/5929/s1, Enhanced objective and weighted conceptual framework (final framework).
Author Contributions
Conceptualization, S.S.G. and R.B.; methodology, S.S.G. and R.B.; validation, R.B.; formal analysis, R.B.; investigation, R.B.; data curation, R.B.; writing—original draft preparation, R.B.; writing—review, editing, and preparation of final document, I.M.; enhancement of literature review, I.M.; supervision, S.S.G; project administration, S.S.G.; funding acquisition, S.S.G.
Funding
This research was partially funded by DST-NRF Centre of Excellence in Scientometrics and Science, Technology and Innovation Policy (SciSTIP), South Africa, and The APC was funded by Stellenbosch University.
Acknowledgments
The authors gratefully acknowledge the participation of the expert reviewers, who contributed their time and expertise to assist in developing the research product.
Conflicts of Interest
The authors declare no conflict of interest. The funders had no role in the design of the study; in the collection, analyses, or interpretation of data; in the writing of the manuscript, or in the decision to publish the results.
Appendix A
The final selection of identified articles, as identified by the systematic literature review, are summarized below:
Table A1.
| ID | Year | Author(s) | Title | References |
|---|---|---|---|---|
| A1 | 2017 | C. Frei, M. Hyland, H. Mahmassani | Flexing service schedules: Assessing the potential for demand-adaptive hybrid transit via a stated preference approach | [65] |
| A2 | 2017 | Lin, Liang-Tay | Role of governance in the achievement of 20-fold increase in bus ridership—A case study of Taichung City | [66] |
| A3 | 2017 | Munira, Sirajum | Examining public perception over outcome indicators of sustainable urban transport in Dhaka city | [9] |
| A4 | 2016 | Rohde J., Völz B., Mielenz H., Zöllner J.M. | Precise vehicle localization in dense urban environments | [67] |
| A5 | 2016 | Lanka S., Jena S.K. | On-road vehicle information processing framework for Advanced Traveller Information Systems | [68] |
| A6 | 2016 | Shaheen S., Chan N. | Mobility and the sharing economy: Potential to facilitate the first-and last-mile public transit connections | [69] |
| A7 | 2016 | Cheyne, M. Imran | Shared transport: Reducing energy demand and enhancing transport options for residents of small towns | [70] |
| A8 | 2016 | Reynolds J.H., Knutson M.G., Newman K.B., Silverman E.D., Thompson W.L. | A road map for designing and implementing a biological monitoring program | [71] |
| A9 | 2016 | Mulley, Corinne | Workshop 8 report: The wider economic, social and environmental impacts of public transport investment | [72] |
| A10 | 2016 | Boltze, Manfred | Approaches to Achieve Sustainability in Traffic Management | [73] |
| A11 | 2016 | Gschwender, Antonio | Using smart card and GPS data for policy and planning: The case of Transantiago | [19] |
| A12 | 2016 | Ustaoglu, Eda | Integrating CBA and land-use development scenarios: Evaluation of planned rail investments in the Greater Dublin Area, Ireland | [56] |
| A13 | 2016 | Hernandez, Sara | Urban transport interchanges: A methodology for evaluating perceived quality | [57] |
| A14 | 2016 | Emerson, David | A theoretical analysis of business models for urban public transport systems, with comparative reference to a Community Franchise involving Individual Line Ownership | [74] |
| A15 | 2016 | Machado-León, José Luis | The role of involvement in regards to public transit riders’ perceptions of the service | [58] |
| A16 | 2016 | Fuggini, Clemente | Towards a Comprehensive Asset Integrity Management (AIM) Approach for European Infrastructures | [75] |
| A17 | 2016 | Yang, Chih-Hao | Incorporating carbon footprint with activity-based costing constraints into sustainable public transport infrastructure project decisions | [36] |
| A18 | 2016 | de Oña, Juan | Index numbers for monitoring transit service quality | [59] |
| A19 | 2016 | Transportation Research Board | Between public and private mobility: Examining the rise of technology-enabled transportation services | [76] |
| A20 | 2015 | Allam A., Onori S., Marelli S., Taborelli C. | Battery Health Management System for Automotive Applications: A retroactivity-based aging propagation study | [77] |
| A21 | 2015 | Born P.H., Dumm R.E., Eger R.J., III | Developing a framework for financial achievability of department of transportation research and development projects | [78] |
| A22 | 2015 | Imran, Muhammad | Auckland’s first spatial plan: Ambitious aspirations or furthering the status quo? | [79] |
| A23 | 2015 | Placido, Antonio | A Methodology for Assessing the Feasibility of Fleet Compositions with Dynamic Demand | [80] |
| A24 | 2015 | Corazza, Maria Vittoria | The European Bus System of the Future: Research and Innovation | [35] |
| A25 | 2015 | Ricci, Miriam | Bike sharing: A review of evidence on impacts and processes of implementation and operation | [81] |
| A26 | 2015 | Jennings, Gail | Finding our balance: Considering the opportunities for public bicycle systems in Cape Town, South Africa | [82] |
| A27 | 2015 | Macharis, Cathy | Reviewing the use of Multi-Criteria Decision Analysis for the evaluation of transport projects: Time for a multi-actor approach | [83] |
| A28 | 2014 | Onatere J.O., Nwagboso C., Georgakis P. | Performance indicators for urban transport development in Nigeria | [34] |
| A29 | 2014 | Kesten A.S., Ögüt K.S. | A New Passenger-Oriented performance Measurement framework for public Rail transportation systems | [61] |
| A30 | 2014 | Stanley, John | Workshop 6 Report: Delivering sustainable public transport | [84] |
| A31 | 2014 | Georgiadis, Georgios | Measuring and improving the efficiency and effectiveness of bus public transport systems | [85] |
| A32 | 2014 | Isabello, Andrea | Reviewing Efficiency and Effectiveness of Interurban Public Transport Services: A Practical Experience | [86] |
| A33 | 2014 | Liou, James J.H. | Improving transportation service quality based on information fusion | [87] |
| A34 | 2013 | Ozbay K., Bartin B., Mudigonda S., Iyer S. | ASSIST-ME | [88] |
| A35 | 2013 | López-Lambas M.E., Corazza M.V., Monzon A., Musso A. | Rebalancing urban mobility: A tale of four cities | [89] |
| A36 | 2013 | Şimşek B., Pakdil F., Dengiz B., Testik M.C. | Driver performance appraisal using GPS terminal measurements: A conceptual framework | [90] |
| A37 | 2013 | Stanley, John | Workshop 3A: Governance, contracting, ownership and competition issues in public transport: Looking up not down | [91] |
| A38 | 2013 | Zhao, Jinhua | Unified estimator for excess journey time under heterogeneous passenger incidence behaviour using smartcard data | [92] |
| A39 | 2013 | Nelson, John D. | The impact of the application of new technology on public transport service provision and the passenger experience: A focus on implementation in Australia | [18] |
| A40 | 2013 | Tsamboulas, D. | Transport infrastructure provision and operations: Why should governments choose private–public partnership? | [51] |
| A41 | 2013 | Gwilliam, Kenneth | Cities on the move—Ten years after | [13] |
| A42 | 2013 | Klinger, Thomas | Dimensions of urban mobility cultures—a comparison of German cities | [6] |
| A43 | 2013 | Freitas, André Luís Policani | Assessing the quality of intercity road transportation of passengers: An exploratory study in Brazil | [61] |
| A44 | 2013 | Zheng, Jason | Guidelines on developing performance metrics for evaluating transportation sustainability | [33] |
| A45 | 2012 | Zheng, Jie | Strategic policies and demonstration program of electric vehicle in China | [64] |
| A46 | 2012 | Medda, Francesca | Land value capture finance for transport accessibility: a review | [93] |
| A47 | 2012 | Politis, Ioannis | Integrated Choice and Latent Variable Models for evaluating Flexible Transport Mode choice | [94] |
| A48 | 2012 | Lindholm, Maria | Challenges in urban freight transport planning—a review in the Baltic Sea Region | [95] |
| A49 | 2012 | Miranda, Hellem de Freitas | Benchmarking sustainable urban mobility: The case of Curitiba, Brazil | [32] |
| A50 | 2012 | Diana, Marco | Measuring the satisfaction of multimodal travellers for local transit services in different urban contexts | [96] |
| A51 | 2011 | Yi-Zhong F. | Performance measurement of the U.S.’s service management and its enlightment to China: Examples from the transportation service subsidy of the United States | [97] |
| A52 | 2011 | Moreland K., Ogle J., Chowdhury M.R., Dunning A. | Transit-system evaluation process: From planning to realization | [98] |
| A53 | 2011 | Skordylis A., Trigoni N. | Efficient data propagation in traffic-monitoring vehicular networks | [99] |
| A54 | 2010 | Eisele W.L., Schrank D.L. | Conceptual framework and Trucking application for estimating impact of congestion on Freight | [100] |
| A55 | 2010 | Behrendt, Hannah | Part II: Policy instruments for sustainable road transport | [101] |
| A56 | 2010 | Stanley, John | Workshop report—A successful contractual setting | [102] |
| A57 | 2010 | Macário, Rosário | Competing for level of service in the provision of mobility services: Concepts, processes and measures | [31] |
| A58 | 2010 | Muñoz, Juan Carlos | On the development of public transit in large cities | [103] |
| A59 | 2009 | Borzacchiello M.T., Torrieri V., Nijkamp P. | An operational information systems architecture for assessing sustainable transportation planning: principles and design | [104] |
| A60 | 2009 | Gudmundsson H., Ericsson E., Hugosson M.B., Rosqvist L.S. | Framing the role of Decision Support in the case of Stockholm Congestion Charging Trial | [105] |
| A61 | 2008 | da Silva, Antônio Nélson Rodrigues | Multiple views of sustainable urban mobility: The case of Brazil | [30] |
| A62 | 2007 | Barceló J., Grzybowska H., Pardo S. | Vehicle Routing and scheduling models, simulation and City Logistics | [106] |
| A63 | 2007 | Tricker, Reginald C. | Assessing cumulative environmental effects from major public transport projects | [29] |
| A64 | 2006 | Van Geldermalsen T., O’Fallon C., Wallis I., Melsom I. | Travel behaviour change evaluation procedures and guidelines | [107] |
| A65 | 2005 | Costa M.S., Silva A.N.R., Ramos R.A.R. | Sustainable urban mobility: A comparative study and the basis for a management system in Brazil and Portugal | [108] |
| A66 | 2005 | Loo B.P.Y., Hung W.T., Lo H.K., Wong S.C. | Road safety strategies: A comparative framework and case studies | [109] |
| A67 | 2005 | Jeon C.M., Amekudzi A. | Addressing sustainability in transportation systems: Definitions, indicators, and metrics | [28] |
| A68 | 2005 | Hull, Angela | Integrated transport planning in the UK: From concept to reality | [110] |
| A69 | 2002 | Proost, S | How large is the gap between present and efficient transport prices in Europe? | [111] |
| A70 | 1999 | Turner D., Dix M., Gardner K., Beevers S. | Setting traffic reduction targets for London | [112] |
| A71 | 1985 | Pake Bruce E., Demetsky Michael J., Hoel Lester A. | Evaluation of bus maintenance operations | [113] |
References
- Bailey, L.; Mokhtarian, P.L.; Little, A. The Broader Connection between Public Transportation, Energy Conservation, and Greenhouse Gas Reduction; ICF International: Fairfax, VA, USA, 2008. [Google Scholar]
- Hall, R.P. Introducing the Concept of Sustainable Transportation to the U.S. DOT through the Reauthorization of TEA-21. Master’s Thesis, University of Southampton, Southampton, UK, 2002. [Google Scholar]
- Rodrigue, J.P.; Comtois, C.; Slack, B. The Geography of Transport Systems, 3rd ed.; Routledge: New York, NY, USA, 2016. [Google Scholar]
- Brundtlandt, G. Report of the World Commission on Environment and Development: Our Commmon Future; Oxford Paperbacks: Oxford, UK, 1987; p. 400. [Google Scholar] [CrossRef]
- Zuidgeest, M.H.; Witbreuk, M.J.G.; Van Maarseveen, M.F.A.M. Sustainable transport: A review from a pragmatic perspective. In Proceedings of the 19th Southern African Transport Conference (SATC2000), Pretoria, South Africa, 17–20 July 2000; pp. 17–20. [Google Scholar]
- Klinger, T.; Kenworthy, J.R.; Lanzendorf, M. Dimensions of urban mobility cultures—A comparison of German cities. J. Transp. Geogr. 2013, 31, 18–29. [Google Scholar] [CrossRef]
- Litman, T. Well Measured—Developing Indicators for Sustainable and Livable Transport Planning; Victoria Transport Policy Institute: Victoria, Australia, 2016. [Google Scholar]
- Koglin, T. Sustainable Development in general and urban context: A literature review. Bulletin 248; Lund University: Lund, Sweden, 2009. [Google Scholar] [CrossRef]
- Munira, S.; Santoso, D.S. Examining public perception over outcome indicators of sustainable urban transport in Dhaka city. Case Stud. Transp. Policy 2017, 5, 0–1. [Google Scholar] [CrossRef]
- Olofsson, Z.; Varhelyi, A.; Koglin, T.; Angjelevska, B. Measuring Sustainability Of Transport In The City—Development Of An Indicator-Set. Bulletin 3000; Lund University: Lund, Sweden, 2011; Volume 261, p. 99. Available online: http://portal.research.lu.se/portal/en/publications/measuring-sustainability-of-transport-in-the-city--development-of-an-indicatorset(c3b6b9a0-2e4a-4e71-813d-eb8ab175002d)/export.html#export (accessed on 15 September 2019).
- OECD/EMCT. Urban Travel and Sustainable Development; OECD Publictions: Paris, France, 1995. [Google Scholar]
- World Bank. Sustainable Transport: Priorities for Policy Reform; Development in Practice, The World Bank: Washington, DC, USA, 1996. [Google Scholar]
- Gwilliam, K. Cities on the move—Ten years after. Res. Transp. Econ. 2013, 40, 3–18. [Google Scholar] [CrossRef]
- Wyatt, P.J. The development of a GIS-based property information system for real estate valuation. Int. J. Geogr. Inf. Sci. 1997, 11, 435–450. [Google Scholar] [CrossRef]
- Chowdhury, M.A.; Sadek, A.W. ITS Fundamentals of Intelligent Transportation Systems Planning; Artech House ITS Library: Norwood, MA, USA, 2003. [Google Scholar]
- Dobranskyte-Niskota, A.; Perrujo, A.; Jesinghaus, J.; Jensen, P. Indicators to assess sustainability of transport activities part 2: Measurement and evaluation of transport sustainability performance in the EU27, EC-JRC Scientific and Technical Research Reports; ISPRA: Ispra, Italy, 2009. [Google Scholar] [CrossRef]
- Haghshenas, H.; Vaziri, M. Urban sustainable transportation indicators for global comparison. Ecol. Indic. 2012, 15, 115–121. [Google Scholar] [CrossRef]
- Nelson, J.D.; Mulley, C. The impact of the application of new technology on public transport service provision and the passenger experience: A focus on implementation in Australia. Res. Transp. Econ. 2013, 39, 300–308. [Google Scholar] [CrossRef]
- Gschwender, A.; Munizaga, M.; Simonetti, C. Using smart card and GPS data for policy and planning: The case of Transantiago. Res. Transp. Econ. 2016, 59, 242–249. [Google Scholar] [CrossRef]
- Cohen, B.; Kietzmann, J. Ride On! Mobility Business Models for the Sharing Economy. Organ. Environ. 2014, 27, 279–296. [Google Scholar] [CrossRef]
- Shaheen, S.; Chan, N.; Bansal, A.; Cohen, A. Shared Mobility a Sustainablity and Technology Workshop: Definition, Industry Development and Early Understanding; University of California Berkeley Transportation Sustainability Research Center: Berkeley, CA, USA, 2015; p. 30. Available online: http://innovativemobility.org/wp-content/uploads/2015/11/SharedMobility_WhitePaper_FINAL.pdf (accessed on 15 September 2019).
- Smartcircle. The Rise of the Microtransit Movement. Available online: http://www.smart-circle.org/blog/microtransit/ (accessed on 15 September 2019).
- Jaffe, E.; How the Microtransit Movement Is Changing Urban. Mobility, Citylab. Available online: https://www.citylab.com/transportation/2015/04/how-the-microtransit-movement-is-changing-urban-mobility/391565/ (accessed on 13 September 2019).
- MaRS Discovery District. Microtransit: An. Assessment of Potential to Drive Greenhouse Gas Reductions; MaRS Discovery District: Toronto, ON, USA, 2016; Available online: https://www.marsdd.com/wp-content/uploads/2016/12/Microtransit-report-2016.pdf (accessed on 23 September 2019).
- Lovins, L.H.; Cohen, B. A Future That Works. Climate Capitalism: Capitalism in the Age of Climate Change; Hill and Wang: New York, NY, USA, 2011; pp. 272–287. [Google Scholar]
- Stead, J.G.; Stead, W.E. The Coevolution of Sustainable Strategic Management in the Global Marketplace. Organ. Environ. 2013, 26, 162–183. [Google Scholar] [CrossRef]
- Rosen, P. Towards sustainable and democratic Urban transport. Technol. Anal. Strateg. Manag. 2001, 13, 117–135. [Google Scholar] [CrossRef]
- Mihyeon Jeon, C.; Amekudzi, A. Addressing sustainability in transportation systems: Definitions, indicators, and metrics. J. Infrast. Syst. 2005, 11, 31–50. [Google Scholar] [CrossRef]
- Tricker, R.C. Assessing cumulative environmental effects from major public transport projects. Transp. Policy 2007, 14, 293–305. [Google Scholar] [CrossRef]
- Da Silva, A.N.R.; Da Silva Costa, M.; Macedo, M.H. Multiple views of sustainable urban mobility: The case of Brazil. Transp. Policy 2008, 2008 15, 350–360. [Google Scholar] [CrossRef]
- Macário, R. Competing for level of service in the provision of mobility services: Concepts, processes and measures. Res. Transp. Econ. 2010, 29, 261–274. [Google Scholar] [CrossRef]
- Miranda, H. de F.; Rodrigues da Silva, A.N. Benchmarking sustainable urban mobility: The case of Curitiba, Brazil. Transp. Policy 2012, 21, 141–151. [Google Scholar] [CrossRef]
- Zheng, J.; Garrick, N.; Atkinson-Palombo, C.; McCahill, C.; Wesley, E.; Marshall, W.E. Guidelines on developing performance metrics for evaluating transportation sustainability. Res. Transp. Bus. Manag. 2013, 7, 4–13. [Google Scholar] [CrossRef]
- Onatere, J.O.; Nwagboso, C.; Georgakis, P. Performance indicators for urban transport development in Nigeria. WIT Trans. Built Environ. 2014, 138, 555–568. [Google Scholar] [CrossRef]
- Musso, A.; Corazza, M.V. The European bus system of the future: Research and innovation. Transp. Res. Procedia 2015, 5, 13–29. [Google Scholar] [CrossRef][Green Version]
- Yang, C.-H.; Lee, K.-C.; Chen, H.-C. Incorporating carbon footprint with activity-based costing constraints into sustainable public transport infrastructure project decisions. J. Clean. Prod. 2016, 133, 1154–1166. [Google Scholar] [CrossRef]
- Furberg, A.; Molander, S.; Wallbaum, H. Literature Review of Practices in Sustainability Assessment of Transport Infrastructures: Identification of Issues and Knowledge Gaps; Chalmers University of Technology: Gothenburg, Sweden, 2014. [Google Scholar]
- Rajak, S.; Parthiban, P.; Dhanalakshmi, R. Sustainable transportation systems performance evaluation using fuzzy logic. Ecol. Ind. 2016, 71, 503–513. [Google Scholar]
- Strulak-Wójcikiewicz, R.; Lemke, J. Concept of a simulation model for assessing the sustainable development of transport. Trasp. Res. Procedia 2019, 39, 502–513. [Google Scholar] [CrossRef]
- Siddaway, A. What Is a Systematic Literature Review and How Do I Do One; University of Stirling: Stirling, UK, 2014; pp. 1–13. [Google Scholar]
- Okrazewska, R.; Romanowska, A.; Wolek, M.; Oskarbski, J.; Birr, K.; Jamroz, K. Integration of a multilevel transport system model into sustainable urban mobility planning. Sustainability 2018, 10, 479. [Google Scholar] [CrossRef]
- Corazza, M.V.; Fvaretto, N. A methodology to evaluate accessibility to bus stops as a contribution to improve sustainability in urban mobility). Sustainability 2019, 11, 803. [Google Scholar] [CrossRef]
- Fernandes, P.; Vilaça, M.; Macedo, E.; Sampaio, C.; Bahmankhah, B.; Bandeira, J.M.; Guarnaccia, C.; Rafael, S.; Fernandes, A.P.; Relvas, H.; et al. Integrating road traffic externalities through a sustainability indicator. Sci. Total Environ. 2019, 691, 483–498. [Google Scholar] [CrossRef] [PubMed]
- Kaszubowski, D. A method for the evaluation of urban freight transport models as a tool for improving the delivery of sustainable urban transport policy. Sustainability 2018, 11, 1535. [Google Scholar] [CrossRef]
- Tadic, A.; Krstic, M.; Roso, V.; Brnjac, N. Planning an intermodal terminal for the sustainable transport networks. Sustainability 2019, 11, 4102. [Google Scholar] [CrossRef]
- Angkananon, K.; Wald, M.; Gilbert, L. Issues in conducting expert validation and review and user evaluation of the technology enhanced interaction framework and method. In Proceedings of the ICIW 2013: The Eighth International Conference on Internet and Web Applications and Services, (c), Rome, Italy, 23–28 June 2013; pp. 124–128. [Google Scholar]
- Peterson, D.L.; Silsbee, D.G.; Schmoldt, D.L. A case study of resources management planning with multiple objectives and projects. Environ. Manag. 1994, 18, 729. [Google Scholar] [CrossRef]
- Al-Harbi, K.M.A.-S. Application of the AHP in project management. Int. J. Proj. Manag. 2001, 19, 19–27. [Google Scholar] [CrossRef]
- Armaocost, R.L.; Componation, P.J.; Mullens, M.A.; Swart, W.W. An AHP framework for prioritizing customer requirements in QFD: An industrialized housing application. IIE Trans. 1994, 26, 72–79. [Google Scholar] [CrossRef]
- Mawapanga, M.N.; Debertin, D.L. Choosing between alternative farming systems: An application of the Analytic Hierarchy Process. Appl. Econ. Perspect. Policy 1996, 18, 385–401. [Google Scholar] [CrossRef]
- Tsamboulas, D.; Verma, A.; Moraiti, P. Transport infrastructure provision and operations: Why should governments choose private-public partnership. Res. Transp. Econ. 2013, 38, 122–127. [Google Scholar] [CrossRef]
- Singh, R.K.; Murty, H.R.; Gupta, S.K.; Diskshit, A.K. An overview of sustainability assessment methodologies. Ecol. Indic. 2009, 9, 189–212. [Google Scholar] [CrossRef]
- Singh, R.K.; Murty, H.R.; Gupta, S.K.; Diskshit, A.K. Development of composite sustainability performance index for steel industry. Ecol. Indic. 2007, 7, 565–588. [Google Scholar] [CrossRef]
- Saaty, T.L. The Analytic Hierarchy Process; McGraw-Hill: New York, NY, USA, 1980. [Google Scholar]
- Javanbarg, M.B.; Scawthorn, C.; Kiyonno, J.; Shahbodaghkhan, B. Fuzzy AHP-based multicriteria decision making systems using particle swarm optimization. Expert Syst. Appl. 2012, 39, 960–966. [Google Scholar] [CrossRef]
- Ustaoglu, E.; Williams, B.; Murphy, E. Integrating CBA and land-use development scenarios: Evaluation of planned rail investments in the Greater Dublin Area, Ireland. Case Stud. Transp. Policy 2016, 4, 104–121. [Google Scholar] [CrossRef]
- Hernandez, S.; Monzon, A.; De Oña, R. Urban transport interchanges: A methodology for evaluating perceived quality. Transp. Res. A Pol. 2016, 84, 31–43. [Google Scholar] [CrossRef]
- Machado-León, J.L.; De Oña, R.; De Oña, J. The role of involvement in regards to public transit riders’ perceptions of the service. Transp. Policy 2016, 48, 34–44. [Google Scholar] [CrossRef]
- De Oña, J.; De Oña, R.; Eboli, L.; Mzzulla, G. Index numbers for monitoring transit service quality. Transp. Res. A Pol. 2016, 84, 18–30. [Google Scholar] [CrossRef]
- Kesten, A.S.; Ögüt, K.S. A {New} {Passenger}-{Oriented} performance {Measurement} framework for public {Rail} transportation systems. Promet—Traffic—Traffico 2014, 26, 299–311. [Google Scholar] [CrossRef]
- Freitas, A.L.P. Assessing the quality of intercity road transportation of passengers: An exploratory study in Brazil. Transp. Res. A Pol. 2013, 49, 379–392. [Google Scholar] [CrossRef]
- Gilbert, R.; Myrans, K. Sustainable transportation performance indicators. Presentation at the Annual Conference of the Transportation Association of Canada, St John’s. Newfoundland, 2 September 2003; Available online: http://richardgilbert.ca/Files/2003/Sustainable Transportation Performance Inidicators (for TAC).pdf (accessed on 22 October 2019).
- Cormier, A.; Gilbert, R. Defining Sustainable Transportation. The Centre for Sustainable Transportation: Toronto, 2005. Available online: https://www.wellingtonpark.org.au/assets/wellingtonpark_CSTdefiningsustainabletransportation2005.pdf (accessed on 22 October 2019).
- Zheng, J.; Mehndiratta, S.; Guo, J.; Liu, Z. Strategic policies and demonstration program of electric vehicle in China. Transp. Policy 2012, 19, 17–25. [Google Scholar] [CrossRef]
- Frei, C.; Hyland, M.; Mahmassani, H.S. Flexing service schedules: Assessing the potential for demand-adaptive hybrid transit via a stated preference approach. Transp. Res. C Emerg. 2017, 76, 71–89. [Google Scholar] [CrossRef]
- Lin, L.-T.; Yeh, C.-F.; Chen, S.C.Y.; Huang, C.-C. Role of governance in the achievement of 20-fold increase in bus ridership—A case study of Taichung City. Transp. Res. A Pol. 2017, 98, 64–76. [Google Scholar] [CrossRef]
- Rohde, J.; Mielenz, H.; Zöllner, J.M. Precise vehicle localization in dense urban environments. In Proceedings of the 19th International IEEE Conference on Intelligent Transportation Systems, Rio de Janeiro, Brazil, 1–4 November 2016. [Google Scholar] [CrossRef]
- Lanka, S.; Jena, S.K. On-road Vehicle information processing framework for advanced traveler information systems. In Proceedings of the International Conference on Computation System and Information Technology for Sustainable Solutions (CSITSS), Bangalore, India, 6–8 October 2016; pp. 419–423. [Google Scholar]
- Shaheen, S.; Chan, N. Mobility and the Sharing Economy: Potential to Facilitate the First-and Last-Mile Public Transit Connections; Berkeley Transportation Sustainability Research Center: Berkeley, CA, USA, 2016. [Google Scholar]
- Cheyne, C.; Imran, M. Shared transport: Reducing energy demand and enhancing transport options for residents of small towns. Energ. Res. Soc. Sci. 2016, 18, 139–150. [Google Scholar] [CrossRef]
- Reynolds, J.H.; Knutson, M.G.; Newman, K.B.; Silverman, E.D.; Thompson, W.L. A road map for designing and implementing a biological monitoring program. Environ. Monit. Assess. 2016, 188. [Google Scholar] [CrossRef]
- Mulley, C.; Weisbrod, G. Workshop 8 report: The wider economic, social and environmental impacts of public transport investment. Res. Transp. Econ. 2016, 59, 397–400. [Google Scholar] [CrossRef]
- Boltze, M.; Tuan, V.A. Approaches to achieve sustainability in traffic management. Procedia Eng. 2016, 142, 205–212. [Google Scholar] [CrossRef]
- Emerson, D.; Mulley, C.; Bliemer, M.C.J. A theoretical analysis of business models for urban public transport systems, with comparative reference to a community franchise involving individual line ownership. Res. Transp. Econ. 2016, 59, 368–378. [Google Scholar] [CrossRef]
- Fuggini, C.; Manfreda, A.; Andrés, J.J.A.; Pardi, L.; Holst, R.; Bournas, D.A.; Revel, G.M.; Ciariotti, P.; Llamas, J.; Gatti, G.; et al. Towards a comprehensive asset integrity management (AIM) approach for European infrastructures. Transp. Res. Procedia 2016, 14, 4060–4069. [Google Scholar] [CrossRef][Green Version]
- Transportation Research Board. Between Private and Public Mobility: Examining the Rise of Technology-Enabled Transportation Services; TRB Special Report 319; The National Academies of Sciences, Engineering, and Medicine: Washington, DC, USA, 2016; Available online: http://www.trb.org/Main/Blurbs/173511.aspx (accessed on 22 October 2019).
- Allam, A.; Onori, S.; Marelli, S.; Taborelli, C. Battery health management system for automotive applications: A retroactivity-based aging propagation study. In Proceedings of the American Control Conference, Chicago, IL, USA, 1–3 July 2015; pp. 703–716. [Google Scholar] [CrossRef]
- Born, P.H.; Dumm, R.E.; Iii, R.J.E. Developing a framework for financial achievability of Department of Transportation Research and Development projects. Transp. Res. Rec. 2015, 2480, 11–19. [Google Scholar] [CrossRef]
- Imran, M.; Pearce, J. Auckland’s first spatial plan: Ambitious aspirations or furthering the status quo. Cities 2015, 45, 18–28. [Google Scholar] [CrossRef]
- Placido, A.; D’Acierno, L.A. Methodology for assessing the feasibility of fleet compositions with dynamic demand. Transp. Res. Procedia 2015, 10, 595–604. [Google Scholar] [CrossRef]
- Ricci, M. Bike sharing: A review of evidence on impacts and processes of implementation and operation. Res. Transp. Bus. Manag. 2015, 15, 28–38. [Google Scholar] [CrossRef]
- Jennings, G. Finding our balance: Considering the opportunities for public bicycle systems in Cape Town, South Africa. Res. Transp. Bus. Manag. 2015, 6–14. [Google Scholar] [CrossRef]
- Macharis, C.; Bernardini, A. Reviewing the use of multi-criteria decision analysis for the evaluation of transport projects: Time for a multi-actor approach. Transp. Policy 2015, 37, 177–186. [Google Scholar] [CrossRef]
- Stanley, J.; Lucas, K. Workshop 6 Report: Delivering sustainable public transport. Res. Transp. Econ. 2014, 48, 315–322. [Google Scholar] [CrossRef]
- Georgiadis, G.; Politis, I.; Papaioannou, P. Measuring and improving the efficiency and effectiveness of bus public transport systems. Res. Transp. Econ. 2014, 48, 84–91. [Google Scholar] [CrossRef]
- Isabello, A.; Pensa, S.; Arnone, M.; Rosa, A. Reviewing efficiency and effectiveness of interurban public transport services: A practical experience. Transp. Res. Procedia 2014, 1, 243–252. [Google Scholar] [CrossRef]
- Liou, J.J.H.; Hsu, C.-C.; Chen, Y.-S. Improving transportation service quality based on information fusion. Transp. Res. A Pol. 2014, 67, 225–239. [Google Scholar] [CrossRef]
- Ozbay, K.; Bartin, B.; Mudigonda, S.; Iyer, S. Assist-Me: Postprocessing tool for transportation planning model output. Transp. Res. Rec. 2013, 2399, 63–73. [Google Scholar] [CrossRef]
- López-Lambas, M.E.L.; Corazza, M.V.; Monzon, A.; Musso, A. Rebalancing urban mobility: A tale of four cities. Urban. Des. Plan. 2013, 166, 274–287. [Google Scholar] [CrossRef]
- Şimşek, B.; Pakdil, F.; dengiz, B.; Testik, M.C. Driver performance appraisal using GPS terminal measurements: A conceptual framework. Transp. Res. C Emer. 2013, 26, 49–60. [Google Scholar] [CrossRef]
- Stanley, J.; Smith, A. Workshop 3A: Governance, contracting, ownership and competition issues in public transport: Looking up not down. Res. Transp. Econ. 2013, 39, 167–174. [Google Scholar] [CrossRef]
- Zhao, J.; Frumin, M.; Zhao, Z.; Wilson, N.H.M. Unified estimator for excess journey time under heterogeneous passenger incidence behavior using smartcard data. Transp. Res. C Emer. 2013, 34, 70–88. [Google Scholar] [CrossRef]
- Medda, F. Land value capture finance for transport accessibility: A review. J. Transp. Geogr. 2012, 25, 154–161. [Google Scholar] [CrossRef]
- Politis, I.; Papaioannou, P.; Basbas, S. Integrated choice and latent variable models for evaluating flexible transport mode choice. Res. Transp. Bus. Manag. 2012, 3, 24–38. [Google Scholar] [CrossRef]
- Lindholm, M.; Behrends, S. Challenges in urban freight transport planning—A review in the Baltic Sea Region. J. Transp. Geogr. 2012, 22, 129–136. [Google Scholar] [CrossRef]
- Diana, M. Measuring the satisfaction of multimodal travelers for local transit services in different urban contexts. Transp. Res. A Pol. 2012, 46, 1–11. [Google Scholar] [CrossRef]
- Yi-Zhong, F. Performance Measurement of the U.S.’s Service Management and It’s Enlightment to China: Examples from the Transportation Service Subsidy of the United States. 2011. Available online: https://www.researchgate.net/publication/252009089_Performance_measurement_of_the_US’s_service_management_and_its_enlightment_to_China_Examples_from_the_transportation_service_subsidy_of_the_United_States/stats (accessed on 13 September 2019). [CrossRef]
- Moreland, K.; Bartman, K.; Ogle, J.; Chowdhury, M.; Dunning, A. Transit-system evaluation process: From planning to realization. ITE J. 2011, 81, 33–39. [Google Scholar]
- Skordylis, A.; Trigoni, N. Efficient data propagation in traffic-monitoring vehicular networks. IEEE T. Intell. Transp. Sys. 2011, 12, 680–694. [Google Scholar] [CrossRef]
- Eisele, W.L.; Schrank, D.L. Conceptual framework and trucking application for estimating impact of congestion on freight. Transp. Res. Rec. 2010, 2168, 94–103. [Google Scholar] [CrossRef]
- Santos, G.; Behrendt, H.; Teytelboym, A. Part II: Policy instruments for sustainable road transport. Res. Transp. Econ. 2010, 28, 46–91. [Google Scholar] [CrossRef]
- Stanley, J.; Longva, F. Workshop report—A successful contractual setting. Res. Transp. Econ. 2010, 29, 80–88. [Google Scholar] [CrossRef]
- Muñoz, J.C.; de Grange, L. On the development of public transit in large cities. Res. Transp. Econ. 2010, 29, 379–386. [Google Scholar] [CrossRef]
- Borzacchiello, M.T.; Torrieri, V.; Nijkamp, P. An operational information systems architecture for assessing sustainable transportation planning: Principles and design. Eval. Program. Plan. 2009, 32, 381–389. [Google Scholar] [CrossRef]
- Gudmundsson, H.; Ericsson, E.; Hugosson, M.B.; Rosqvist, L.S. Framing the role of decision support in the case of Stockholm congestion charging trial. Transp. Res. A Pol. 2009, 43, 258–268. [Google Scholar] [CrossRef]
- Barceló, J.; Grzybowska, H.; Pardo, S. Vehicle Routing and Scheduling Models, Simulation and City Logistics. TSS—Transport Simulation Systems. Aimsun NG: Barcelona, Spain. Available online: http://www.aimsun.com/site/content/category/2/20/35/ (accessed on 23 September 2019).
- Van Geldermalsen, T.; O’Fallon, C.; Wallis, I.; Melsom, I. Travel Behaviour change evaluation procedures and guidelines. Road Transp. Res. J. Aust. N. Z. Res. Pract. 2006, 15, 35. [Google Scholar]
- Costa, M.S.; Silva, A.N.R.; Ramos, R.A.R. Sustainable urban mobility: A comparative study and the basis for a management system in Brazil and Portugal. WIT Trans. Built Environ. 2005, 77. [Google Scholar]
- Loo, B.P.Y.; Hung, W.T.; Hong, K.L.; Wong, S.C. Road safety strategies: A comparative framework and case studies. Transp. Rev. 2005, 25, 613–639. [Google Scholar] [CrossRef]
- Hull, A. Integrated transport planning in the UK: From concept to reality. J. Transp. Geogr. 2005, 13, 318–328. [Google Scholar] [CrossRef]
- Proost, S.; Van Dender, K.; Courcelle, C.; Peirson, J.; Sharp, D. How large is the gap between present and efficient transport prices in Europe. Transp. Policy 2002, 9, 41–57. [Google Scholar] [CrossRef]
- Turner, D.; Dix, M.; Gardner, K.; Beevers, S. Setting traffic reduction targets for London. Traffic Eng. Control. 1999, 40, 186–194. [Google Scholar]
- Pake, B.E.; Demetsky, M.J.; Hoel, L.A. Evluation of bus maintenance operations. Transp. Res. Rec. 1985, 1019, 77–84. [Google Scholar]


© 2019 by the authors. Licensee MDPI, Basel, Switzerland. This article is an open access article distributed under the terms and conditions of the Creative Commons Attribution (CC BY) license (http://creativecommons.org/licenses/by/4.0/).