Article

Spatio-Temporal Variability and the Factors Influencing Soil-Available Heavy Metal Micronutrients in Different Agricultural Sub-Catchments

1
Key Laboratory of Agricultural Land Quality, Ministry of Natural Resources, Key Laboratory of Arable Land Conservation (North China), Ministry of Agriculture and Rural Affairs, College of Land Science and Technology, China Agricultural University, Beijing 100193, China
2
College of Earth and Environmental Sciences, Anhui University of Science and Technology, Huainan 232001, China
*
Author to whom correspondence should be addressed.
Sustainability 2019, 11(21), 5912; https://doi.org/10.3390/su11215912
Submission received: 25 September 2019 / Revised: 20 October 2019 / Accepted: 22 October 2019 / Published: 24 October 2019

Abstract

:
Information on the spatial variability of soil-available micronutrients is important for farming and soil management practices. As current knowledge of factors influencing soil available micro-nutrients in the long-term scales is limited, we analyzed 821 and 812 representative surface (0–20 cm) soil samples from five sub-catchments in the Ping Gu intermontane basin in Beijing, China in 2007 and 2017. The objectives of this study were to assess the temporal and spatial distribution characteristics of soil-available micronutrients (Cu, Zn, Fe and Mn) and their relationships with soil’s chemical properties. The concentration of available Cu ranged from 1–2 mg∙kg−1 distributing over a large area in 2007, but it was more than 2 mg∙kg−1 in the hilly regions in 2017. The concentration of available Zn (>5 mg∙kg−1) increased significantly from 2007 to 2017, and showed an uneven distribution. The distribution of available Fe and Mn decreased from the northeast to the southwest region of the study area between 2007 and 2017, this being consistent with the topography in this area. Soil’s available P (AP) had a higher contribution to available Cu and Zn in different sub-catchments. In addition, soil pH had a significant negative influence on available Fe in sub-catchments 1, 2 and 3, and on available Mn in all sub-catchments, except for sub-catchment 4. Moreover, the effects of soil chemical properties on soil-available micronutrients increased in each sub-catchment from 2007 to 2017. We conclude that differences in soil properties and land-use types were the main reasons for the spatial variability of soil-available micronutrients in the Ping Gu intermontane basin.

1. Introduction

Soil micronutrients play an important role in plants growth; when plant lacks any micronutrients, its growth and development are inhibited, resulting in reduced yield and quality. Information on the spatial distribution of soil micronutrients and their influencing factors are very important for soil management and sustainable agricultural production [1]. Agricultural practices in developing countries like China and India, still consist of small land holdings and intensive cropping [2,3]. It is necessary to understand the spatial variability of soil micronutrients in agricultural areas and improve management practices. Geostatistical tools provide effective methods to characterize the spatial variability of soil micronutrients, methods which are conducive to predicting concentrations at un-sampled locations by taking into account the spatial correlation among different points [4]. These methods have enabled recent significant advances on the spatial distribution of soil-available micronutrients (Cu, Zn, Fe and Mn) at different scales. Geographic information systems have been used to characterize the spatial variability of soil-available micronutrients at the field scale [5]; Zhu et al. (2016) described the spatial distribution of available micronutrients across a watershed on the Chinese Loess Plateau, which indicated that the relationship of soil-available micronutrients and influence factors were scale and location-dependent [6]. Arvind et al. (2016) mapped the spatial distribution of soil micronutrients based on ordinary kriging, and suggested different management practices were needed in the Shiwalik Himalayan region of India [7]. However, studies on the spatial variability of soil-available micronutrients mainly focus on short-term time scales; few investigations have studied the variation of available micronutrients over long time periods.
Although factors influencing the spatial variability of soil-available micronutrients, such as soil parent material, topography, climate and vegetation, are widely recognized, the concentration of micronutrients in the soil is rarely indicative of plant availability, these being influenced by soil organic matter, pH, adsorptive surfaces and other physical, chemical and biological factors [8,9,10]. Establishing the relationship between soil available micronutrient concentrations and soil chemical properties is, therefore, important for different planting conditions. A previous study in northern Ethiopia reported that the distribution of soil-available micronutrients varied in space and time across management units, and their variability is presumed to be high due to the existence of small farms and different management practices [11]. Zhang et al. (2015) noted that the long-term input of organic amendments could alter soil nutrients and increase the concentrations of plant-available micronutrients [12]. In addition, different degrees of correlation exist between environmental factors and soil-available micronutrients in arable land, indicating that different management practices should be undertaken to maintain suitable levels of soil-available micronutrients [13]. In order to determine relationships between soil-available micronutrients and their influencing factors, classical statistical methods of correlation or simple liner regression analysis have been applied [14]. However, these methods only considered the variables, ignoring differences in the contribution of influencing factors on available micronutrients across management units.
The Pinggu intermontane basin, a typical drainage basin, is an independent groundwater system. Due to limited water resources and topographical factors, agricultural activities in this area are mainly undertaken on the mountain valleys and in the plain areas. The basin differences in the original geological substrate and subsequent geochemical and pedogenic regimes in different sub-catchments exist. Additionally, long-term tillage and agricultural management has affected the distribution of soil-available micronutrients in this area. The objectives of this study, therefore, are: (1) to explore the spatial variability of soil-available micronutrients (Cu, Zn, Fe and Mn) in the basin, and (2) to assess the relationship of micronutrient availability with soil properties in different sub-catchments based on a multiple stepwise regression method at different times. Our results will have implications for soil micronutrient management and agricultural restructuring in the study area.

2. Materials and Methods

2.1. Study Area

This study was conducted in the Pinggu intermontane basin with latitude between 40°01′ and 40°22′ N and longitude between 116°55′ and 117°24′ E, covering an area of 1075 km2, Beijing, China. It is surrounded by mountains to the north, the east and the southeast (Figure 1). The elevation range in the study area is from 13.06 m in the southwest to 1229.66 m in the northeast. The region has a warm, temperate, semi-humid continental monsoon climate with annual rainfall of 629.4 mm and an annual temperature ranging from 26.1 °C to −5.4 °C. The Ju River originates in Hebei Province and runs across the study area from the northeast to the southwest. The largest tributary of the Ju River and some intermittent streams from the northeast mountains connect to the Ju River during the summer monsoon season. For the purposes of this study, we split the catchment area into five sub-catchments corresponding to the main river: (1) Ru River sub-catchment (38,375.95 ha); (2) Huang songyu sub-catchment (22,383.50 ha); (3) Yu zishan River sub-catchment (9558.52 ha); (4) Ju River sub-catchment (9116.59 ha); and (5) Jinji River sub-catchment (11,863.84 ha) (Table 1). The study area has a total agricultural land area of 71,293 ha, dominated by orchards in the five sub-catchments in both 2007 and 2017. Other land-use types include crop land and vegetable land which are mainly distributed in the Ju River sub-catchment (4) and the Jinji River sub-catchment (5).

2.2. Date Collection

2.2.1. Soil Sampling and Measurement

Sampling was undertaken in the research sub-catchments using a systematic grid (400 × 400 m) design incorporating ArcGIS 10.3 (ESRI, Inc., Redlands, CA, USA). A total of 821 and 812 surface soil samples (0–20 cm) were collected from the study areas during April in 2007 and 2017, respectively (Table 1). All samples were collected before the application of fertilizer or organic manure. From each site, 3–4 subsamples were collected to make a composite sample; sampling locations were recorded using a hand-held GPS. All samples were air-dried at room temperature and ground before being passed through a 2 mm sieve. Soil samples were then stored in closed zip-lock plastic bags for analysis.
Available iron (Fe), manganese (Mn), copper (Cu) and zinc (Zn) were extracted using diethylene triamine pentaacetic acid (DTPA), and their concentrations were measured by atomic absorption spectrometry (AAS) [15]. Soil pH was determined using a pH electrode at a soil: water ratio of 1:2.5. Soil organic matter (SOM) was analyzed using the Walkley-Black method [16], and total nitrogen (TN) was measured using the Kjeldahl method. Available P (AP) was determined per the method of Olsen et al. (1954) [17] and available K (AK) was determined using the neutral ammonium acetate method [18]. All methods used for analyzing the soil samples followed standard procedures.

2.2.2. Spatial Data Extraction

A digital elevation model (DEM) with a 25 m resolution of the study area, downloaded from the Geospatial Data Cloud website (http://www.gscloud.cn/), was used to extract topographic indices, including elevation, slope gradient and river network based on ArcGIS 10.3. Land-use types for 2015 were inferred from a 1:50,000 land utilization map produced by the Land Resource Investigation Bureau of Beijing.

2.3. Data Analysis and Assessment

2.3.1. Descriptive Statistical Analysis

The statistical parameters like minimum, maximum, mean, coefficient of variation (CV) and skewness were obtained. The Pearson correlation coefficients were used to evaluate the correlations between available micronutrients and soil properties, and the multiple liner regression analysis was applied to estimate the influence of soil properties on micronutrient availability. The normal frequency distribution of data was verified by the Kolmogorov-Smirnov (K-S) test. These statistical parameters were calculated with EXCEL 2016 and SPSS 21.0 (SPSS Inc., Chicago, IL, USA).

2.3.2. Geostatistical Analysis

All data were tested for normal distribution, and the semi-variogram analyses were carried out before the application of the ordinary kriging interpolation. The semi-variogram model determined the interpolation function using the following equation [19]:
γ ( h ) = i = 1 n ( h ) [ Z ( x i ) Z ( x i + h ) ] 2 / 2 n ( h )
where γ(h) is the semi-variogram value at a distance interval h; n(h) is the number of data pairs within the distance interval h; and Z(xi) and Z(xi + h) are soil available micronutrient concentrations at two points separated by the distance of h. A number of models are available to suitably fit the experimental semi-variogram. For our study we used the exponential, Gaussian and spherical models [20]:
γ ( h ) = C 0 + C 1 [ 1 exp ( h / a ) ] ;
γ ( h ) = C 0 + C 1 [ 1 exp ( h 2 / a 2 ) ] ;
γ ( h ) = C 0 + C 1 [ 1 . 5 h / a 0 . 5 h 3 / a 3 ] ,
where C0 is the nugget; C1 is the partial sill; and a is the range of spatial dependence to reach the sill (C0 + C1). Prediction accuracy of the semi-variogram models was evaluated using the root mean square error (RMSE):
RMSE = i = 1 n [ Z ( x i , y i ) Z ( x i , y i ) ] 2 / n ,
where n is the number of sampling points; Z(xi, yi) is the observed soil parameter; Z(xi, yi) is estimated based on the samples from the surrounding locations; and (xi,yi) are the sampling coordinates.

2.3.3. Assessment of Soil-Available Microelements

The evaluation of soil-available micronutrients was based on the combination of a single validity index (Ei) and a synthetic index (Ec). The validity index of various micronutrients was initially calculated before the synthetic validity index was calculated using the mean root method:
E i = C i / S i ;
E c = i n E i 2 m ,
where Ci is the measured value of soil-available micronutrients (mg·kg−1); Si is the critical value of soil-available micronutrients according to the standardized proposed by the Chinese Academy of Sciences [21] (Table 2); and m is available micronutrient species.

3. Results

3.1. Soil-Available Micronutrients

The results showed that the range of available micronutrients was increased in 2017 compared to 2007; similarly, the average concentrations of four available micronutrients in 2017 recorded significant increases. Moreover, results from 2007 showed Fe and Cu concentrations to have very high levels, whilst Zn attained a high level and Mn was at medium level. The CV value was used to identify low (<10%), medium (10–100%) and high (>100%) variabilities of the soil-available micronutrients [22]. The concentrations of Cu, Zn, Fe and Mn had medium variability in 2007; however, Zn was recorded a very high CV value in 2017. It showed that the concentrations of soil-available micronutrients passed the K-S normality test at a significance level of 0.05 after logarithmic transformation (Table 3).

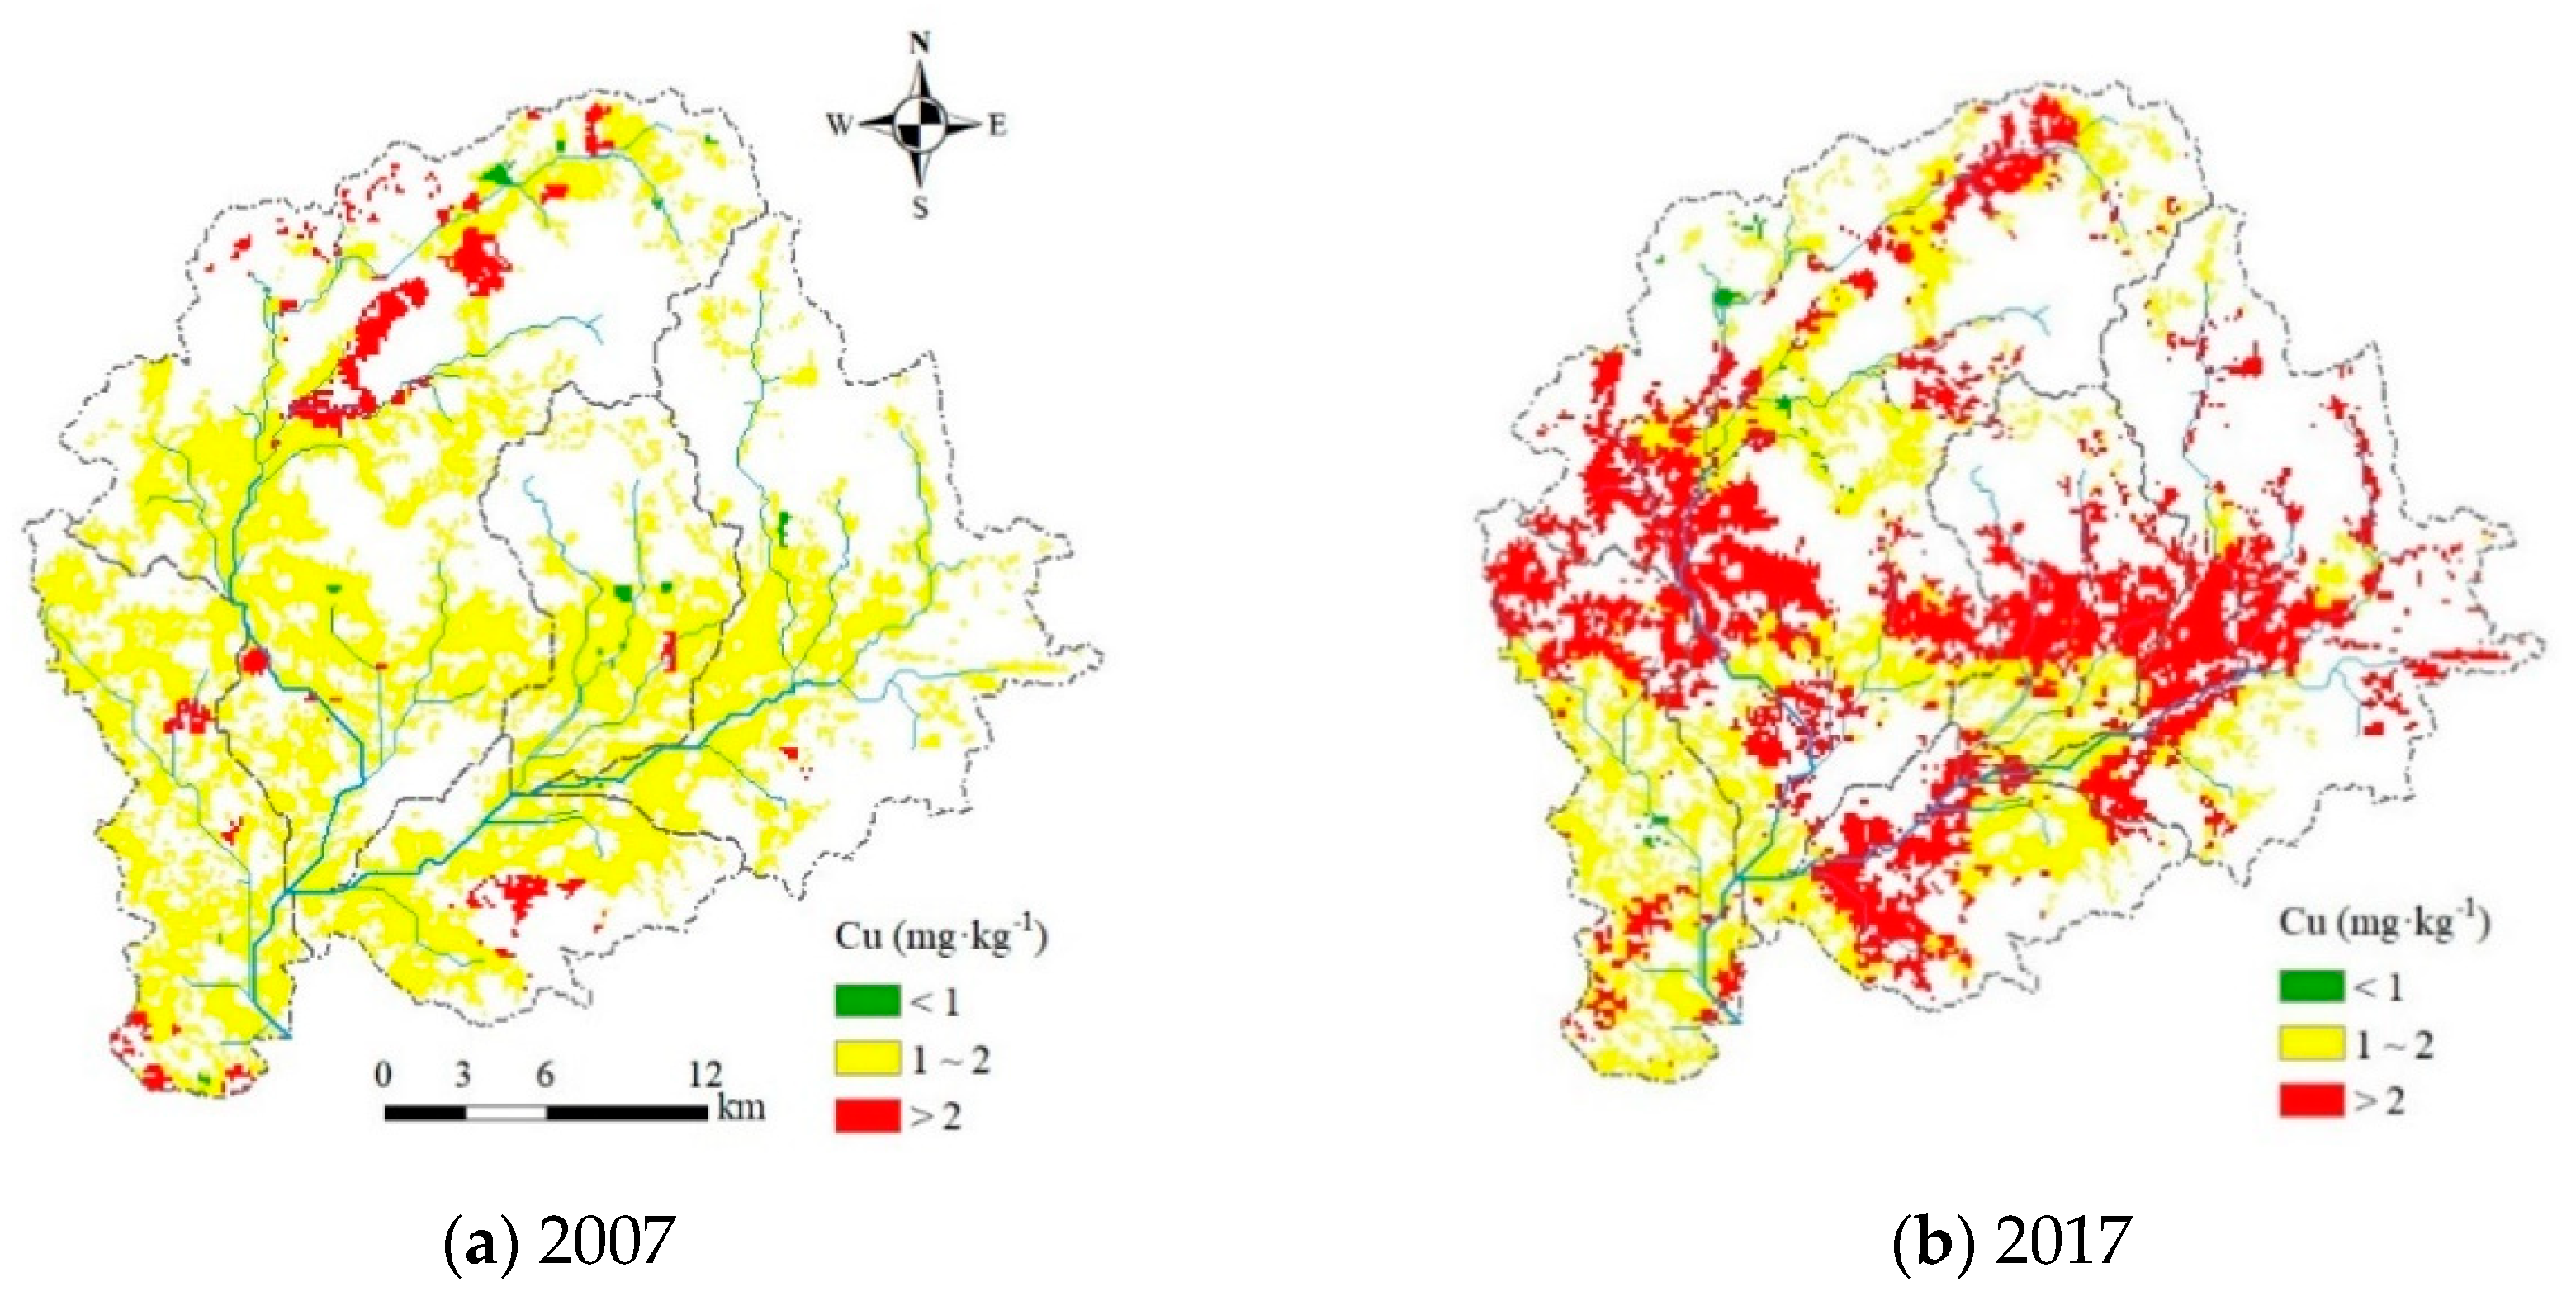
3.2. Spatial Distribution of Soil-Available Micronutrients

The semi-variogram parameters of the four available soil micronutrients in the study area are shown in Table 4. The best-fitted model was selected for spatial variability of available micronutrients, which had a low RMSE value. The nugget/sill ratio values were 79.90%, 63.25%, 8.11% and 32.08% for Fe, Mn, Cu and Zn in 2007, respectively. The semi-variogram range of soil-available micronutrients was Mn > Fe > Cu > Zn in 2007 and Mn > Zn > Cu > Fe in 2017. In addition, the ranges of concentrations of available Zn and Mn were increased, while the ranges of concentrations of available Cu and Fe were increased in 2017 compared the results to 2007; that is mainly caused by the changes in land-use types and agricultural management measures over a longer time scale [6].
The spatial distribution maps of the soil-available micronutrients (Cu, Zn, Fe and Mn) for 2007 and 2017 were generated using the ordinary kriging method (Figure 2). Available Cu, in the concentration range of 1–2 mg∙kg−1, had a wide distribution across the study area in 2007. Areas with the highest concentrations predominantly were the hilly region in the northwestern area of the draniage basin. By 2017, however, concentrations of available Cu had reached very high levels (>2 mg∙kg−1) in the hilly regions to the southeast and the northwest of the area. The main reason for the increase in available Cu may be due to the transformation of land-use types in this area. High concentrations of available Zn (>5 mg∙kg−1) recorded an uneven distrubution at the edge of river alluvial deposits in 2007 and 2017; however, the concentration of available Zn in 2017 had increased in the most of the study areas compared with 2007. The distribution of available Fe generally decreased from the northeast to the southwest, this being consistent with topographic trends in 2007 and 2017, and areas with very high concentrations (>20 mg∙kg−1) increased along the rivers by 2017. The spatial distribution of available Mn was similar to the distirbution of available Fe in 2007 and 2017. In 2017, high Mn concentrations (>20 mg∙kg−1) were found to have a circular distribution around the mountains.

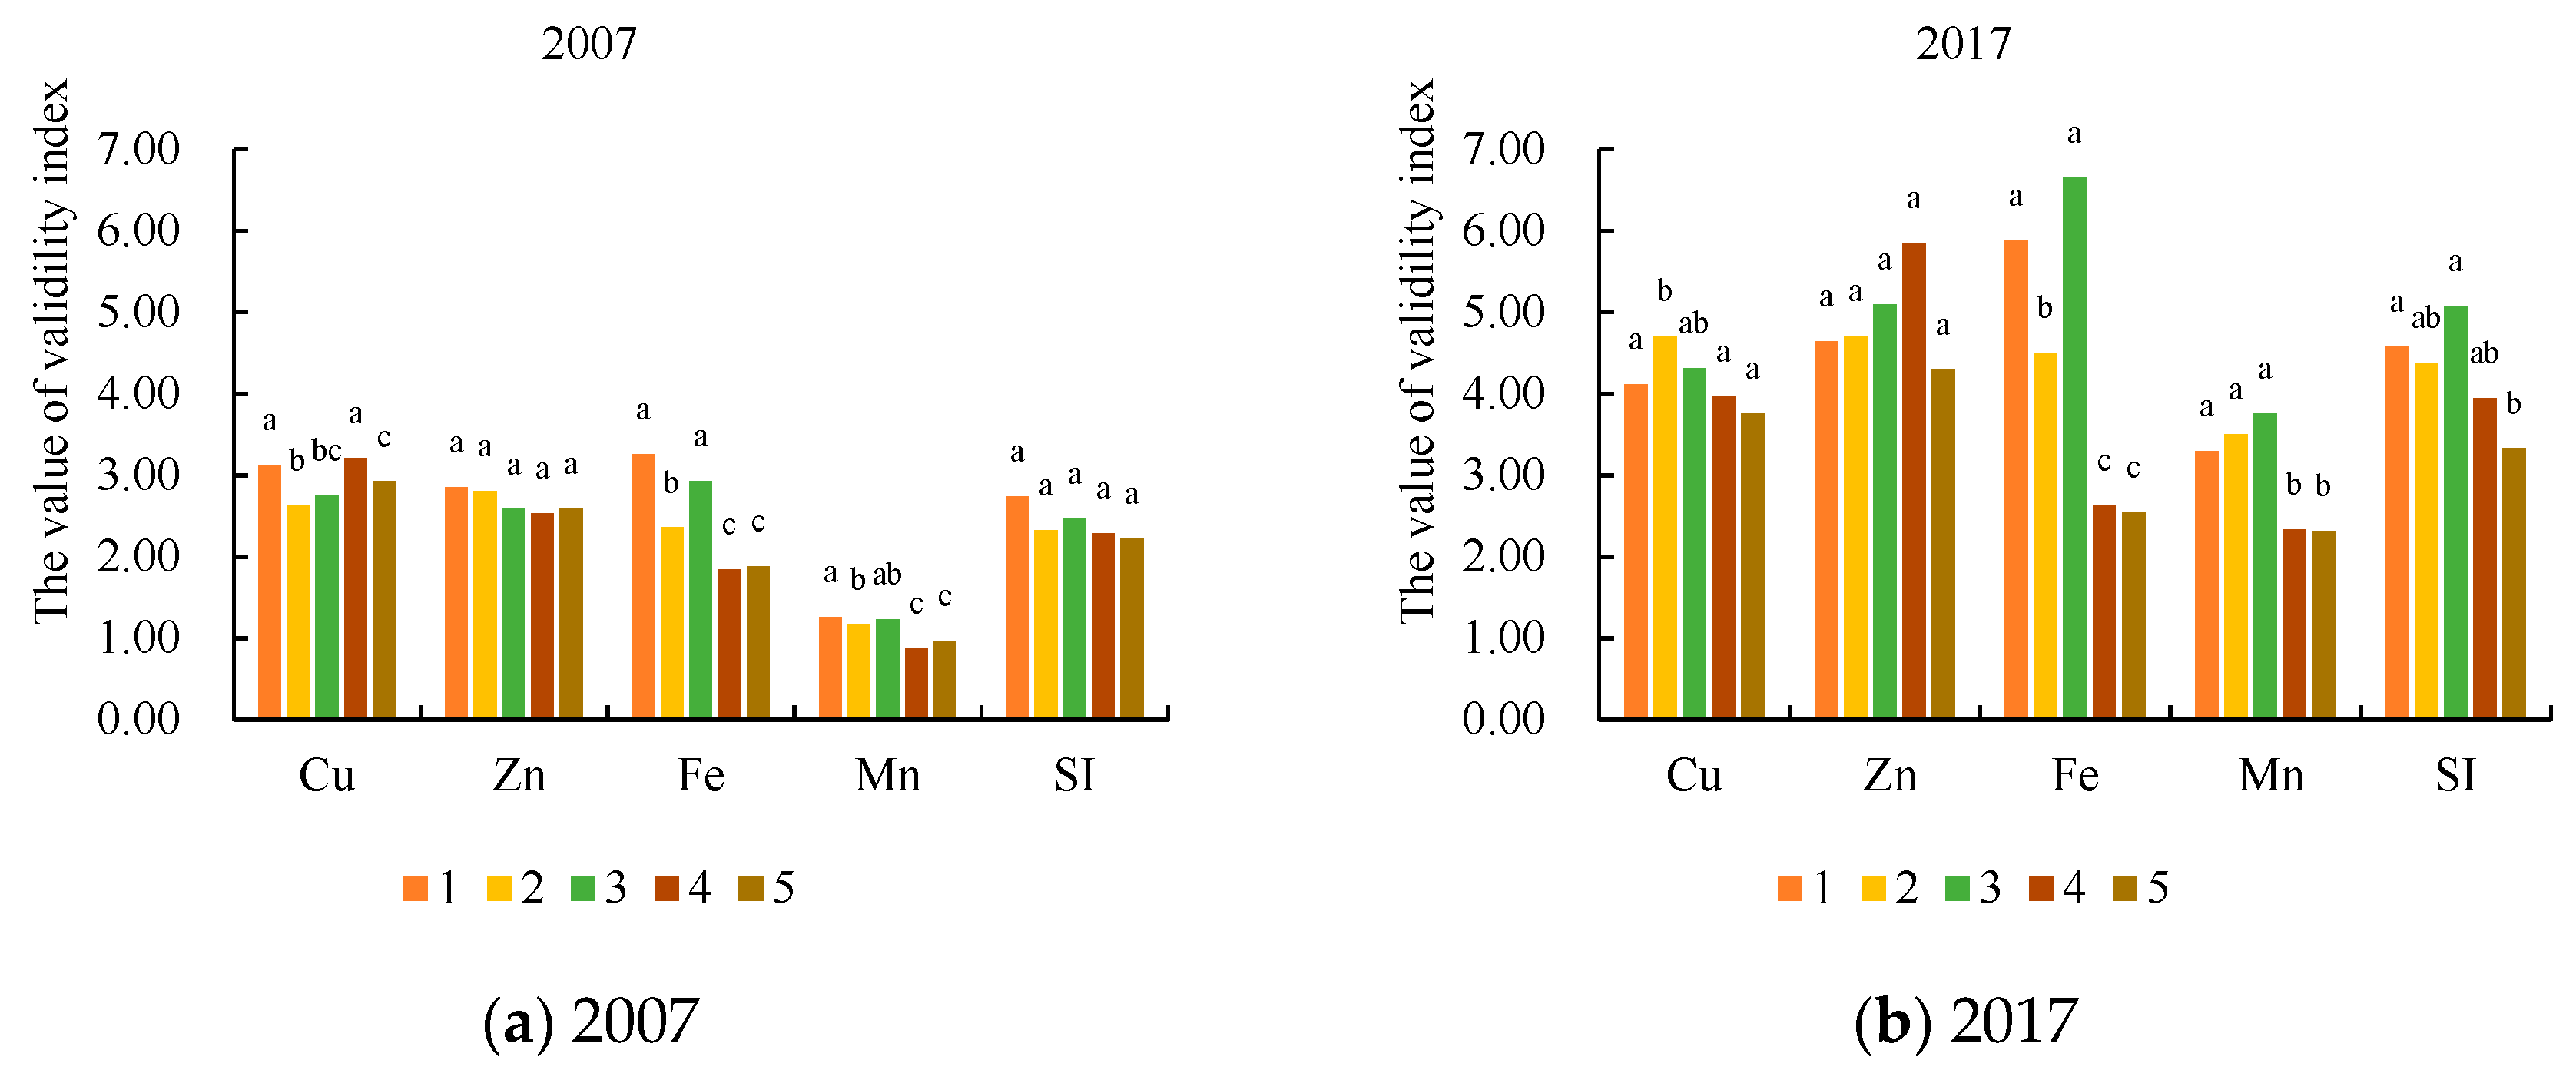
3.3. Assessment of Soil-Available Micronutrients in the Different Sub-Catchments

In order to explore the variation of soil-available micronutrients in the different sub-catchments, the indexes of available Cu, Zn, Fe and Mn were calculated for 2007 and 2017 (Figure 3). The single and synthetic index of available Cu, Zn, Fe and Mn in 2017 increased in different degrees in the five sub-catchments compared with 2007. The single index of available Cu in sub-catchment 2 was lower than that in the other sub-catchments in 2007. However, its maximum value (4.71) was recorded in sub-catchment 2 in 2017, and it had a significant difference compared with that in sub-catchments 1, 4 and 5. The highest single index of available Zn was recorded in sub-catchment 1 in 2007 and in sub-catchment 4 in 2017; no significant differences for Zn in all of the sub-catchments in 2007 and 2017 were recorded. The indexes of available Fe in sub-catchments 1 and 3 were significantly greater than those in sub-catchments 2, 4 and 5 in 2007. In 2017, the index of available Fe reached its maximum value (6.65) in sub-catchment 3, having significant differences with sub-catchments 2, 4 and 5. The index of available Mn was the lowest in all sub-catchments compared with other soil-available micronutrients in 2007 and 2017. The indexes of available Mn in sub-catchments 1–3 were significantly greater than those of sub-catchments 4 and 5 in 2017. Finally, the synthetic index of available micronutrients was the lowest in sub-catchment 5 in 2007 and 2017. The synthetic indexes’ results for Cu, Zn, Fe and Mn in all sub-catchments in 2007 showed no significant differences; however, significant differences existed between sub-catchments 1 and 3, and sub-catchment 5 in 2017.

3.4. Influencing Factors

3.4.1. The Soils’ Chemical Properties

The highest mean values of SOM for sub-catchment 2 were 16.62 g∙kg−1 in 2007 and 22.72 g∙kg−1 in 2017 (Table 5). The lowest belonged to sub-catchment 5, at 12.25 g∙kg−1 in 2007 and 15.57 g∙kg−1 in 2017. The highest mean values of TN were all observed in sub-catchment 1, which were 0.45 g∙kg−1 in 2007 and 1.39 g∙kg−1 in 2017. The lowest mean values of AP belonged to sub-catchment 2, which were 23.72 mg∙kg−1 in 2007 and 88.39 mg∙kg−1 in 2017. The largest mean value of AK belonged to sub-catchment 1 was 165.64 mg∙kg−1 in 2007, and it was 182.79 mg∙kg−1 for sub-catchment 4 in 2017. The highest mean values of pH belonged to sub-catchment 4 were 8.15 in 2007 and 7.85 in 2017. In addition, compared with the 2007, the mean values of SOM, TN, AP and AK for five sub-catchments increased in 2017; however, the mean values of pH decreased.

3.4.2. Correlation Analysis

Correlation coefficient results between micronutrients and soil properties, including soil SOM, TN, AP, AK and pH (Table 6) indicated that available micronutrients, except available Cu in 2007, were positively and significantly correlated with SOM and TN. Although Cu, Zn and Fe had significant correlations with AP (p < 0.01), no significant correlations between available Mn and AP in 2007 and 2017 were recorded. Cu, Zn, Fe and Mn recorded positive and significant correlations with AK in 2007 and 2017; however, they had a significant negative correlation with soil pH. In addition, correlation coefficients of the available micronutrients with SOM, TN, AP and AK increased from 2007 to 2017.

3.4.3. Influencing Factors’ Analyses

Stepwise regression analysis was used to quantify the influence of soil properties on the spatial variability of soil-available micronutrients in the different sub-catchments (Figure 4). The total contribution of SOM and AK can explain 16.2% of the spatial variability of available Cu in sub-catchment 2 in 2007. In 2017, the contribution of AP was higher than that of other factors among the sub-catchments, explaining 32.50% of the spatial variability of available Cu in sub-catchment 3. The spatial variability of available Zn was greatly affected by AP in each sub-catchment in 2007 and 2017, accounting for 25.00%, 50.60%, 48.40%, 63.20% and 63.70% of the spatial variability of available Zn in sub-catchments 1–5 in 2017, respectively. In addition, 64.80% of the spatial variability of available Zn could be explained by AP, AK, SOM and pH in sub-catchment 2 in 2017, indicating that the spatial variability of available Zn in this catchment was the result of multitude factors. Soil pH has a negative effect on available Fe, and the influence of soil pH was greater in sub-catchments 1–3 in 2007 and 2017, accounting for 71.40% of the spatial variability of available Fe in sub-catchment 3 in 2017. This result indicated soil pH to be the main factor causing spatial variability of available Fe in sub-catchments 1–3. Additionally, soil AP can explain 13.70%, 23.30% and 47.40% of the spatial variability of available Fe in sub-catchments 3–5 in 2017, respectively. These differences were mainly due to different soil management practices between the catchments. Apart from sub-catchment 4, soil pH significantly influenced spatial variability of available Mn in the sub-catchments in 2007. In 2017, soil pH accounted for 55.80% of the spatial variability of available Mn in sub-catchment 4, a change that was mainly caused by soil acidification in this sub-catchment.

4. Discussion

4.1. Spatial Variability of Available Micronutrients

The spatial variation of soil-available micronutrients was influenced by structural and random factors in the study area. These results are in accordance with those of Zhang et al. (2013) who reported that random factors, such as tillage, fertilizer application and irrigation, affected the spatial variation of soil-available micronutrients [23]. Moreover, long-term soil management practices and anthropic activities might change the distribution of the Cu; the very high level of available Cu was centralized in the north in 2007 and expanded to the southern hilly regions in 2017. That result was accordance with Arvind et al. (2017) who reported that the effects of random factors on available micronutrients have been gradually increasing [7]. The spatial distribution of very high levels (>5 mg·kg−1) of available Zn was also uneven in both 2007 and 2017; that is in line with the result of Opfergelt et al. (2017), who found that the distribution of micronutrients was affected by soil matrix, geomorphology and special fertilization measures [24]. In addition, the expansions of areas with high-levels of soil micronutrients were mainly caused by increases in fertilizer input and land-use changes [25]. The distributions of available Fe and Mn recorded a gradual increase from the southeast to the northwest in the study area in 2007 and 2017; these changes, being similar to the landscape distribution, were mainly affected by topography and soil type. Similar spatial variations of Fe and Mn were also reported in soils in Iran by Ayoub et al. (2014) [26].

4.2. Changes in Soil-Available Micronutrient Concentrations from 2007 to 2017

In our study, the concentration of soil micronutrients (Cu, Zn, Fe and Mn) reached high or very high levels from 2007 to 2017. However, a previous study by Reza et al. (2017) indicated that deficient levels of soil-available micronutrients were observed in agricultural areas, findings which are inconsistent with those in our study [27]. These differences may be due to the variations in soil background values, soil texture and agricultural management practices [28]. In addition, although available micronutrients are essential nutrients for plants, the concentration of available micronutrients, which was far higher than the critical value, may result in potential environmental risk to the soil [29]. Therefore, the negative effects of extremely high concentrations of soil-available micronutrients on crop growth will need to be explored in the future. Our results also showed that the single and synthetic indices of soil-available micronutrients in sub-catchments 1–3 were higher than those in sub-catchments 4 and 5. This finding was mainly due to orchard land-use being dominant in sub-catchments 1–3. The concentration of soil-available micronutrients increased in these catchments due to excessive long-term application of organic and inorganic fertilizers under smallholder production. Similarly, these findings were in accordance with those reported by Kuppusamy et al. (2018) from a rice paddy in South Korea [30].

4.3. The Relationship between Soil-Available Micronutrients and Soil Properties

As the availability of micronutrients can be affected by many factors, we examined the relationship of available micronutrients and soil properties using correlation analysis (Table 5). SOM had a positive (p < 0.01) influence on available micronutrients in 2017, a result that was in accordance with results by Verma et al. (2015) [31]. The application of manure enhances microbial activities which accelerate the release of available micronutrients in the soil. TN had a significant and positive (p < 0.01) correlation with available micronutrients in 2017. However, previous studies have shown that the concentration of soil available Cu and Zn significantly decreased with the addition of nitrogen. Differences in these findings may be attributed to different land-use, soil management and fertilizer types [32]. A significant and positive (p < 0.01) relationship between soil AK and available Cu, Zn and Fe in both 2007 and 2017 were found, results which are similar to those reported by Likar et al. (2007) in Henan province, China [33]. Additionally, soil pH had a negative and significant (p < 0.01) correlation with available micronutrients in our study in 2007 and 2017, a finding that is in accordance with that of Wei et al. (2004), who reported that low soil pH could improve the availability of micronutrients by releasing adsorbed metals from the soil surface [34].
Stepwise regression analysis of SOM, TN, AP and AK with soil-available micronutrients was undertaken for the five sub-catchments in 2007 and 2017; the variations of influencing factors is shown in Figure 4. Our results indicated that the effects of SOM on available Cu in sub-catchment 4 were 13.00% and 8.50% in 2007 and 2017, respectively. Land-use types indicated that this catchment had an area of more than 20% being used for vegetable crops; thus, the application of poultry litter for these crops as a fertilizer may account for the high levels of Cu [35]. AP had a higher contribution to the concentration of available Zn in different sub-catchments in 2007 and 2017. Wang et al. (2016) noted that the application of phosphate fertilizer containing zinc may increase available Zn in soils [36]. Additionally, the contribution of soil pH to available Fe and Mn in 2017 was higher than in 2007, a change which may be associated with the excessive application of fertilizers over a long time-period, which would result in soil acidification in each sub-catchment [37]. Moreover, the differences in the contribution of soil SOM, pH, AK and AP among sub-catchments were mainly due to small farming practices and soil management techniques.

5. Conclusions

The concentrations of available Cu and Zn at very high levels had an uneven distribution in both 2007 and 2017. However, the distribution of soil available Fe and Mn generally decreased from the northeast to the southwest in 2007 and 2017, a result which is consistent with the topographical changes in the study area. The spatial variability of soil-available micronutrients was mainly influenced by random factors, such as land-use type, field management and fertilizer application, and it has been gradually strengthening from 2007 to 2017. The single and synthetic indices of available Cu, Zn, Fe and Mn in 2017 showed a significant increasing trend compared with those in 2007 in the different sub-catchments. Moreover, the availability of soil micronutrients in sub-catchments 1–3 was higher than those in sub-catchments 4 and 5.
Our results showed the mean values of SOM, TN, AP and AK for five sub-catchments increased in 2017 compared with 2007; however, the mean values of pH decreased. SOM is not the main factor causing the spatial variability of available micronutrients in the different sub-catchments, although it had a positive influence on soil-available micronutrients. Soil AP can explain 32.50%, 14.80% and 26.60% of the spatial variability of available Cu in sub-catchments 3, 4 and 5 in 2017, respectively. Additionally, it was the main factor causing spatial variability of available Zn in the different sub-catchments in 2007 and 2017. Soil pH has a negative effect on four kinds of soil-available micronutrients, and it was the main factor causing the spatial variability of available Fe content in sub-catchments 1–3, a finding which was closely related to land-use and fertilizer application. The spatial variability of available Mn was mainly influenced by soil pH in the different sub-catchments in 2007 and 2017. Our findings provide a preliminary guide for fertilization practices in this region, as well as soil management, in the intensively cultivated land in the Ju River basin.

Author Contributions

Investigation, A.X. and Y.L.; software, C.N.; supervision, Y.H.; writing—review and editing, Z.Z.

Funding

This research was funded by the National Key Research and Development Program of China (2016YFD0300801) and the National Natural Science Foundation of China (41571217).

Acknowledgments

The authors gratefully acknowledge the reviews. In addition, the authors thank Shiwen Zhang for supporting the execution of the field tests.

Conflicts of Interest

The authors declare no conflict of interest.

References

  1. Wani, M.A.; Wani, J.A.; Bhat, M.A.; Kirmani, N.A.; Wani, Z.M.; Bhat, S.N. Mapping of soil micronutrients in Kashmir agricultural landscape using ordinary kriging and indicator approach. J. Indian Soc. Remote Sens. 2013, 41, 319–329. [Google Scholar] [CrossRef]
  2. Nath, A.J.; Lal, R.; Sileshi, G.W.; Das, A.K. Managing India’s small landholder farms for food security and achieving the “4 per Thousand” target. Sci. Total Environ. 2018, 634, 1024–1033. [Google Scholar] [CrossRef] [PubMed]
  3. Ye, H.C.; Shen, C.Y.; Huang, Y.F.; Zhang, S.W.; Jia, X.H. Spatial variability of available soil microelements in an ecological functional zone of Beijing. Environ. Monit. Assess. 2015, 187, 13. [Google Scholar] [CrossRef] [PubMed]
  4. Szopka, K.; Karczewska, A.; Jezierski, P.; Kabala, C. Spatial distribution of lead in the surface layers of mountain forest soils, an example from the karkonosze national park, poland. Geoderma 2013, 192, 259–268. [Google Scholar] [CrossRef]
  5. Ramzan, S.; Wani, M.A. Geographic Information System and geostatistical techniques to characterize spatial variability of soil micronutrients including toxic metals in an agricultural farm. Commun. Soil Sci. Plant Anal. 2018, 49, 463–477. [Google Scholar] [CrossRef]
  6. Zhu, H.; Hu, W.; Bi, R.; Peak, D.; Si, B. Scale-and location-specific relationships between soil available micronutrients and environmental factors in the Fen River basin on the Chinese Loess Plateau. Catena 2016, 147, 764–772. [Google Scholar] [CrossRef]
  7. Arvind, K.S.; Nishant, K.S.; Pankaj, K.T.; Chandra, P.; Sanjib, K.B.; Narendra, K.L.; Vinod, K.S.; Brahma, S.D.; Kaushik, M.; Anil, K.; et al. Spatial distribution and management zones for Sulphur and micronutrients in Shiwalik Himalayan Region of India. Land Degrad. Dev. 2017, 28, 959–969. [Google Scholar]
  8. Li, B.Y.; Zhou, D.M.; Cang, L.; Zhang, H.L.; Fan, X.H.; Qin, S.W. Soil micronutrient availability to crops as affected by long-term inorganic and organic fertilizer applications. Soil Tillage Res. 2007, 96, 166–173. [Google Scholar] [CrossRef]
  9. Wu, J.; Li, Y.H.; Li, Z.B.; Fang, Z.; Zhong, Y. Spatial distribution and influencing factors of farmland soil organic matter and trace elements in the nansihu region. Acta Ecol. Sin. 2014, 34, 1596–1605. [Google Scholar]
  10. Jiménez-Ballesta, R.; García-Navarro, F.J.; Bravo, S.; Amorís, J.A.; Pérez-de-los-Reyes, C.; Mejías, M. Environmental assessment of potential toxic trace element contents in the inundated floodplain area of Tablas de Daimiel wetland. Environ. Geochem. Health 2017, 39, 1159–1177. (In Spanish) [Google Scholar]
  11. Tesfahunegn, G.B.; Tamene, L.; Vlek, P.L.G. Catchment-scale spatial variability of soil properties and implications on site-specific soil management in northern Ethiopia. Soil Tillage Res. 2011, 117, 124–139. [Google Scholar] [CrossRef]
  12. Zhang, S.; Li, Z.; Yang, X. Effects of long-term inorganic and organic fertilization on soil micronutrient status. Commun. Soil Sci. Plant Anal. 2015, 46, 1778–1790. [Google Scholar] [CrossRef]
  13. Sanjeevani, U.K.P.S.; Indraratne, S.P.; Weerasooriya, R.; Vitharana, U.W.A.; Kumaragamage, D. Identifying the sources and contamination status of potentially toxic trace elements in agricultural soils. Commun. Soil Sci. Plant Anal. 2017, 48, 865–877. [Google Scholar] [CrossRef]
  14. Mansilla, R.; Nóvoa-Muñoz, J.C.; Pontevedra-Pombal, X.; Pancotto, V.; Gómez-Armesto, A.; Escobar, J.; Moretto, A. Temporal and spatial changes in soil micronutrients in managed Nothofagus pumilio, forest of Tierra del Fuego, Argentina. Environ. Earth Sci. 2016, 75, 738. [Google Scholar] [CrossRef]
  15. Lindsay, W.L.; Norvell, W.A. Development of a DTPA soil test for Zinc, Iron, Manganese, and Copper. Soil Sci. Soc. Am. J. 1978, 42, 421–428. [Google Scholar] [CrossRef]
  16. Walkley, A.; Black, C. Determination of organic carbon. Soil Sci. 1934, 37, 1372–1375. [Google Scholar]
  17. Olsen, S.J.; Kumnuan, U.; Ly, S.; Uyeki, T.M.; Dowell, S.F.; Cox, N.J.; Aldis, W.; Chunsuttiwat, S. Family clustering of avian influenza a (H5N1). Emerg. Infect. Dis. 2005, 11, 1799–1801. [Google Scholar] [CrossRef]
  18. Jackson, M.L. Soil Chemical Analysis. Soil Sci. 1973, 85, 288. [Google Scholar]
  19. Coburn, T.C. Geostatistics for natural resources evaluation. Technometrics 2000, 42, 437–438. [Google Scholar] [CrossRef]
  20. Burgess, T.M.; Webster, R. Optimal interpolation and isar1thmic mapping of soil properties: I the semi-variogram and punctual krig1ng. Eur. J. Soil Sci. 1980, 31, 315–331. [Google Scholar] [CrossRef]
  21. Wang, D.X.; Fu, D.Y. Evaluation of soil trace elements availability in western Jilin province. Soil 2002, 2, 86–89. [Google Scholar]
  22. Nielsen, D.R.; Bouma, J. Soil Spatial Variability. In Proceedings of a Workshop of the ISSS and the SSSA, Las Vegas, USA/Pdc296; Center Agricultural Pub and Document: Wageningen, The Netherlands, 1985. [Google Scholar]
  23. Zhang, F.; Yin, G.; Wang, Z.; McLaughlin, N.; Geng, X.; Liu, Z. Quantifying spatial variability of selected soil trace elements and their scaling relationships using multifractal techniques. PLoS ONE 2013, 8, e69326. [Google Scholar] [CrossRef] [PubMed]
  24. Opfergelt, S.; Cornélis, J.T.; Houben, D.; Givron, C.; Burton, K.W.; Mattielli, N. The influence of weathering and soil organic matter on Zn isotopes in soils. Chem. Geol. 2017, 466, 140–148. [Google Scholar] [CrossRef]
  25. Choudhary, M.; Panday, S.C.; Meena, V.S.; Singh, S.; Yadav, R.P.; Mahanta, D.; Mondal, T.; Mishra, P.K.; Bisht, J.K.; Pattanayak, A. Long-term effects of organic manure and inorganic fertilization on sustainability and chemical soil quality indicators of soybean-wheat cropping system in the Indian mid-Himalayas. Agric. Ecosyst. Environ. 2018, 257, 38–46. [Google Scholar] [CrossRef]
  26. Ayoub, S.; Mehnatkesh, A.; Jalalian, A.S.; Sahrawat, K.L.; Gheysari, M. Relationships between grain protein, Zn, Cu, Fe and Mn contents in wheat and soil and topographic attributes. Arch. Agron. Soil Sci. 2014, 60, 625–638. [Google Scholar] [CrossRef]
  27. Reza, S.K.; Nayak, D.C.; Mukhopadhyay, S.; Chattopadhyay, T.; Singh, S.K. Characterizing spatial variability of soil properties in alluvial soils of India using geostatistics and geographical information system. Arch. Agron. Soil Sci. 2017, 63, 1489–1498. [Google Scholar] [CrossRef]
  28. Zhang, Z.; Ren, Y.; Lu, J.W.; Zheng, L.; Miao, J.; Li, X.K.; Ren, T.; Cong, R.H. Spatial distribution of micronutrients in farmland soils in the mid-reaches of the Yangtze River. Acta Pedol. Sin. 2016, 53, 1489–1496. [Google Scholar]
  29. Zia, M.H.; Watts, M.J.; Niaz, A.; Middleton, D.R.S.; Kim, A.W. Health risk assessment of potentially harmful elements and dietary minerals from vegetables irrigated with untreated wastewater, Pakistan. Environ. Geochem. Health 2017, 39, 707–728. [Google Scholar] [CrossRef]
  30. Kuppusamy, S.; Yoon, Y.E.; Kim, S.Y.; Kim, J.H.; Kim, H.T.; Lee, Y.B. Does long-term application of fertilizers enhance the micronutrient density in soil and crop? Evidence from a field trial conducted on a 47-year-old rice paddy. J. Soils Sediments 2018, 18, 49–62. [Google Scholar] [CrossRef]
  31. Verma, T.P.; Moharana, P.C.; Naitam, R.K.; Meena, R.L.; Kumar, S.; Singh, R.; Tailor, B.L.; Singh, R.S.; Singh, S.K. Impact of cropping intensity on soil properties and plant available nutrients in hot arid environment of North-Western India. J. Plant Nutr. 2017, 40, 2872–2888. [Google Scholar] [CrossRef]
  32. Lambert, R.; Grant, C.; Sauvé, S. Cadmium and zinc in soil solution extracts following the application of phosphate fertilizers. Sci. Total Environ. 2007, 378, 293–305. [Google Scholar] [CrossRef] [PubMed]
  33. Likar, M.; Vogel-Mikuš, K.; Potisek, M.; Hancevic, K.; Radic, T.; Necemer, M.; Regvar, M. Importance of soil and vineyard management in the determination of grapevine mineral composition. Sci. Total Environ. 2015, 505, 724–731. [Google Scholar] [CrossRef] [PubMed]
  34. Wei, X.; Hao, M.; Shao, M.; Gale, W.J. Changes in soil properties and the availability of soil micronutrients after 18 years of cropping and fertilization. Soil Tillage Res. 2006, 91, 120–130. [Google Scholar] [CrossRef]
  35. Gondek, K.; Mierzwa-Hersztek, M.; Adrain, U. Effect of low-temperature biochar derived from pig manure and poultry litter on mobile and organic matter-bound forms of Cu, Cd, Pb and Zn in sandy soil. Soil Use Manag. 2016, 32, 357–367. [Google Scholar] [CrossRef]
  36. Wang, L.Y.; Wang, S.W.; Chen, W.R. Roxarsone desorption from the surface of goethite by competitive anions, phosphate and hydroxide ions: Significance of the presence of metal ions. Chemosphere 2016, 152, 423–430. [Google Scholar] [CrossRef]
  37. Mi, W.; Sun, Y.; Xia, S.; Zhao, H.; Mi, W.; Brookes, P.C.; Liu, Y.; Wu, L. Effect of inorganic fertilizers with organic amendments on soil chemical properties and rice yield in a low-productivity paddy soil. Geoderma 2018, 320, 23–29. [Google Scholar] [CrossRef]
Figure 1. The location of study area and the distribution of sampling points (1, 2, 3, 4 and 5 represent sub-catchments 1–5, respectively).
Sustainability 11 05912 g001
Figure 2. Spatial-temporal distribution of soil-available micronutrients in the study area.
Sustainability 11 05912 g002aSustainability 11 05912 g002b
Figure 3. Assessment of available Cu, Zn, Fe and Mn in the different sub-catchments (1, 2, 3, 4 and 5 represent drainage basins 1–5; SI: synthetic index).
Sustainability 11 05912 g003
Figure 4. Stepwise regression analysis of factors contributing to the variability of available micronutrients in the sub-catchments (1, 2, 3, 4 and 5 represent sub-catchments 1–5, respectively).
Sustainability 11 05912 g004
Table 1. The distribution of sample points in different sub-catchments in 2007 and 2017.
Sub-CatchmentYearsSample Points (n)Orchard (%)Crop Land (%)Vegetable Land (%)
1200735082.57%11.43%6.00%
201736286.74%7.73%5.52%
2200713781.75%13.87%4.38%
201712791.34%7.87%0.79%
320078660.47%31.40%8.14%
20177682.89%11.84%5.26%
420079132.97%37.36%29.67%
20179145.05%28.57%26.37%
5200715724.84%52.87%22.29%
201715644.87%37.18%17.95%
Table 2. Classified standard of soil-available micronutrients in the Pinggu district (mg·kg−1).
ElementsVery LowLowMediumHighVery HighCritical Values
Cu<0.200.20–0.500.50–1.001.00–2.00>2.000.50
Zn<0.500.50–1.001.00–2.002.00–5.00>5.001.00
Fe<5.005.00–7.007.00–10.0010.00–20.00>20.007.00
Mn<5.005.00–10.0010.00–20.0020.00–30.00>30.0010.00
Table 3. Statistical results for the soil-available micronutrients (mg·kg−1).
IndexesYearsSamplesRangeMeanCV (%)SkewnessDistribution Type
Cu20078210.63–6.171.4929.61−0.92Lognormal
20178120.40–9.602.0462.250.34Lognormal
Zn20078210.14–11.402.7273.10−0.08Lognormal
20178120.21–72.704.90128.470.08Lognormal
Fe20078210.34–63.8618.2557.64−0.58Lognormal
20178124.21–246.0033.3892.290.41Lognormal
Mn20078212.95–53.2011.1436.80−0.54Lognormal
20178125.27–403.0031.6795.090.33Lognormal
Table 4. The semi-variogram model parameters for soil-available micronutrients (mg·kg−1).
ElementsYearsModelNuggetSillNugget/Sill (%)Range (m)RMSE
Cu2007Exponential0.0030.0378.111180.061.15
2017Exponential0.1980.22886.84697.541.40
Zn2007Exponential1.0403.24232.08720.430.81
2017Spherical0.7470.96577.416586.531.04
Fe2007Spherical0.3340.41879.903423.860.70
2017Gaussian0.0700.33820.71503.271.09
Mn2007Exponential0.0740.11763.257333.000.94
2017Gaussian0.2340.33370.278213.581.16
RMSE: root mean square error.
Table 5. Mean values of soil properties in the different sub-catchments in 2007 and 2017.
Sub-CatchmentsYearSOM (g∙kg−1)TN (g∙kg−1)AP (mg∙kg−1)AK (mg∙kg−1)pH
1200716.160.4549.62165.647.07
201721.071.39132.80178.006.50
2200716.620.1023.72128.267.55
201722.721.3788.39161.437.33
3200714.010.0827.38119.147.06
201720.511.31173.39165.296.95
4200714.770.1036.55130.318.15
201721.011.2790.23182.797.85
5200712.250.0729.92115.228.03
201715.571.0992.56163.537.66
Table 6. Correlation analysis between various parameters and available micronutrients.
ElementsYearSOMTNAPAKpH
Cu20070.0490.0350.088 **0.072 *−0.278 **
20170.148 **0.263 **0.358 **0.324 **−0.203 **
Zn20070.240 **0.351 **0.599 **0.444 **−0.534 **
20170.487 **0.447 **0.752 **0.644 **−0.289 **
Fe20070.205 **0.259 **0.171 **0.215 **−0.534 **
20170.306 **0.356 **0.579 **0.295 **−0.820 **
Mn20070.158 **0.223 **0.0680.148 **−0.490 **
20170.185 **0.175 **0.0420.107 **−0.383 **
** Correlation is significant at the 0.01 level (two-tailed); * correlation is significant at the 0.05 level (two-tailed).

