1. Introduction
Global disaster losses significantly rose in recent decades, with floods being the most damaging hazard (from 2005 to 2015) [
1]. Between 1998 and 2017, floods were the most frequent type of disaster, affecting more than two billion people and causing
$656 billion USD in damages [
2]. In particular, the increase in economic losses is almost entirely explained by changes in socioeconomic factors such as population growth, wealth and increasing development in hazardous areas [
3,
4,
5,
6,
7]. Hazard events, such as floods, manifest themselves as disasters when combined with the exposure and vulnerability of human settlements and communities.
Only a better understanding of risk and the causes of disaster impacts can lead to effective risk prevention and reduction. In fact, the Sendai Framework for Disaster Risk Reduction (DRR) sets “understanding disaster risk” as the first priority for action and points out that DRR policies and practices should be based on this knowledge in all dimensions of risk: hazard, exposure, and vulnerability [
8]. Hazards are natural or man-made processes that can cause damage in the form of loss of life, injury or other health impacts, cultural heritage, property damage, environmental degradation and socio-economic disruptions. Socio-economic impacts encompass (i) population dynamics, (ii) sectoral economic dynamics (e.g., impacts on tourism), and (iii) households’ response to a specific disaster risk (following Gunadi Brata [
9]). They generally lead to a prolonged duration and a greater spatial dispersal of hazards impacts and potentially an increase in social vulnerability [
10]. Vulnerability is a condition “determined by physical, social, economic and environmental factors or processes that increase the susceptibility of a person, community, asset or system to the effects of hazards” [
11]. Exposure covers the presence of persons, goods, or systems in hazard zones exposed to potential damage. Only in combination do exposure and vulnerability define the risks associated with a hazard in the area of interest. The Root Cause Analysis of disasters does not have a generally agreed definition. However, the German Committee for Disaster Reduction (DKKV) [
12] (p. 56) describe it as a “broad, multi-dimensional and comprehensive investigation of disasters with the aim to identify critical factors in the pre-disaster, impact and post-disaster (response and recovery) phases.” In this context, past disasters represent an invaluable opportunity for understanding risk and learning from the positive and the negative aspects, considering what worked, what went wrong, and understanding why.
This study analyses the causes and contributing factors of disasters, in particular floods, and their socio-economic impact from a holistic hazard research perspective. Regularly, there is not only one factor that can be identified as the cause of economic damage from flooding and the resilience of neighborhoods, but in general, it is the combination of several factors that explain the short- and long-term socio-economic impact of flooding, which can be examined with the help of the disaster forensics methodology.
In this paper, a case study of two successive flood events in 2002 and 2013 in the city of Grimma in Saxony is forensically examined. Forensic investigation applied to the study of disasters related to natural hazards is relatively new. It was only in 2010 that “Forensic Disaster Investigations” were established as part of the Integrated Research on Disaster Risk (IRDR) [
13], giving rise to the Forensic Investigation of Disasters (FORIN) project [
14]. Likewise, in recent years different approaches and conceptual frameworks were proposed to pursue a holistic analysis of disaster events. These investigations are not intended to seek or assign legal responsibility, as the term “forensic” could suggest, but to understand which factors and how they contributed to the gestation and occurrence of a disaster in order to prevent and mitigate disaster risk.
Approaches to conducting this kind of studies fall under what we call in this work the “Disaster Forensics” umbrella, i.e., methods developed ad-hoc to study disasters from a holistic perspective. Disaster forensics is distinct from other usages of GIS-based information and aerial photography, for example, in analytical hierarchy multi-criteria decision-making processes (cp. [
15,
16]). For an overview, see Chandio et al. [
17].
Approaches for Disaster Forensics include the FORIN methodology by the IRDR [
18], the Post-Event Review Capability (PERC) by Zurich Insurance Group and ISET-International [
19], Detecting Disaster Root Causes framework and tool by the German Committee for Disaster Reduction (DKKV) [
12], and Forensic Disaster Analysis in Near Real-Time by the Center for Disaster Management and Risk Reduction Technology (CEDIM) [
20]. The objectives of Disaster Forensics are the identification of “root causes” [
12,
18,
19], of both deficiencies and successes in disaster risk management (pre-event, disaster response and post-event) and actionable opportunities for risk mitigation [
19] in order to tackle them through policy and practice [
12,
18,
19].
In this work, various risk factors are investigated to identify their contribution to increasing or reducing catastrophic losses and long-term socio-economic impacts in the most flood-affected city center of Grimma in a sequence of two flood events in 2002 and 2013. This is done by analyzing the impact of the floods on the buildings and on population migration. In particular, we analyze (i) what data is needed to conduct a disaster forensic analysis and (ii) to what extent the sequential application of disaster forensics contributes to a better understanding of the risk and causes of disaster impacts.
2. Materials and Methods
This research follows the case study concept of disaster forensics methodology, i.e., a combination of methods and findings from different disciplines with the aim of describing and reconstructing disasters and their relevant drivers as comprehensively as possible. The approach considers the complexity of loss events and the risk of natural catastrophes with multiple interactions and triggers in natural and socio-economic systems.
Concerning the data for performing a disaster forensic investigation, this case study makes use of many different data categories. These include data on the risk factors, damage data, data on prevention measures, data on the response, and data on recovery processes. Data on the risk factors include data on the hazard (e.g., flood characteristics), the exposure (elements inside the flood-prone area), and the vulnerability of the exposed objects. Damage data comprise data on different damages and impacts associated with the flood event. Data on prevention measures include all the data related to the measures taken during the prevention phase to mitigate flood risk. Data on the response process concerns data on the activities performed during the emergency period, such as the emergency measures taken at the household level. Data on the recovery process refers to data on the recovery and reconstruction phase, for instance on damage compensation and reconstruction time.
We are recurring to a large variety of sources of evidence. They include documents of different kinds, archival records, interviews from past projects, satellite imagery and maps. Consulted documents include peer-reviewed papers, reports, master theses, urban plans and newspaper articles. The collected archival records regard data on the population from the municipal registry of residents of Grimma. Flood damage and other related data of the residential sector from the 2002 and 2013 flood events were provided by the University of Potsdam, the German Research Centre for Geosciences, and Deutsche Rückversicherung. These data were collected through computer-aided interviews (CATI) among households in the flooded area in the aftermaths of both the 2002 and the 2013 floods as explained by Thieken et al. [
21,
22]. The questionnaires contained around 180 question, addressing multiple topics including flood characteristics, flood warning, emergency measures, damage to building, compensation, and prevention measures.
Regarding data analysis, the starting point is the disaster forensics methods previously mentioned. Specifically, the requirement of a holistic disaster forensic methodology that makes use of disaster damage data collected ex-post. In the case of floods, this means that the data under consideration are collected after the flood event, through damage assessments done at the end of the emergency, and/or in the recovery period. For example, Menoni et al. [
23] developed a post-flood damage assessment model that supports a more integrated interpretation of flood events for a variety of purposes, including forensic investigation.
Table 1 presents an overview of the existing approaches in Disaster Forensics, as mentioned in
Section 1. CEDIM proposes a forensic analysis of disasters in “near real-time,” delivering results hours to days after the disaster event [
20]. This approach makes use of different kinds of data that are available almost in real-time, from the very first moments when the disaster unfolds and the emergency phase (e.g., data from social media, GPS and sensors data, meteorological data, etc.) Our work instead is developed long after the occurrence of the disaster, using mostly data collected ex-post.
The forensic framework and tool proposed by the DKKV [
12] rests on expert interviews and on synthesizing and combining them with previous analyses to create a comprehensive overview of the disaster. The tool, therefore, does not directly employ post-event damage data.
FORIN suggests the “comparative case analysis” as a forensic research approach: a limited amount of detailed studies of “comparative” disasters [
18]. These disasters can either have similar characteristics in terms of the hazard and different locations, or the same location, involving the same or other kind of hazard [
18]. This last type of comparative analysis is “in-situ” and is particularly suitable for the forensic investigation of Grimma’s repeated floods.
The PERC methodology has been applied mostly to study flood events. The analysis is based on data gathered from a desk review and on informal and semi-structured interviews from fieldwork, and it is organized around the disaster risk reduction and management cycle. The final product of the PERC process is a structured report, which also acts as guidance to conduct the investigation.
The approach for the forensic investigation in this research is inspired by FORIN’s comparative case analysis “in situ” and by PERC. Specifically, the approach consists of a detailed study of repeated hazard events in the same location, while the PERC report was followed as guidance for determining the different aspects and factors that required investigation.
Figure 1 shows the methodology proposed and followed for the forensic investigation. The analysis is structured around the risk factors (hazard, exposure, and vulnerability), the disaster impacts and the disaster risk management cycle (prevention and preparedness, disaster response, recovery and reconstruction). The methodology rests on different data analysis and representation techniques, including the study of orthophotos and satellite images to evaluate changes in the exposure and vulnerability of assets in flood-prone areas. In order to introduce the damage data collected ex-post in the investigation, we propose the use of statistical analysis and graphical representations of quantitative and qualitative data. The comparative case analysis, inspired by FORIN, is done to identify and extract the lessons learned. It consists in the comparison of different types of analysis, as depicted in
Figure 1.
3. Case Study Design and Results
3.1. Case Study Design
The selected case study is the Saxon city of Grimma, which was affected by the flood events of 2002 and 2013. Grimma lies on the western bank of the Vereinigte Mulde, a tributary of the Elbe, which consists of the confluence of the Zwickauer and Freiberger Mulde, which have their origin in the Erzgebirge mountains. Grimma is a medieval town with a city wall dating from 1232 to protect it from raids and looting, but also from flooding [
24]. This wall was almost completely destroyed at the end of the 19th century. The population in the city centre of Grimma was about 1300 inhabitants in 2002, while the old town of Grimma had about 2300 inhabitants at the beginning of 2013, according to the municipal records.
On 13 August 2002, Grimma was hit by a severe flooding, with water depths of around 4 m and where about 1000 inhabitants were evacuated, and 150 had to be rescued. The economic losses for Grimma (including the city center and two smaller villages) amounted to over 230 million euros.
On 1 and 2 June 2013, Grimma was again hit by flooding, with water depths close to 2 m. In this case, all residents were evacuated from the historical center, and some of them had to be rescued again. The monetary damage caused by the floods totaled around 150 million euros.
The forensic analysis was applied sequentially to the two floods events in Grimma. The next sub-sections show the different aspects under analysis, starting from the risk factors (hazard, exposure, and vulnerability), continuing with the flood risk mitigation measures taken before and in between floods, the disaster response, the damages and impacts, and the recovery and reconstruction processes.
3.2. Results
3.2.1. Hazard
In order to study the physical characteristics of the hazard events, we selected different features commonly used in forensic hydrology [
25]—precipitation, return period, initial soil moisture, peak discharge, water depth, the presence of sediments/contaminants, flood duration, and the flooded area. Several indicators were individually adapted to describe each aspect and to compare the events of 2002 and 2013 objectively, i.e., based on the same observation and statistical methods (
Table 2).
According to all the indicators for precipitation [
26], the 2002 event was much more intense than the one of 2013. Another selected aspect for analysis is the initial soil moisture, which complements the data on precipitation to explain the occurrence of floods. In this case, the indicator that is chosen is the precipitation in the days prior to the flood, as analyzed by Schumann et al. [
26], which conclude that both events were characterized by high pre-humidity. Since both flood events occurred during summer, Schumann et al. consider the relevant antecedent precipitation less than 30 days prior to the event due to evaporation. In order to better compare the initial moisture conditions, a weighted sum of the pre-precipitation values was calculated by Schumann et al. as follows: the five-day pre-precipitations were weighted by 0.5, the pre-precipitation that fell six to 10 days before the flood was weighted by 0.3, and the pre-precipitation over 11 to 30 days before the event was weighted by 0.2. This weighted average of antecedent precipitation is very similar for both events, with the one in 2002 being the maximum recorded in the area.
At the nearest gaging station, Golzern 1, downstream of Grimma, the return period of the 2002 flood event was around 474 years, whereas in 2013, it corresponded to 172 years [
26]. The peak discharge in Golzern 1 in 2002 was 2600 m3/s and in 2013, 2040 m3/s [
26].
Figure 2, a flood map with the flooded areas as defined by the Saxony State Office for Environment, Agriculture and Geology [
27], shows the areas affected by both floods being almost coincident due to Grimma’s topography, where floods are confined to the town center because it is approximately 15 m below surrounding areas. Hazard maps from the Elbe Atlas of the Mulde River in the Grimma area show that the flood-prone area for floods of 100-year return period and above almost coincide. Likewise, the location of some affected households from the telephone interviews (not presented here due to privacy issues) corroborated this fact and so did direct observations during fieldwork, where some of the flooded buildings had plaques and marks that indicated the level reached by flood water.
The mean water depth at the household level is another indicator used in the analysis (
Appendix A), which shows an important difference between both events (approximately 4 m in 2002 vs. 2 m in 2013).
Another important indicator is the presence of contaminants in floodwater, which can generate and worsen damages. The assessment of the presence of pollutants in both flood events was based on available data at the household level (
Appendix A) regarding the presence of oil or petrol, chemical pollution, and sewage and feces contamination. These indicators are quantified as the percentage of households that reported each kind of contaminants within the samples. In both floods, pollution from sewage was very important, with around 70% of the households reporting it. A slightly higher percentage of oil and petrol contamination affected households in 2002, whilst in 2013, chemical contamination was a little higher.
Flood duration is another important aspect that can aggravate damages. In this case, two indicators are considered—flood duration according to internet reports and newspaper articles, and flood duration according to interviews with household residents. According to media reports, the flood lasted about one day in 2002 [
28], while in 2013 it lasted over two periods. The first began on 1 June early in the morning, while the water began to recede in the afternoon of the same day. The second more intense flood occurred in the night from June 1st and the morning of the 2nd, with media reports from the 3 June stating that, by 08:00 that day, all rivers in Saxony had retreated. The data from the residents’ surveys (
Appendix A) show an average flooding duration of 35 hours in 2002 compared to 50 hours in 2013.
3.2.2. Exposure and Vulnerability
In this section we analyze changes in the risk factors exposure and vulnerability. In particular, we analyze changes in the reconstruction of assets in flood-prone areas and in the age structure of the exposed population.
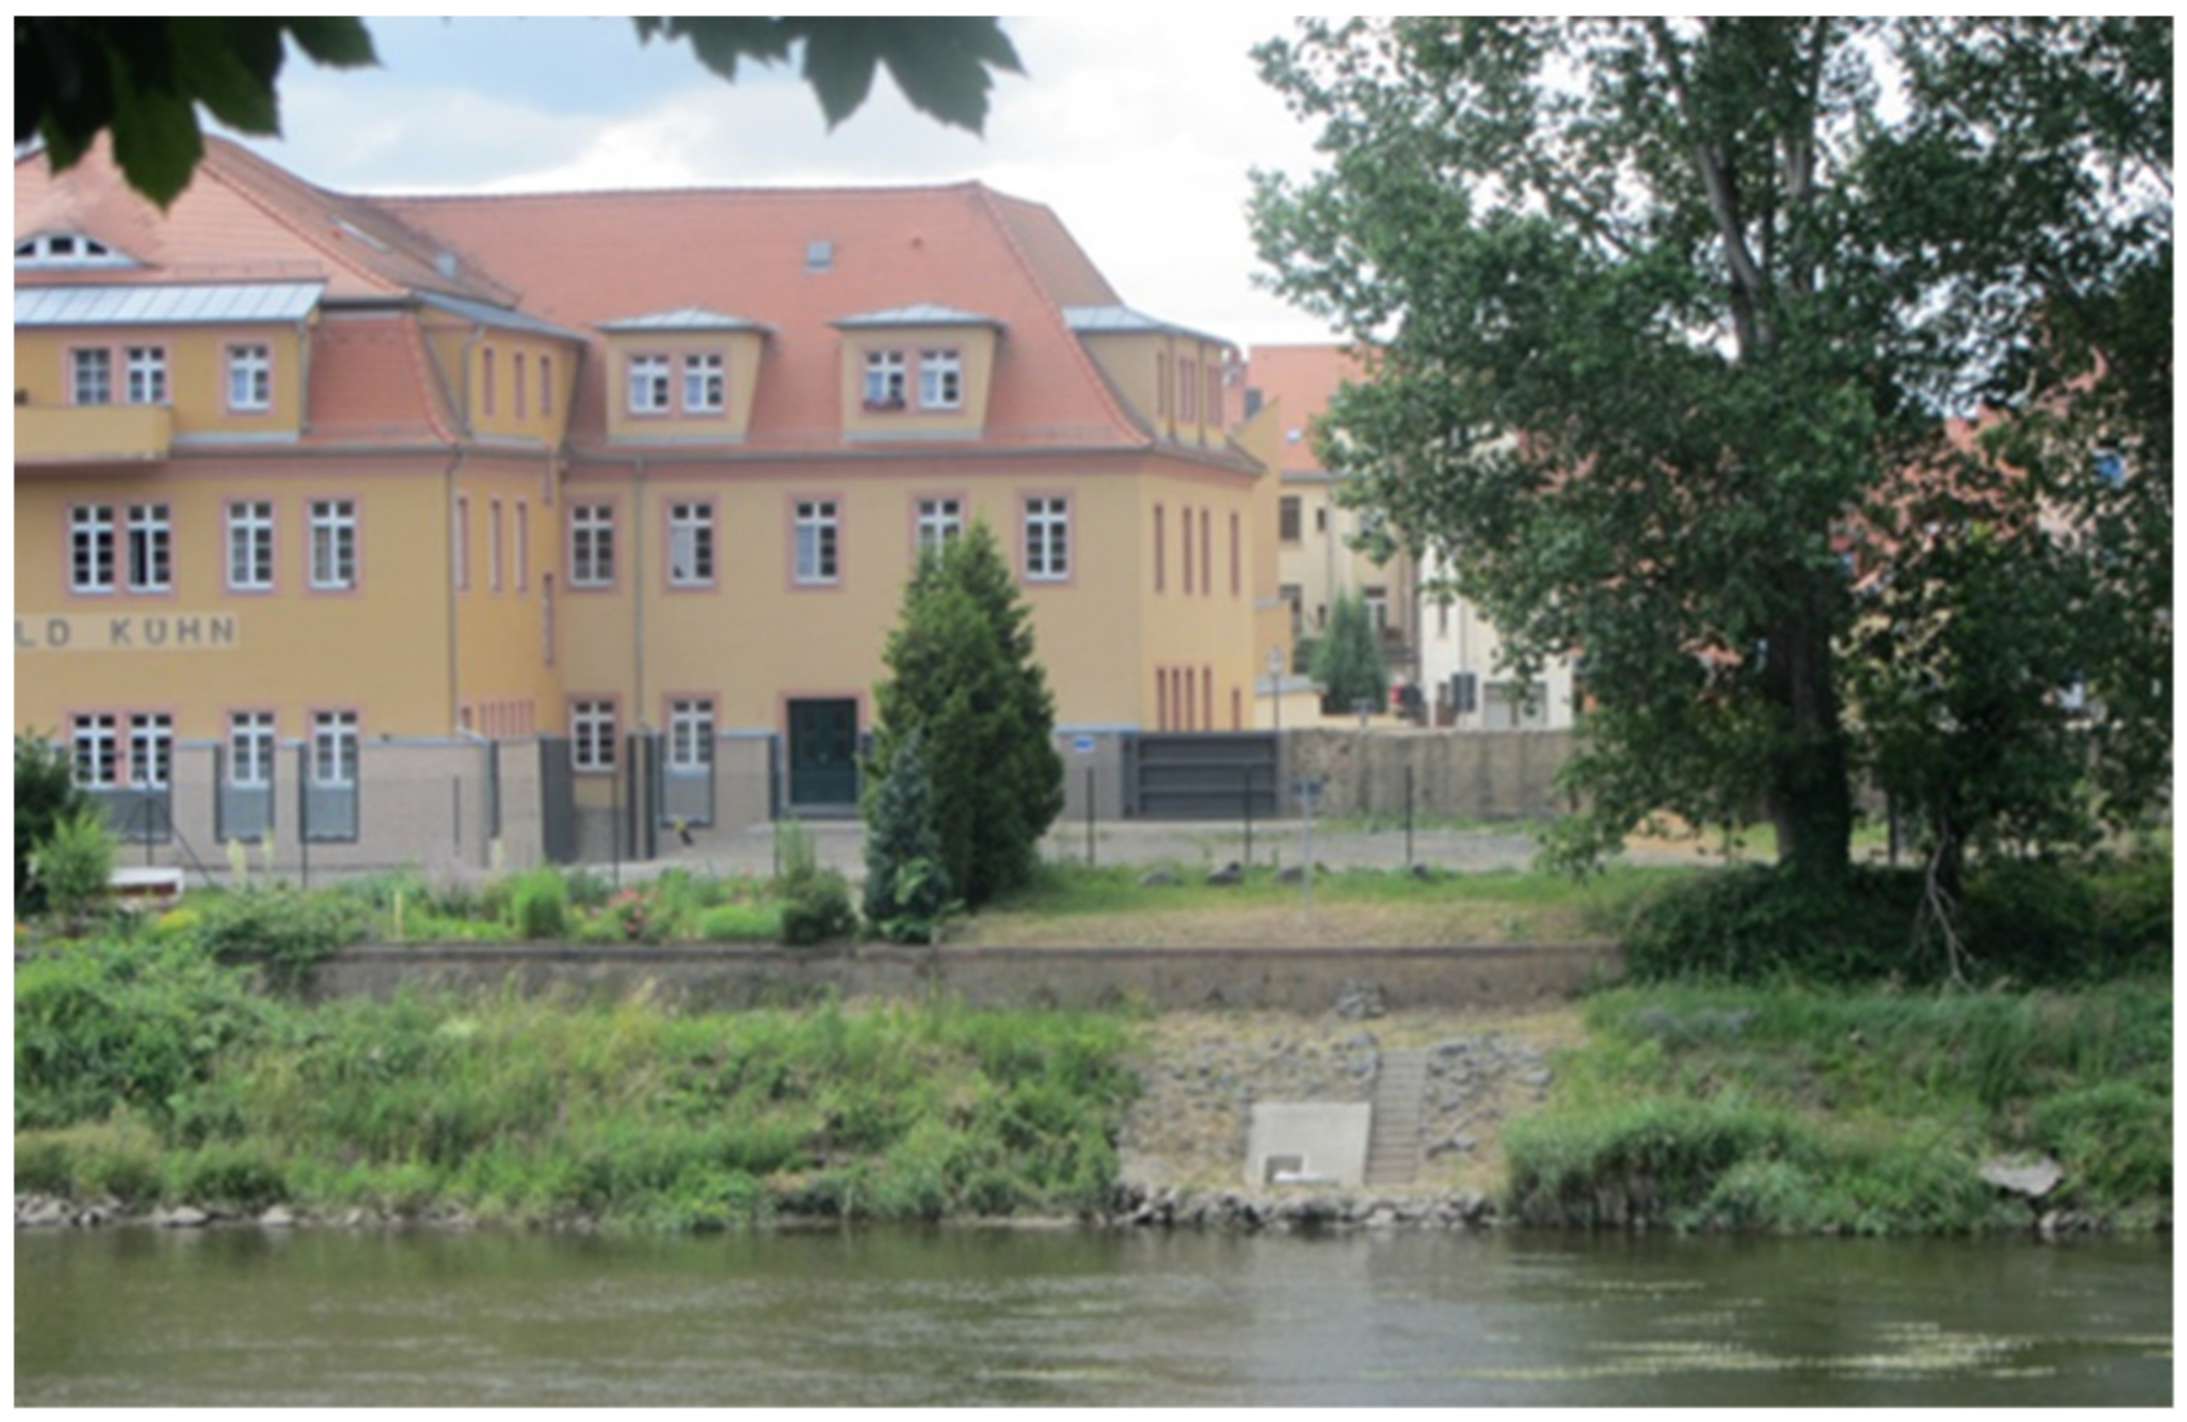
As already mentioned, the floods are limited to the center of Grimma, where the buildings have not changed significantly due to their historical character. An important exception is the new Police Headquarters, which was established in 2005. It was financed with federal funds and serves the entire municipality of Grimma. The four buildings are located on the bank of the Mulde, south of the city centre. They were built flood-safe and became part of the new flood wall.
In an interview in 2006, the mayor of Grimma, Mr Berger, said he was very happy because the police headquarters provided 300 new jobs. He added that the choice to build there might appear dangerous, but that it made no sense to tell the citizens it was safe for them to go back to their homes if the plans for the police station were given up after the first flood. “Then there would be no more trust,” he said.
Age structure was also investigated before and after the 2002 and 2013 floods to understand if there were changes affecting the vulnerability of the population. Results show that the age structure in Grimma center remained almost constant from 2001 to 2015 for all age strata. For example, the youngest population (0 to 15 years old) fluctuated between 15 and 17 percent, whereas the eldest (66 and up) stayed around 11 per cent.
3.2.3. Flood Risk Mitigation Measures
Physical Flood Protection Infrastructure
In 2002, when the flood struck, there were no structural protection measures in place in Grimma. Only a small part of the medieval wall was left standing, without it having any impact on flood protection. Grimma is not only affected by river flooding, but also by groundwater rise, which can occur independently of flooding. Mr Guhlemann, Director of Grimma’s Civil Engineering Department, explained in an interview that in 2002 the city had no protection infrastructure, as the available technology did not make it possible in the past to effectively reduce groundwater flooding. It was not until the floods of 2002 that numerous measures were developed for the flood protection infrastructure in the Mulde. Grimma was given high priority. The preliminary investigations were carried out in 2002–2003 and proposed a fortified flood wall surrounding the historical center [
29]. This measure was to provide protection against flooding up to an exceedance probability of 1/100. At its highest point, the wall measures 4.5 meters. The underground sealing wall reaches up to 12 meters into the earth. Because the sealing wall influences the natural groundwater flow, an elaborate system with eight so-called horizontal filter wells and 1.5 kilometers of drainage strands was installed to wall to keep the underground wall permeable at normal water levels and to seal off the bulkheads in the event of flooding. However, the reaction of the population to the original proposal to build the flood wall was negative. It was argued that it would destroy the cultural heritage and cityscape [
29]. For a deeper analysis of the issue of the role and methods to assess the value of cultural heritage see, Usamov et al. [
30], Howard et al. [
31], and Romão et al. [
32].
The implementation of the protection infrastructure was delayed by many years, as it was hampered by the residents and some members of the municipal council. The University of Dresden (TU) carried out various studies with a group of architects and conservationists in 2005–2006 and proposed a new solution with the initial protection objective. They proposed a new flood wall that was integrated into the medieval wall and allowed access from the city to the river, which was crucial for the public acceptance of this new solution (
Figure 3).
Work finally began in 2007 despite further objections. As a consequence, the finally accepted measure has much higher costs than the first solution (approx. 40 million euros compared to 12 million euros) [
29]. The flood wall was completed in July 2019.
The Local Early Warning System
Grimma obtained many donations after the 2002 flood, some of which were spent by the town council to establish an independent local Early Warning System (EWS), driven by the absence of a timely flood warning [
29]. The EWS has four alarms and a central announcement system, an information program in the local television station functioning 24 hours when there is a flood alert, an autonomous SMS-information network, a river gauge camera (live streaming on the internet), and a house threshold measuring system.
When in danger, a siren sound is emitted, followed by a gong. A repeated message is heard after each gong. The sirens can work up to one week even in case of a power cut. The siren is heard for the first time when the water level is 3.00 m above normal. Additional information is given as the flood develops through the alarms and the announcement system, and the siren also emits the “all-clear” signal through a long-lasting constant tone. Muldental-TV, the local television station, makes available additional information in the case of a forthcoming or current flooding, regarding the existing water levels and the estimate ones, the traffic and parking situation, possible evacuation measures, and the end of flood warning. The station interrupts its regular program for this purpose.
Every inhabitant or landlord of a house or business in the old town can register to a free SMS early warning system. At the beginning of 2009, 420 individuals (i.e., 17% of the exposed population) were listed in the city’s SMS warning system [
24]. Citizens can use the internet to monitor the water level on the flood cameras and compare it with the height of their front door to assess when water threatens to enter their house.
The installation costs for the EWS amounted to 148,000 € and cause annual operating costs of approx. 4000 € [
29]. Grimma’s local warning system operates in parallel to the regional warning system operated by the Saxon State Office for Environment and Geology (LfUG) [
29]. This local early warning system is “tolerated” by decision makers at the federal level, but Grimma’s local warning notice is criticized by critics as having no correspondence between warning levels and thresholds [
29].
Prevention Measures at the Household Level
The interviews of affected residents (
Appendix A) contained data regarding the prevention measures that were taken before the respective flood event. In 2002, 74 per cent of the surveyed households took at least one prevention measure before the 2002 flood, whereas this percentage was much higher in 2013, with 93 per cent of households. Statistics also show that residents took more prevention measures before the 2013 flood with respect to the one in 2002 (a mean of 4 in contrast to 2).
The prevention measures mentioned in the interviews were further analyzed to consider only those that may have influenced the damage to the building. These are shown in
Table 3, which includes measures for preventing or reducing the damage to the building itself, as well as measures for reducing the hazard intensity. In 2002, the percentage of households that took at least one prevention measure for mitigating the damage to the building was 32, whereas in 2013, was 62 per cent. Regarding the measures to reduce the hazard intensity, in 2002, only five per cent of the interviewed households had taken prevention measures. In contrast, in 2013, this percentage increased to 31 per cent.
3.2.4. Flood Protection Infrastructure Performance
When the flood occurred in 2002, Grimma had no flood protection infrastructure. Historically, the old medieval city wall provided some flood protection, but only a small part of it has remained. The new flood wall was in the process of being built during the 2013 flood, with 20 million euros of the total of 40 million euros spent on the project by then. Even though at least half of the construction of the flood wall had been completed in terms of expenditure, the protective performance of the structure was insignificant. It was designed in such a way that the protective wall only functions as a whole, even with a step-by-step implementation. Apart from that, the flood area did not change in any way in 2013 compared to the flood in 2002.
Mayor Matthias Berger declared in a newspaper interview after the 2013 flood that with a finished flood wall, water would have stayed out 100 per cent. Axel Bobbe, in charge of Flood Protection projects in the Leipzig district, said that the flood arrived four years too early, making reference to the fact that the construction was to be complete by 2017. Likewise, Stanislaw Tillich, Prime Minister of the Free State of Saxony, said after his visit to Grimma about the consequences of the floodwall that he was inclined to put an end to the co-determination of citizens in such an important project.
3.2.5. Disaster Response
Flood Warning and Emergency Measures at the Household Level
In 2002, the city of Grimma did not receive timely flood warnings [
29]. Survey data at household level (
Appendix A) show that the mean early warning time for residents during the flooding in 2013 was more than four times higher than for the flood event in 2002. Other statistical indicators such as the median and the mode support this statement (
Table 4).
The analysis of the data from the household survey (
Figure 4) shows that 45% of the households surveyed did not receive any flood warnings in 2002. Moreover, only 45% received warnings from government sources. By contrast, in 2013, about 83% of respondents received at least one flood warning, and 78% were informed by official sources.
During the flood in 2002, 84% of households took at least one mitigation measure, whereas during the flood in 2013, 93% of households took at least one emergency measure.
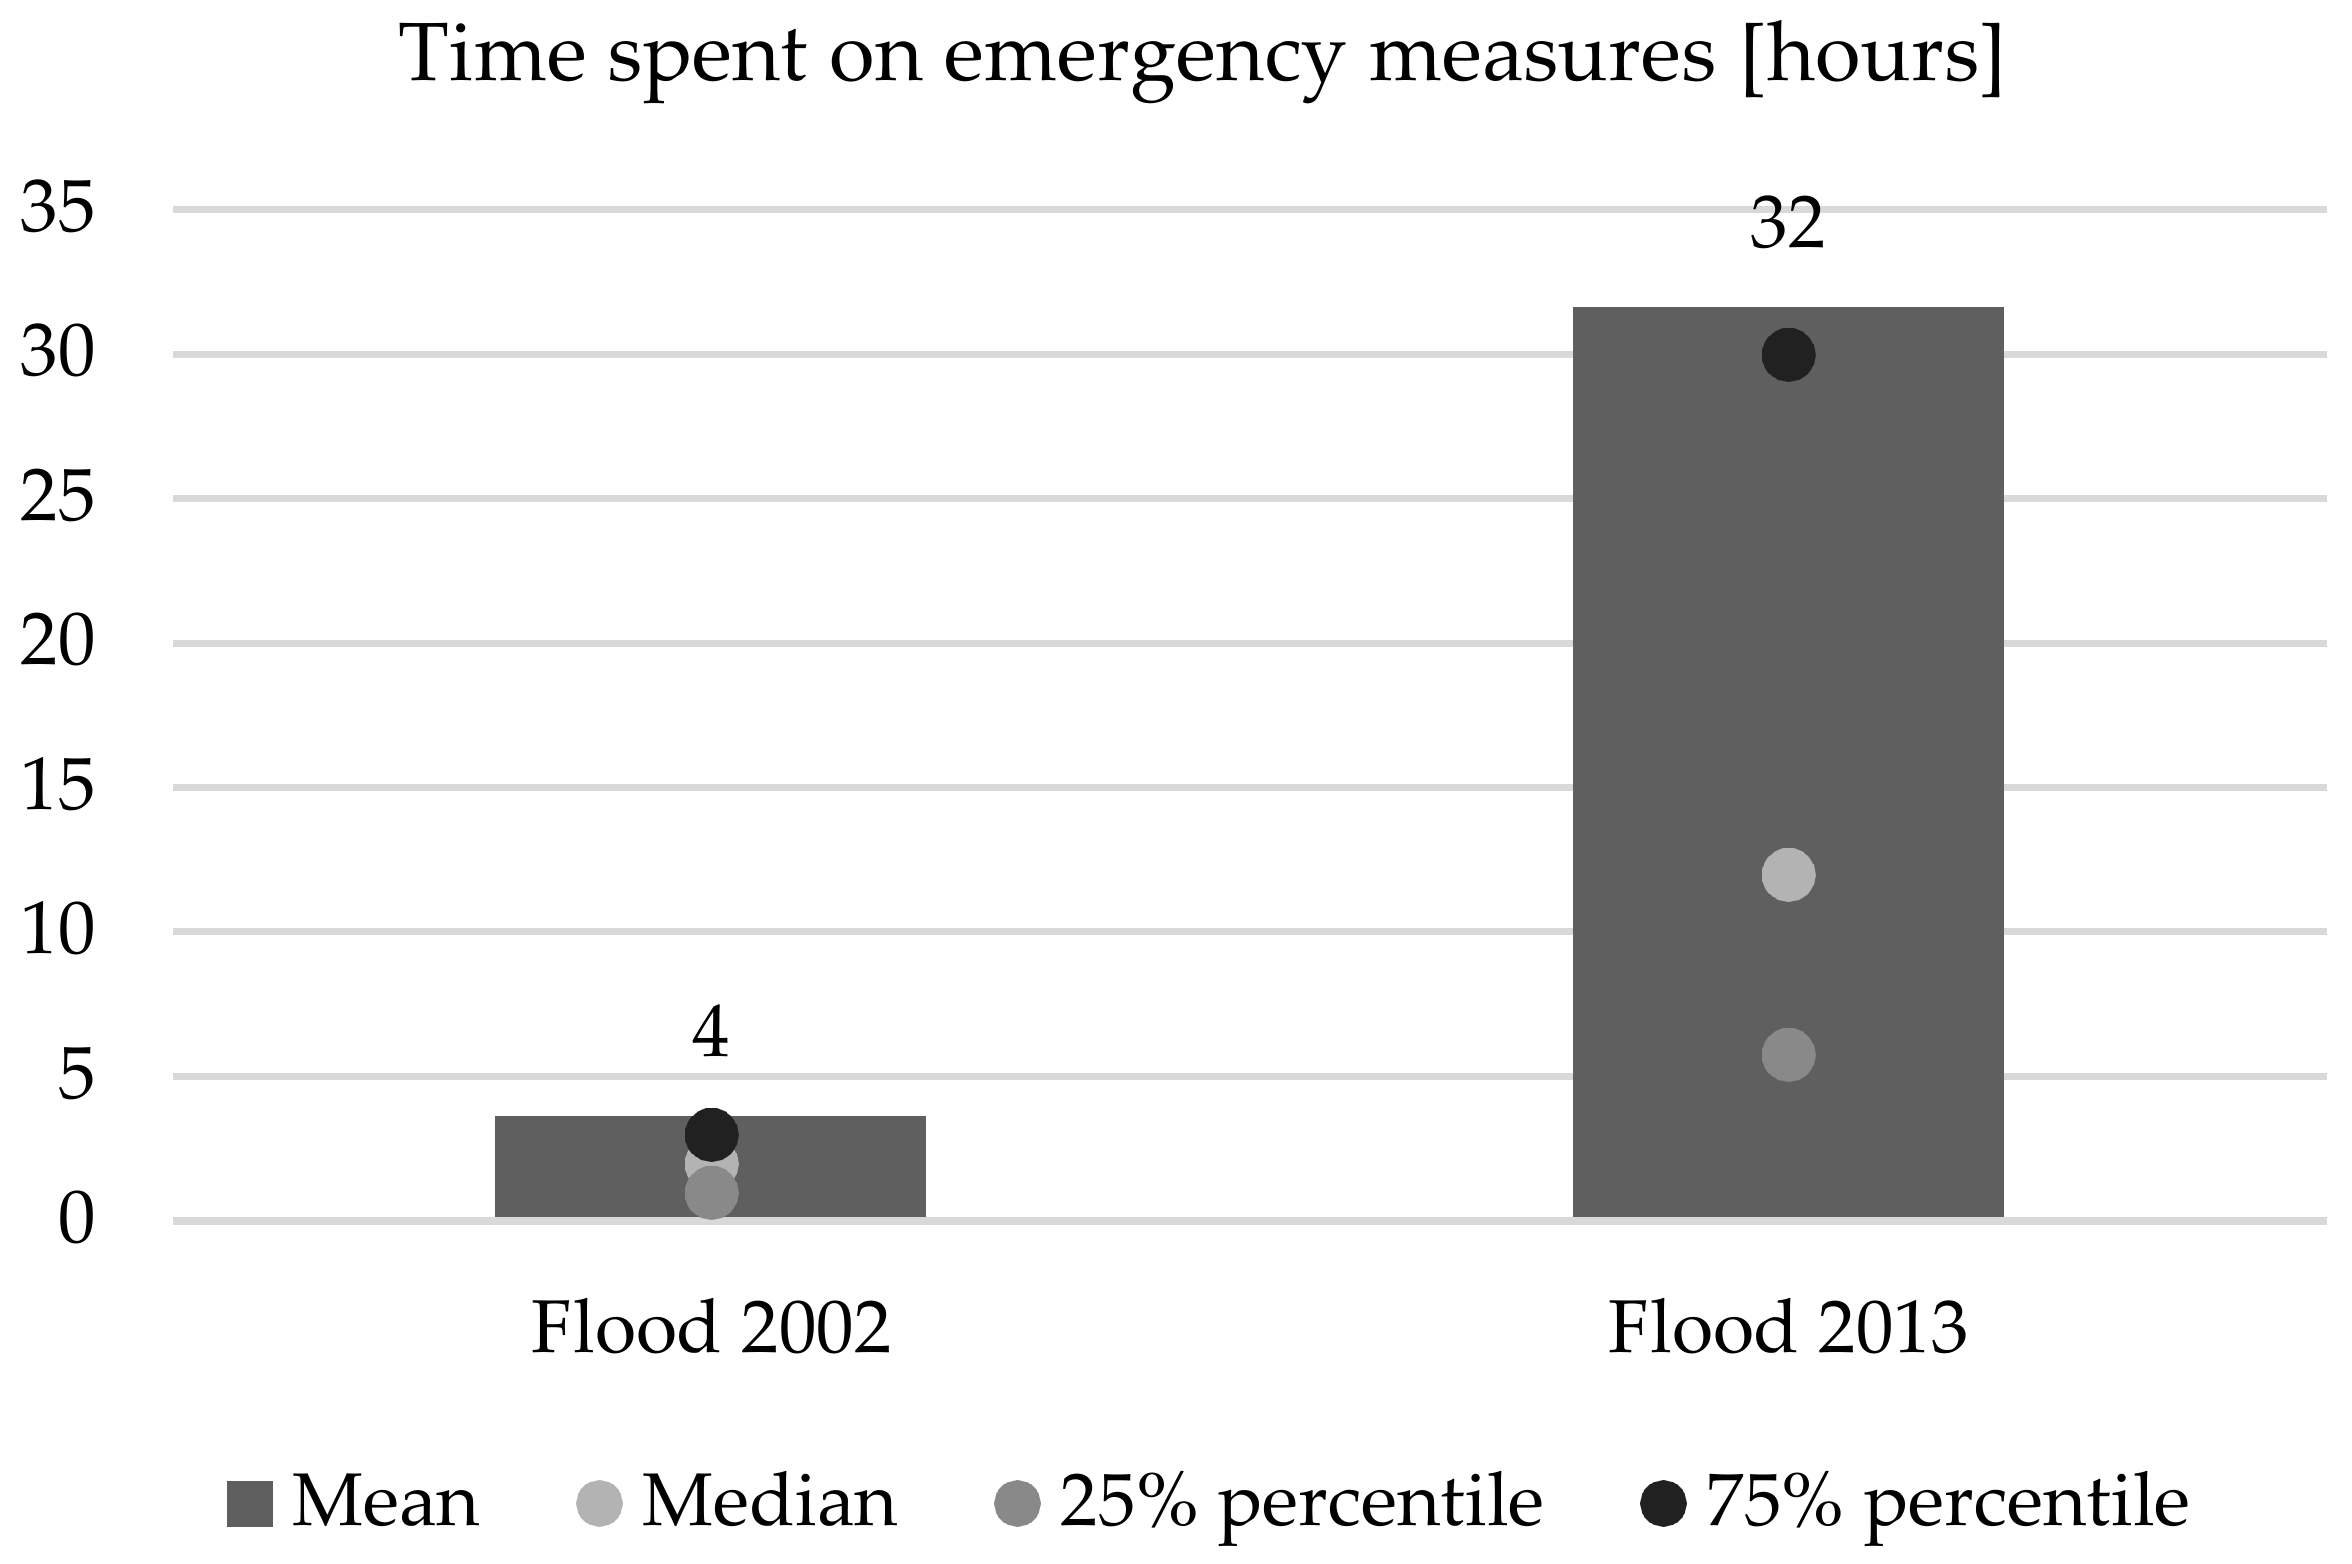
Another variable that was analyzed, collected through the household interviews (
Appendix A), was the time spent on executing emergency measures during both of the floods as a potential result of a prolonged warning period. All the statistics (
Figure 5) show that the time spent on emergency measures during the 2013 flood event was much more than in 2002. This impact comes at a comparatively low cost of the early warning system, as described in
Section 3.2.3., subsection on the local early warning system.
3.2.6. Disaster Damages and Impacts
This forensic analysis includes both direct and indirect impacts, focusing on the residential sector and the population, respectively. Regarding direct impacts, the choice of studying the residential sector was motivated by the important share that these damages represented in both the 2002 and 2013 floods in Saxony (
Figure 6). In 2002, impacts to the residential sector in Saxony represented 36% of the total direct damages (second to infrastructure damage, with only a 1.6% difference) [
33]. In 2013, this share amounted to 22.7%, the most damaged sector after infrastructure [
34]. Concerning indirect impacts, the analysis focuses on flood impacts on population dynamics in terms of migration in and out of the flooded area.
Direct Impacts: Damage to the Residential Sector
This section compares the damage in the housing sector caused by the 2002 and 2013 floods in order to examine their causes.
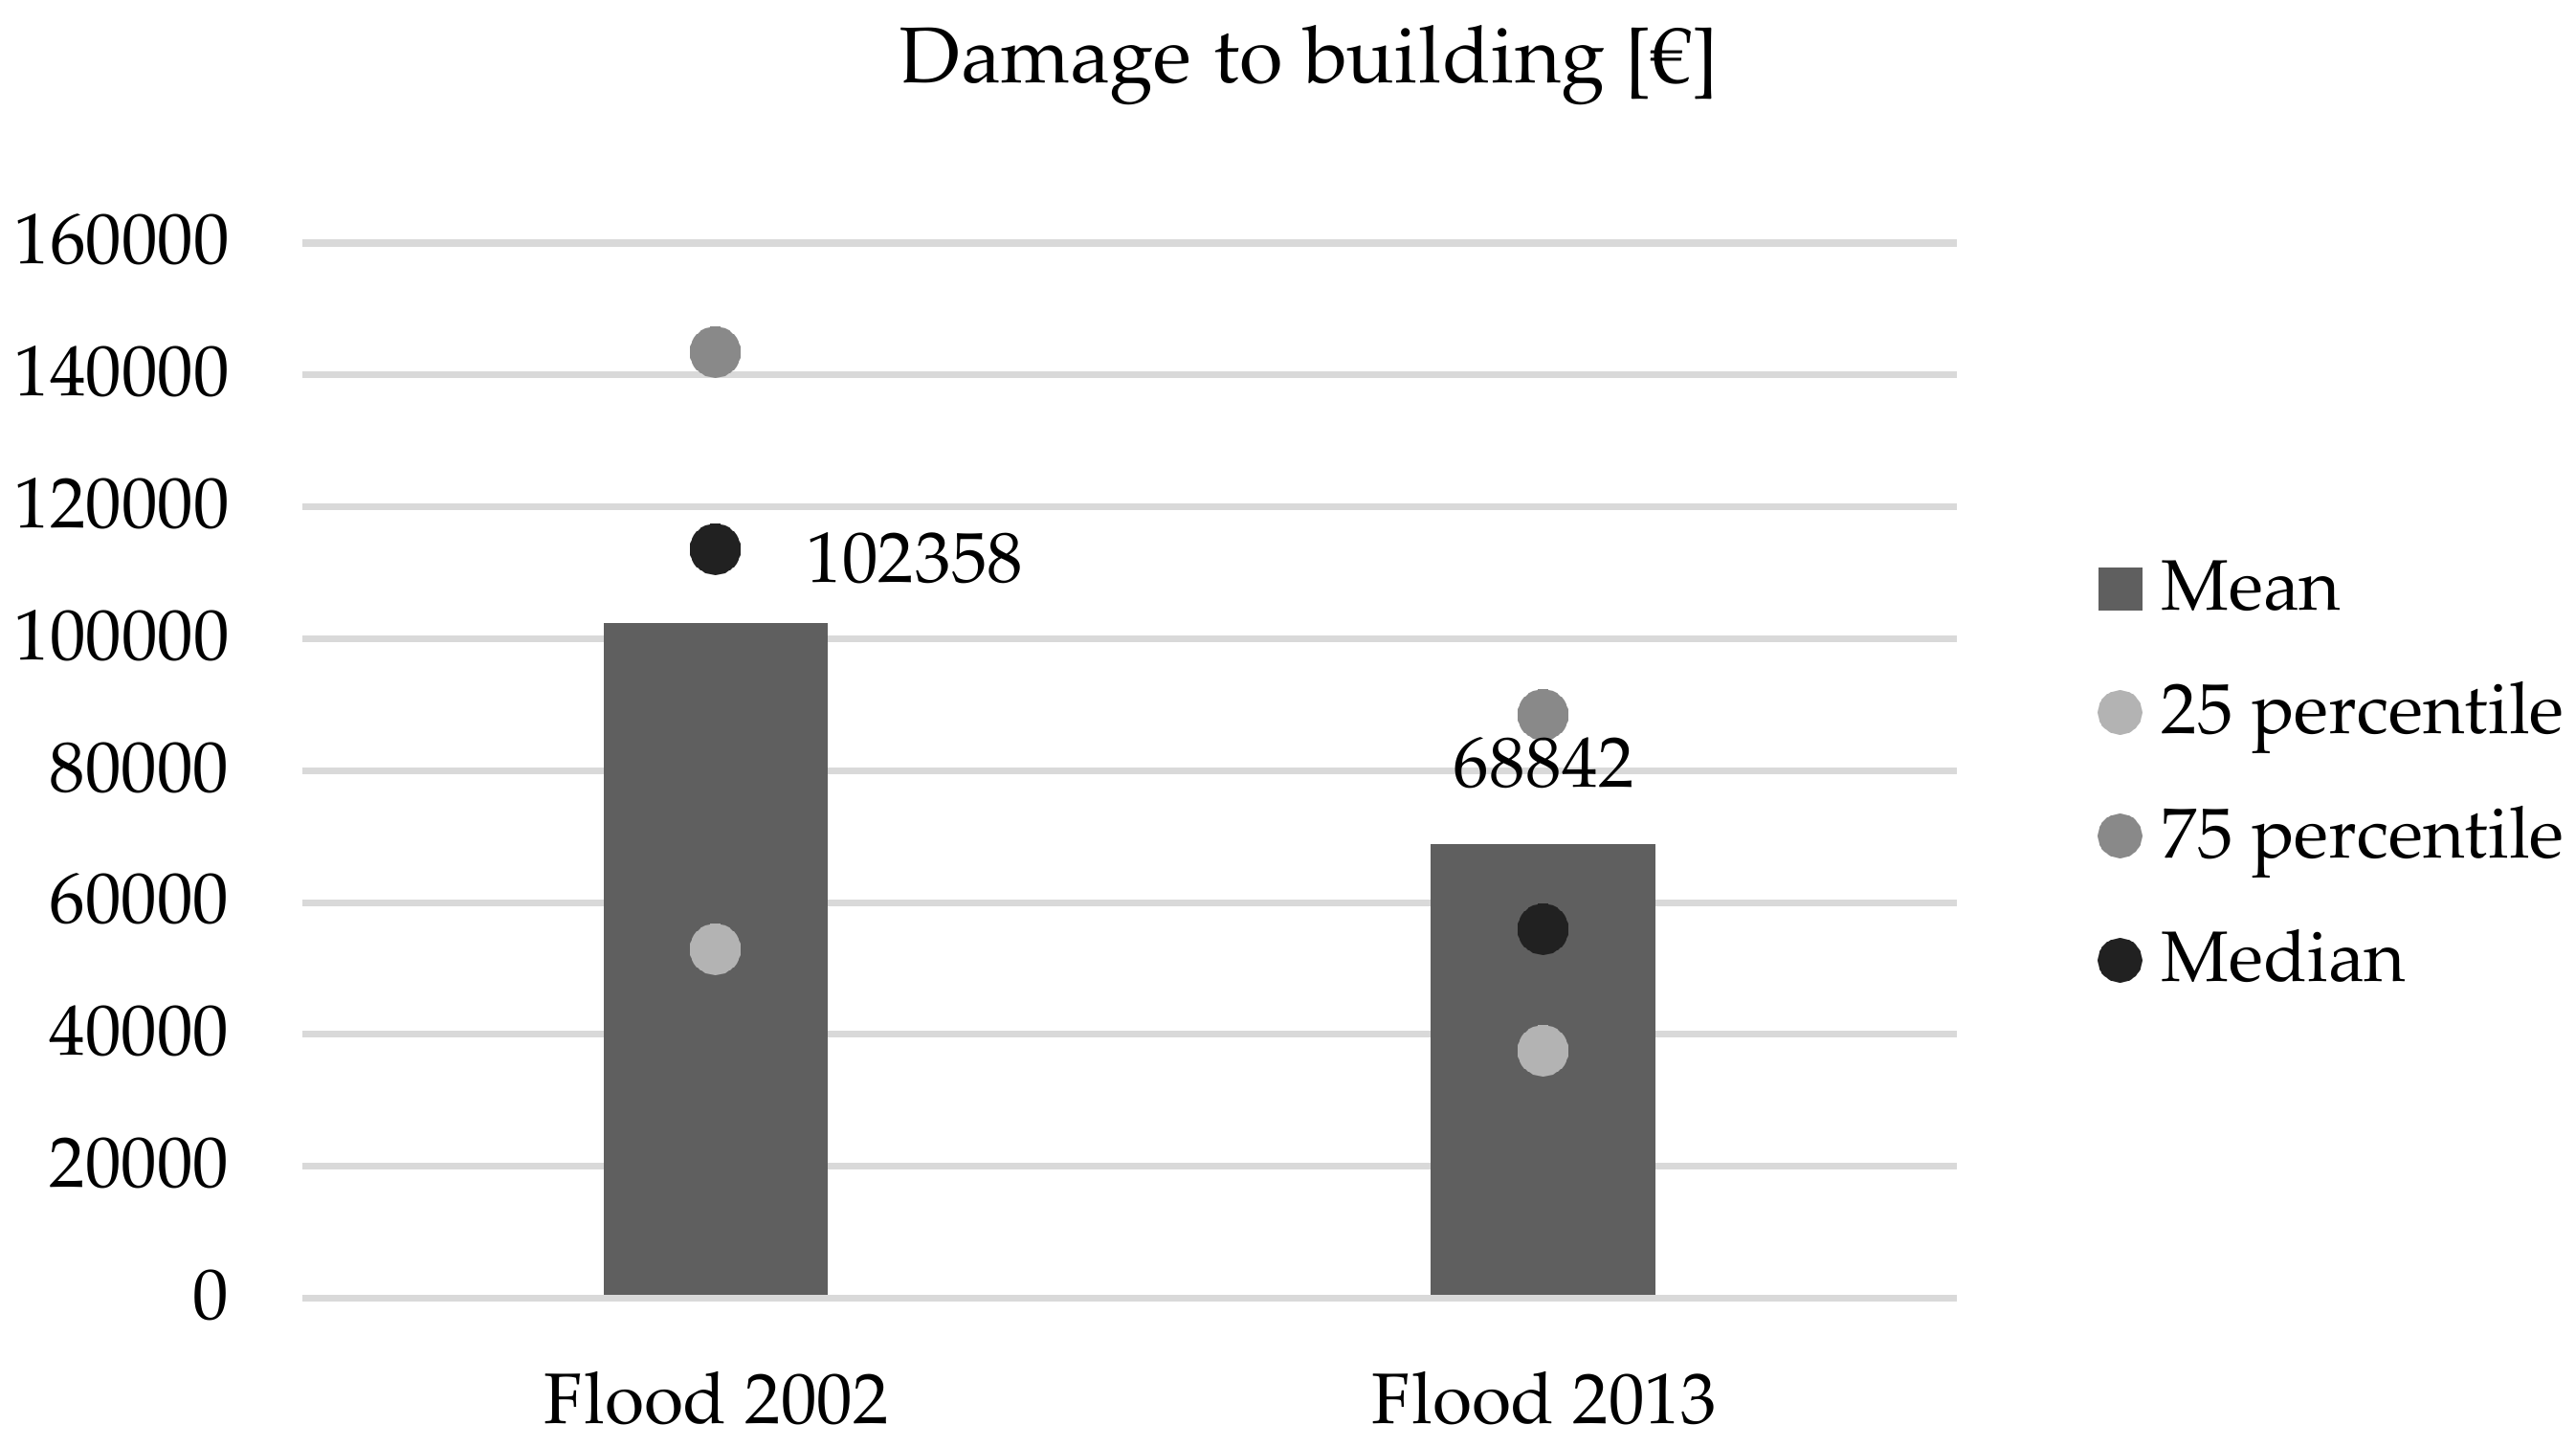
Figure 7 shows the building damage, i.e., the damage to all non-movable parts of the building, such as structure, surfaces, heating, and gas and water supply systems, presented in monetary values for both flood events (2002 values have been corrected for inflation).
To sum up, building damages in 2013 are significantly less than those in 2002 as we would expect from the previous comparison of the hazard (lower in 2013), the exposure (same in both years), and the vulnerability (lower in 2013) of the inner city of Grimma. These findings are in much line with previous research [
21,
35].
Indirect Impacts: Population Dynamics
The objective of this part of the analysis is to understand if the floods caused impacts on the population dynamics. To this end, we analyze residents’ migration in and out of the flooded area before and after both flood events.
Figure 8 shows the population inflows and outflows for different years for Grimma’s city center. Data for the overall Grimma municipality were also analyzed to check if trends in the city center were different with respect to the rest of the area. In both events, the flooded areas coincided with the city center.
Figure 8 shows a positive trend in population inflows to the city center from 2003, whereas in 2013 and 2014, there is a drop in inflow values. The control data from Grimma municipality shows opposite tendencies, with a negative trend in inflows after 2002 and a positive one from 2012. Population outflows in the city of Grimma dropped in 2002 and remained lower than in previous years until 2006 (while they remained almost constant in the municipality). After 2006, this trend in the city center reversed and outflows started behaving as in the whole municipality. In 2013, there is a peak in population outflows, the highest value since 1997, and then in 2014, there is again a drop to previous levels.
In a questionnaire survey conducted in the city of Grimma in 2014 [
36], more than one third of the respondents (382 from a population of 990) reported that they had to bear the consequences of flooding for the second time. It was these multiple-affected households that bore the main psychological burden of the 2013 floods. They felt particularly affected and had more severe economic, health, and psychological consequences than those affected for the first time. They also reported that they were playing with the idea of giving up their previous homes and leaving. In the group of people who were multiple impacted, 52% were inclined to move away from Grimma, while 29% of those who were first affected in 2013 were still considering doing so.
To sum up, after the 2002 flood, the population in the city center grew due to the arrival of new residents, while, at the same time, less people moved out. Instead, after the 2013 flood, the population in the city center decreased, with a peak of residents moving out and less moving in. This finding is not intuitive—more migration (outflows) after a less intense flood with less damages. This can only be explained by factors in the aftermath: recovery and reconstruction, and the effect of an unexpected sequence of floods on socio-economic resilience, and people’s attitude to risk, as we will discuss below.
3.2.7. Disaster Recovery and Reconstruction
The flood of 2002 attracted a great deal of media interest. Already on 14 August, the then Federal Chancellor Gerhard Schröder visited the center of Grimma together with the former Saxon Prime Minister Georg Milbradt and numerous journalists to get an idea of the extent of the damage [
24]. The floods of 2002 took place three weeks before the forthcoming German national elections, and accordingly, many public funds were made available for compensation. The federal government and the Free State of Saxony paid the affected citizens of Grimma very high amounts of compensation, but considerable donations were also made (13 million euros) [
24].
In 2013, the situation was completely different. From the first days of the flooding, the mayor, still Mr Berger, expressed his concern about the reconstruction of the city. On 3 June 2013, he asked for “the help of all” and declared that, after the second flood, people had been devastated in little more than 10 years. He was skeptical about the aid they would receive, both from outside and inside. A bank account for donations was opened on 3 June. Ten days later, Mayor Berger said in an interview that he wanted help with reconstruction and said that the businesses affected did not need loans but grants that did not have to be repaid. Many residents were still paying off loans after the 2002 floods, and many were unable to afford another loan even at low interest rates.
The general lack of insurability of buildings and businesses in the flood-prone areas of Grimma has had a painful effect on private companies, most of which were founded after reunification (1989). Due to the policy of the insurance industry not to offer insurance in areas with a return period of less than 10 years of flooding, they could not acquire insurance even if they expressed an interest. This led to sporadic migration of companies after 2013. Paper manufacturer Martin Röhrenbeck complained in an interview, “I am looking for a new location, higher up. After all, the insurance company probably won’t pay for the next flood. What will remain will be empty halls. Then 150 years of paper processing will come to an end on the banks of the Mulde.” In 2019, the factory halls were moved from Grimma-Golzern on the banks of the Mulde to the far area off Mutzschen near Grimma. On the other hand, 50 percent of households in Grimma were insured against flood losses, which for historical reasons was significantly higher than the German average (10% for household contents and 4% for residential buildings in 2002 according Kreibich et al. [
37]). In the eastern German Länder, the density of insurance against damage caused by natural hazards was much higher, as flood damage was generally included in the household insurance of the former GDR. Many people in eastern Germany still had old contracts in 2002. Individuals who do not have insurance were asked in 2010 about the reasons [
24]. Almost half of the uninsured (47%) wanted to change this situation. Thirty per cent of those who were not insured said they had tried to get insurance but did not get it for their place of residence. The rest (17%) found the available offers too expensive. In summary, the insurance situation before and after the floods of 2002 was almost unchanged for the majority of private households and almost all private companies in Grimma’s city center—they were exclusively dependent on state aid. As a consequence, the different availability of state aid in 2013 compared to 2002 had full effect, i.e., was not mitigated by private insurance.
This difference in the availability of financial assistance in both flooding events is also reflected in the data collected at household level when looking at the financial assistance as a percentage of total damage (
Table 5). The ratio of the financial aid with respect to the total damage by household in 2002 is almost twice the one of 2013.
Reconstruction began relatively quickly after the 2002 floods and was completed by 2004. It significantly improved the condition of the buildings compared to the pre-flood condition [
38]. However, it is not clear whether this improvement was merely aesthetic or included a reduction in susceptibility to flooding. In a 2005 interview, Mr Guhlemann, Director of Grimma’s Civil Engineering Department, explained that efforts had been made to convince residents to rebuild their homes with flood-resistant materials but he did not know whether these efforts had been successful.
Concerning the restoration after the flood of 2013, all electricity, gas and water supplies were restored and the city cleaned up within the first five days after the flood. The cleaning work involved the removal of 35,000 cubic meters of waste. There is no data on the rebuilding period. However, our own field research in June 2017 showed that almost all the buildings in downtown Grimma were in perfect condition, and no signs of flooding were visible except for some flood marks applied by the owners.
3.2.8. Lessons Learned and Recommendations
The examination of the building damage during the floods of 2002 and 2013 shows that the building damage was influenced—much in line with previous research [
21,
35]—by the hazard intensity (water depth), the warning time, the measures taken during the emergency situation and the preventive measures taken by the households. The monetary damage to buildings in 2002 was on average 25% higher than in 2013, which can be attributed primarily to the considerable difference in water depths in both events. The warning time, the time spent on emergency response, and the proportion of households that took both emergency and prevention measures were also significantly higher in 2013.
The analysis also shows a much higher percentage of households taking prevention measures, with twice the amount of measures taken before the 2013 flood with respect to 2002. This indicates a positive change in private disaster risk reduction.
The important difference in the percentage of households that received official warnings and responded with efforts on emergency measures, and in the amount of warning time in 2002 and 2013, indicate that the new local early warning system was cost-effective.
The recovery conditions for both flood events were very different, as the 2002 flood took place weeks before the German national elections. This is reflected in the availability of financial aid at the household level, where the sum of compensations received by households in 2013 represents only 24% of the total damage, whereas in 2002, it was almost twice as high, at 46%. This effect was not mitigated by private insurance. The impact of this lack of resources on recovery and reconstruction is not entirely clear. Data on the recovery time for the 2013 flood are not available, but field studies have shown that, by 2017, almost every building had been repaired.
The positive balance of population migration and the increase in inflows after 2002 confirm the fact that the city center became more attractive after the refurbishment and attracted new inhabitants. Another important factor was the availability of financial support and a positive image in the national and international media. The flood of 2013 had the opposite effect and led to an emigration from the city center due to a lack of financial support, a negative attitude of the population and the mayor, as well as a negative image in the media (
Appendix B).
Based on these experiences, various measures can be proposed for the DRR to improve Grimma’s current situation. One is the promotion of private flood protection insurance to increase its market penetration and improve reconstruction conditions for residents and businesses. This would prevent emigration from the city center in the event of a further major flooding and reduce the impact of fluctuating ad-hoc state aid on the resilience of the population and the local economy. It is also recommended to promote measures to reduce the physical vulnerability of buildings, as one of the lessons learned shows that it played an effective role in loss prevention in 2013. Although Grimma’s local early warning system appears to have worked effectively in 2013, 17% of households surveyed still did not receive any warnings. In the coming events, therefore, work should continue on informing and involving more residents to avoid households being in danger without official warnings.
4. Conclusions
In addition to the lessons learned and recommendations, the previous analysis also allows us to answer to the initial question, how much does the sequential application of disaster forensics contribute to the identification of the causes of disasters impacts?
The answer to this question involves two distinct aspects: the repeated application of disaster forensics vs. the application of disaster forensics to a sequence of floods in the same geographic area. “Sequential” in the latter case means repeated, but mainly in the order of events, i.e., taking into account that one event occurred after the other. In a sequence of events, the impacts of the second event are affected by (and not independent of) the impacts of the first. In other words, the output conditions of the first event determine the input conditions of the successive event.
The analysis of the direct damages to the buildings suggests that the repeated application of disaster forensics allows discerning the main drivers of damage (e.g., hazard intensity), whereas in this case study, the sequential aspect (i.e., one event following the other) plays a less significant role in the identification of impacts. However, this is mostly explained by the fact that after the first flood all the town and its buildings were repaired. In other cases, repeated events (such as summer floods and winter frosts) can be seen to increase the physical vulnerability of the affected buildings, making the “sequential aspect” also more relevant for the analysis of direct damages.
Instead, sequentiality is key for understanding cause–effect relationships regarding socio-economic impacts, as shown by the analysis of the indirect impacts on the population. Emigration after the 2013 flood event can only be understood through a sequential approach by considering population dynamics, economic resources availability, and population’s attitude in the sequence of events. The population’s economic vulnerability increased after the 2002 flood when businesses and residents had to cover part of the damages themselves and in some cases take out loans. When the 2013 flood hit, some residents were still making loan payments from the previous flood, which, in conjunction with low availability of financial aid, made recovery difficult.
A similar situation regards the mayor and the population’s attitude towards the flood and the reconstruction. It was in some way positive in 2002 due to the availability of funds, donations, and media attention that boosted recovery. In 2013, after being severely hit twice in almost a decade, even the mayor questioned the residents’ capacity to recover. As regards the disaster forensics approach, the proposed sequential analysis methodology has proven effective in enhancing the understanding of cause–effect relationships in disasters and improving disaster risk management for local authorities through effectively “learning” from the causes and impacts of two closely consecutive floods. However, the main contribution of the sequential approach is the recognition of the interconnectedness and spill-overs in socio-economic impacts of the repeated occurrence of rare extremes, in the sense of the proverb “once is only once, but twice is a disaster.”
Author Contributions
Conceptualization, M.T.M. and R.S.; Formal analysis, M.T.M. and R.S.; Investigation, M.T.M.; Methodology, M.T.M. and R.S.; Supervision, R.S.; Writing—original draft, M.T.M.; Writing—review & editing, R.S.
Funding
This research received no external funding.
Acknowledgments
The Department of Urban Studies (DAStU), Politecnico di Milano and the European project IDEA (Improving Damage assessments to Enhance cost-benefit Analyses) coordinated by Scira Menoni, which funded Mendoza’s PhD scholarship have to be acknowledged as they made possible part of the work that originated this publication. The authors want to thank (1) the Municipality of Grimma and the Office of the Mayor for their availability and responsiveness in providing information on Grimma and the flood events; (2) the University of Potsdam, the German Research Centre for Geosciences and Deutsche Rückversicherung (especially Heidi Kreibich of GFZ) for providing the data on the CATI in Grimma; (3) Kai Schröter for inviting us to present our work on the EGU 2018 special session on natural hazard event analyses; and (4) Daniela Siedschlag, UFZ, and Scira Menoni, Politecnico di Milano, for their critical reflections at various stages of our work.
Conflicts of Interest
The authors declare no conflict of interest.
Appendix A
Table A1.
Data and methods.
Table A1.
Data and methods.
| Data | Methods | Assumptions/Measurement | Source |
|---|
| Precipitation | 6-hour and 12-hour maximum [mm] | Analogue rain gauge (Heilmann-type) | ([26], in German) |
| Return period | Univariate | Pearson Type III and Gumble Distribution | ([26], in German) |
| Soil moisture | Weighted average of antecedent precipitation | 5-day pre-precipitations (weighted by 0.5); pre-precipitation of 6 to 10 days before (weighted by 0.3) / pre-precipitation over 11 - 30 days before (weighted by 0.2) | ([26], in German) |
| Discharge | Peak discharge at nearest gaging station (Golzern) [m3/s] | Stationary discharge measurement with ultrasound | ([26], in German) |
| Contaminants | Computer Assisted Telephone Interview (CATI) | Q.: Has your property been polluted by the following substances? Chemicals, paints, varnishes, pesticides, small amounts of engine oil, sewage or faeces, fuel oil, gasoline? | University of Potsdam, GFZ and Deutsche Rück |
| Water depth | CATI | Q.: How high was the water on the outside of the house? [Above the top edge of the terrain.] | University of Potsdam, GFZ and Deutsche Rück |
| Flood duration | CATI and IKSE (to validate responde) | Q.: How many hours did the water stand in the house in total? [Time until the water had drained off, pumped off and out of the house again.] | IKSE ([28], German); University of Potsdam, GFZ and Deutsche Rück |
| Flood maps | Internet | Shapefiles with flooded areas in 2002 and 2013, based on aerial photographs | Saxony State Office for Environment, Agriculture and Geology |
| Warning time | CATI | Q: How many hours before the flooding occurred did the warning reach you or did you yourself become aware of the danger? | University of Potsdam, GFZ and Deutsche Rück |
| Prevention measures | CATI | One out of 1-8: (1) Movable contents taken to upper floors; (2) Avoid valuable, permanently installed interior fittings in lower floors; (3) Move the heating system and/or the electrical supply systems to higher floors; (4) Change the heating system type or provide the oil tank with flood protection; (5) Improvement of the basement and building hydraulic stability; (6) Use of valves to prevent backflow; (7) Mobile elements that prevent water from entering the building such as sands bags; (8) Water pumps installation. | University of Potsdam, GFZ and Deutsche Rück |
Appendix B
Table A2.
Interview evidence.
Table A2.
Interview evidence.
| Interviewee | Date | Source | Question | Answer |
|---|
| Mayor Berger | 10th June 2006 | Personal interview (recorded) | At the rafting place there is the construction site of the police direction Westsachsen. What do you think of this measure? | “The hazard situation is not worse or better than in the inner city area. (...) For the city of Grimma it is a huge gain. 300 jobs are created, we are very happy about it. It was certainly also a sign at that time from the state government that they didn’t let Grimma down. Because how could I have made it plausible to the Grimmaers that they should move back into their houses and the state government gives up their plans. Then there would be no more trust.” |
| Mayor Berger | 3rd June, 2013 | N-TV | What’s the sentiment like in town? | “Those who are affected don’t see it any more; those who have given up are finished, really finished. For ten years they have rebuilt Grimma with great support. And after the city has virtually resurrected, it is being flattened again, possibly worse than before.” |
| Mayor Berger | 3rd June, 2013 | N-TV | But why does it keep hitting Grimma? | “Flood protection, the plant of the Free State of Saxony, is under construction. But it is not finished. That is why we have now hit the bull’s eye here.” |
| Mayor Berger | 14th June 2013 | LVZ | What do you demand from the regional government? | “Affected traders do not need loans, but subsidies, which do not have to be repaid. Many would not benefit from a loan at all, they are still bearing the burdens of the 2002 flood” |
| Dr. Axel Bobbe, Head of Saxony’s Dams Administration (LTV) | 13th June 2013 | LVZ | Could Grimma have been saved then? | “Here we have the problem that individual tribal warriors - monument preservationists and private individuals who felt disturbed - have stayed with us for at least two to three years. It is possible that we would already have finished today if it had not been for this.” |
| Dr. Axel Bobbe, Head of Saxony’s Dams Administration (LTV) | 4th June 2013 | Spiegel Online | Responding to criticism of the “eternal construction site” (flood protection wall in Grimma) | “For years we have been lost in discussions about the protection of historical monuments in Grimma. Many authorities and residents did not want a wall in front of the city. We were faced with two strong citizens’ initiatives with large banners that almost stoned us to death.” |
| Mr. Guhlemann, Directot of Grimma’s Civil Engineering | 20th Dec. 2005 | Personal interview (recorded) | Why do you think Grimma had no HW protection in historical times? | “The communities and residents are not supported in their own provision, no help is offered for them.” |
| Mr. Guhlemann, Directot of Grimma’s Civil Engineering | 20th Dec. 2005 | Personal interview (recorded) | “During floods, we also have the effect that the groundwater and the sewage system flood the city first. In the past, flood protection was certainly not possible.” |
| Paper manufacturer Martin Röhrenbeck (managing director) | 7th June 2013 | Deutsche Fluthilfe | Some don’t want to build again on the river | “I am looking for a new location, higher up. After all, the insurance company probably won’t pay for the next flood. What will remain will be empty halls. Then 150 years of paper processing will come to an end on the banks of the Mulde.” |
| Stanislaw Tillich, PM of Saxony | 4th June 2013 | Spiegel Online | (During a visit to Grimma) | “I am inclined to override citizens’ participation in such an important project.” |
References
- UNDRR. Global Assessment Report on Disaster Risk Reduction; United Nations Office for Disaster Risk Reduction (UNDRR): Geneva, Switzerland, 2019. [Google Scholar]
- Wallemacq, P.; House, R. UNISDR and CRED Report: Economic LOSSES, Poverty & Disasters (1998–2017); CRED and UNISDR: Brussels, Belgium, 2018; Available online: https://www.unisdr.org/files/61119_credeconomiclosses.pdf (accessed on 18 October 2019).
- Barredo, J. Normalised flood losses in Europe: 1970–2006. Nat. Hazards Earth Syst. Sci. 2009, 9, 97–104. [Google Scholar] [CrossRef]
- IPCC, Intergovernmental Panel on Climate Change. A Special Report of Working Groups I and II of the Intergovernmental Panel on Climate Change. In Managing the Risks of Extreme Events and Disasters to Advance Climate Change Adaptation; Field, C.B., Barros, V., Stocker, T.F., Qin, D., Dokken, D.J., Ebi, K.L., Mastrandrea, M.D., Mach, K.J., Plattner, G.K., Allen, S.K., Eds.; Cambridge University Press: Cambridge, UK; New York, NY, USA, 2012. [Google Scholar]
- Mohleji, S.; Pielke, R.A., Jr. Reconciliation of Trend in Global and Regional Economic Losses from Weather Events: 1980–2008. Nat. Hazards 2014, 15. [Google Scholar] [CrossRef]
- GFDRR, Global Facility for Disaster Risk Reduction. The Making of a Riskier Future: How Our Decisions Are Shaping Future Disaster Risk; Global Facility for Disaster Reduction and Recovery: Washington, DC, USA, 2016; Available online: https://www.gfdrr.org/sites/default/files/publication/Riskier%20Future.pdf (accessed on 18 October 2019).
- Paprotny, D.; Sebastian, A.; Morales-Nápoles, O.; Jonkman, S. Trends in flood losses in Europe over the past 150 years. Nat. Commun. 2018, 9, 1985. [Google Scholar] [CrossRef] [PubMed]
- UNISDR. Sendai Framework for Disaster Risk Reduction 2015–2030; UNISDR: Geneva, Switzerland, 2015; Available online: https://www.unisdr.org/files/43291_sendaiframeworkfordrren.pdf (accessed on 18 October 2019).
- Brata, A.G. The Socio-Economic Impacts of Natural Disasters: Empirical Studies on Indonesia; VU Universiteit Amsterdam: Amsterdam, The Netherlands, 2017. [Google Scholar]
- The World Bank & United Nations. Natural Hazards, Unnatural Disasters: The Economics of Effective Prevention; The International Bank for Reconstruction and Development/The World Bank: Washington, DC, USA, 2010. [Google Scholar]
- UNISDR. Terminology on DRR. 2009. Available online: https://reliefweb.int/sites/reliefweb.int/files/resources/Full_Report_2010.pdf (accessed on 29 September 2019).
- German Committee for Disaster Reduction (DKKV). Detecting Disaster Root Causes—A Framework and an Analytic Tool for Practitioners; DKKV Publication Series 48: Bonn, Germany, 2012. [Google Scholar]
- Burton, I. Forensic disaster investigations in depth: A new case study model. Environment 2010, 52, 36–41. [Google Scholar] [CrossRef]
- Integrated Research on Disaster Risk (IRDR). Forensic Investigations of Disasters: The FORIN Project (IRDR FORIN publication No. 1); IRDR: Beijing, China, 2011. [Google Scholar]
- Stefanidis, S.; Stathis, D. Assessment of flood hazard based on natural and anthropogenic factors using analytic hierarchy process (AHP). Nat. Hazards 2013, 68, 569–585. [Google Scholar] [CrossRef]
- Kazemi Rad, L.; Haghyghy, M. Integrated Analytical Hierarchy Process (AHP) and GIS for Land Use Suitability Analysis. World Appl. Sci. J. 2014, 32, 587–594. [Google Scholar]
- Chandio, I.A.; Matori, A.N.B.; Khamaruzaman, B.; WanYusof, K.B.; Talpur, M.A.H.; Balogun, A.L.; Damo, U.L. GIS-Based analytic hierarchy process as a multicriteria decision analysis instrument: A review. Arab. J. Geosci. 2012, 6, 3059–3066. [Google Scholar] [CrossRef]
- Oliver-Smith, A.; Alcántara-Ayala, I.; Burton, I.; Lavell, A. Forensic Investigation of Disasters (FORIN): A Conceptual Framework and Guide to Research (IRDR FORIN publication No.2); Integrated Research on Disaster Risk IPO: Beijing, China, 2016. [Google Scholar]
- Venkateswaran, K.; MacClune, K.; Keating, A.; Szonyi, M. The PERC Manual, Learning from Disasters to Build Resilience: A Simple Guide to Conducting a Post Event Review; Zurich Insurance Company Ltd.: Zurich, Switzerland, 2015. [Google Scholar]
- Center for Disaster Management and Risk Reduction Technology (CEDIM). CEDIM Annual Research Report 2012—Focus on Forensic Disaster Analysis in Near Real Time. In Center for Disaster Management and Risk Reduction Technology; CEDIM: Potsdam, Germany, 2013; ISBN 97883898087808881. [Google Scholar]
- Thieken, A.; Müller, M.; Kreibich, H.; Merz, B. Flood damage and influencing factors: New insights from the August 2002 flood in Germany. Water Resour. Res. 2005, 41. [Google Scholar] [CrossRef]
- Thieken, A.; Bessel, T.; Kienzler, S.; Kreibich, H.; Müller, M.; Pisi, S.; Schröter, K. The flood of June 2013 in Germany: How much do we know about its impacts? Nat. Sci. Discuss. 2016, 16, 1–57. Available online: https://www.nat-hazards-earth-syst-sci.net/16/1519/2016/nhess-16-1519-2016.pdf (accessed on 18 October 2019).
- Menoni, S.; Molinari, D.; Ballio, F.; Minucci, G.; Mejri, O.; Atun, F.; Berni, N.; Pandolfo, C. Flood damage: A model for consistent, complete and multipurpose scenarios. Nat. Hazards Earth Syst. Sci. 2016, 16, 2783–2797. [Google Scholar] [CrossRef]
- Siedschlag, D. Hochwasser & Eigenvorsorge–Untersuchung von Einflussfaktoren Persönlicher Schutzmassnahmen. Master’s Thesis, UFZ, Leipzig, Germany, 2010. UFZ-Bericht 03/2010 (In German). [Google Scholar]
- Ramirez, A.I.; Herrera, A. Forensic Hydrology. In Forensic Analysis—From Death to Justice; Suresh Shetty, B., Ed.; IntechOpen: London, UK, 2016; Available online: https://www.intechopen.com/books/forensic-analysis-from-death-to-justice/forensic-hydrology (accessed on 18 October 2019). [CrossRef]
- Schumann, A.; Fischer, B.; Büttner, U.; Bohn, E.; Walther, P.; Wolf, E. Die größten Hochwasser im Einzugsgebiet der Mulde im Meteorologisch-Hydrologischen Vergleich. Schriftenreihe; Sächsisches Landesamt für Umwelt, Landwirtschaft und Geologie (LfULG): Dresden, Germany, 2016; Heft 18/2016; (In German). Available online: https://publikationen.sachsen.de/bdb/artikel/26907/documents/37540 (accessed on 18 October 2019).
- Saxony State Office for Environment, Agriculture and Geology-Sächsisches Landesamt für Umwelt, Landwirtschaft und Geologie (LfULG). 2017. Available online: https://www.umwelt.sachsen.de/umwelt/wasser/10002.htm?data=hw2002 (accessed on 22 September 2017).
- IKSE Internationale Kommission zum Schutz der Elbe. Dokumentation des Hochwassers vom August 2002 im Einzugsgebiet der Elbe. 2004. Available online: https://www.ikse-mkol.org/fileadmin/media/user_upload/D/06_Publikationen/02_Hochwasserschutz/2004_IKSE-Dokumentation_Hochwasser_2002.pdf (accessed on 18 October 2019).
- Schanze, J.; Hutter, G.; Penning-Rowsell, E.; Nachtnebel, H.-P.; Meyer, V.; Werritty, A.; Harries, T.; Holzmann, H.; Jessel, B.; Koeniger, P.; et al. Systematisation, evaluation and context conditions of structural and Non-Structural measures for flood risk reduction. In FLOOD-ERA Joint Report; ERA-NET CRUE; CRUE Funding Initiative on Flood Risk Management Research: London, UK, 2008. [Google Scholar]
- Usmanov, B.; Nicu, I.C.; Gainullin, I.; Khomyakov, P. Monitoring and assessing the destruction of archaeological sites from Kuibyshev reservoir coastline, Tatarstan Republic, Russian Federation. A. case study. J. Coast. Conserv. 2018, 22, 417–429. [Google Scholar] [CrossRef]
- Howard, J. Managing global heritage in the face of future climate change: The importance of understanding geological and geomorphological processes and hazards. Int. J. Herit. Stud. 2013, 19, 632–658. [Google Scholar] [CrossRef]
- Romão, X.; Paupério, E.; Pereira, N. A framework for the simplified risk analysis of cultural heritage assets. J. Cult. Herit. 2016, 20, 696–708. [Google Scholar] [CrossRef]
- WWF. Rechtsanwaltskanzlei Wolfram Günther, Mitarbeit von Holger Seidemann, Büro für Umwelt und Planung Leipzig. Fünf Jahre nach der Elbeflut (Five years after the Elbe flood); WWF: Frankfurt am Main, Germany, 2007. [Google Scholar]
- German Committee for Disaster Reduction (DKKV). Das Hochwassser im Juni 2013: Bewährungsprobe für das Hochwasserrisikomanagement in Deutschland; DKKV-Schriftenreihe 53: Bonn, Germany, 2015. [Google Scholar]
- Penning-Rowsell, E.C.; Green, C. New insights into the appraisal of flood-alleviation benefits: (1) Flood damage and flood loss information. J. Chart. Inst. Water Environ. Manag. 2000, 14, 347–353. [Google Scholar] [CrossRef]
- Kuhlicke, C. Hochwasservorsorge und Schutzgerechtigkeit, Erste Ergebnisse Einer Haushaltsbefragung Zur Hochwassersituation in Sachsen, UFZ Discussion Papers, Department Stadt- und Umweltsoziologie, 15/2014; Helmholtz Centre for Environmental Research–UFZ: Leipzig, Germany, 2014. [Google Scholar]
- Kreibich, H.; Thieken, A.H.; Petrow, T.H.; Müller, M.; Merz, B. Flood loss reduction of private households due to building precautionary Measures–Lessons learned from the Elbe flood in August 2002. Nat. Hazards Earth Syst. Sci. 2005, 5, 117–126. [Google Scholar] [CrossRef]
- Meyer, V.; Priest, S.; Kuhlicke, C. Economic evaluation of structural and non-structural flood risk management measures: Examples from the Mulde River. Nat. Hazards 2011, 62, 301–324. [Google Scholar] [CrossRef]
© 2019 by the authors. Licensee MDPI, Basel, Switzerland. This article is an open access article distributed under the terms and conditions of the Creative Commons Attribution (CC BY) license (http://creativecommons.org/licenses/by/4.0/).


