Article

Willingness to Pay for More Sustainable Tourism Destinations in World Heritage Cities: The Case of Caceres, Spain

by
Carlos Jurado-Rivas
and
Marcelino Sánchez-Rivero
*
Department of Economics, University of Extremadura, 06006 Badajoz, Spain
*
Author to whom correspondence should be addressed.
Sustainability 2019, 11(21), 5880; https://doi.org/10.3390/su11215880
Submission received: 6 September 2019 / Revised: 21 October 2019 / Accepted: 22 October 2019 / Published: 23 October 2019
(This article belongs to the Special Issue Competitiveness, Sustainability and Tourism)

Abstract

:
Sustainable tourism management is becoming an increasingly important factor in the image of tourist destinations. Therefore, it is appropriate to consider the possibility of charging a premium price on certain tourism products or services in exchange for making them more sustainable. Generally, eco-friendly management of cultural heritage sites, and particularly World Heritage sites, along with protected natural areas, is essential for the image enhancement of tourist destinations. In line with these considerations, this paper aims to quantify the willingness to pay (WTP) an extra amount in order for certain tourism products and services to become more sustainable in a World Heritage city such as Caceres, Spain. By using the contingent valuation method, the average price increase that tourists visiting the city would be willing to pay for a double room in a hotel, a restaurant, entrance to a museum, or a taxi ride, all of which would become more sustainable services, has been estimated. In addition to the aggregate analysis, diverse average-comparison statistical techniques have been used in order to determine the possible influence of sociodemographic factors on the WTP for more sustainable products and services. Specifically, factors including the effect resulting from a tourist’s place of origin, gender, the year when the survey was conducted (through t-tests), and the effect of age and educational levels (through ANOVA tests) on the WTP for sustainability, have been analyzed. When considering all of the sociodemographic factors involved, notable statistical differences have been found. This implies that when a hypothetical increase in tourism prices for the purpose of financing public or private sustainability actions is considered, different segments of the tourism market should be taken into account, since it would not be appropriate to apply the same policy of price increases to all tourists equally.

1. Introduction

In 2017, the tourism industry represented 10% of the gross domestic product (GDP) of the entire world, and approximately 10% of the total number of employees. As significant as these figures are, they will increase even further in the future, as estimates show that the average growth rate of tourism worldwide from now until 2030 is expected to be 3.8% per year. If these forecasts are met, it will mean that more than 1.8 billion international tourists will cross the borders of the countries where they reside to enjoy tourist activities. Consequently, the environmental impact of tourism will increase substantially. Unsustainable production and consumption practices in the sector may generate not only environmental problems, but economic difficulties as well, since the competitiveness of the sector depends largely on the environmental quality of the territories in which these businesses are developed. Therefore, tourism faces a global challenge of considerable size in the medium and long-term in which sustainable consumption and production patterns become a first-level strategic objective in accordance with what is stated in Sustainable Development Goal 12 (SDG 12). Sustainable production and consumption in the field of tourism at the present time is so important that the World Tourism Organization [1] has published a report in order to integrate sustainable consumption and production into tourism policies.
Among other recommendations in this report, the World Tourism Organization refers to the importance of Sustainable Development Goals (SDGs) as a guide in providing a unified vision for all countries in order to achieve sustainable development (specifically SDGs 8, 12, and 14 for the tourism sector) and to affect the following changes: transform policies into the implementation of specific actions; fulfill the need to measure the environmental impact of tourism on a regular and consistent basis; convert the linearity of tourism production and consumption into circularity of the same (circular economy); and to address the need to add geospatial data to the planning activities of tourist destinations.
When analyzing the consequences of sustainable production (supply approach) and sustainable consumption (demand approach), the scientific literature provide evidence that is not always in agreement. Hence, as there is relative consensus that sustainable management positively affects hotel administration [2,3], the same unanimity does not exist when analyzing the willingness to pay extra for sustainable consumption, despite acknowledging that a tourist with higher environmental awareness will be more inclined to pay a surcharge in a sustainable hotel than a tourist whose environmental awareness is lower [4,5]. Therefore, while some empirical studies conclude that tourists are willing to pay a surcharge for staying in a sustainable hotel [6,7,8], other scientific studies show the contrary and indicate that a tourism consumer is usually unwilling to pay more [5,9,10].
This research paper seeks to contribute to the knowledge of the degree of sustainability awareness that exists among tourists by measuring this consciousness through their willingness to pay extra for a more sustainable product or service. To this end, the second part of this paper is devoted to carrying out a bibliographic review of the scientific works in which the willingness of tourists to pay for non-market products or services is considered, as well as to assessing the advantages and disadvantages of the methodology used in this work. The third Section is devoted to briefly describe the case study in this paper: the Spanish city of Caceres, offering some data about supply, demand and carrying capacity from a tourism activity perspective. The next Section presents the methodology used to find relevant results. Then, the fifth Section has been divided into two subsections. The first one is dedicated to performing a descriptive analysis of the extra amount that tourists are willing to pay for specific and more sustainable tourism products or services when visiting a World Heritage city—in this case, Caceres. In the second one, different socio-demographic factors are taken into account in order to determine their possible influence on the willingness to pay additional charges on the products and services analyzed. This paper ends by discussing the results in terms of implications for the tourism management and presenting the most relevant conclusions.

2. The Willingness to Pay for Cultural Heritage and Sustainable Tourism

Placing a value on World Heritage in general, as well as on any specific type of cultural heritage, has been studied by economists due to its monetary importance [11]. Some authors such as Throsby [12] refer to the “cultural capital” associated with cultural heritage, considering that such heritage can generate a flow of products and services, and therefore can provide economic benefits. Of all existing economic appraisal methods, the contingent valuation method (CVM) has been most widely used for the value appraisal of cultural goods [13,14].
Economic valuation studies ultimately aim to estimate a total economic value, which includes both its ‘use’ value and its intangible ‘non-use’ value (educational, altruistic, environmental, etc.) [15]. In order to quantify use value (real markets), revealed preference methods are used, while for the measurement of the non-use value (hypothetical markets), stated preference methods are used. In stated preference methods, consumers are asked about the amounts they are willing to pay (WTP) or accept (WTA) for a product or service that does not yet exist on the market, or they are asked to choose the preferred option from a given set of choices. Therefore, the economic techniques that estimate the amounts to be paid or accepted are known under the generic name of contingent valuation (CV) [16].
Regarding the advantages and disadvantages of using contingent valuation methods, Carson et al. [17] carried out a detailed analysis of these methodologies. According to these authors, one of the advantages of CVM is that the theoretical rationale underlying this methodology allows empirical economic measurements to be used that had previously been ignored or avoided by economists. Another advantage is that the reliability of the results of the survey on which the method is based is very high, provided that the product or service to be assessed is clearly explained, that the sample is carried out among a well-defined target audience, and that the payment expectations are realistic. Thirdly, other advantages of this method cited by the authors include the fact that surveys completed by consumers are usually very straightforward and inexpensive to carry out. In spite of these advantages, there are two shortcomings to consider. On one hand, willingness to pay (WTP) is limited by the income level of consumers, though advocates of the methodology give counter-arguments by saying that decision-making by public bodies and institutions should not necessarily be based on affordability. On the other hand, the preferences being contemplated are those of the present-day generation, and those of future generations are not explicitly considered with this method. In any case, economic researchers have so far considered that the advantages of this methodology are significantly more numerous than its limitations, which has made it the most widely used methodology in the valuation of non-market products and services.
Among possible applications of the CV method to the field of cultural goods evaluation include research in the following areas: museum assessment [18,19,20,21]; World Heritage site evaluation [13,22,23,24,25,26,27]; evaluation of public cultural institutions [28,29]; the assessment of cultural monuments [30]; etc.
In addition to cultural heritage, one of the areas in which the most scientifically relevant work has been carried out on willingness to pay has been with coastal tourism.
There have been many studies in which the willingness to pay for environmental issues has been quantified, some of which include the following: improvement in the quality of bathing water [31,32,33,34,35,36]; beach maintenance and improvement [37,38,39,40,41,42,43,44,45]; the protection of marine species [46,47,48]; the restoration of environmentally deteriorated beaches [49,50,51]; the development of additional tourist services on beaches [44,52,53,54]; the maintenance of beach ecosystem services [55]; etc.
Other areas of tourism in which contingent valuation has been carried out through willingness-to-pay programs include, among others, ecotourism [56,57], geotourism [58], contributions by tourists for the environmental conservation of a protected natural area [59,60], and so on.
However, all of the works cited focus essentially on valuing cultural goods (outside the market) in the condition in which they are found at the time they are valued, or on valuing the willingness to finance very specific environmental improvements (also outside the market). Quite to the contrary, this present work is oriented along the lines of Namkung and Jang [61], Meleddu and Pulina [62], and López-Sánchez and Pulido-Fernández [63], in the sense that its aim is to assess the willingness to pay an additional amount (premium price) for a tourist destination that already exists on the market in order to make it “more” sustainable. In other words, it is not so much a question of assessing the level of sustainability of a specific tourist destination (in this case, the city of Caceres), but rather of assessing the possibility of paying more to make a destination that already exists and currently charges a price for its products and services “more” sustainable. As a result, this premium in terms of sustainability will depend largely on the starting price of the tourism product in question. Another way of explaining this concept through the use of an example is to say that the willingness to pay for a more sustainable product or service will not be the same if we talk about a double room (with a price that can oscillate, for example, between 40 and 120 euros), or if we talk about a taxi ride (the price of which can oscillate between 5 and 30 euros). Hence, in the analysis that follows, different economic measurement scales will be used to assess willingness to pay for a more sustainable tourism product on destination.
In any case, because a surcharge for more sustainable management of the tourism products or services analyzed in this paper does not yet exist on the market, the most appropriate valuation methodology in this case is CVM.
However, the willingness to pay depends on a number of sociodemographic factors. Thus, for example, various studies [64,65,66] have shown the influence of age. Gender is another factor that can explain the variability in the greater or lesser amount that tourists are willing to pay for sustainable tourism services [64,67,68]. The educational level also introduces differences in the willingness to pay [69,70,71].
It is important to indicate that these sociodemographic factors are antecedents of the behavior of the tourist regarding the willingness to pay. In fact, several authors [72,73] justify the need to include non-economic factors, such as psychosocial motivations to approximate the willingness to pay. One of the most used approaches to demonstrate the influence of psychosocial factors on the individual’s behavior towards sustainability in general, and towards the willingness to pay for it, in particular, is the Theory of Planned Behavior (TPB), developed by Ajzen [74]. According to this theory, one of the antecedents of the individual’s behavior is the social norm, which determines that the pressure exerted by the referring members of the social group to which the individual belongs can condition their behavior.
The TPB model has been used in scientific literature to identify the factors that determine (or can determine) the willingness to pay [72,75,76,77,78,79,80,81].
In this study, the recognition of the existence of possible differences in the willingness to pay for more sustainable tourism products and services justifies the empirical analysis presented in Section 5.2.

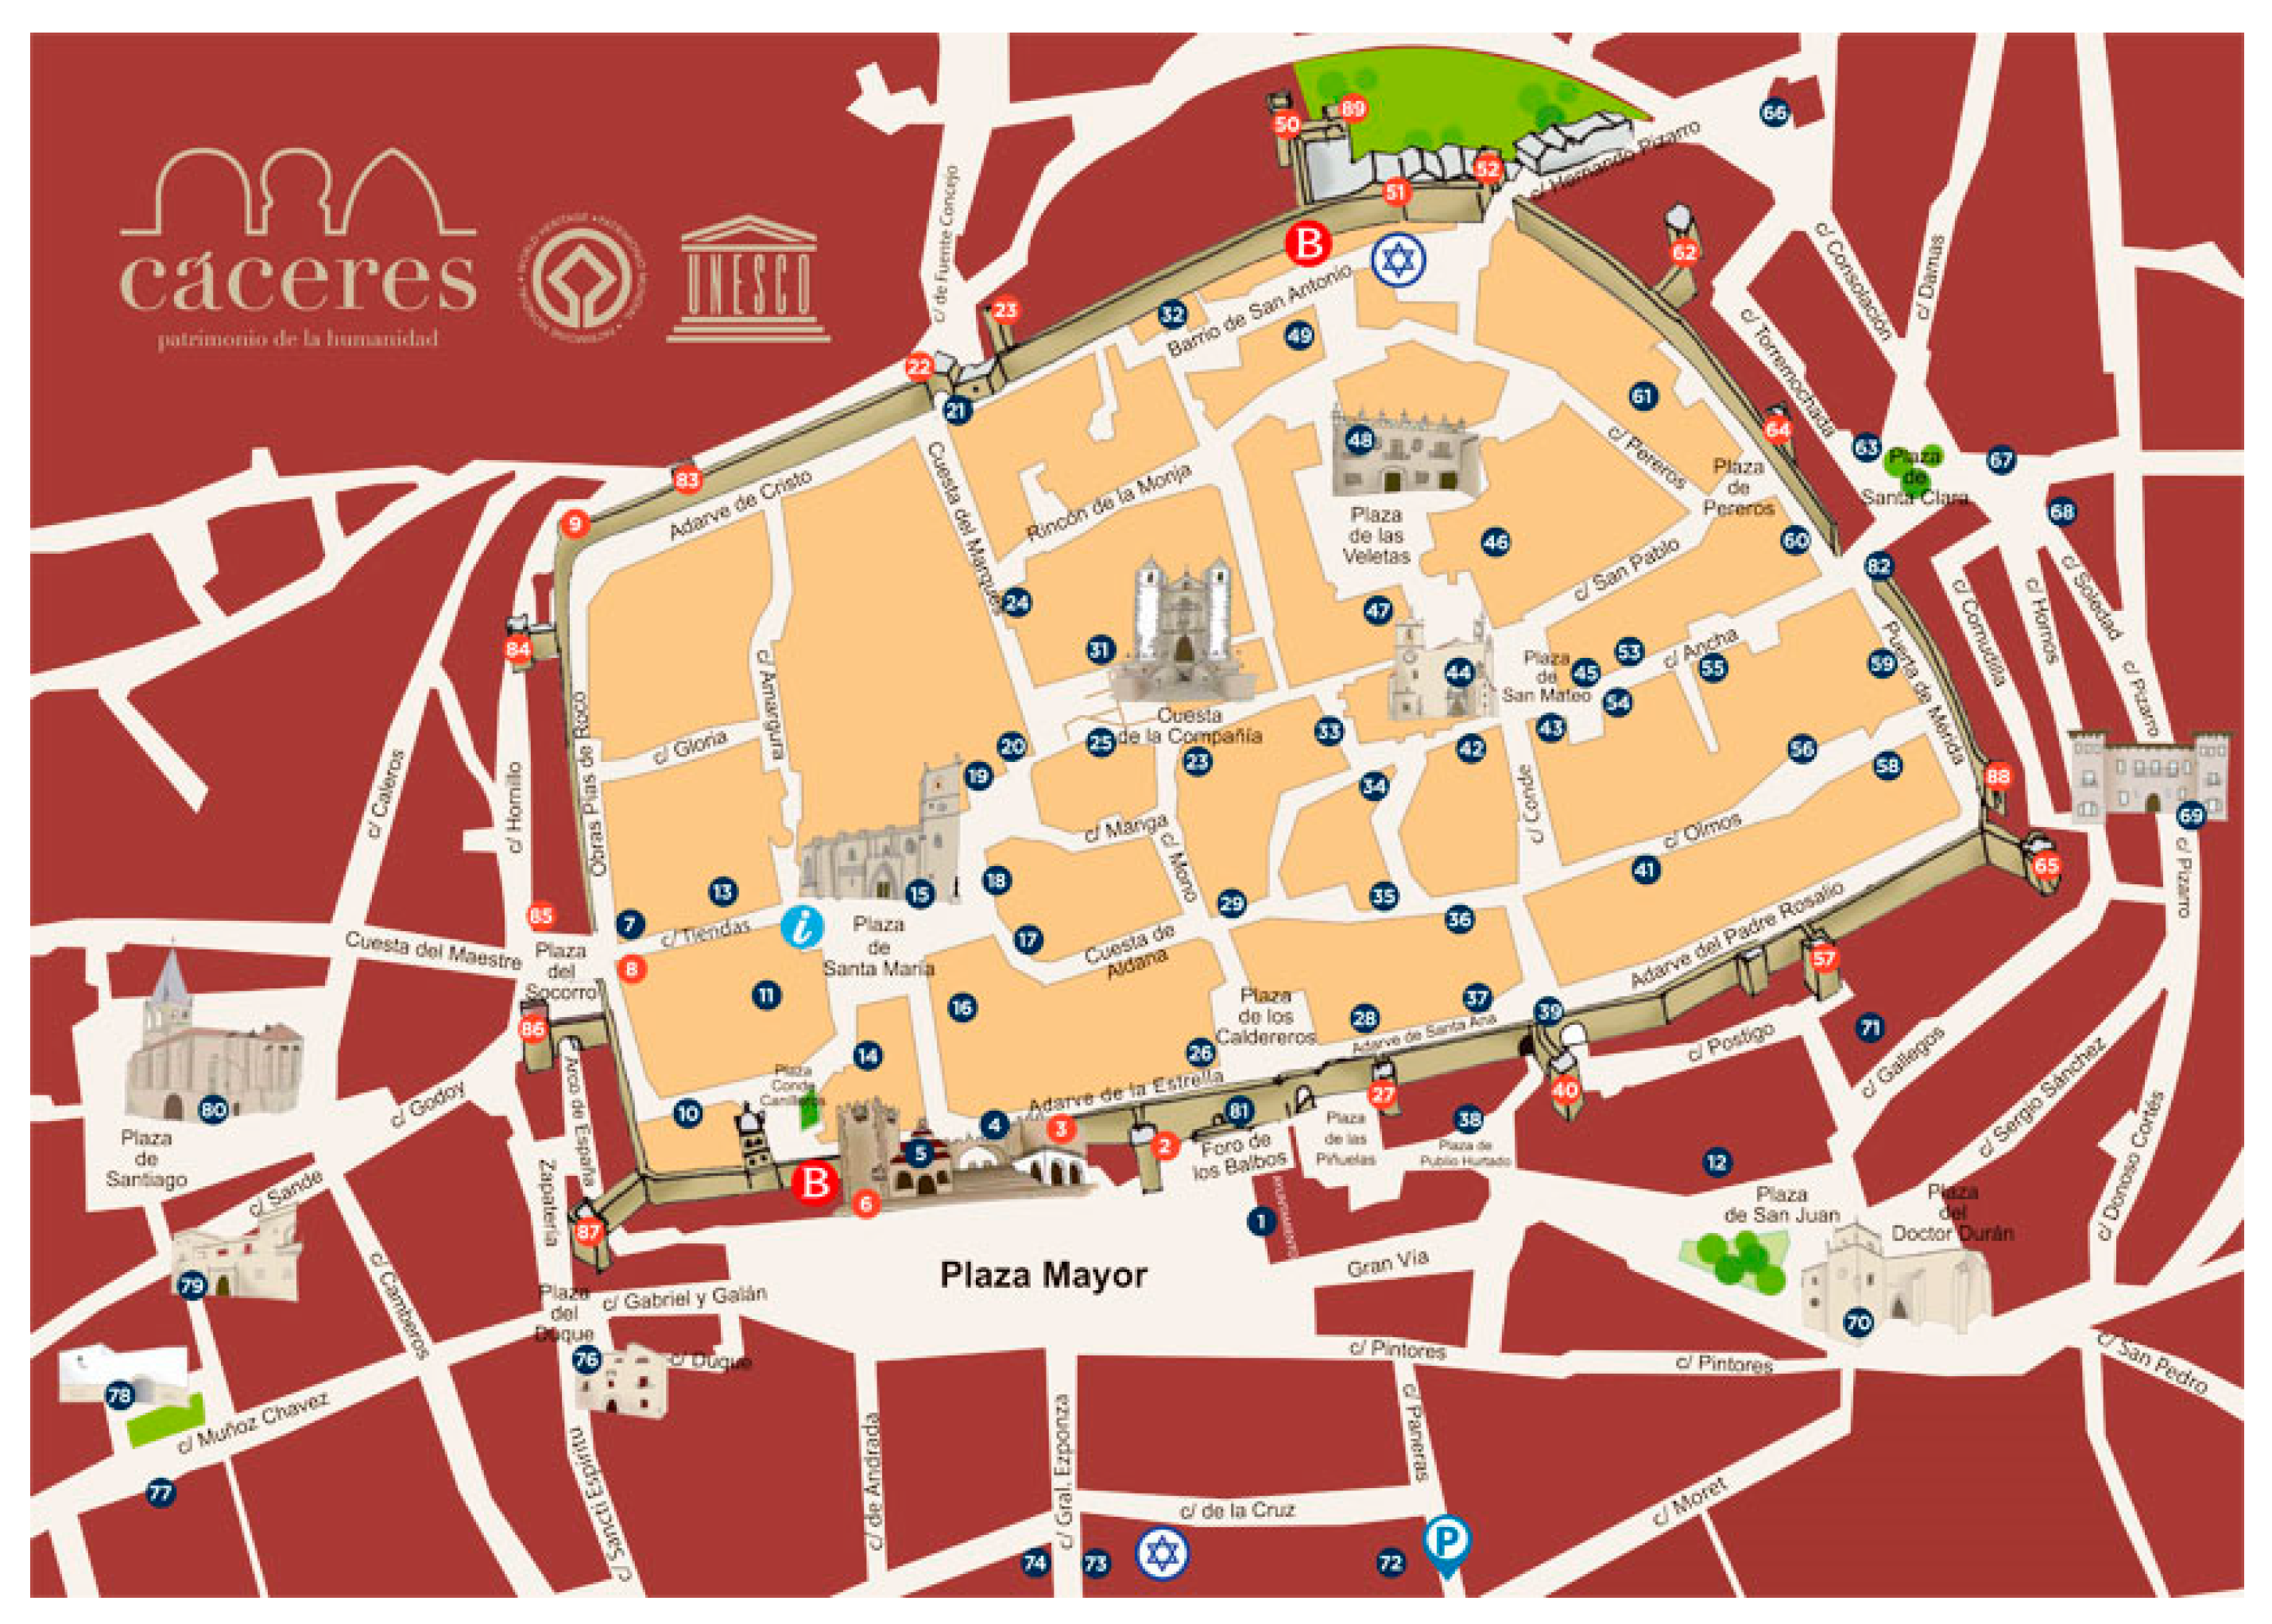
3. Case Study: The City of Caceres as a Tourism Destination

The city of Caceres is located in the southwest of Spain, and has a population under 100,000 inhabitants. It is declared a National Monument of Spain (1949), third Monumental Ensemble of Europe (1968) after Prague and Tallinn and World Heritage City (1986). It is part of the “Jewish Quarters of Spain Network” and is one of the best preserved monuments from the Middle Ages and Renaissance in the world. In the city it is possible to find abundant remains of its Roman, Muslim, and Jewish past, being an example of the coexistence that during the Middle Ages existed between the three main cultures of the time: the Muslim culture, the Jewish culture, and the Christian culture. The magnificent palaces, the noble shields, the legends of the city, and its rich and varied cuisine, together with an important accommodation, gastronomic, and active offer, make Caceres the most visited tourist destination in the Spanish region of Extremadura (see Figure 1).
Table 1 shows the latest available data regarding tourist offer in Caceres. The cityhas 78 tourist accommodation establishments, offering 3291 beds and 193 restoration establishments with 17,685 places. The accommodation offer is mainly concentrated in hotels and tourist apartments, while the restoration offer is located in restaurants.
Table 2 summarizes the city’s tourist activity in terms of demand. The annual number of tourists the city has received in recent years above 300,000 people. This data, although it is the highest in the region where the city is located, is not, however, the highest in the Spanish territory. Thus, Caceres is not among the 12 Spanish cities that receive more than one million tourists each year (ranking led by Madrid and Barcelona). On the other hand, the tourist load ratios presented in Table 2 indicate that the city has no tourist saturation problems. Especially striking is the ratio of tourists/local inhabitants, which stands at an average monthly value of between 26% and 30%. At no time of the year, the city welcomes a volume of tourists that exceeds its resident population.
Therefore, the terms “sustainability” or “sustainable” used in this research do not relate, in the case of the study analyzed, to an over-tourism problem. In general, sustainability is understood in this paper not in its environmental dimension, but linked to the industry as a development strategy. Therefore, when talking about a hotel or a sustainable restaurant, reference is being made to a tourist business that seeks economic sustainability, sustainable growth of the destination, the acquisition of a sustainable demand, the preservation of cultural and historical-artistic heritage from the city, etc.

4. Methodology

In order to know the willingness of tourists visiting the city of Caceres to pay for more sustainable tourism products or services, two surveys were carried out, one in 2012 and the other in 2016, involving 486 and 474 tourists, respectively, who visited the city. One of the questions on the survey (the questionnaire can be consulted in Appendix A) was whether the tourists would be willing to pay an increased price for a tourism service in the city of Caceres in order to enjoy their stay in a more sustainable location. In other words, they were asked about their willingness to pay an extra amount for the sustainability of tourism products and services offered by the city.
To create the questions, the common questionnaire structure used in contingent valuation studies was consulted [82,83,84,85], among others, as it was considered the appropriate methodology (contingent valuation) for estimating willingness to pay. A total of 960 surveys were carried out in the two years mentioned above.
To analyze the results of the surveys carried out, descriptive statistical tools have been used, both of a numerical nature (location, dispersion, shape, and correlation measures) and graphical (histogram, box-plot, and scatter-plot).
On the other hand, the inferential statistical analysis carried out in Section 5.2. consisted of comparing average population values. For this, t-tests have been performed in those cases in which the factor has two levels or categories and ANOVA tests in those other cases in which the factor has more than two levels or groups. Finally, in those cases in which equality of means has been rejected, and in order to define a ranking of them, a confidence interval of the difference of means (in case of two levels) has been built and post-hoc tests have been performed (in the case of more than two levels), using the Bonferroni procedure.

5. Results

The empirical results obtained in the research by using both descriptive and inferential statistical techniques have been organized into two subsections. The first one presents global results by analyzing the survey without considering the influence of certain determining factors on the willingness to pay for more sustainable products or services. The second one analyzes the influence of two-level factors (gender, origin, and year) and multiple-level factors (age, and education) on the willingness to pay.

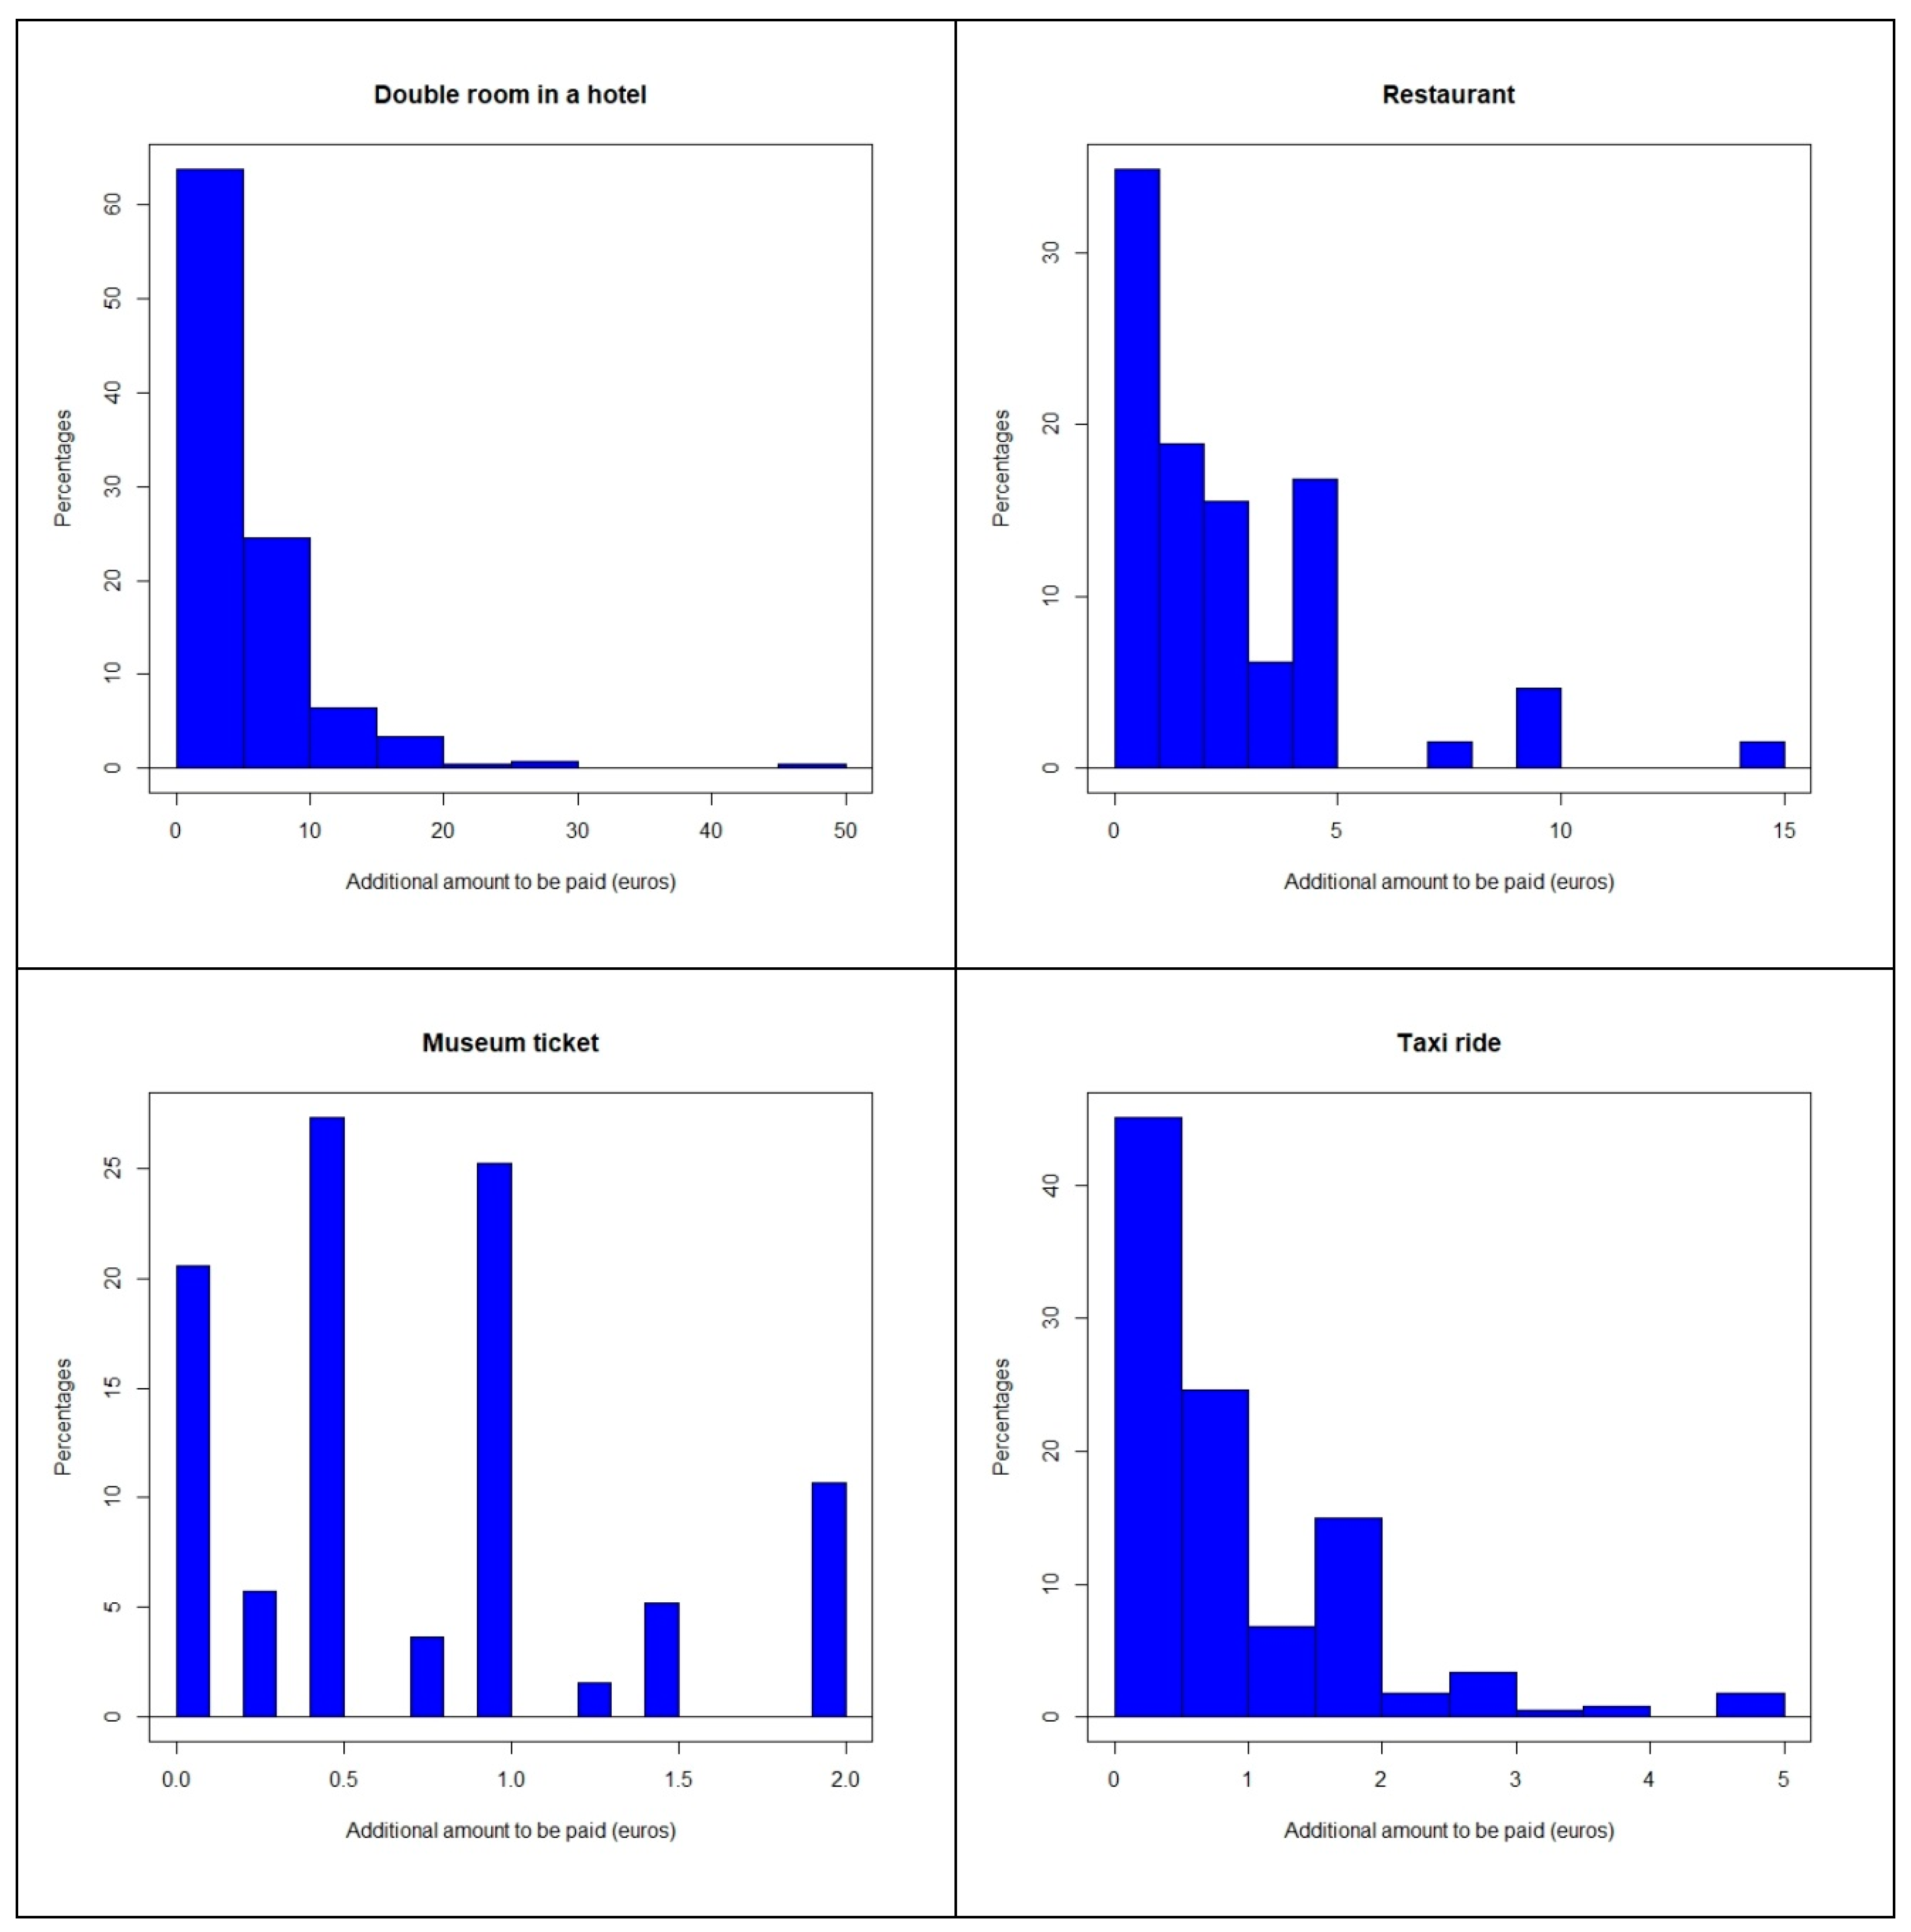
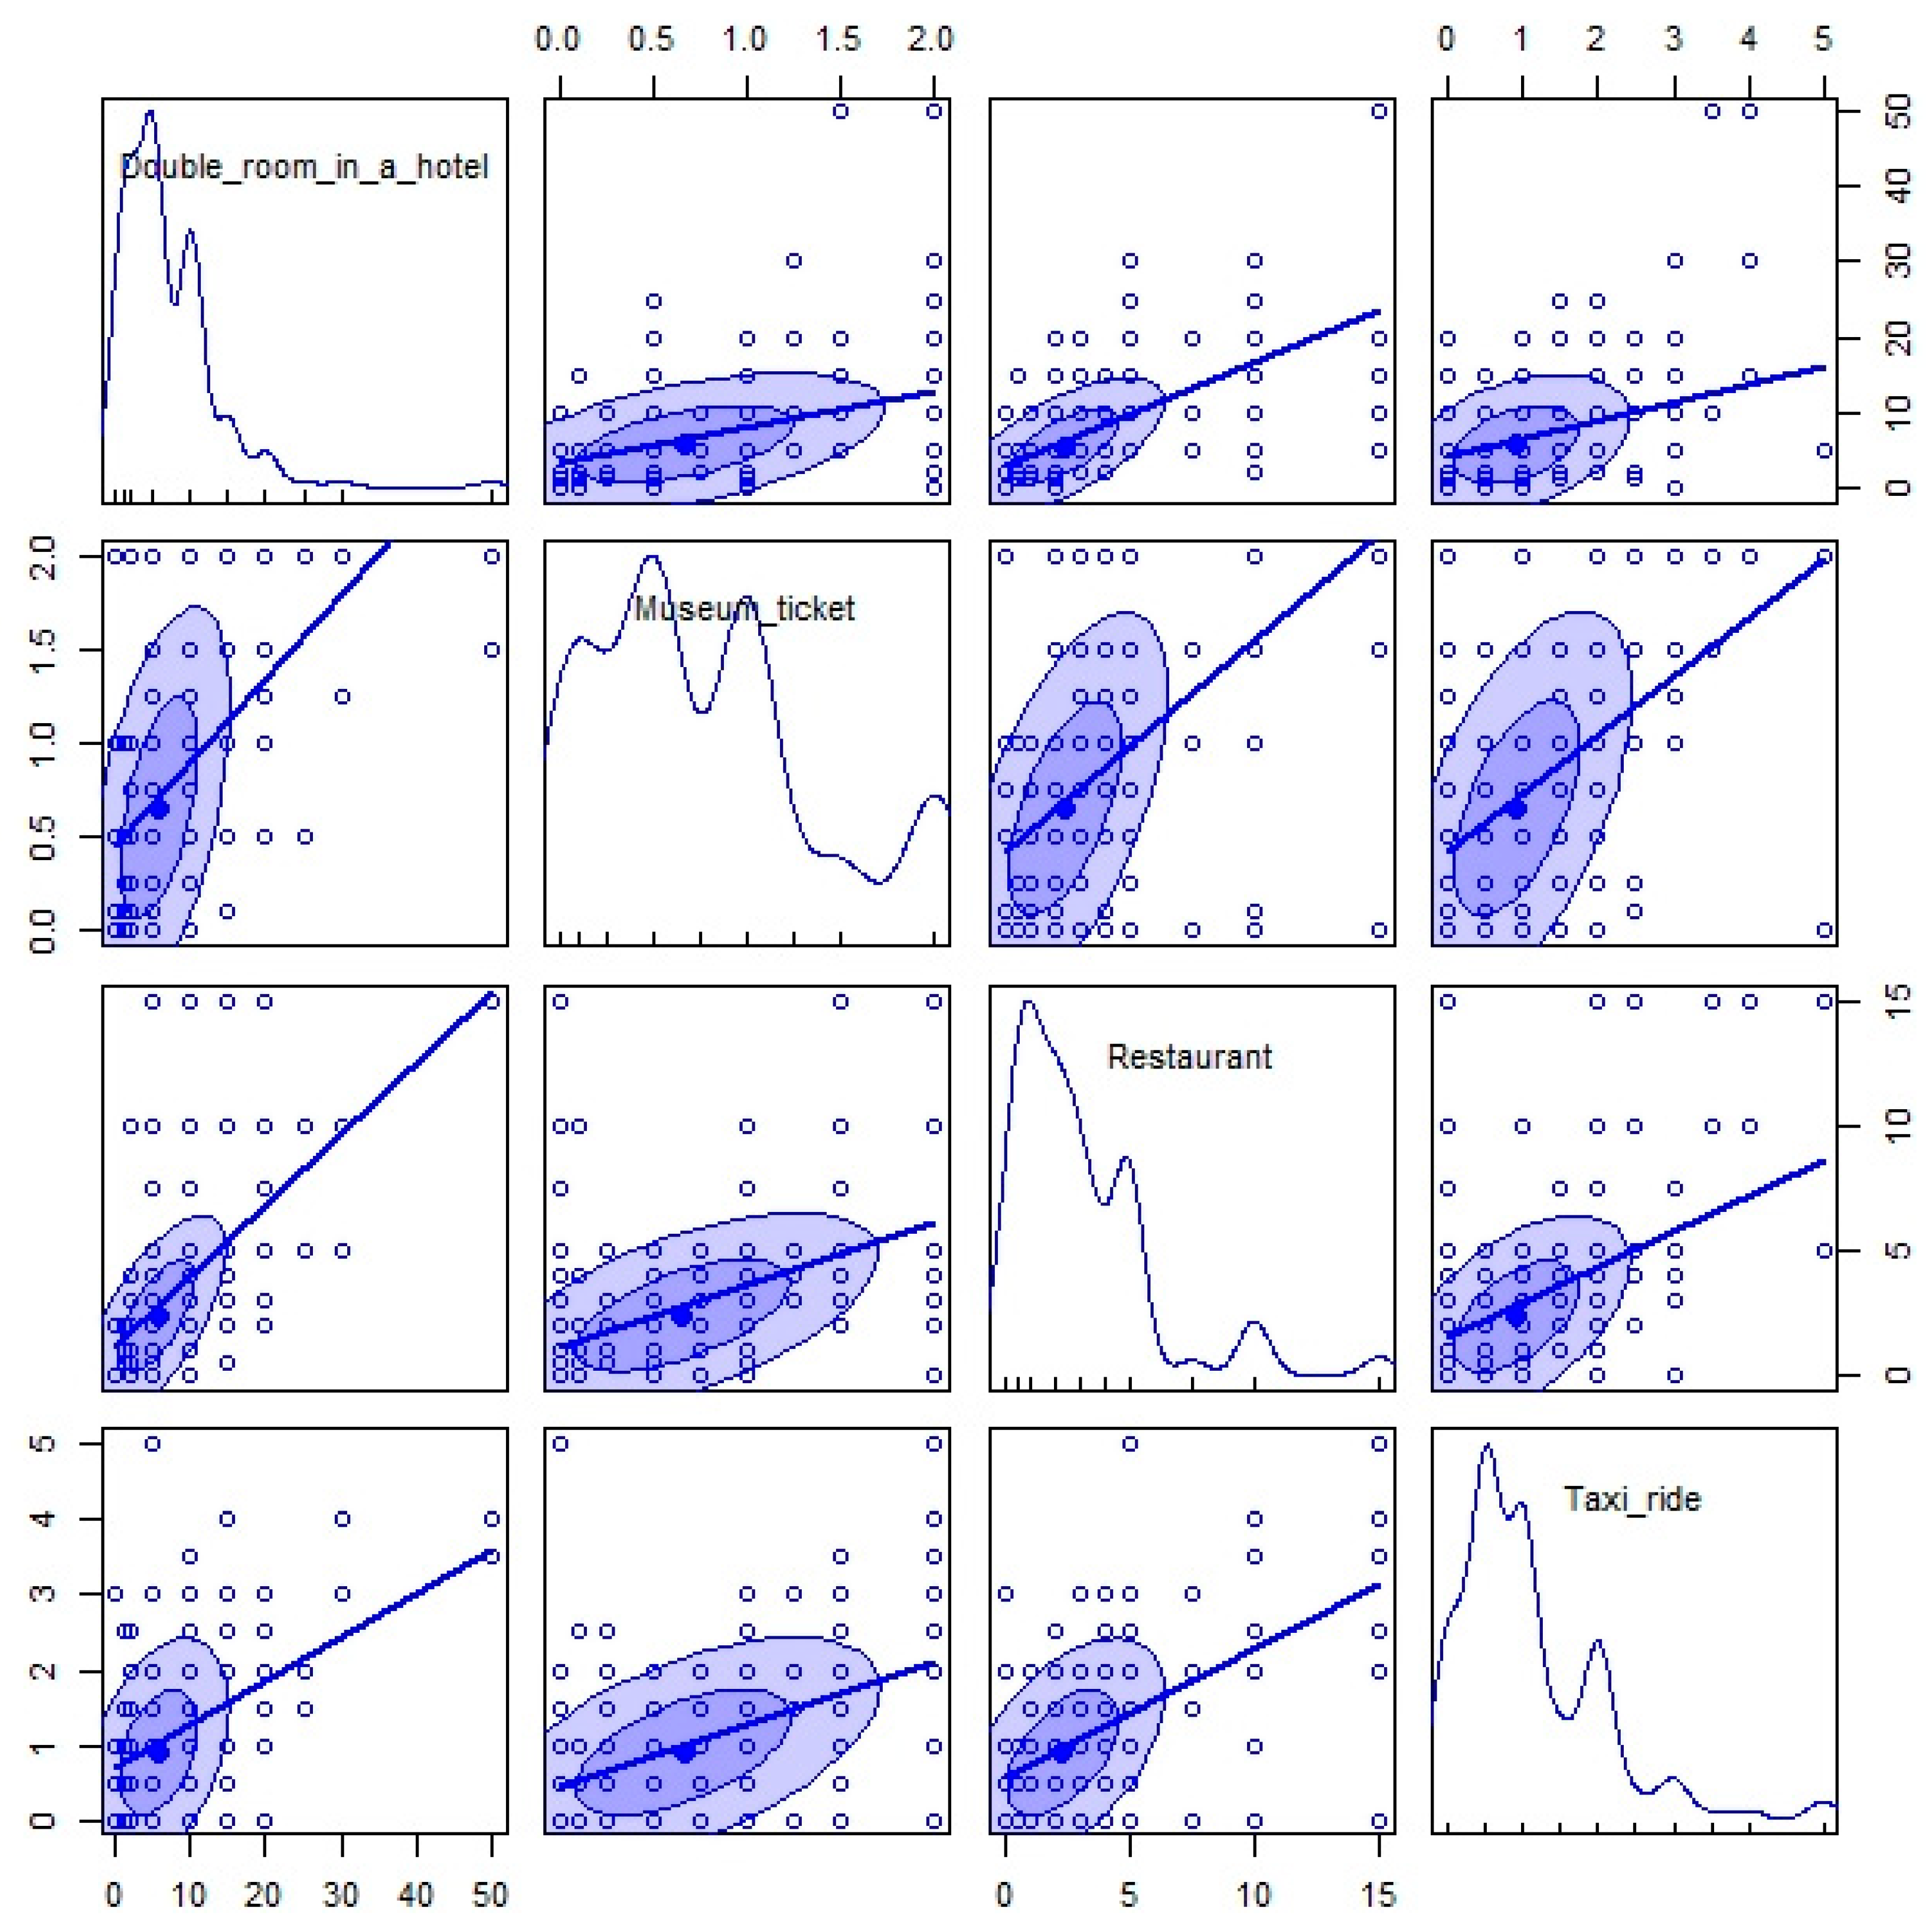
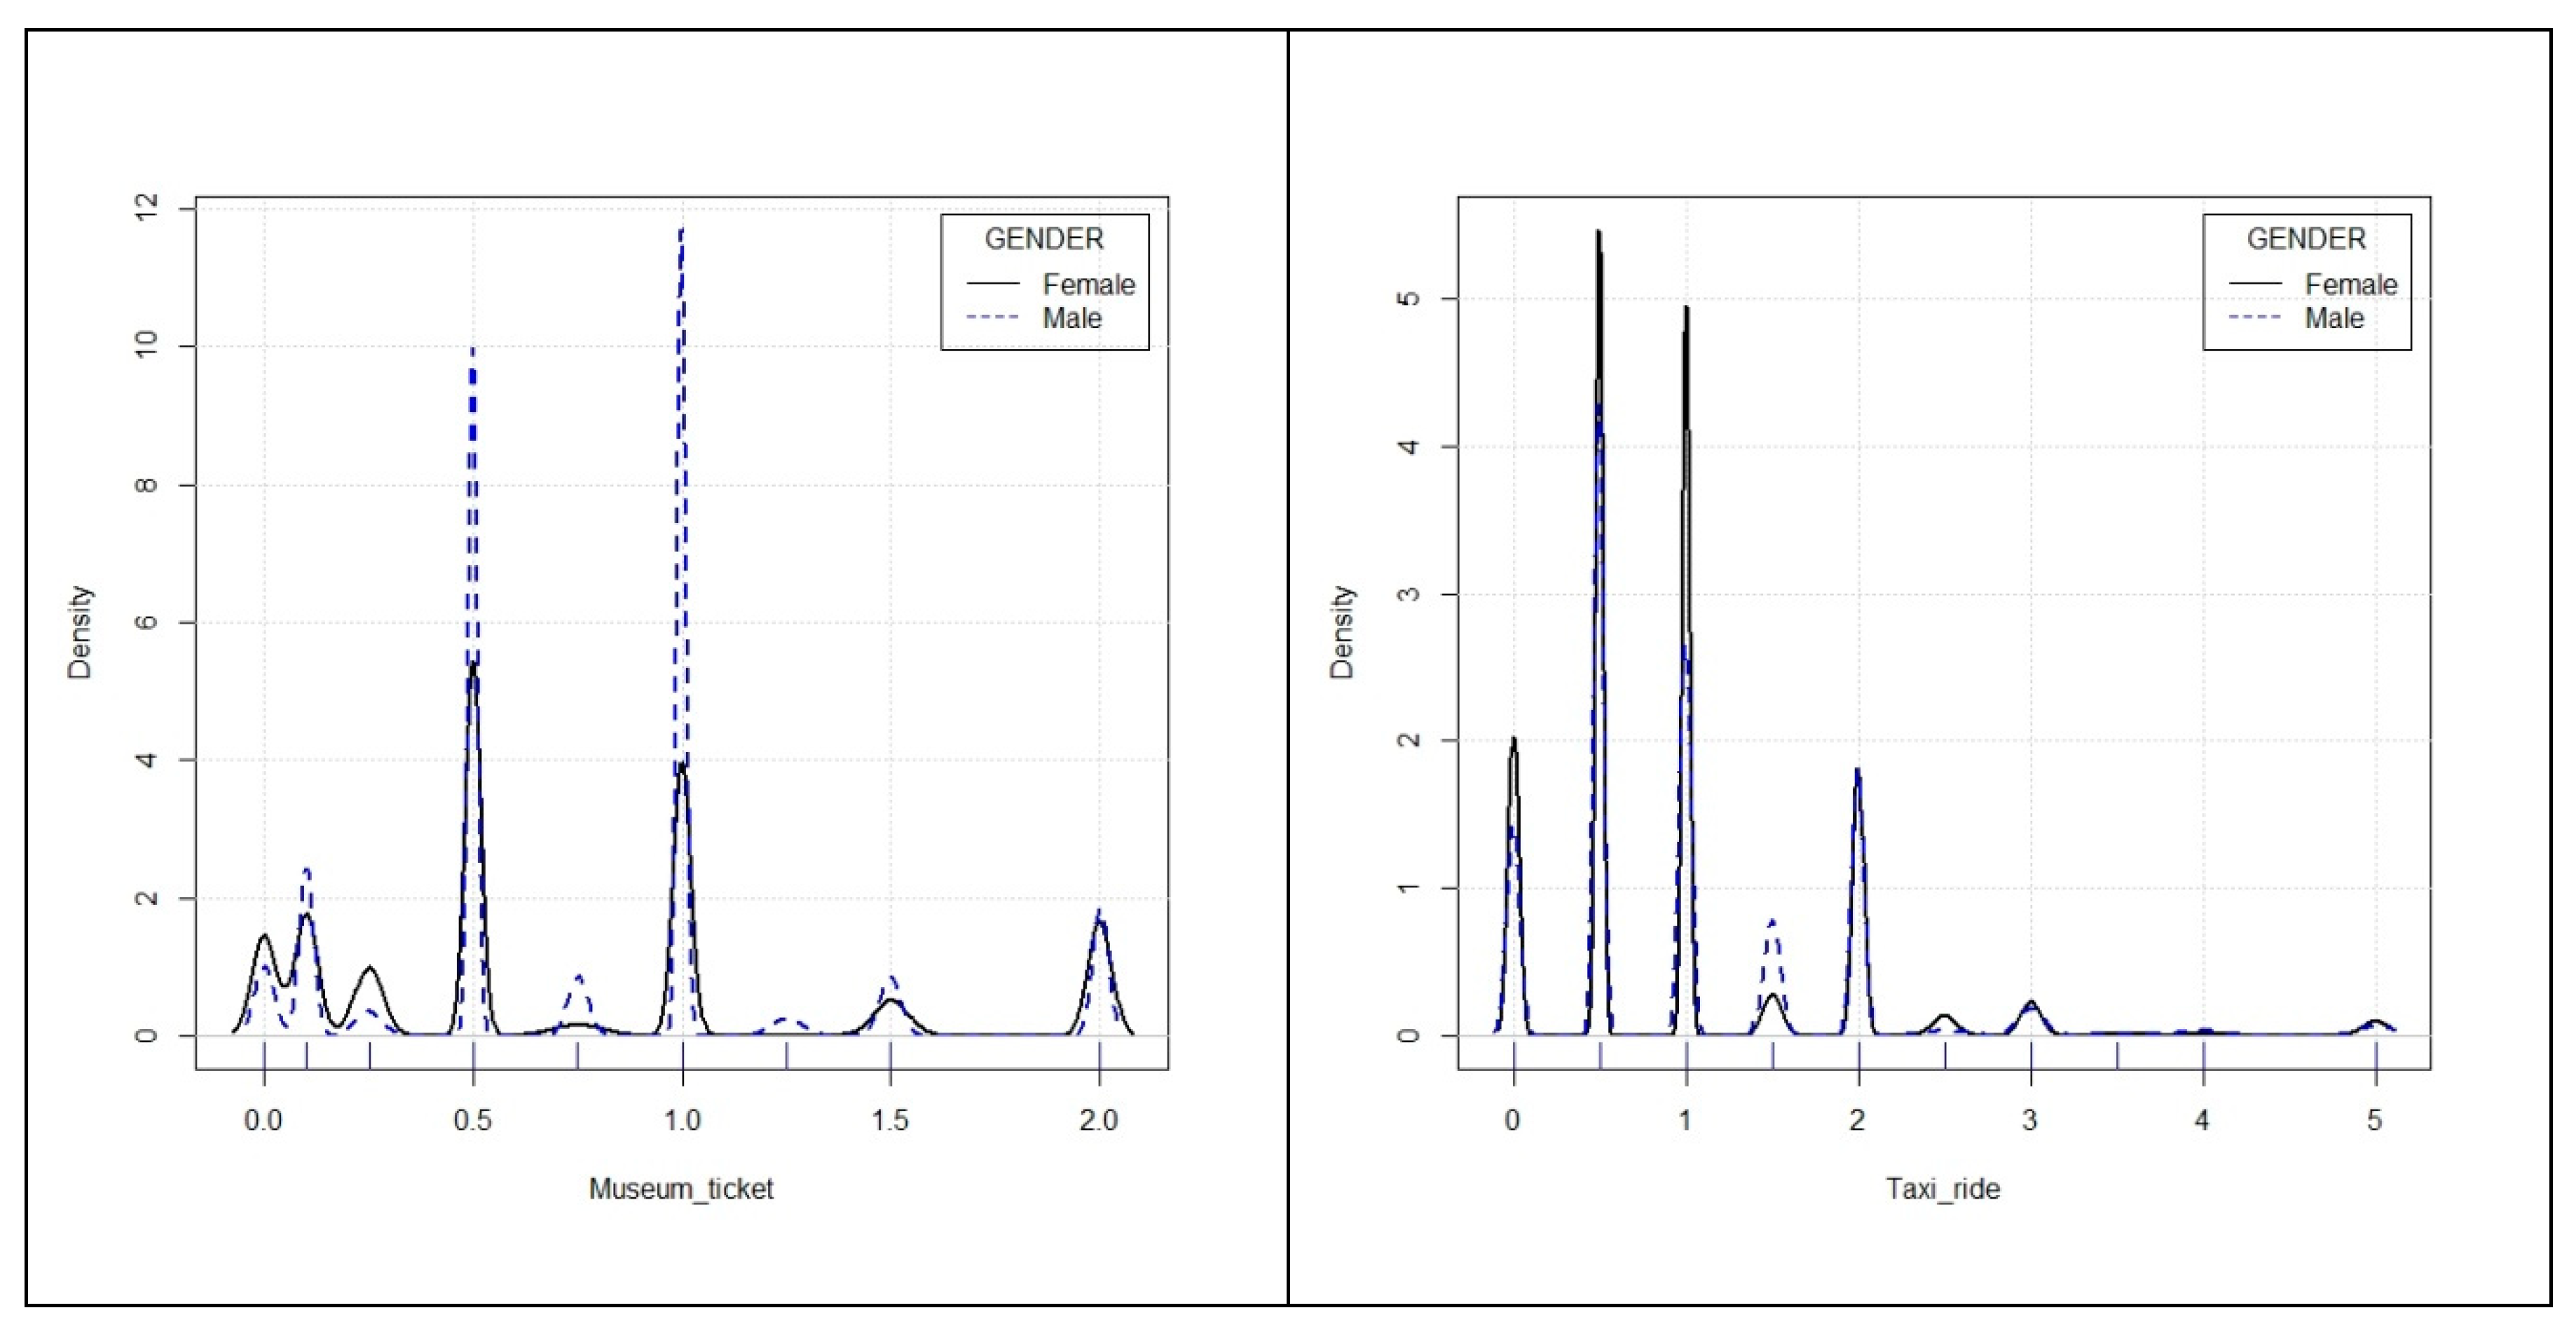
5.1. WTP from a Global Approach

The number of tourists who were willing to pay extra for a more sustainable destination was 435, which meant that only 45.3% of those surveyed had a sufficient level of sustainability awareness to convince them to pay extra for a more sustainable cultural location. If this global percentage is broken down by year, it can be seen that in 2012, this percentage was 44.2%, yet by 2016, it increased slightly to 46.4%. Although awareness toward sustainability grew in this 4-year period, the fact is that more than half of the tourists who visit Caceres are not willing to accept an additional cost for greater sustainability, which shows that the concept of sustainability and the consequences associated with it have not yet been sufficiently internalized by cultural tourists.
Next, among those who were willing to pay for sustainability (subsample of 435 tourists), we proceeded to ask the exact extra amount they would be willing to pay (surcharge for sustainability) for four tourism products and services offered by the city of Caceres: a double room in a hotel (range: 0–50 euros); a sustainable restaurant (range: 0–15 euros); a museum ticket (range: 0–2 euros); and a taxi ride (range: 0–5 euros). After eliminating the replies in which the respondents did not choose a price in any of the categories, despite having previously indicated their willingness to pay for greater sustainability, the total subsample analyzed finally amounted to 387 tourists.
Firstly, Figure 2 shows the histogram for each of these four tourism products and services, while Table 3 shows the main descriptive statistics associated with each one.
The histograms displayed indicate a higher rate near the lowest values in the available range. Thus, the vast majority of the tourists surveyed would be willing to pay between 0 and 10 euros more for a double room in a sustainable hotel; between 0 and 5 euros for eating in a sustainable restaurant; between 0 and 1 euros for entering a museum that carries out sustainability activities; and between 0 and 2 euros for a ride in a sustainable taxi.
Although the previous histograms offer very interesting information (such as the clearly asymmetrical nature of the values of these four variables), the fact is that the descriptive statistics shown in Table 3 provide much more detailed information.
In the case of a double room in a sustainable hotel, the average amount that tourists were willing to pay was 6.78 euros, but with an average dispersion of 6.23 euros, which yielded a coefficient of variation close to 1 (0.92). Half of the people consulted would pay a maximum amount of 5 euros (median), while only a quarter of them would be willing to pay more than 10 euros (third quartile). The large difference between the mean and the median suggests a highly asymmetrical distribution. In fact, the asymmetry coefficient for this variable (2.56) shows a remarkably evident asymmetry to the right, while the kurtosis coefficient shows a very clear distribution (Leptokurtosis) due to the high concentration of values between 0 and 10 euros.
The additional charge for a sustainable restaurant reached an average value of 2.98 euros, but with a standard deviation of 2.77, thus generating a coefficient variation of 0.93. In this case, the maximum amount that half of the tourists surveyed were willing to pay was 2 euros (median), while only a quarter of the total would be willing to pay 4 euros or more for eating in a sustainable restaurant. Although much less obvious than in the case of the double room, the distribution of these quantities was also asymmetrical to the right (1.95) and leptokurtic (4.86).
On the other hand, the additional payment for entering a sustainable museum registered an average value of 0.75 euros, with a standard deviation of 0.59 euros (the coefficient of variation here is the lowest of all the variables analyzed; 0.78). The median value, however, was less than the average value and stands at 0.5 euros. In fact, only 25% of the tourists surveyed would be willing to have their entrance fee to a museum increased by 1 euro (third quartile), or more, in exchange for sustainability. Payment for such an entrance ticket to a sustainable museum was the most symmetrical of all those analyzed, although it also had a slight asymmetry to the right (0.74). However, unlike the other payments, its degree of kurtosis was less than that of a normal distribution, since its value (−0.24) shows evidence of a very slight Platy kurtosis.
Finally, the tourists surveyed would be willing to pay on average somewhat more than 1 euro (1.09) for using a sustainable taxi, although the dispersion with regard to the average value reached a figure of 0.98, which was very close to that same number. The median value of this extra payment (1 euro) was very similar to its average value, although just 25% of the tourists surveyed would be willing to pay more than 1.5 euros for a sustainable taxi ride. Despite the proximity between the mean and median values, the fact is that this extra payment amount was also asymmetrical to the right (1.61), although it was less pronounced than in the cases of the double room and the sustainable restaurant, and it was leptokurtic as well.
Although the symmetry and kurtosis analyses of the products and services being evaluated in the city of Caceres provide fairly clear evidence as to the appropriateness of these extra payments, the results were tested using the Kolmogorov–Smirnov test (with Lilliefors correction). The results obtained (0.2507 for a double room in a hotel; 0.1900 for a sustainable restaurant; 0.2029 for admission to a museum; and 0.2333 for a taxi ride; with an associated p-value, in all cases, of less than 2.2 10−16), clearly show the absence of normality in the four extra payments being analyzed. Therefore, the absence of normality was one of the most defined characteristics in the willingness to pay for a more sustainable destination, at least for a cultural touristic destination such as the city of Caceres.
On the other hand, the box-plot diagrams presented in Figure 3 merely confirm the lack of symmetry and normality of the price that tourists are willing to pay for greater sustainability in the four products and services analyzed. While some clearly extreme values can be identified (such as the payment of 30 or 50 euros for a double room, 10 or 15 euros for a sustainable restaurant, and 4 or 5 euros for a taxi ride), the fact is that there was a high concentration of cases in the lower values of the respective variables.
Anyway, these extreme values do not represent a problem in the case at hand, since, defining the extreme value as one that moves away from the first or third quartile more than three times the interquartile range, the number of them was really reduced (two cases for double room, six cases for restaurants, and seven cases for taxi ride). Since these extreme values represent less than 2% of the analyzed sample, the bounded mean was calculated at 98% (that is, excluding 2% of more extreme values). The values of this cropped average presented in Table 3 clearly demonstrated that the influence of the extreme values was minimal, since the differences with the non-bounded mean were practically negligible.
Another analysis that must be carried out is that which is linked to the relation degree that may exist between the willingness to pay extra for a particular product or service and the willingness to do the same with a different product or service. To this end, Figure 4 shows the matrix of scatter plot diagrams among the four tourism products and services analyzed. In addition to a diagonal line in which the representation of the density functions once again displays clear evidence of the asymmetry to the right previously mentioned, this graph also shows a clear positive relationship between the willingness to pay for these four products and services. This positive relationship is especially significant between a double hotel room and a sustainable restaurant, and between a museum ticket and a sustainable restaurant.
In any case, although the scatter diagrams allow for direct observation of the significance (and to a greater or lesser degree to the intensity) of the relationship between the variables under consideration, the fact is that they do not allow for a specific figure to be obtained that would permit the intensity of this relationship to be determined numerically. This figure is known as the Pearson correlation coefficient, and it is shown for all possible pairs of variables in Table 4.
As can be seen, the highest correlation registered regarding the willingness to pay for a more sustainable tourism product or service is between a double room in a hotel and a sustainable restaurant (0.6293). Moreover, the correlation between a museum ticket and a sustainable restaurant is above 0.5 (0.5308). At the limit of this medium intensity correlation are also the Pearson coefficients between a museum entrance and a taxi ride (0.5061), and between a sustainable restaurant and a taxi ride (0.4977). Finally, the weakest correlation found was between a double room in a hotel and a taxi ride (0.3710). In any case, all of these correlations were statistically significant at both 1% and 5%.

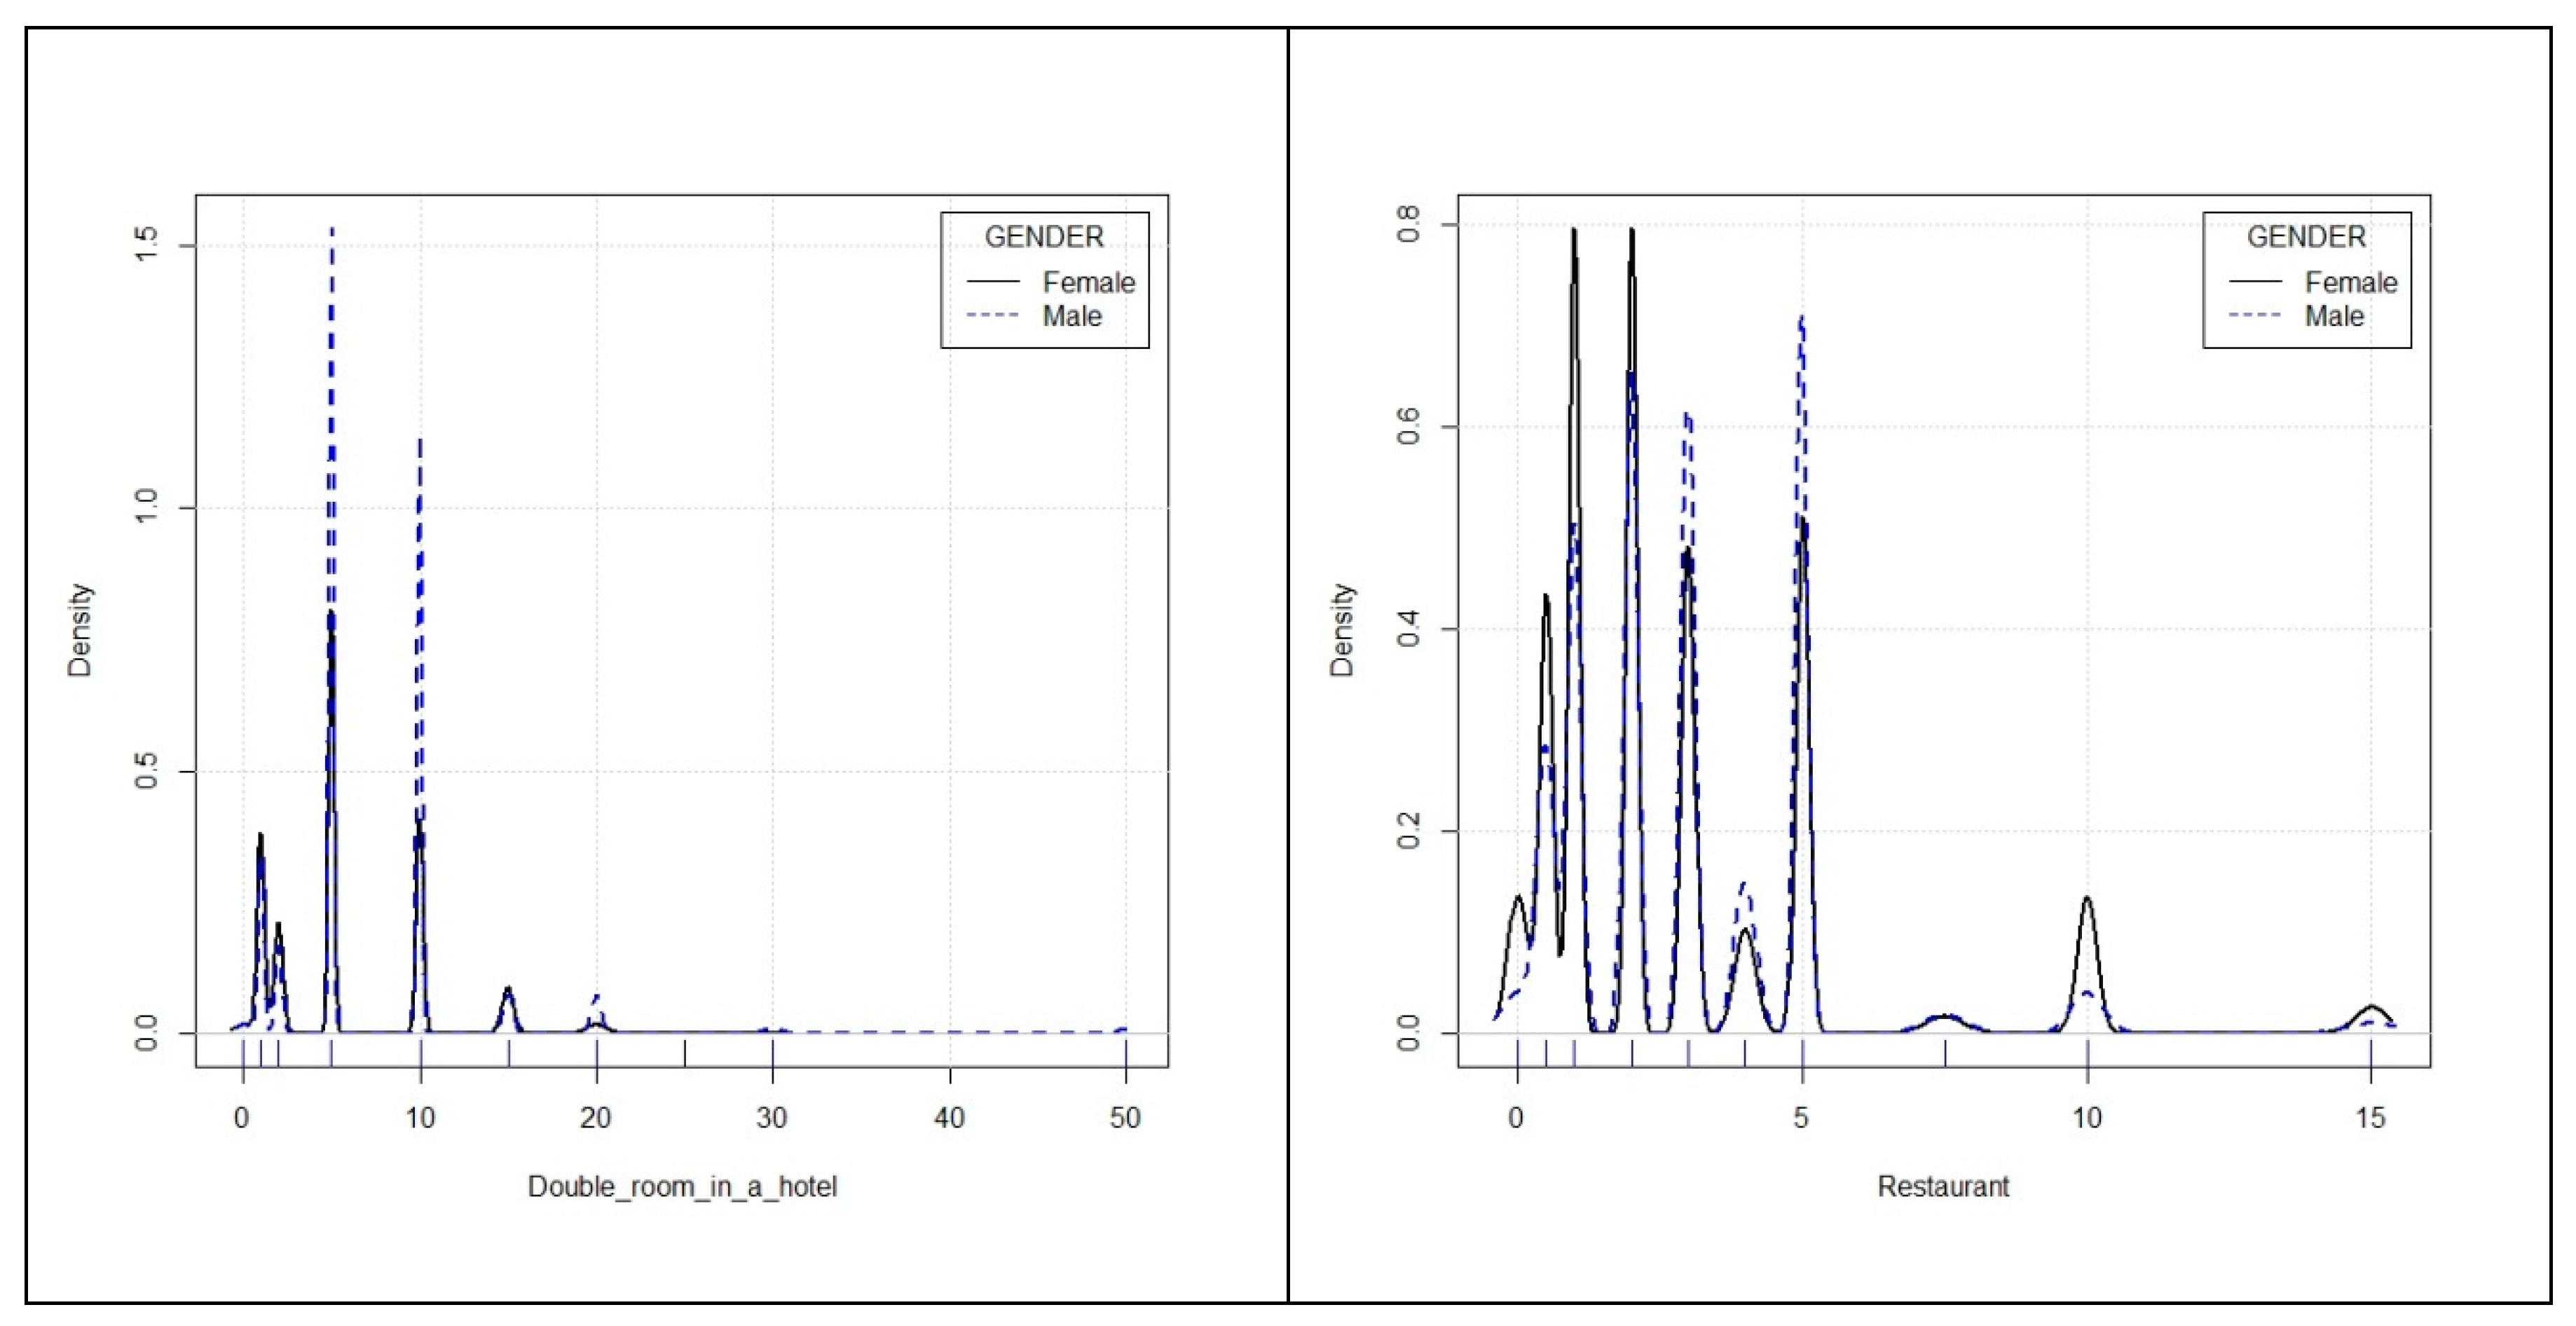
5.2. Influence of Determining Factors on WTP

The description made in the previous subsection considered that the only object of analysis sample was the group of tourists who were consulted during the two phases of the survey without differentiating them by sex, origin, age, etc. However, this aggregate analysis may disguise significant differences among subsamples.
Consequently, with the objective of identifying the possible influence of certain factors or classification variables on the willingness to pay a higher price for a more sustainable tourism product or service, different mean comparison analyses have been carried out. In the first approach to these analyses, the density functions of the willingness to pay for these products/services have been shown for both men and women (see Figure 5). In other words, the gender factor has been taken into account. In short, it can be seen that the two density functions displayed are quite similar, and hence there is no difference between men and women with regard to their willingness to pay for more sustainable services. Similar graphs could be carried out for the rest of the factors considered in this study, but they have been omitted due to limitations on the number of pages of this paper.
However, empirical verification of the existence or absence of differences in the average values of the groups for each factor has been carried out for all of the factors studied as a whole. In order to do this, assuming at all times that the groups being compared are independent, a t-test for equality of means was carried out for the factors “year”, “origin”, and “gender”. The statistical results of this t-test are presented in Table 5.
Firstly, when considering the “year”, it has been observed that this factor introduces significant differences in the average values of the willingness to pay for sustainability in the case of a double room in a hotel (p-value: 0.0008), a sustainable restaurant (p-value: 0.0463), and a museum entrance (p-value: 0.0073). Only the taxi ride did not show significant differences in the average values of the extra amount paid between 2012 and 2016 (p-value: 0.1793). In the case of the double room, the average value of the amounts that tourists were willing to pay for greater sustainability was lower in 2012 (5.94 euros) than in 2016 (7.60 euros). In the case of the restaurant, there had also been a growing willingness to pay for a more sustainable service, having risen from an average value of 2.70 euros in 2012 to an average of 3.26 euros in 2016. The increased willingness to pay for admission to a sustainable museum between 2012 and 2016 was also empirically established, ranging from an average value of 0.67 euros to 0.83 euros. Finally, no significant statistical differences were observed in the average values for 2012 and 2016 for a taxi ride (statistical value t: 1.34), as the average value in both years was around 1 euro.
Next, considering the “origin” factor, the data shown in Table 5 allowed us to conclude that there were significant differences between domestic and foreign tourists in the additional price they were willing to pay for a double room in a hotel (p-value: 0.0047) and for a taxi ride (p-value: 0.0132). This was not the case for a sustainable restaurant (p-value: 0.0840) or a museum ticket (p-value: 0.1166). As can be seen, foreign tourists had greater awareness of sustainability, as they were willing to pay higher amounts on average. Thus, while the average additional amount that domestic tourists were willing to pay for a double room was 6.42 euros, this number rose to an average of 9.02 euros for foreign tourists. A similar situation occurred with the taxi ride, for which domestic tourists would be willing to pay 1.04 additional euros for a more sustainable vehicle while foreign tourists would be willing to pay an average premium of approximately 1.40 euros.
Finally, analysis of the impact of the gender factor on the willingness to pay for sustainability shows that such willingness could only be confirmed in the case of a double room in a hotel (p-value: 0.0186). Conversely, no gender differences were detected in the case of the sustainable restaurant (p-value: 0.8342), the museum entrance (p-value: 0.2668), and the taxi ride (p-value: 0.5932). In the specific case of the double room, men were more willing to pay extra for a sustainable service, with the average being 7.58 euros, as compared to 6.06 euros on average for women. These results match the ones obtained by López-Sanchez and Pulido-Fernández [86].
In addition to the three factors discussed above, two other factors were considered with more than two independent groups or levels. Specifically, these factors were “age” (five levels) and “educational status” (four levels). In these two cases, the inferential tool used in order to contrast their possible influence on the willingness to pay for sustainability was an analysis of variance (ANOVA). The results of having applied this statistical tool are shown in Table 6.
In the case of the “age” factor, it has been noted that there were no differences in the willingness to pay more or less for the four products or services under consideration. In fact, the four p-values calculated greatly exceeded 5%, so in this case the hypothesis of average population equality values could not be rejected. This result resembles the ones obtained by other previous studios [63,70,86].
Conversely, it was not the same when the “education” factor was considered. It was only in the case of the sustainable restaurant (p-value: 0.140) where it could be acknowledged that the willingness to pay did not depend on the tourist’s level of education; for other products or services under consideration, the educational level of tourists who had visited the city of Caceres had an impact on the greater or lesser willingness to pay for sustainability. Faced with the rejection of the equality of averages hypothesis for the four levels of the “education” factor considered, the need for multiple comparisons (post-hoc tests) was confirmed.
In the case of a double room in a hotel (p-value: 0.021), the post-hoc tests determined the following relationship between the averages used for comparison: μ1 = μ2 < μ3 < μ4. This means that tourists with no education or only a primary school education were willing to pay an additional amount lower than the amounts that tourists with higher education levels were willing to pay. To be specific, tourists who lack education or have completed only primary school were willing to pay around 4.2–4.5 euros for a double room in a hotel with a sustainability certificate, which was clearly less than the nearly 6 euros that tourists with secondary education levels were willing to pay. In any case, the highest average amount could be observed among tourists with higher education levels, since they would be willing to pay 7.5 euros for greater sustainability in a hotel in the city.
On the other hand, in the case of a museum ticket (p-value: 0.003), the ranking of population means through post-hoc tests using Bonferroni’s procedure yielded the following results: μ1 = μ2 = μ3 < μ4. In this case, there was only one group of tourists who differed significantly from the behavior of others, referring to the group who had higher educational level, as they were willing to pay an extra 0.85 euros on average for a museum ticket if the increase improved sustainability. The rest of the tourists, as could be seen in the average values presented in Table 6, were not willing to pay much more than half a euro for the same service.
Finally, the payment of a surcharge for a taxi ride (p-value: 0.015) was the final tourism service in the city of Caceres for which significant differences were found depending on the educational level of tourists. The ranking of population means for the four educational levels considered was as follows: μ1 = μ2 < μ3 = μ4. Consequently, there were two clearly differentiated levels with regard to the willingness to pay for sustainability. On one hand, there were tourists with no education, or only with a primary school education, who were willing to pay no more than 0.3–0.6 euros extra for a ride in a sustainable taxi. On the other hand, there were tourists with secondary or higher education levels who would be willing to pay approximately one (1) additional euro for the same service.
The influence of the educational level on the willingness to pay for more sustainable tourism products and services verified empirically in this work was aligned with the results achieved in other studies [46,63,69,70,71].

6. Discussion of Results

Despite appearances, not all tourists visiting Caceres were willing to pay for sustainability. In fact, the percentage of those who wanted to contribute to the sustainability of the city through a higher price on its tourism products and services did not even reach 50%. It is possible that this situation was due to a lack of tourist information, or to the fact that sustainability was not yet a core tourism strategy in the city of Caceres. In fact, at the time of this writing, there was no reference to the city’s tourism sustainability strategy in the tourism section of the Caceres City Council website.
Action should be taken to make visitors aware that preserving the cultural and historical heritage of the city for future generations is an unavoidable objective. In this regard, the carrying out of certain actions aimed at spreading a culture of sustainability among visitors to the city has begun. Specific examples of these actions include the initiative entitled, “Every tin counts” (“Cada lata cuenta”), which is aimed at promoting recycling of beverage tins, or the campaign known as “#womadciudacáceres”, the purpose of which is to encourage pro-environmental behavior. Both of these programs were developed during the celebration of the Womad music festival. Another initiative to transform Caceres’ Main Square (Plaza Mayor de Cáceres) into a pedestrian zone, undertaken some years ago to create a pollution-free area, is a further example of such actions.
Among tourists who were willing to pay more for sustainable hotels in the city of Caceres, the average extra amount was confirmed at 6.78 euros, which was approximately 5%–10% more than the cost of a double room, depending on the time of year of the tourist’s stay. This additional amount would be acceptable for most of the city’s tourists, provided that they were properly informed that it would be used exclusively for taking actions to improve sustainability in hotels. Such actions would include eliminating food waste, minimizing water consumption by installing low flow showerheads, eliminating single-use plastic products, ending the use of paper in administrative processes, energy-saving actions, etc. In this sense, the Room Mate Ecolution project being undertaken by the hotel chain known as Room Mate may be a model for hotels in Caceres in terms of sustainability management. Through this project, they want to become the hotel chain with the highest level of sustainability by eliminating 80% of paper and plastic use by the end of 2020.
In the case of restaurants, the average extra amount for a lunch or dinner in an establishment that applies sustainability criteria in the city of Caceres amounts to 2.98 euros. This sum represents between 2% and 15% of the total price of a meal (in this case, the price variability of restaurants in Caceres is much greater than that of hotels). The purpose of this extra amount could be to use recycled materials, local or seasonal products, for the preparation of organic food, use of raw materials from fair trade sources, biodegradable products for washing dishes and cutlery, nutritious menus to promote a healthy diet, etc.
The payment for more sustainable museum management in the city of Caceres reached an average value of 0.75 euros, a figure that would be approximately 10% to 20% of the entrance fee (bearing in mind that some establishments, such as the Museum of Caceres, are free). The application of this small surcharge for entrance to the city’s museums would allow for the implementation of actions such as the search for energy efficiency, the use of renewable energy sources, education in sustainability values, the hiring of local employees, sustainable architectural design, the encouragement of recycling, reuse of materials, the promotion of fair trade in its commercial spaces, and so on.
With regard to the city’s taxi service, the tourists surveyed stated that they would be willing to pay an average of one additional euro for a ride in a sustainable taxi, a figure that would be between approximately 4% and 12% of the cost of a typical taxi ride in the city of Caceres. The purchase of ecological taxis by professionals of the sector with electric or hybrid motors, including ionized air conditioning, or the procurement of the ECO label from the Spanish General Directorate of Traffic (DGT) for the current fleet of taxis in the city, are just some of the actions that would convert a sector not traditionally considered to be especially sustainable into one that is more environmentally friendly. This would justify a slight increase in current fares for the sake of having a service that is considerably more ecological.
On the other hand, given the fact that the statistical distribution of extra fees for the four products and services analyzed in the city of Caceres is not considered to have achieved normality, and that a high concentration of values below (or far below in some cases) the average value has been noted, this situation should alert those responsible for establishing these hypothetical surcharges of the inappropriateness of setting them at levels above average values, since the percentage of tourists willing to pay them would be very low. Consequently, the recommendation resulting from this analysis is that private tourism agents who are involved in this issue should always set additional prices lower than the calculated average value. A good standard for the range of prices to be applied would be to set values between the first quartile and the median of the surcharge for each product or service (see Table 1).
In this research, a high correlation between the willingness to pay for sustainability among hotel and restaurant business services has been observed. Consequently, it is reasonable to propose joint sustainability actions between hotels and restaurants. Conversely, the willingness to pay more for a sustainable taxi service is generally less related to the city’s accommodation, restaurant and museum services. This is possibly due to the fact that this service is optional and not used by all tourists, unlike the situation of accommodation and restaurants, which are demanded by all visitors to the city (with the exception of those who take day trips and do not need accommodation).
When comparing the willingness to pay for greater sustainability in tourism products and services in the city of Caceres in 2012 and 2016, it has been observed that the extra monetary amounts are generally higher in the latter year. This situation does not necessarily indicate greater sustainability awareness by tourists visiting the city, but may be due to factors that are exclusively economic in nature. On one hand, the fact that the first phase of the survey was carried out in the midst of the economic crisis while the second was performed at the beginning of the recovery period may explain a greater willingness to pay these amounts in the second phase, since willingness to pay is determined by the income level of consumers, as mentioned above. On the other hand, the natural process of price increase (inflation), which is characteristic of any economy, may be having a subconscious effect in the minds of tourists resulting in the tendency to contribute more to sustainability simply because market prices of these products and services were higher in 2016 than in 2012.
On the other hand, foreign tourists visiting Caceres were willing to pay higher amounts than Spanish tourists to improve the sustainability of accommodation and public transport in the city. If at some point in time the decision were made to charge the customer for these non-market services, this scenario could become an important source of funding for tourism sustainability in the city of Caceres. However, the percentage of foreign tourists within the total number of visitors to the city of Caceres is so small (less than 20% of the entire amount) that these differences in the willingness to pay for sustainability between domestic and foreign tourists are nearly irrelevant.
Another interesting finding of this study was that the culture of sustainable tourism was not a gender issue, as men were generally not willing to pay more or less than women for tourism products and services with an increased level of sustainability. In a similar vein, this was not a generational issue, since no age segment were identified in which the average extra amounts they would be willing to pay for more sustainable tourism products or services were any higher than those of any other age segment.
Finally, unlike gender and age, it was empirically confirmed that there was a direct relationship between the willingness to pay for sustainability and the educational level of tourists. In fact, tourists with university or secondary education levels were always willing to pay more for greater sustainability of tourism products or services in the city. Consequently, it is necessary to design campaigns for the purpose of raising awareness among visitors to the city of Caceres who have lower educational levels regarding tourism sustainability. To this end, instruments should be used that can reach the entire population, not only the best educated. In this regard, the use of social networks and mobile applications related to tourism may be examples of awareness channels that could reach all classes and sectors of society.

7. Conclusions

This paper confirmed that, although the theoretical concept of sustainability seems to be installed in the mind of the tourist, its manifestation in the form of a willingness to pay for sustainability is not yet widespread. The fact that more than half of the tourists consulted in this research declare that they were not willing to pay more for more sustainable tourist services revealed a poor degree of awareness about the consequences that tourist management could have far from the principles of sustainability.
The analysis of the factors that might condition the willingness to pay for sustainability presented in this work matched the conclusions reached in other previous research papers. Therefore, the segmentation of the tourist market according to the origin of the tourist and its socioeconomic level, mainly, is necessary for the communication policies of sustainability strategies or actions of both tourist destinations and companies in the sector.
As limitations of the research carried out, the small number of factors used in the analysis and the absence of other factors that could enrich this paper can be noted. Among these factors, the level of income could be cited as a determining factor in the willingness to pay for sustainability. In this sense, the authors are considering conducting new surveys with the inclusion of this and other factors that could condition the aforementioned availability to pay.
Finally, among the future lines of research to be developed as a product of the results of this paper, the use of multivariate regression models to estimate the effect of a factor, having the rest of the factors controlled, the linkage of awareness to sustainability with climate change or obtaining data in other World Heritage Spanish cities in order to verify the hardiness of these results and to establish reliable statistical comparisons.

Author Contributions

Conceptualization, C.J.-R.; Methodology, M.S.-R.; Software (use), M.S.-R.; Validation, C.J.-R. and M.S.-R.; Formal Analysis, M.S.-R.; Investigation, C.J.-R.; Resources: C.J.-R.; Data Curation, M.S.-R.; Writing—original draft, M.S.-R. and C.J.-R.; Writing—Review and Editing, C.J.-R.; Visualization, M.S.-R.; Supervision, M.S.-R.; Project Administration, C.J.-R.; Finding Acquisition, C.J.-R.

Acknowledgments

This work was supported by Junta of Extremadura and co-financed by the European Regional Development Fund through help GR18110 (Econo+).

Conflicts of Interest

The authors declare no conflict of interest.

Appendix A

Questionnaire (only questions that have been addressed in the article have been included).
Origin:
□ Spain (Indicate Autonomous Community of origin) ………………………………………………….
□ Foreigner (Indicate country of origin) ……………………………………………………………………
Gender:
□ Female
□ Male
Age:
□ From 18 to 25 years old    □ From 26 to 40 y/o    □ From 41 to 55 y/o
□ From 56 to 65 y/o    □ Older than 66 y/o.
Educational level:
□ No studies □ Primary studies □ High School □ College/University.
1. Do you believe that good practices regarding sustainability raise the price of the tourist service?
□ Yes.
□ No.
2. Would you be willing to pay a raise on the price of a tourist service to enjoy your stay in a more sustainable destination?
□ Yes. (Go to question nº 3).
□ No. (Go to question nº 4).
3. Which quantity would you be willing to pay in order to enjoy a more sustainable tourist service in the following cases? (Cross the desired answer)
a) On a double hotel room:
(0 euros/1euro/2 euros/5 euros/10 euros/15 euros/20 euros/25 euros/30 euros/50 euros).
b) On a restaurant:
(0 euros/0.5 euros/1 euro/2 euros/3 euros/4 euros/5 euros/7.5 euros/10 euros/15 euros).
c) On the ticket to a museum:
(0 euros/0.1 euros/0.25 euros/0.50 euros/0.75 euros/1 euro/1.25 euros/1.50 euros/1.75 euros/2 euros).
d) On a taxi drive:
(0 euros/0.5 euros/1 euro/1.5 euros/2 euros/2.5 euros/3 euros/3.5 euros/4 euros/5 euros).

References

  1. United Nations World Tourism Organization (UNWTO). Baseline Report on the Integration of Sustainable Consumption and Production Patterns into Tourism Policies. Available online: https://www.e-unwto.org/doi/pdf/10.18111/9789284420605 (accessed on 15 June 2019).
  2. Zhang, J.J.; Joglekar, N.R.; Verma, R. Exploring resource efficiency benchmarks for environmental sustainability in hotels. Cornell Hosp. Q. 2012, 53, 229–241. [Google Scholar] [CrossRef]
  3. Leonidou, L.C.; Leonidou, C.N.; Fotiadis, T.A.; Zeriti, A. Resources and capabilities as drivers of hotel environmental marketing strategy: Implications for competitive advantages and performance. Tour. Manag. 2013, 35, 94–110. [Google Scholar] [CrossRef]
  4. Kang, K.H.; Stein, L.; Heo, C.Y.; Lee, S. Consumers’ willingness to pay for green initiatives of the hotel industry. Int. J. Hosp. Manag. 2011, 31, 564–572. [Google Scholar] [CrossRef]
  5. Dimara, E.; Mangarini, E.; Skuras, D. Consumers’ willingness to pay premium for green hotels: Fact or Fad? In Proceedings of the International Marketing Trends Conference 2015, Paris, France, 22–24 January 2014. [Google Scholar]
  6. Masau, P.; Prideaux, B. Sustainable tourism: A role for Kenya’s hotel industry. Curr. Issues Tour. 2003, 6, 197–208. [Google Scholar] [CrossRef]
  7. Kelly, J.; Haider, W.; Williams, P.W.; Englund, K. Stated preferences of tourists for ecoefficient destination planning options. Tour. Manag. 2007, 28, 377–390. [Google Scholar] [CrossRef]
  8. Han, H.; Hsu, L.-T.; Lee, J.-S. Empiricial investigation of the roles of attitudes toward Green behaviours, overall image, gender, and age in hotel customers’ eco-friendly decision-making process. Int. J. Hosp. Manag. 2009, 28, 519–528. [Google Scholar] [CrossRef]
  9. Manaktola, K.; Jauhari, V. Exploring consumer attitude and behavior towards green practices in the lodging industy in India. Int. J. Contemp. Hosp. Manag. 2007, 19, 364–377. [Google Scholar] [CrossRef]
  10. Han, X.; Chan, K. Perception of green hotels among tourists in Hong Kong: An exploratory study. Serv. Mark. Q. 2013, 34, 339–352. [Google Scholar] [CrossRef]
  11. Pearce, D.; Ozdemmiroglu, E. Economic Valuation with Stated Preferences Techniques; Department of Transport, Local Government and the Regions: London, UK, 2002.
  12. Throsby, D. Cultural capital. J. Cult. Econ. 1999, 23, 3–12. [Google Scholar] [CrossRef]
  13. Tuan, T.; Navrud, S. Capturing the benefits of preserving cultural heritage. J. Cult. Herit. 2008, 9, 326–337. [Google Scholar] [CrossRef]
  14. Báez, A.; Herrero, L.C. Using contingency valuation and cost-benefit analysis to design a policy for restoring cultural heritage. J. Cult. Herit. 2012, 13, 235–245. [Google Scholar] [CrossRef]
  15. Choi, A.S.; Ritchie, B.W.; Papandrea, F.; Benett, J. Economic valuation of cultural heritage sites: A choice modeling approach. Tour. Manag. 2010, 31, 213–220. [Google Scholar] [CrossRef]
  16. Bateman, I.J.; Carson, R.T.; Day, B.; Hanemann, M.; Hanley, N.; Hett, T.; Jones-Lee, M.; Loomes, G. Economic Valuation with Stated Preference Techniques: A Manual; Edward Elgar: Northampton, MA, USA, 2002. [Google Scholar]
  17. Carson, R.T.; Flores, N.E.; Meade, N.F. Contingent valuation: Controversies and evidence. Environ. Resour. Econ. 2001, 19, 173–210. [Google Scholar] [CrossRef]
  18. Martín, F. Determining the size of museum subsidies. J. Cult. Econ. 1994, 18, 255–270. [Google Scholar] [CrossRef]
  19. Sanz, J.A.; Herrero, L.C.; Bedate, A.M. Contingent valuation and semiparametric methods: A case study of the National Museum of Sculpture in Valladolid, Spain. J. Cult. Econ. 2003, 27, 241–257. [Google Scholar] [CrossRef]
  20. Bedate, A.M.; Herrero, L.C.; Sanz, J.A. Ex ante and ex post valuations of a cultural good. Are preferences or expectations changing? Environ. Plan. Manag. 2012, 55, 127–140. [Google Scholar] [CrossRef]
  21. Gómez-Zapata, J.D.; Espinal-Monsalve, N.E.; Herrero-Prieto, L.C. Economic valuation of museums as public club goods: Why build loyalty in cultural heritage consumption? J. Cult. Herit. 2018, 30, 190–198. [Google Scholar] [CrossRef]
  22. Madison, D.; Mourato, S. Valuing different road options for Stonehenge. Conserv. Manag. Archaeol. Sites 2001, 4, 203–212. [Google Scholar] [CrossRef]
  23. Carson, R.T.; Mitchell, R.C.; Conaway, M.C. Economic benefits to foreigners visiting Morocco accruing from the rehabilitation of the Fes Medina. In Valuing Cultural Heritage: Applying Environmental Valuation Techniques to Historic Buildings, Monuments and Artifacts; Navrud, S., Ready, R.C., Eds.; Edward Elgar: Northampton, MA, USA, 2002. [Google Scholar]
  24. Mazzanti, M. Valuing cultural heritage services by choice modeling experiments: Visitor study at the Galleria Borghese in Rome. In Proceedings of the 12th Biennial ACEI Conference, Rotterdam, The Netherlands, 13–15 June 2002. [Google Scholar]
  25. Mourato, S.; Kontoleon, A.; Danchev, A. Preserving cultural heritage in transition economies: A contingent valuation studies of Bulgarian monasteries. In Valuing Cultural Heritage: Applying Environmental Valuation Techniques to Historic Buildings, Monuments and Artifacts; Navrud, S., Ready, R.C., Eds.; Edward Elgar: Northampton, MA, USA, 2002. [Google Scholar]
  26. Gurira, N.A.; Ngulube, P. Using contingency valuation approaches to assess sustainable cultural heritage tourism use and conservation of the outstanding universal values (OUV) at Great Zimbabwe World Heritage Site in Zimbabwe. Procedia Soc. Behav. 2016, 225, 291–302. [Google Scholar] [CrossRef]
  27. Kim, H.; Oh, C.; Lee, S.; Lee, S. Assessing the economic values of World Heritage Sites and the effects of perceived authenticity on their values. Int. J. Tour. Res. 2017, 20, 126–136. [Google Scholar] [CrossRef]
  28. Hansen, T. The willingness to pay for the royal theatre in Copenhagen as a public good. J. Cult. Econ. 1997, 21, 1–28. [Google Scholar] [CrossRef]
  29. Santagata, W.; Signorello, G. Contingent valuation and cultural policy design: The case of Napoli Musei Aperti. J. Cult. Econ. 2000, 24, 315–331. [Google Scholar] [CrossRef]
  30. Kopsidas, O. The opportunity cost as a critical determinant factor of the cultural heritage monuments’ valuation: A modified contingent valuation method. J. Environ. Sci. Eng. B 2018, 7, 55–64. [Google Scholar] [CrossRef]
  31. Georgiou, S.; Langford, I.H.; Bateman, I.J.; Turner, R.K. Determinants of individuals’ willingness to pay for perceived reductions in environmental health risks: A case study of bathing water quality. Environ. Plan. A 1998, 30, 577–594. [Google Scholar] [CrossRef]
  32. Preibler, S. Evaluation of the quality of European coastal water by German tourists. In Coastal Change in the Southern Baltic Sea Region, Coastline Reports; Schernewski, G., Janben, H., Schumacher, S., Eds.; EUCC—The Coastal Union: Leiden, The Netherlands, 2009; Volume 13, pp. 177–186. [Google Scholar]
  33. Machado, F.; Mourato, S. Improving the assessment of water related health impacts: Evidence from coastal waters in Portugal. In Proceedings of the First World Congress on Environmental and Resource Economics, Venice, Italy, 25–27 June 1998. [Google Scholar]
  34. Beharry-Borg, N.; Scarpa, R. Valuing quality changes in Caribbean coastal waters for heterogeneous beach visitors. Ecol. Econ. 2010, 69, 1124–1139. [Google Scholar] [CrossRef]
  35. Peng, M.; Oleson, K.L. Beach recreationalists’ willingness to pay and economic implications of coastal water quality problems in Hawaii. Ecol. Econ. 2017, 136, 41–52. [Google Scholar] [CrossRef]
  36. Hess, S.; Beharry-Borg, N. Accounting for latent attitudes in willingness-to-pay studies: The case of coastal water quality improvements in Tobago. Environ. Resour. Econ. 2012, 52, 109–131. [Google Scholar] [CrossRef]
  37. Ünal, Ö.; Williams, A.T. Beach visits and willingness to pay: Cesme Peninsula, Turkey. In Proceedings of the MEDCOASTEMECS 99 Joint Conference, Land-Ocean Interactions: Managing Coastal Ecosystems, Antalya, Turkey, 9–13 November 1999; pp. 1149–1162. [Google Scholar]
  38. Blakemore, F.B.; Williams, A.T.; Ozhan, E. Tourist valuation of Olu Deniz beach, Turkey, using contingent valuation and travel coast approaches. J. World Leis. 2000, 4, 48–55. [Google Scholar] [CrossRef]
  39. Blakemore, F.B.; Williams, A.T.; Micallef, A.; Conan, C.; Ünal, Ö. A comparison of tourist evaluation of beaches in Malta, Romania and Turkey. J. World Leis. 2002, 44, 29–41. [Google Scholar] [CrossRef]
  40. Togridou, A.; Hovardas, T.; Pantis, J.D. Determinants of visitors’ willingness to pay for the National Marine Park of Zalynthos, Greece. Ecol. Econ. 2006, 60, 308–319. [Google Scholar] [CrossRef]
  41. Blakemore, F.B.; Williams, A. British tourists’ valuation of a Turkish beach using contingent valuation and travel cost methods. J. Coast. Res. 2008, 24, 1469–1480. [Google Scholar] [CrossRef]
  42. Logar, I.; van den Bergh, J. Respondent uncertainty in contingent valuation of preventing beach erosion: An analysis with a polychotomous choice question. J. Environ. Manag. 2012, 113, 184–193. [Google Scholar] [CrossRef] [PubMed] [Green Version]
  43. Ariza, E.; Ballester, R.; Rigall-I-Torrent, R.; Saló, A.; Roca, E.; Villares, M.; Jiménez, J.A.; Sardá, R. On the relationship between quality, users’ perception and economic valuation in NW Mediterranean beaches. Ocean Coast. Manag. 2012, 63, 55–66. [Google Scholar] [CrossRef]
  44. Birdir, S.; Ünal, Ö.; Birdir, K.; Williams, A.T. Willingness to pay as an economic instrument for coastal tourism management: Cases for Mersin, Turkey. Tour. Manag. 2013, 36, 27–283. [Google Scholar] [CrossRef]
  45. Rodella, I.; Madau, F.; Mazzanti, M.; Corbau, C.; Carboni, D.; Utizi, K.; Simeoni, U. Willingness to pay for management and preservation of natural, semi-urban and urban beaches in Italy. Ocean. Coast. Manag. 2019, 172, 93–104. [Google Scholar] [CrossRef]
  46. Langford, I.H.; Kontogianni, A.; Skourtos, M.S.; Georgiou, S.; Bateman, I.J. Multivariate mixed models for openended contingent valuation data: Willingness to pay for conservation of monk seals. Environ. Resour. Econ. 1998, 12, 443–456. [Google Scholar] [CrossRef]
  47. Fan, Z. Investigating the Potential for a PES (Payment for Environmental Services) System for Marine Turtle Conservation: The Case of Protection of Marine Turtle Breeding Sites in Crete, Greece. Master’s Thesis, ITC, Enschede, The Netherlands, March 2008. [Google Scholar]
  48. Sayan, S.; Williams, A.T.; Johnson, D.E.; Ünal, Ö. A pilot study for sustainable tourism in the coastal zone of Antalya, Turkey: Tourists, turtles or both? J. Coast. Res. 2011, 64, 1806–1810. [Google Scholar]
  49. Shivlani, M.P.; Letson, D.; Theis, M. Visitor preferences for public beach amenities and beach restoration in South Florida. Coast. Manag. 2003, 31, 367–385. [Google Scholar] [CrossRef]
  50. Chang, J.I.; Yoon, S. Assessing the economic value of beach restoration: Case of Son-do beach, Korea. J. Coast. Res. 2017, 79, 6–10. [Google Scholar] [CrossRef]
  51. Matthews, Y.; Scarpa, R.; Marsh, D. Stability of willingness-to-pay for coastal management: A choice experiment across three time periods. Ecol. Econ. 2017, 138, 64–73. [Google Scholar] [CrossRef]
  52. Zang, F.; Wang, X.H.; Nunes, P.A.; Ma, C. The recreational value of gold coast beaches, Australia: An application of the travel cost method. Ecosyst. Serv. 2015, 11, 106–114. [Google Scholar] [CrossRef]
  53. Blignaut, J.; Mander, M.; Inglesi-Lotz, R.; Glavan, J.; Parr, S. The amenity value of Abu Dhabi’s coastal and marine resources to its beach visitors. Ecosyst. Serv. 2016, 19, 32–41. [Google Scholar] [CrossRef]
  54. Pragaya, P. Estimating the value of beach recreation for locals in the great barrier reef marine park, Australia. Econ. Anal. Policy 2017, 53, 9–18. [Google Scholar] [CrossRef]
  55. Enríquez-Acevedo, T.; Botero, C.M.; Cantero-Rodelo, R.; Pertuz, A.; Suárez, A. Willingness to pay for Beach Ecosystem Services: The case study of three Colombian beaches. Ocean. Coast. Manag. 2018, 161, 96–104. [Google Scholar] [CrossRef]
  56. Hultman, M.; Kazeminia, A.; Ghasemi, V. Intention to visit and willingness to pay premium for ecotourism: The impact of attitude, materialism, and motivation. J. Bus. Res. 2015, 68, 1854–1861. [Google Scholar] [CrossRef]
  57. Pedroso, R.; Kung’u, J.B. Tourists’ willingness to pay for upstream restoration and conservation measures. J. Sustain. Tour. 2019. [Google Scholar] [CrossRef]
  58. Cheung, L.T.O. The effect of geopark visitors’ travel motivations on their willingness to pay for accredited geo-guided tours. Geoheritage 2016, 8, 201–209. [Google Scholar] [CrossRef]
  59. Wang, P.-W.; Jia, J.-B. Tourists’ willingness to pay for biodiversity conservation and environment protection, Dalai Lake protected area: Implications for entrance fee and sustainable development. Ocean Coast. Manag. 2012, 62, 24–33. [Google Scholar] [CrossRef]
  60. Platania, M.; Rizzo, M. Willingness to pay for protected areas: A case of Etna Park. Ecol. Indic. 2018, 93, 201–206. [Google Scholar] [CrossRef]
  61. Namkung, Y.; Jang, S. Are consumers willing to pay more for green practices at restaurants? J. Hosp. Tour. Res. 2014. [Google Scholar] [CrossRef]
  62. Meleddu, M.; Pulina, M. Evaluation of individuals’ intention to pay for premium price for ecotourism: An exploratory study. J. Behav Exp. Econ. 2016, 65, 67–78. [Google Scholar] [CrossRef]
  63. López-Sánchez, Y.; Pulido-Fernández, J.I. Factor influencing the willingness to pay for sustainable tourism: A case of mass tourism destinations. Int. J. Sustain. Dev. World 2017, 24, 262–275. [Google Scholar] [CrossRef]
  64. Kostakis, I.; Sardianou, E. Which factors affect the willingness of tourists to pay for renewable energy? In Proceedings of the World Renewable Energy Congress, Linköping, Sweden, 8–13 May 2011; pp. 2578–2585. [Google Scholar]
  65. Van Liere, K.D.; Dunlap, R.E. The social bases of environmental concern: A review of hypotheses, explanations and empirical evidence. Public Opin. Q. 1980, 44, 181–197. [Google Scholar] [CrossRef]
  66. Daniere, A.G.; Takahashi, L.M. Environmental behavior in Bangkok, Thailand: A portrait of attitudes, values and behavior. Econ. Dev. Cult. Chang. 1999, 47, 552–557. [Google Scholar] [CrossRef]
  67. Arcury, T.A.; Scollay, S.J.; Johnson, T.P. Sex differences in environmental concern and knowledge: The case of acid rain. Sex Roles 1987, 16, 463–472. [Google Scholar] [CrossRef]
  68. Laroche, M.; Bergeon, L.; Barbaro-Forleo, G. Targeting consumers who are willing to pay more for environmentally friendly products. J. Consum. Mark. 2001, 18, 503–520. [Google Scholar] [CrossRef] [Green Version]
  69. Zeidner, M.; Shechter, M. Psychological responses to air pollution: Some personality and demographic correlates. J. Environ. Psychol. 1988, 8, 191–208. [Google Scholar] [CrossRef]
  70. Halkos, G.; Matsiori, S. Determinants of willingness to pay for coastal zone quality improvement. J. Socio Econ. 2012, 41, 391–399. [Google Scholar] [CrossRef]
  71. Alves, B.; Benavente, J.; Ferreira, O. Beach users’ profile, perceptions and willingness to pay for beach management in Cadiz (SW Spain). J. Coast. Res. 2014, 70, 521–526. [Google Scholar] [CrossRef]
  72. Cooper, P.; Poe, G.L.; Bateman, I.J. The structure of motivation for contingent values: A case study of lake water quality improvement. Ecol. Econ. 2004, 50, 69–82. [Google Scholar] [CrossRef]
  73. Sauer, U.; Fisher, A. Willingness to pay, attitudes and fundament values on the cognitive context of public preferences for diversity in agricultural landscapes. Ecol. Econ. 2010, 70, 1–9. [Google Scholar] [CrossRef]
  74. Ajzen, I. The theory of planned behavior. Organ. Behav. Hum. Decis. Process. 1991, 50, 179–211. [Google Scholar] [CrossRef]
  75. Bernath, K.; Roschewitz, A. Recreational benefits of urban forests: Explaining visitors’ willingness to pay in the context of the theory of planned behavior. J. Environ. Manag. 2008, 89, 155–166. [Google Scholar] [CrossRef] [PubMed]
  76. Spash, C.; Urama, K.; Burton, R.; Kenyon, W.; Shannon, P.; Hill, G. Motives behind willingness to pay for improving biodiversity in water ecosystems: Economics, ethics and social psychology. Ecol. Econ. 2009, 68, 955–964. [Google Scholar] [CrossRef]
  77. López-Mosquera, N.; García, T.; Barrena, R. An extension of the Theory of Planned Behavior to predict willingness to pay for the conservation of an urban park. J. Environ. Manag. 2014, 135, 91–99. [Google Scholar] [CrossRef] [PubMed]
  78. Yadav, R.; Pathak, G.S. Determinants of consumers’ green purchase behavior in a developing nation: Applying and extending the Theory of Planned Behavior. Ecol. Econ. 2017, 134, 114–122. [Google Scholar] [CrossRef]
  79. Shin, Y.H.; Im, J.; Jung, S.E.; Severt, K. Locally sourced restaurant: Consumer’s willingness to pay. J. Food Bus. Res. 2018, 21, 68–82. [Google Scholar] [CrossRef]
  80. Sánchez, M.; López-Mosquera, N.; Lera-López, F.; Faulin, J. An extended planned behavior model to explain the willingness to pay to reduce noise pollution in road transportation. J. Clean. Prod. 2018, 177, 144–154. [Google Scholar] [CrossRef]
  81. Tommasetti, A.; Singer, P.; Troisi, O.; Maione, G. Extented Theory of Planned Behavior (ETPB): Investigating customers’ perception of restaurants’ sustainability by testing a structural equation model. Sustainability 2018, 10, 2580. [Google Scholar] [CrossRef]
  82. Carson, R.T. Contingent valuation: A user’s guide. Environ. Sci. Technol. 2000, 34, 1413–1418. [Google Scholar] [CrossRef]
  83. Sanjurjo, E.; Islas, E.I. Valoración económica de la actividad recreativa en el río Colorado. Reg. Soc. 2007, 40, 147–172. [Google Scholar] [CrossRef]
  84. Martín-López, B.; Montes, C.; Benayas, J. The non economic motives behind the willingness to pay for biodiversity conservation. Biol. Conserv. 2007, 139, 67–82. [Google Scholar] [CrossRef]
  85. United Nations Environment Programme—UNEP. Guidance Manual for the Valuation of Regulating Services; UNEP: Nairobi, Kenya, 2010. [Google Scholar]
  86. López-Sánchez, Y.; Pulido-Fernández, J.I. Factores determinantes de la disposición a pagar por un destino más sostenible. El caso de la Costa del Sol Occidental. Cuad. Tur. 2014, 33, 199–231. [Google Scholar]
Figure 1. A descriptive map of the city of Caceres. Source: City Hall of Caceres.
Sustainability 11 05880 g001
Figure 2. Histogram of the willingness to pay for the tourism products and services analyzed. Source: created by the authors using calculations from the R Commander Library of R software.
Sustainability 11 05880 g002
Figure 3. Box-plot diagram of the willingness to pay for the tourism products and services analyzed. Source: created by the authors using calculations from the R Commander Library of R software.
Sustainability 11 05880 g003
Figure 4. Matrix of scatter plot diagrams of the willingness to pay with regard to the tourism products and services analyzed. Source: created by the authors using calculations from the R Commander Library of R software.
Sustainability 11 05880 g004
Figure 5. Density functions of products and services analyzed for both female and male tourists (Factor: gender). Source: created by the authors using calculations from the R Commander Library of R software.
Sustainability 11 05880 g005aSustainability 11 05880 g005b
Table 1. Accommodation and catering offer in the city of Caceres (state for 2017).
Number of EstablishmentsNumber of Places Offered
- Hotels212138
- Hostel9209
- Pension462
- Rural accommodation14
- Tourist apartments40235
- Tourist hostels2105
- Camping1538
Total accommodation783291
- Restaurants17311,827
- Catering80
- Banquet halls125858
Total restoration19317,685
Source: Tourism Observatory of Extremadura (2018).
Table 2. Annual volume of tourists in the city of Caceres and some tourist load ratios.
201620172018
Annual number of tourists305,156312,974341,541
Average number of tourists per month25,43026,08128,462
Annual number of tourists per square kilometer174.3178.8195.1
Average monthly tourist/local population ratio26.2%27.0%29.5%
Source: Tourism Observatory of Extremadura (2018).
Table 3. Descriptive statistics of the willingness to pay for greater sustainability in the products and services analyzed.
Double Room in a HotelRestaurantMuseum TicketTaxi Ride
- Mean6.782.980.751.09
- Bounded mean (98%)6.552.910.751.06
- Standard deviation6.232.770.590.98
- IQR8.003.000.751.00
- CV0.920.930.780.90
- Skewness2.561.950.741.61
- Kurtosis12.224.86−0.243.46
- First quartile2.001.000.250.50
- Median5.002.000.501.0
- Third quartile10.004.001.001.5
- Number of observations387387384381
- Missing data (NA)0036
Source: created by the authors using calculations from the R Commander Library of R software.
Table 4. Matrix of bivariate correlations between the willingness to pay for the tourism products and services analyzed (p-value for a bilateral contrast, in parentheses).
Double Room in a HotelRestaurant Museum TicketTaxi Ride
Double room in a hotel1.0000.62930.46200.3710
(<0.0001)(<0.0001)(<0.0001)
Restaurant 1.0000.53080.4977
(<0.0001)(<0.0001)
Museum ticket 1.0000.5061
(<0.0001)
Taxi ride 1.000
Source: created by the authors using calculations from the R Commander Library of R software.
Table 5. t-test of equality of means for the tourism products and services analyzed (factors: year, origin, and gender).
Double Room in a HotelRestaurantMuseum TicketTaxi Ride
Factor: YEAR
1 = year 2012
2 = year 2016
−2.6463 (1)−1.9987−2.69491.3455
0.0008 (2)0.04630.00730.1793
−2.8976 (3)−1.1129−0.2783−0.0625
−0.4228 (4)−0.0091−0.04350.3333
5.9427 (5)2.70050.67281.1559
7.6051 (6)3.26150.83371.0205
Factor: ORIGIN
1 = national
2 = foreign
−2.8429−1.7324−1.5726−2.4883
0.00470.08400.11660.0132
−4.3875−1.5118−0.3082−0.6438
−0.79990.09550.0343−0.0755
6.42522.88620.73471.0366
9.01893.59430.87171.3962
Factor: GENDER
1 = female
2 = male
−2.3636−0.2095−1.1121−0.5347
0.01860.83420.26680.5932
−2.7854−0.6310−0.1892−0.2603
−0.25550.50950.05250.1490
6.05942.97770.72511.0783
7.57993.03850.79351.1339
Notes: (1) t statistics; (2) p-value (bilateral); (3) lower limit of 95% confidence interval; (4) upper limit of 95% confidence interval; (5) mean value of group 1; and (6) mean value of group 2. Source: created by the authors using calculations from the R Commander Library of R software.
Table 6. Variance analysis of the tourism products and services analyzed (factors: age, and educational level).
Double Room in a HotelRestaurantMuseum TicketTaxi Ride
Factor: AGE
1 = from 18 to 25
2 = from 26 to 40
3 = from 41 to 55
4 = from 56 to 65
5 = over 65
0.307 (1)0.8360.6450.523
0.873 (2)0.5030.6310.719
7.8846 (3)2.63460.72501.0000
6.5702 (4)2.80580.69381.0455
6.8837 (5)3.35660.80891.1457
7.0274 (6)2.86300.76671.0352
6.3529 (7)3.00000.79241.2656
Factor: EDUCATION
1 = no studies
2 = primary education
3 = secondary education
4 = higher education
3.297 (1)1.8374.8123.519
0.021 (2)0.1400.0030.015
4.2000 (3)2.30000.54000.3000
4.5500 (4)2.05000.52250.6000
5.9048 (5)2.71830.64520.9516
7.5895 (6)3.24670.84911.1991
Notes: (1) F statistics; (2) p-value (unilateral); (3) group 1 mean value; (4) group 2 mean value; (5) group 3 mean value; (6) group 4 mean value; and (7) group 5 mean value. Source: created by the authors using calculations from the R Commander Library of R software.

