1. Introduction
With economic growth, the rate of world urbanization is continuously accelerating, e.g., China’s urbanization rate grew from 12.84% in 1953 to 58% in 2018 [
1]. A series of fundmental problems caused by rapid urbanization include a surge in urban greenhouse gas pollution (GHS) and severe traffic congestion [
2]. Since 2012, the annual growth rate of China’s motor vehicle production and sales has exceeded 15%. Currently, quantitative research shows that the rapid growth in traffic flow has placed tremendous pressure on urban traffic networks [
3]. Furthermore, rapid urbanization also engenders air pollution, traffic congestion and energy crisis. Most countries in the world rely on the importation of fossil fuels for energy, especially China, the United States, and Japan. Fossil energy consumption contributes to air pollution and the global GHG problem [
4,
5,
6]. EVs are proposed as an effective solution for GHG reduction, which plays a crucial part in preserving living conditions suitable for human life. However, EV market share is still quite small, with the key barrier to the spread adoption of EVs being mileage anxiety. To overcome this barrier, some researchers studied the location challenges to intercity and intracity charging facilities for alleviating the difficulties surrounding EV charging [
7].
Although EVs are gradually coming into people’s daily lives, a sustainable range on most EVs still cannot eliminate mileage anxiety in most consumers. The previous studies show that the fully charged range of most pure EVs is still less than 400 km, e.g., BYD E6, and the Nissan LEAF [
8]. Furthermore, a great number of EVs and plugin hybrid electric vehicles (PHEVs) have a fully charged range less than 200 km, e.g., BYD Qin, Tang, Rongwei E50, Nissan EV, BMW Mini E. Furthermore, severe traffic jams induce severe pressure as they occur with high frequency in some countries, especially in China. A terrible traffic situation increases the EV’s energy consumption for the journey. Thus, unavailability of electricity for charging during a trip in an EV has become a major source of anxiety for consumers. To improve consumers’ driving experience, the traditional solution is to locate fixed charging facilities in public areas to provide recharging services, e.g., charging piles at office building, family night charging facilities, or large fast charging stations [
9]. However, land is scare resource with a limit supply, and even unavailable in some of the world’s megacities. Furthermore, there is “the chicken and egg dilemma” of investing in charging facilities versus large-scale adoption of EVs. It is difficult to decide whether to wait for the spread in the adoption of EVs before building charging facilities, or to build a large number of charging facilities to stimulate rapid market penetration of EVs. The other solution is to dispatch mobile charging stations (MCSs) at off-street locations for regular recharging or as a rescue service for situations where an EV’s battery runs out of energy [
10,
11].
Market research reveals that the return on investment (ROI) period for charging facilities is unpredictable. The 2017 Shenzhen EVs Charging Facilities White Paper reports that the number of charging piles built-in Shenzhen has reached 7962, but only 3697 charging piles can be used regularly, which is 46.3% of the total number. The daily use rate of the charging facilities is only 4.56% [
12]. It is urgent that a balance is struck between the availability of charging facilities and EV charging demand. Thus, this paper proposes a new method for joint planning of MCS and large fixed charging towers in a city. It considers the deployment of MCS in urban centers, and the deployment of large public charging towers in urban suburbs. The large public charging towers should cover all recharging needs of the MCS during its inactive hours.
In recent decades, many researchers have studied the EV charging station location problem. Max Shen et al. proposed a battery swapping strategy based on British Petroleum solutions, considering the minimum building cost, and operation cost and estimating ROI on charging infrastructure [
13]. Other researchers focused on the location decision and optimization problem of fixed charging stations (FCS) [
14,
15]. the flow capturing location model (FCLM) proposed by Hodgson (1990) is a classic flow-based model [
16]. Kuby and Lim (2005) extended the model by proposing a flow refueling location model (FRLM) [
17]. In the FRLM, a flow is not considered captured unless it is possible to travel the destination and back without running out of energy, which giving EVs’ limited driving range, may require multiple refueling stations properly located along a covered origin-destination (OD) flow path. To extend the FRLM, other researchers proposed approaches that involve locating refueling stations along arcs and allowing deviation from fixed routes or shortest paths [
18]. Upchurch and Kuby (2009) extended the FRLM model and built a new model, the capacited flow-refueling location model (CFRLM), which constrains the station charging capacity and is more realistic [
19]. Meanwhile, based on the FRLM, Wang and Lin (2009) formulated a set-covering model for locating charging stations that achieves multiple origin-destination intercity travel via EVs [
20]. Hwang et al. extended the model to a path-based demand model on a directed transportation network [
21]. However, Sung Hoon Chung, et al. explored and extended the FRLM to a multi-period planning model for EVs charging station deployment, which also meets the gradual provision of charging facilities over time [
22,
23,
24]. Previous researcher has studied multiple types of recharging stations for EVs, including the deviation flow refueling location model (DFRLM) and the MFRLM, which are based on the FRLM [
25]. However, these research seldom consider the situation of limited land supply in an urban city [
26,
27,
28,
29]. It can be postulated that land as a resource will become severely scarce in the forthcoming years. Thus, many researchers have begun to study the MCS system to alleviate land occupation problem [
30]. Essentially, the MCS system is a movable charging station, which is not fixed in one place. As charging demand varies with the transportation situation, the MCS system can be moved to a new demand center, usually for charging or emergency rescue charging. Meanwhile, energy storage technology and its applications have made significant breakthroughs in recent years, especially in battery storage, which was used in the optimization of electricity grid networks and movable energy supply scenarios [
31]. Several large second recharging battery suppliers such as BYD, and CATL, have established innovative energy storage systems and applications for some unique scenarios. Furthermore, the LiFePO
battery has demonstrated that it is reliable and safe solution for energy storage [
32]. K.W and S.B (2015) designed an MCS system running in an urban environment that contained two types of modules, one for charging alone, and the other for swapping [
33]. Another MCS system was proposed and its applicability demonstrated by M.B. et al. These studies in the literature indicate that MCSs will become a booming market for the spread of EVs adoption [
34,
35].
This study formulates a new model that considers multiple period equilibrium planning of mobile charging station for EVs. The study extends scenarios of MCS to cover the EV’s path flow and builds on previous studies by Sung Hoon et al. and Ying-Wei Wang. These previous studies researched the maximum coverage of a fixed charging station problem in multi-periods and even evaluated the distinct types of charging facility deployment. However, previous studies seldom considered that mobile charging facilities enable EV recharging along the path. Thus, this study endeavors to formulate the MCS location and relocation problem and obtain a global optimization solution. The contribution of this research is summarized as follows.
- 1.
This study extends the location problem of traditional fixed charging stations for electric vehicles, and reformulates the location optimization model of the MCS.
- 2.
This study considers the influence of the multi-period time window effect on location optimization of MCS, and outlines a quantitative layout strategy.
- 3.
This study adopts stochastic user equilibrium constraints to characterize the impact of a traffic congestion condition on path selection of an EV’s flow, and ensures that the model is realistic.
The rest of this paper is organized as follows:
Section 2 describes the proposed MCS system operation and service scenarios and formulates the MCS location-allocation problem considering stochastic user equilibrium situations.
Section 3 transforms the nonlinear model into a regular linear formulation and solves the problem using CPLEX on the NEOS public cloud.
Section 4 presents a numerical example to demonstrate the location-allocation model. Lastly,
Section 5 concludes the paper.
2. Problem Description and Definition
Let denotes the network of roads in a city or metropolitan area, where N and A are the sets of nodes and links in the network, respectively. We dedicate a link as to represent the pair of starting and ending nodes. Assume that the travel demands of interest originate from a set of original nodes . Next, let denote a set of destinations. We locate a fixed numbers of MCSs at candidate locations J in the network to maximize capture path flow during period T. Furthermore, let denote the set of candidate locations that can cover path , and P represents the set of paths. Let express the total traffic flow of an OD pair during period t. represents location selection cost at candidate j, denotes MCS build cost at j, denotes MCS removal cost from location j, and C represents the investment budget limit for the entire periods. In addition, represents the capacity of MCS, and are defined as the incidence of path-OD, and path-link, respectively. Thus, , if the MCS is located at node j during period t, otherwise it is 0. , if the MCS is moved to j during period t and if EVs flow on path p is covered.
2.1. Scenario Descriptions
This study proposes an MCS recharging service system for an urban city. As a great number of MCS have begun to penetrating the market over the past five years, e.g., BYD mobile charging container, Zhu Hai Yinlong’s mobile charging truck for EVs, and Shenzhen Sanxun’s MCS, the study proposes a new method of operating an MCS in an urban city. Due to the scarcity of land as a public resources, the deployment cost of large public charging stations is very high in urban cities. Therefore, there is academic and practical value to establishing MCSs in an urban area. However, it necessary to build large public charging stations in the suburbs to meet MCS recharging demand. An MCS recharges and stores energy during the valley period of the electricity grid, and delivers charging services to EVs based on real-time recharging demand or for rescue under emergency situation. Considering the rapid progress of information and communication technology (ICT), it is easy to build a public cloud network that connects MCSs, large public charging stations, and clients, as shown in the structure of
Figure 1.
Figure 2 and
Table 1 present one kind of MCS and its technology parameters.
An MCS is equipped with a lithium iron phosphate battery for energy storage. It can provide mobile recharging for EVs to sufficiently replenish the state of charge (SOC) just for arriving at destinations. Furthermore, EVs can continue to request MCS for real-time recharging service according based on its SOC condition. Therefore, for the efficiency of MCS delivering services, the capacity of the MCS energy storage system should be designed for flexibility.
As shown in
Table 2, the Tesla Model S (2017) is equipped with a 100kW.H battery. Presently, that is the maximum range EV in the market. However, a large capacity MCS (
Figure 2) can fully charge ten Tesla Model S (2017) vehicles on one charge. If the vehicle only charges 20% for further mileage to its destination, the MCS can fully charge more than 80 BYD e6 vehicles or DENZAs.
The MCS will be dynamically deployed to authorized off-street parking spaces in an urban area and wait for charging appointments through a connected car networking system. When EV charging demand increases significantly in an area, the central cloud service platform would dispatch a free MCS to the area with higher charging demand to fulfill requests. The central cloud service platform can obtain MCS real-time location with a high precision position system configured for MCSs. Meanwhile, the MCS also synchronizes location data with the a management center via a low latency communication network such as an LTE-advance or 5G wireless network [
37]. Furthermore, users can log in to an application platform software (APP) to obtain up-to-date information on the MCSs, and, decide when to reserve a charging slot or emergency rescue. To simplify the modeling and solving of the problems, this study made several assumptions:
- i
Assume all EV have a fully charged status at their point of origination, and that they can multi-stop and patronize MCSs for recharging on the path to their destinations.
- ii
EVs flow in the network is considered to increase by 5% per year.
- iii
Public policy allows MCS parking at dedicated off-street space to provide charging services
- iv
When an EV calls for real-time MCS charging service, the battery will be recharged to the specific SOC required for completing the remainder of the trip.
- v
A route flow is considered to be captured if the vehicles on that route can complete the whole trip without running out of energy.
- vi
An EV will not run out of energy if all the path link segments can be refueled.
2.2. Notation
This study uses the following notation to formulate a model:
Sets and parameters
| T | set of all periods t |
| W | set of all OD pairs w |
| P | set of all paths p |
| A | set of all links a in the network |
| J | set of all MCS candidate locations j |
| set of candidate location which can cover path p |
| EVs flow of OD w in W |
| location cost at node j |
| MCS establishing cost at node j |
| MCS relocation cost at j |
| C | MCS investment budget in period T |
| S | Maximum number of MCSs deployment during the period T |
| the coefficient between pathS P and OD pairs W, ∈ W |
| link path incidence, =1 if link a belongs to path p, 0 otherwise |
| free flow travel time on link a during period t |
| link capacity on link a during period t |
| negative scaling parameter for travel time |
| positive scaling parameter for the availability of MCS |
| Upper bound of |
Decision variables
| t | EVs flow on route p during period t |
| the probability of an EV choosing path p during period t |
| EVs flow on link a during period t |
| travel time on link a during period t |
2.3. Model Formulation
We formulated a mixed-integer nonlinear programming (MINLP) model based on the proposed dynamical MCS services scenarios as followS:
The objective of Equation (
1) is to maximize the captured flow using MCSs. Many previous studies derived the
- exogenously, determined by solving the shortest path problem. However, we define
as a variable to be solved endogenously. Hence, the objective function (1) is inherently nonlinear. Equation (
2) ensures that MCS deployment increases over the period. Equation (
3) represents the total cost limit, including location planning cost, MCS deployment cost, and MCS relocation cost. Equation (
4) indicates that the total number of MCS established is less than candidate locations, and M is a big enough integer to ensure that the inequality is established. Equation (
5) means that the rate of MCS movement is constrained to a constant during the planning period. Equation (
6) ensures that the flow on a specific path
p is considered to be captured if EVs can use all links of the path without running out of energy. Equation (
7) indicates that EV flow on path
p is equal to the total traffic flow between the OD pairs multiplied by the probability of selecting path
p. The multinomial logit model (MNL) equation in Equation (
8) is used to describe the traveler’s routing choice behavior, in which two factors are considered: the availability of MCSs as captured by
, and flow-dependent travel time, which evaluates the network traffic congestions effects [
38,
39]. The total travel time using path
p is determined by Equation (
9). Furthermore, Equation (
10) uses the Bureau of Public Road (BPR) function of the US Department of Transportation to calculate the transit time of the link in the path. In the BPR function, index
is the empirical value of the academic area of transportation [
40]. Finally, Equation (
11) indicates that the traffic flow of the link is equal to traffic flow through path
p multiplied by a link-path correlation coefficient.
This research formulation is an evolution of the classical FCLM model [
41]. By introducing stochastic user equilibrium (SUE) constraints [
42], and considering the traffic flow assignment and dispatching problem with reference to some previous studies [
43,
44], we accessed the influence of traffic congestion on charging path selection. Meanwhile, the model considers the optimal dynamic deployment of MCSs over multiple periods. Furthermore, the model is a mixed-integer nonlinear programming model due to the endogenous characteristics of the EV flow variables. We use the linearization algorithm to transform the original nonlinear model into a linear one to simplify the solving procedure. Thus, we obtain the global solution using the CPLEX solver on the NEOS Server.
4. Numerical Example
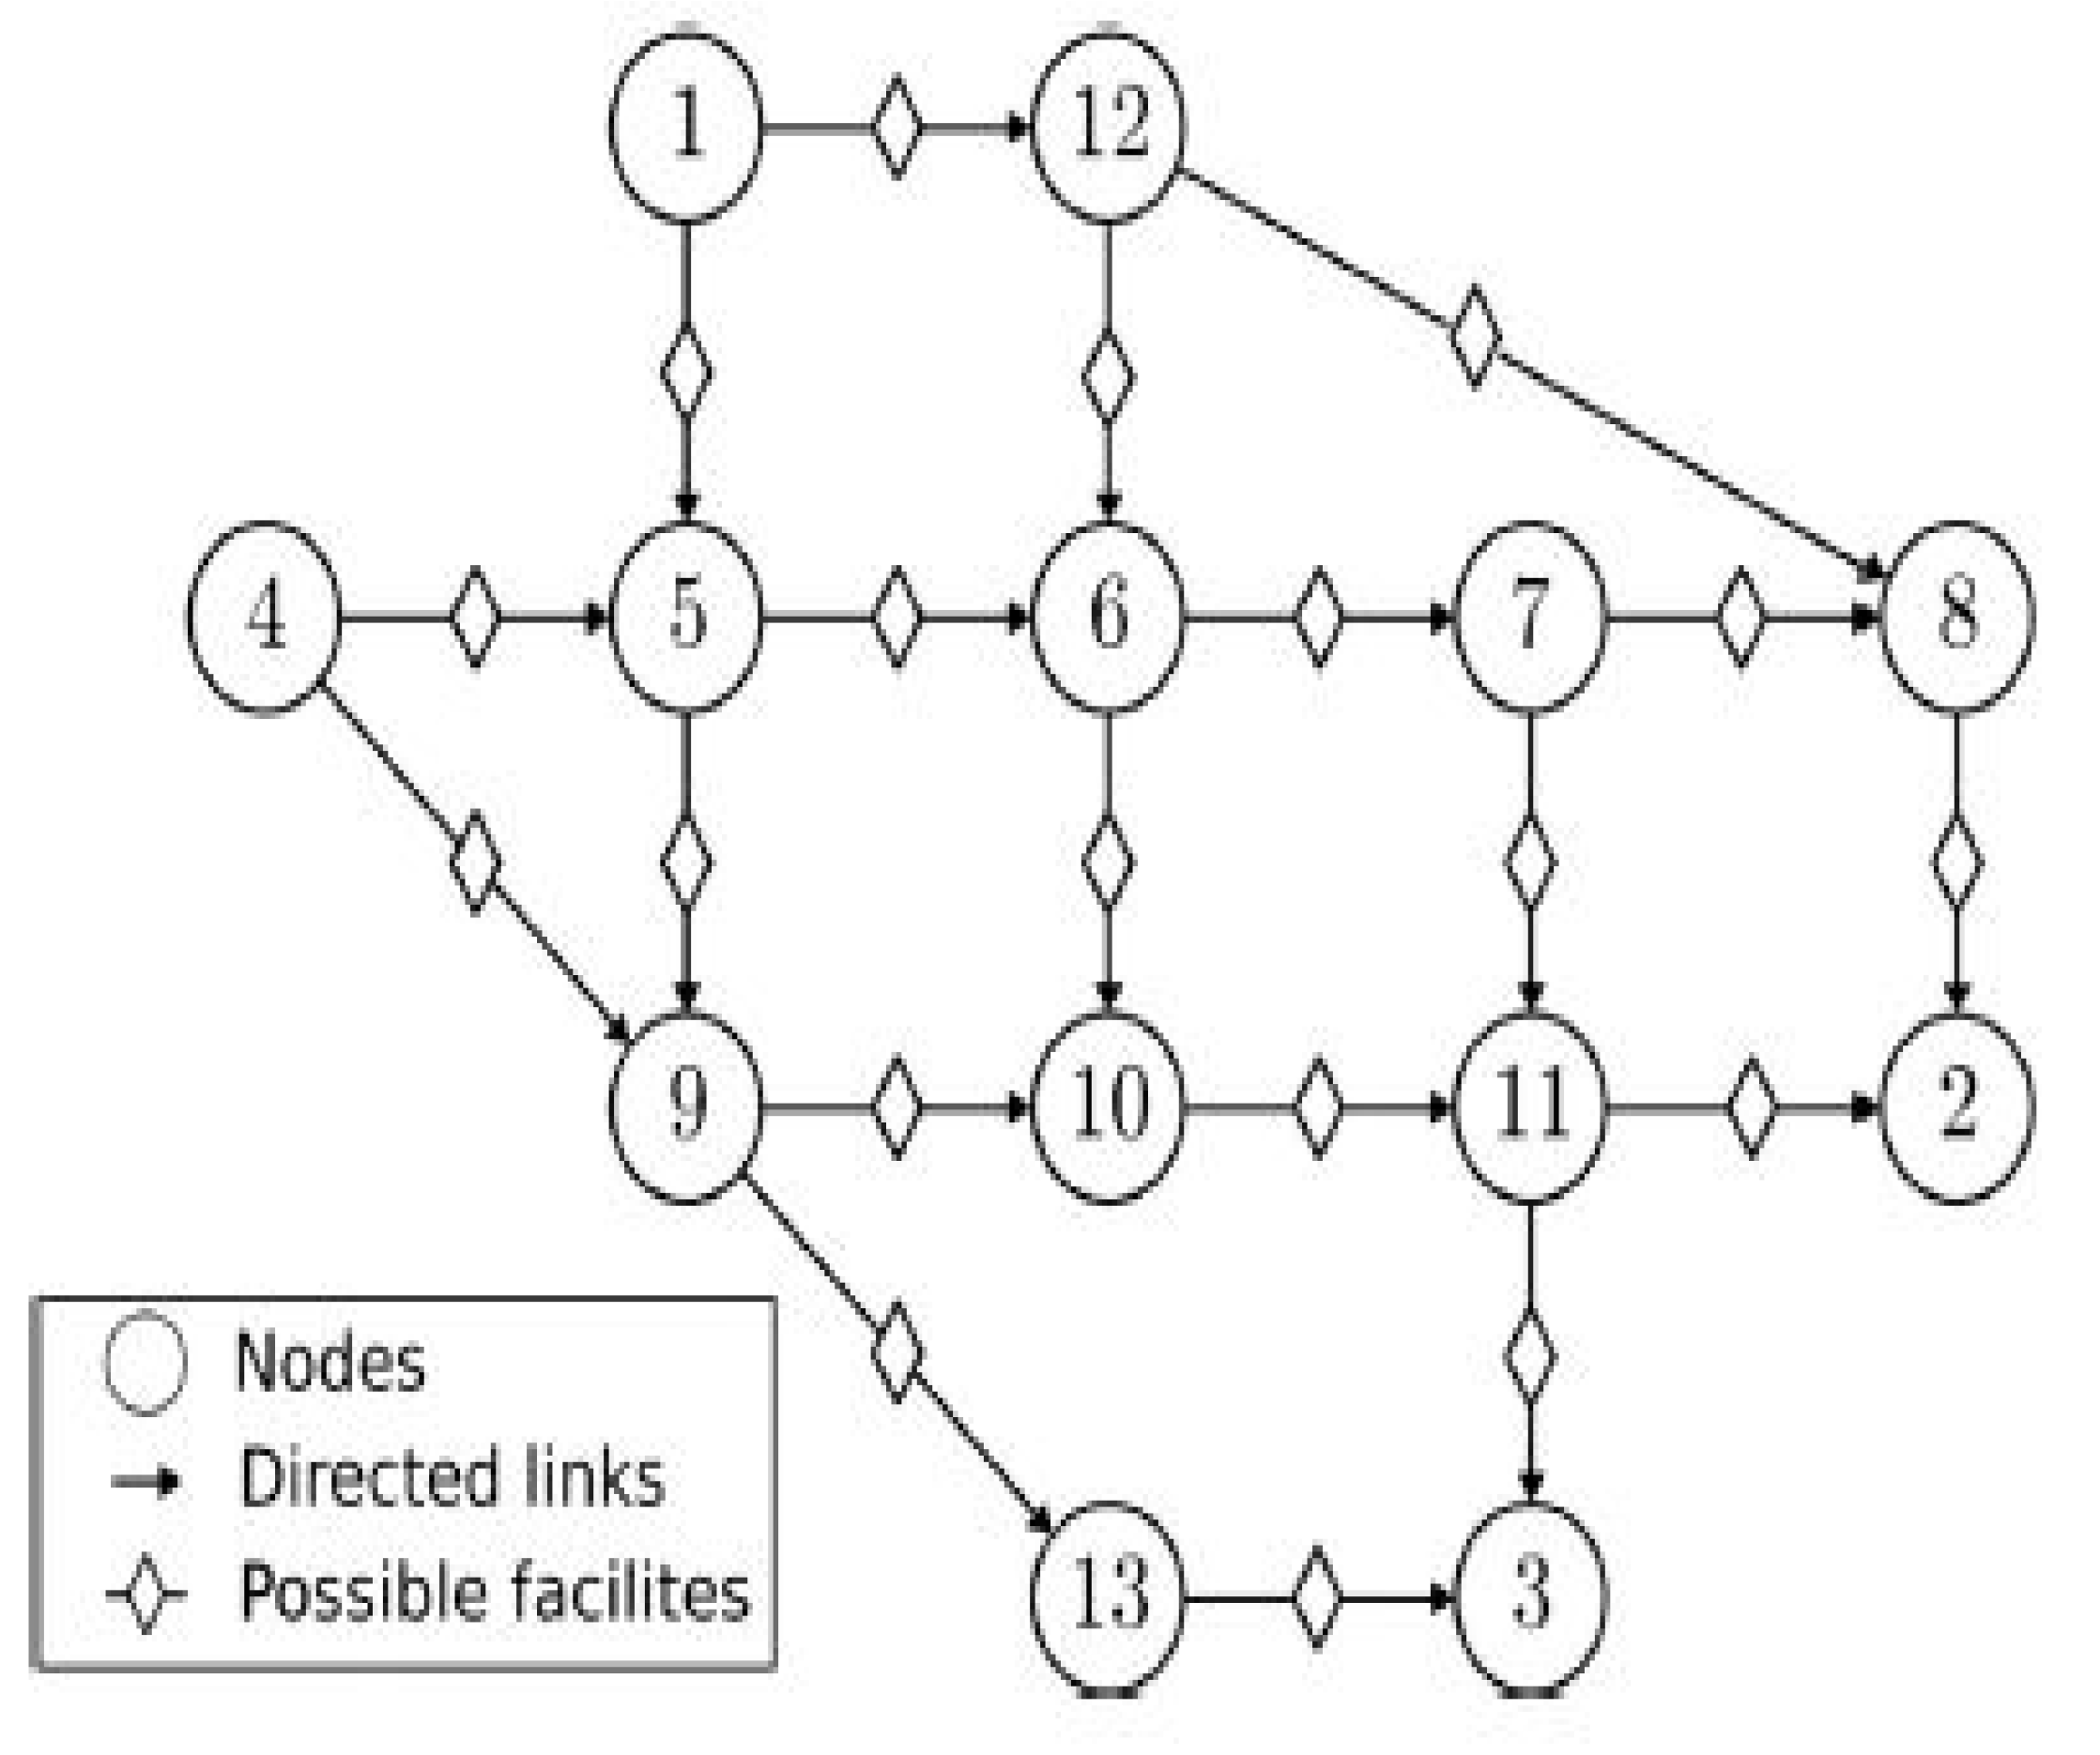
This study describes the scenarios of the MCS location problem and reformulates the problem based on the linearization technologies in the last three sections. In this section, we present a numerical experiment based on the Nguyen and Dupuis (1984) network to demonstrate the model’s validity, solution quality and make a comparison with previous research’s findings.
To demonstrate the model’s validity, we choose to use the Nguyen–Dupuis network traffic pattern, considering the EV’s range and MCSs available in the network within periods
T. We investigate the model based on a 19-links transportation network through the MCSs moving allocation between candidate nodes. Furthermore, we make a comparison with previous studies, such as Zhang and Yang modeling an inertia route choice traffic assignment model while failing to consider the dynamically facilities location optimization problem [
57]. Although Kim et al.’s research extended the FCLM model to a deviation-flow refueling location model, they did not consider SUE constraints and multi-period optimization problems [
58]. Koa et al. reviews the modeling and solution algorithms of the FCLM and FRLM [
59]. Chen et al. proposed a type of MCS that provides a new optimal method [
60]. Capar et al. improved the efficiency of FRLM [
61]. Zhang et al. extended the modeling of FRLM and assessed the fast charging facilities location optimization incorporated demand dynamics within multi- periods [
62]. For the experiments, we assumed an MCS can move along any link of the network due to the absence of a need to consider MCS parking space and cost in the problem.
The model’s program was coded using AMPL language and tries were run on a private laptop. After parameters optimization, we then applied for the program to run on Wisconsin’s AMPL public computing cloud (URL:
https://neos-server.org/neos/solvers/).
This study’s experiment used the Nguyen and Dupuis (1984) network as a benchmark (
Figure 3).
Table 3,
Table 4 and
Table 5 list the parameter settings, including free-flow time, link capacities, and OD demands. Free-flow travel time and link capacity are consistent with previous research by Xu et al. However, to demonstrate a real-world situation, this study assumes that OD demand increases year on year with an identity proportion of
, based on OD demand suggested by Nguyen and Dupuis (1984). Furthermore, the MNL parameters
(scaling parameter for travel time) and
(scaling parameter for mobile charging facility) are set as follows:
,
and EV range is varied for each experiment. For the experiment, we take
z shortest path with
and
, respectively, as the set of feasible paths between each OD pair (
Table 3).
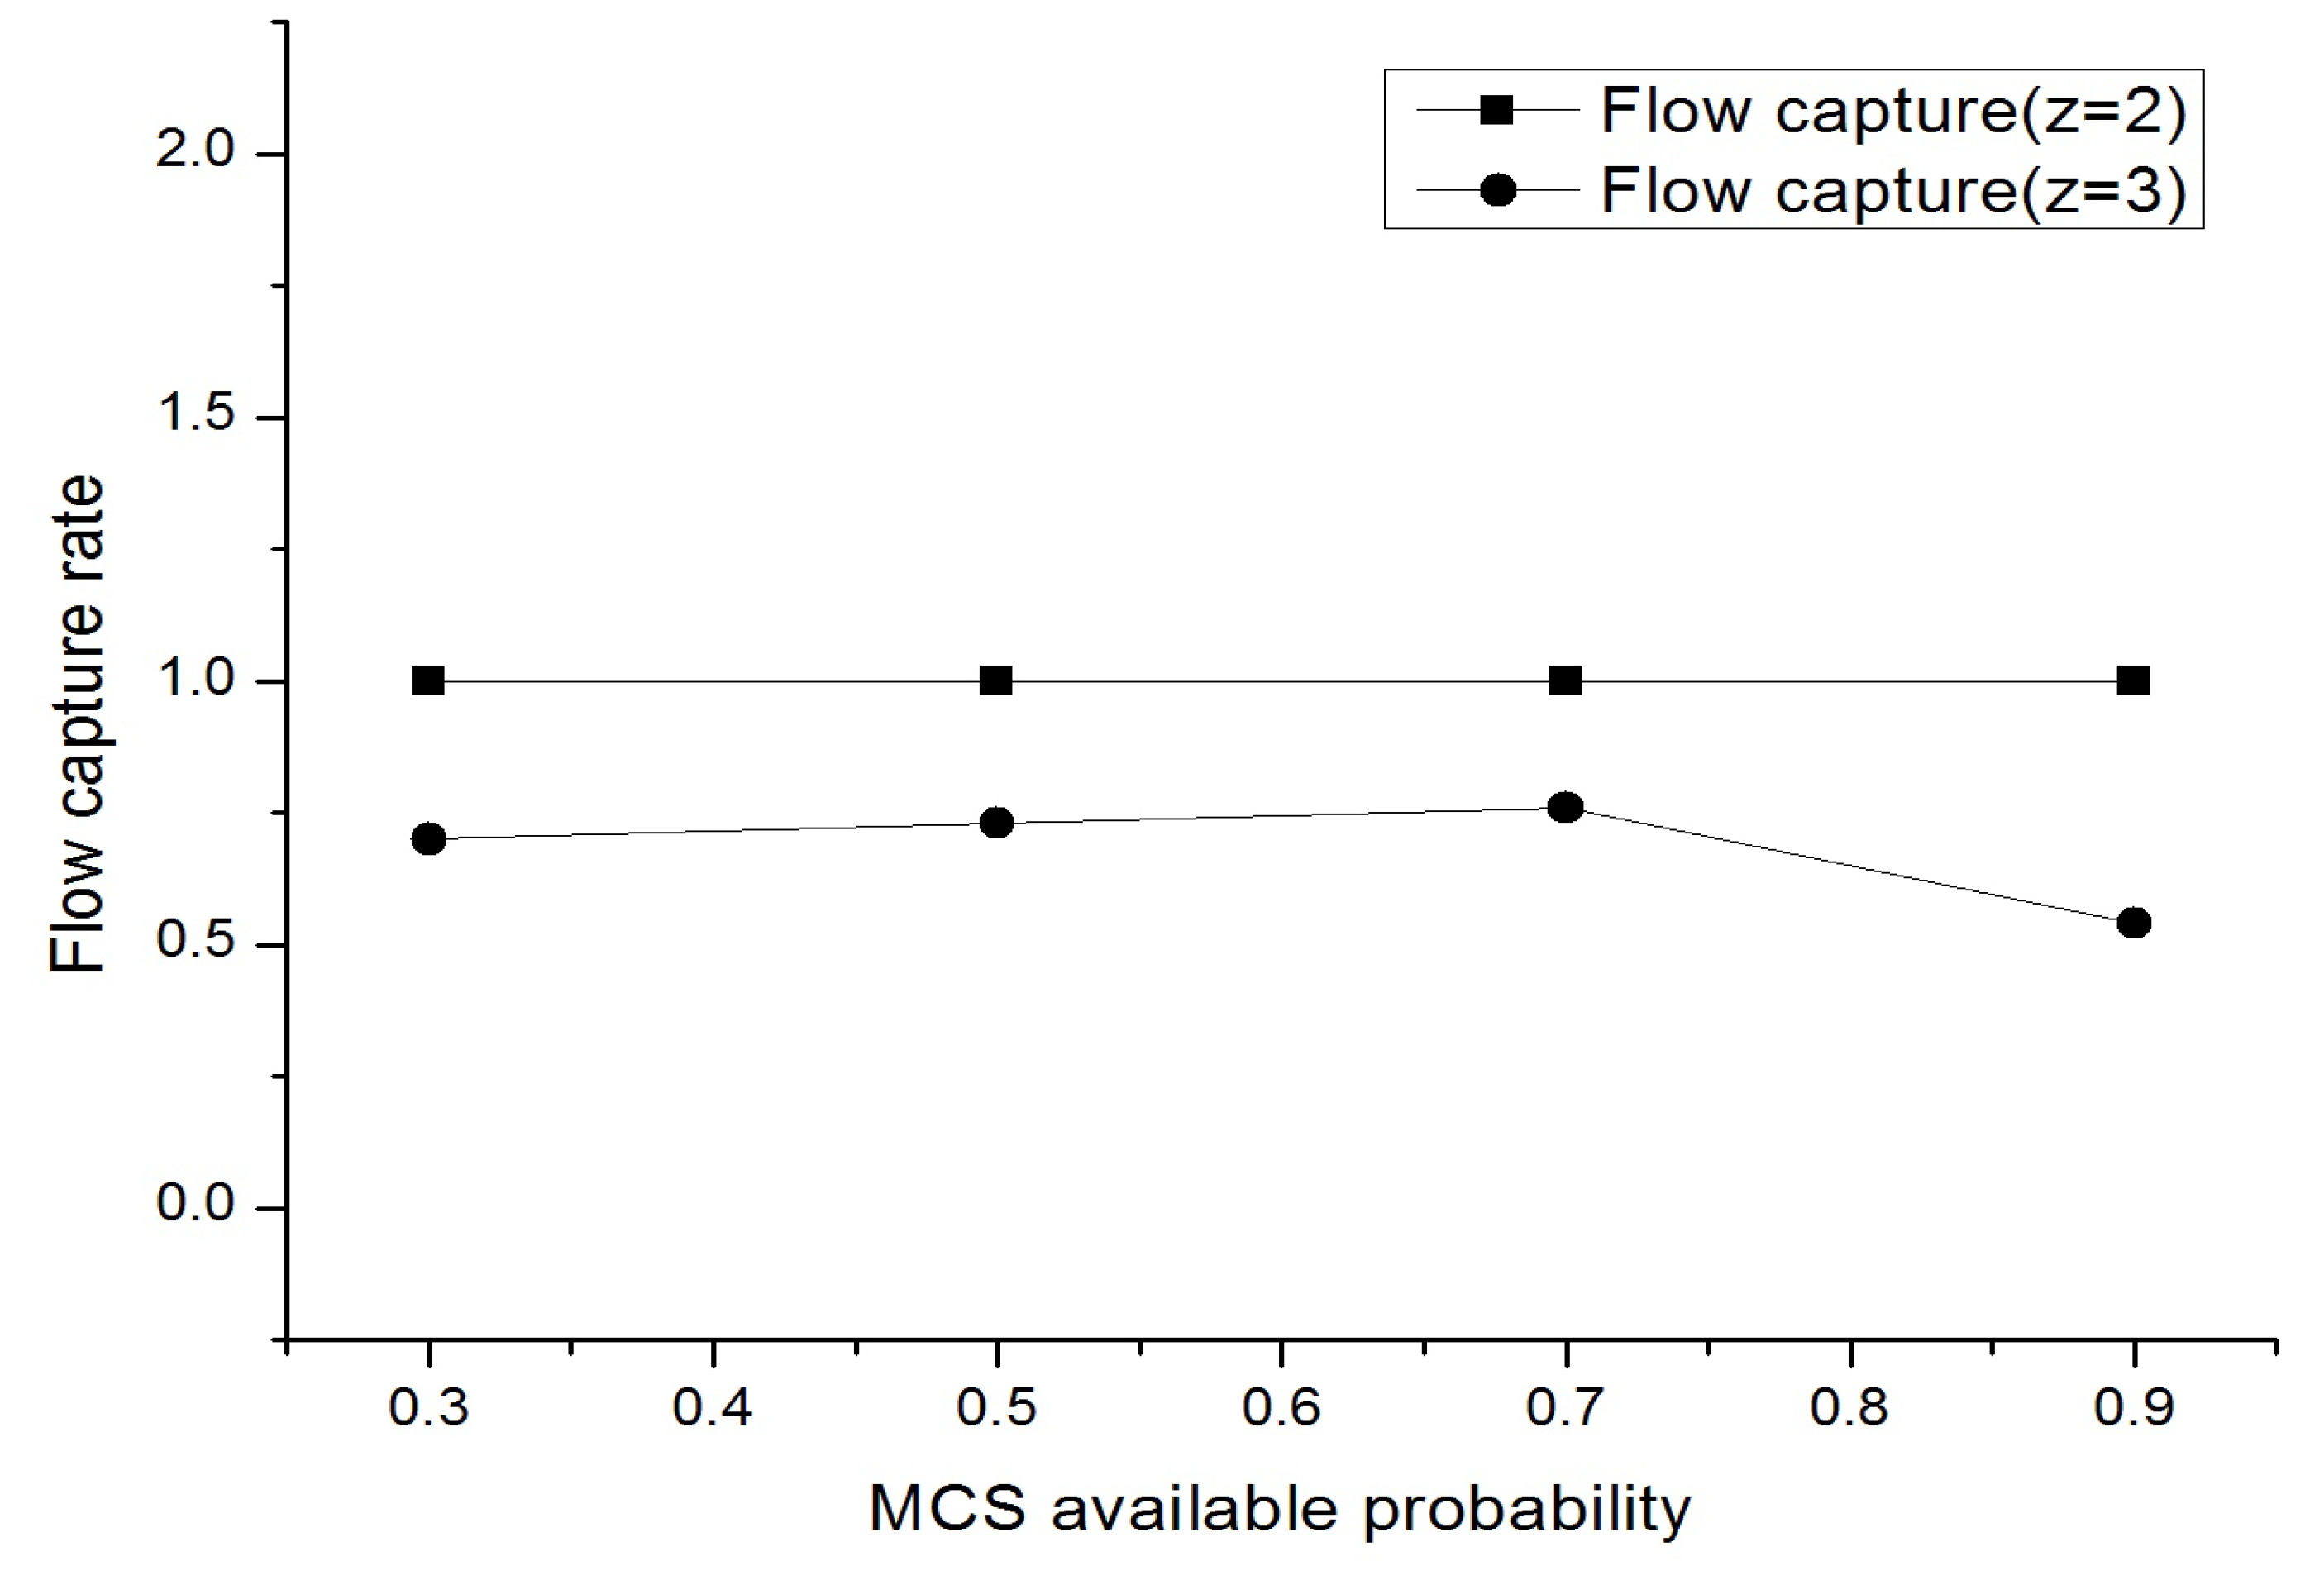
4.1. Variation of Sensitivity to Availability of Mobile Charging Stations
is the positive scaling parameter of the availability of MCSs, when deploying fixed numbers of MCSs in the network. A sensitivity analysis to verify the effect of
on the capture rate of electric vehicle traffic flow under different path selection is presented in
Figure 4.
Figure 4 depicts that
gradually increases from 0.3 to 0.9, the capture rate of the MCSs grows slightly and tends to be stable status at
= 0.7, at which achieves maximum capturing. Furthermore, we can also see that the flow capture rate begins to decrease when the value of
exceeds
. Furthermore, the OD pair’s path options also affect the EV traffic flow capturing of MCSs. If
, which indicates that there are two route options between the OD pair, the capturing rate makes a significant jump to
. However, the EV flow capture rate did not change with a variation of
. When
, the flow capturing rate drops to
compared with the situation of
.
Figure 4 also means that the flow capture rate slightly increases with the route choice probability varying from
to
, and the trend starts to descend immediately with
value greater than
.
The changes in also reveal that traffic congestion has a significant impact on the EV flow capturing of MCSs.
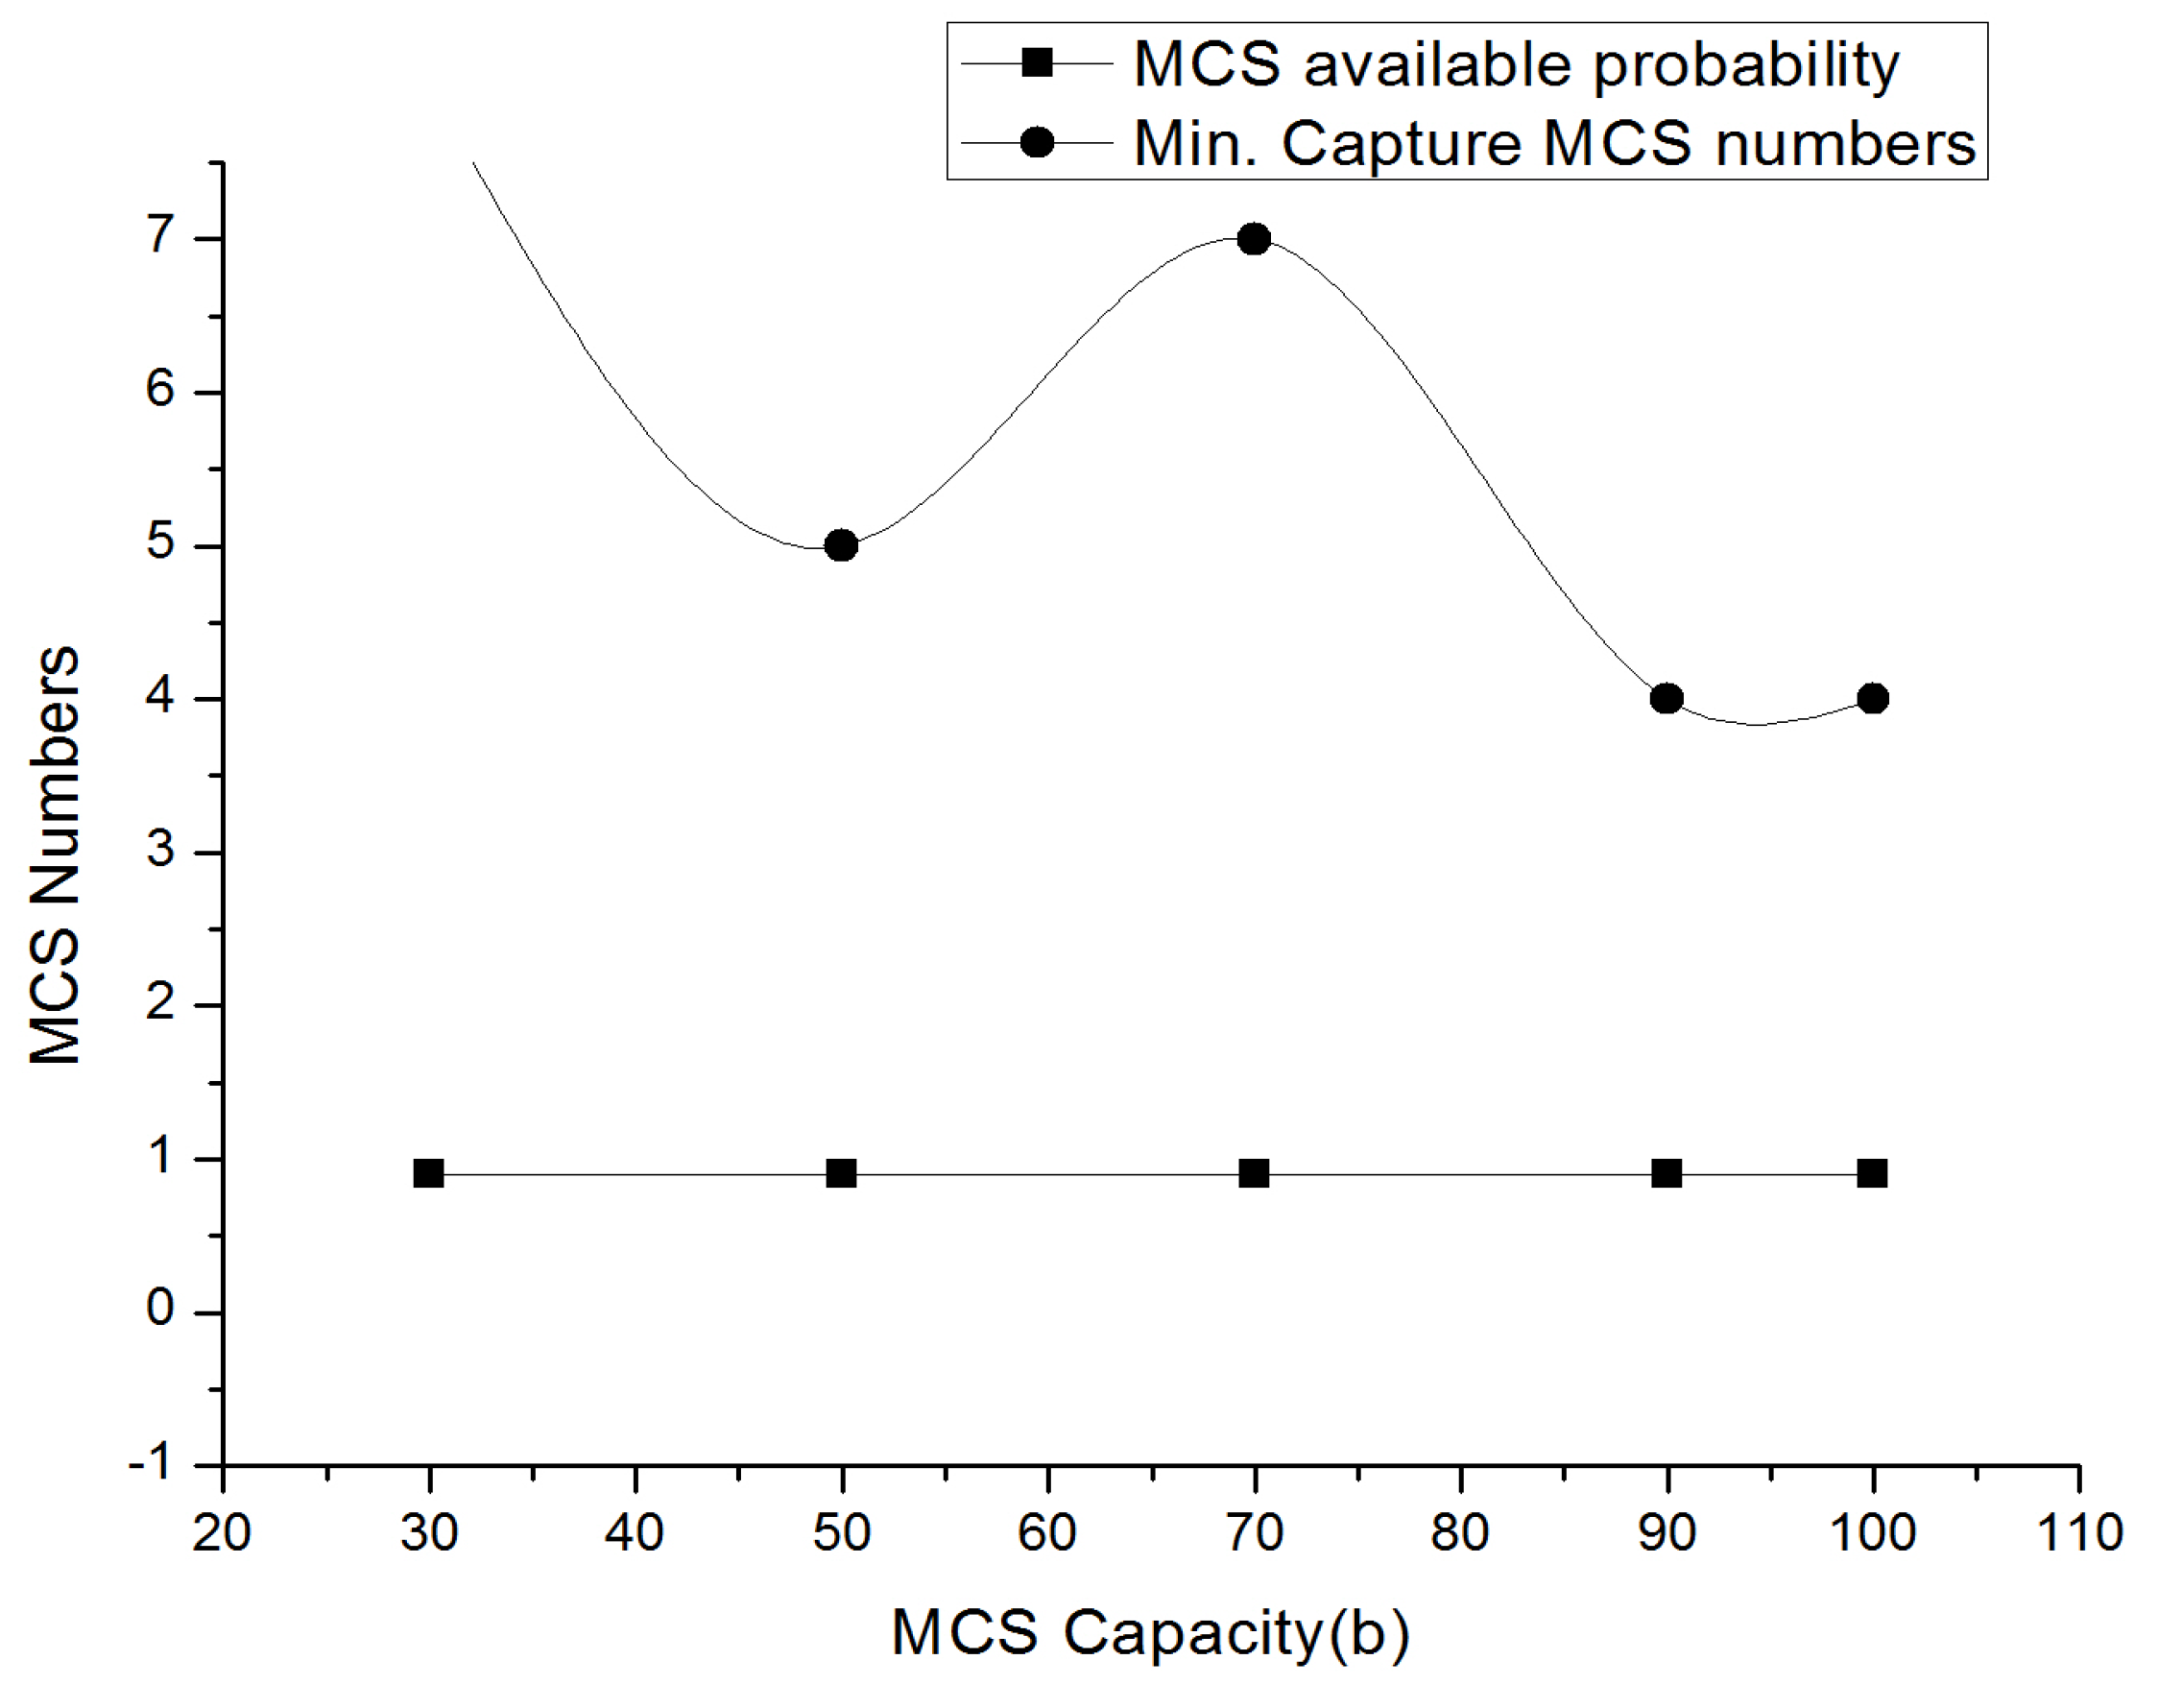
4.2. Variation of Sensitivity to the Capacity of a Mobile Charging Station
As regards the MCS’s capacity, the basic cognition is that the larger capacity, the higher recharging service capability. To demonstrate the assumption, an experiment was conducted to investigate how the objective function value varies in relation to the MCS service capability.
Figure 5 and
Figure 6 present the relationship between capacity and the deployment numbers of an MCS. They show that the MCS deployment numbers gradually decrease as the MCS capacity rises. However, the results also show that the deployment numbers rise again when the MCS capacity exceeds the threshold value.
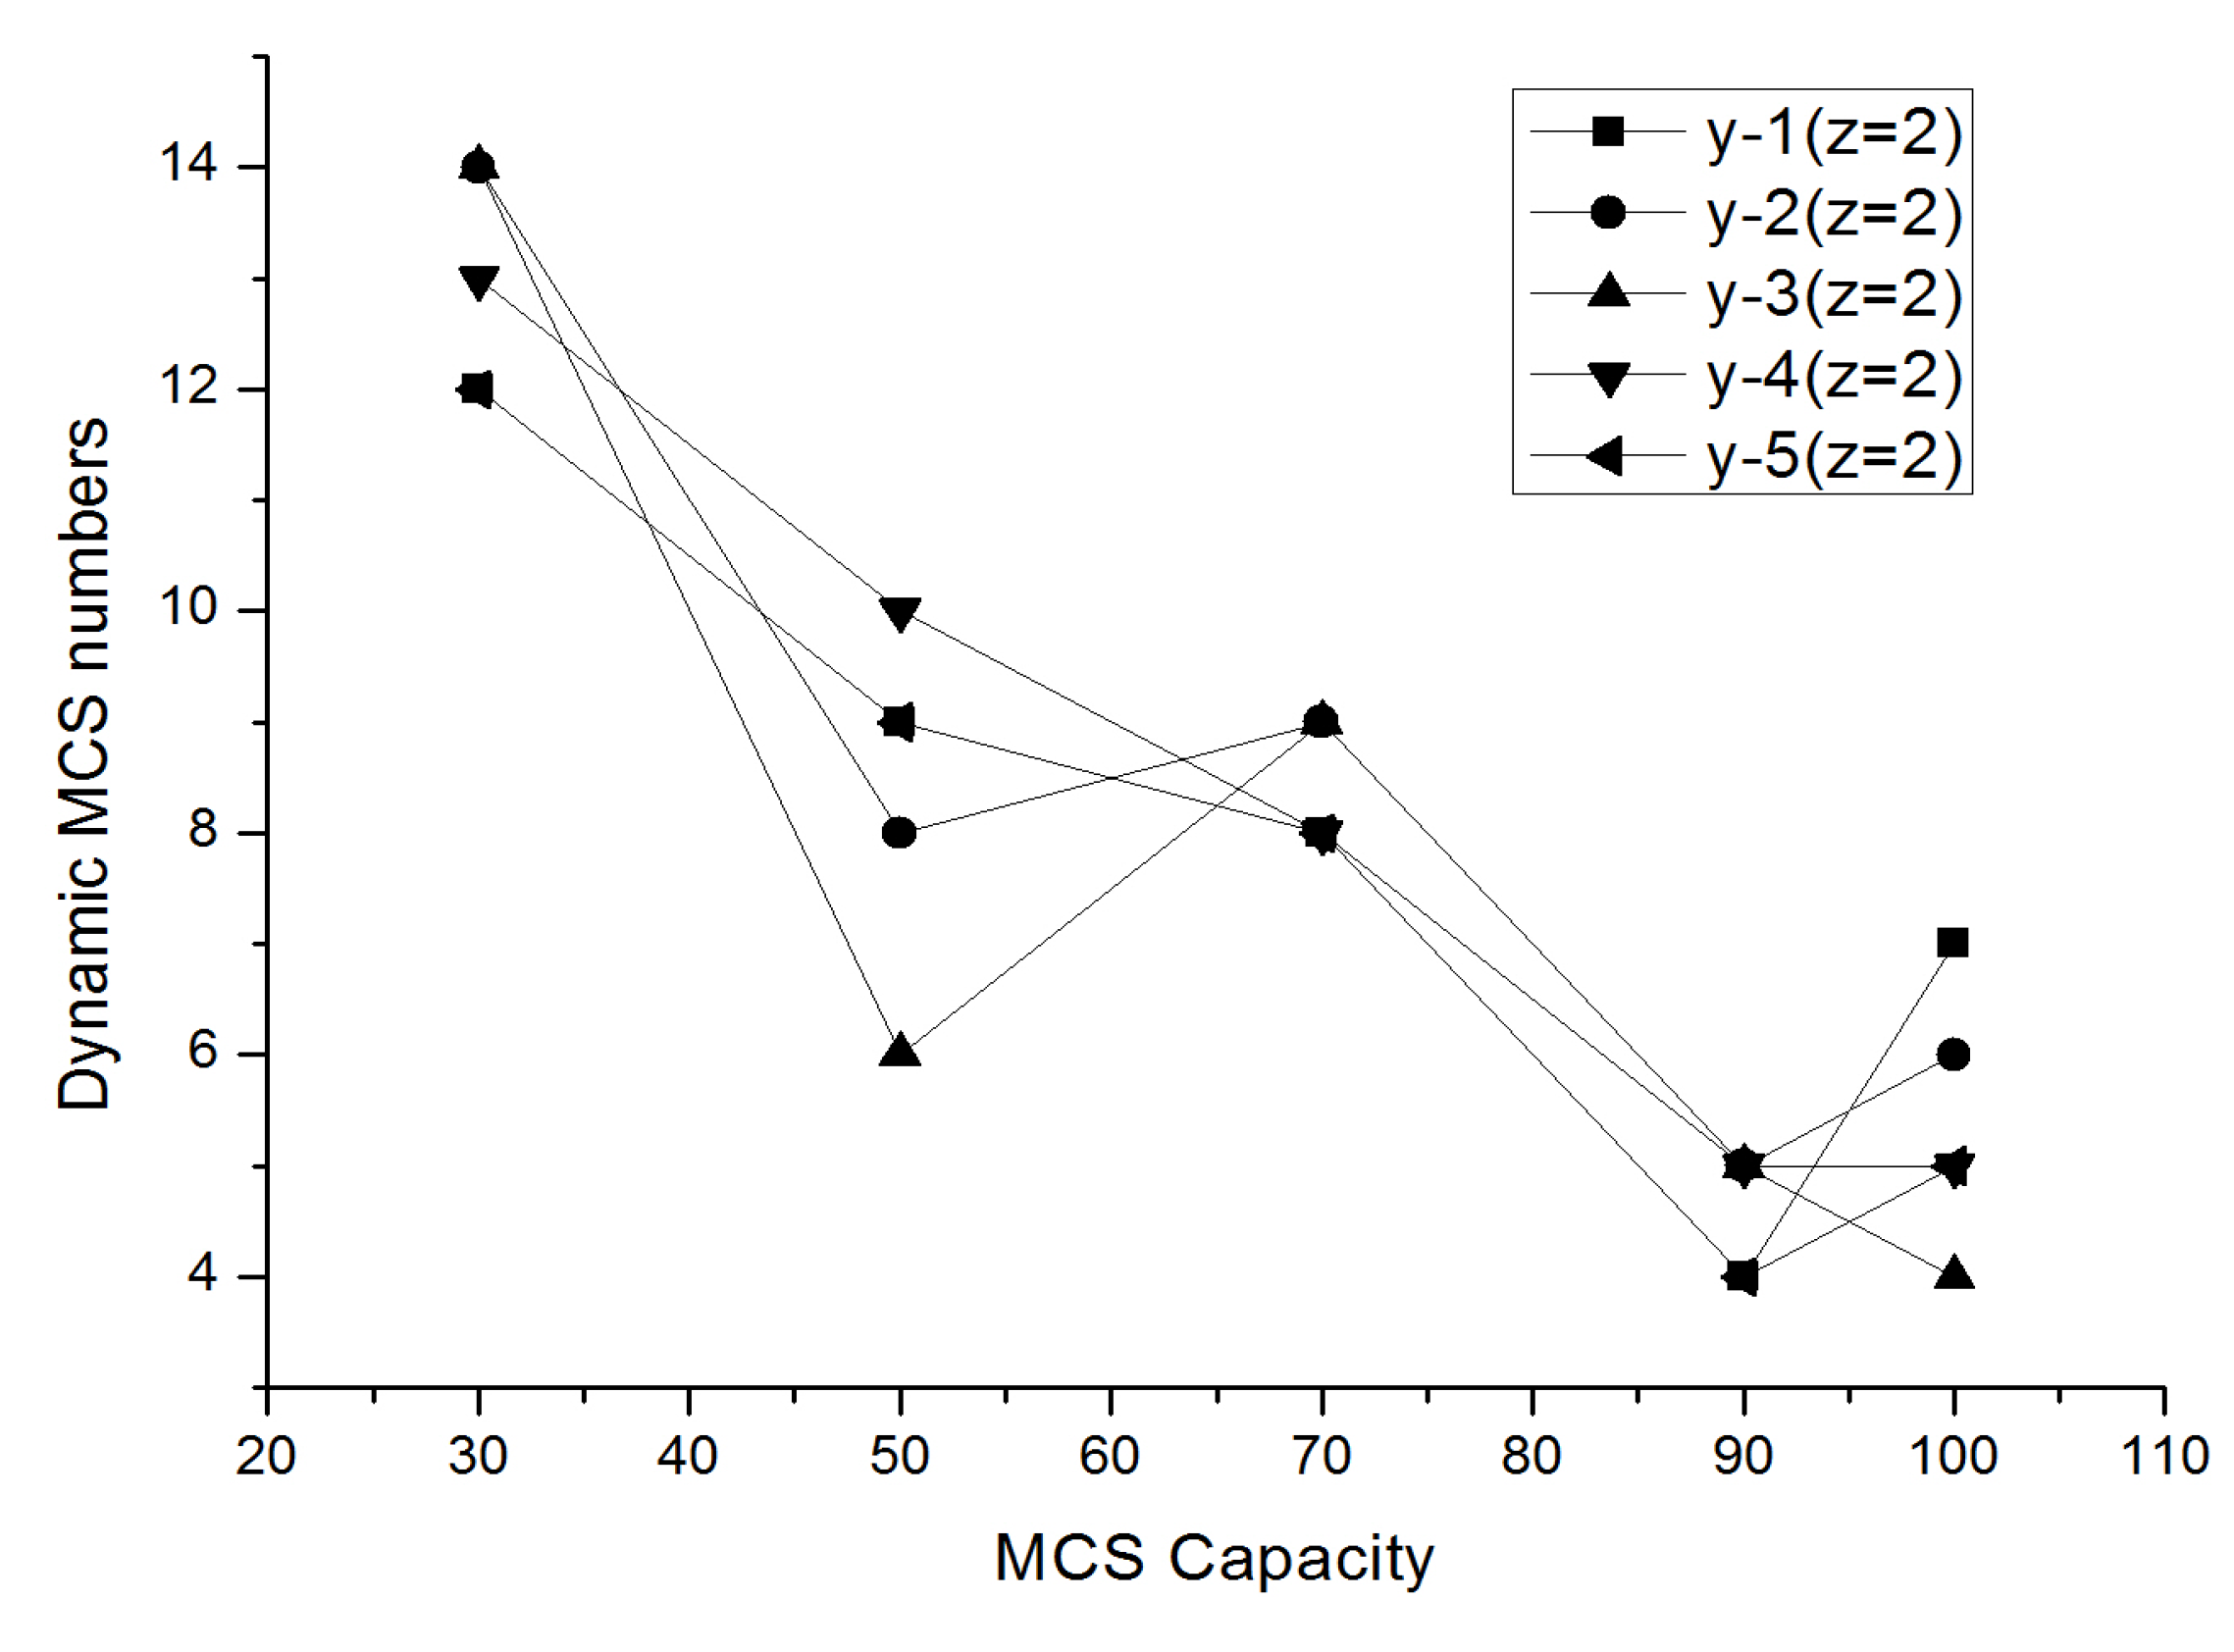
4.3. Variation of MCS Relocation Rate with MCS Capacity
Figure 7,
Figure 8 and
Figure 9 show that the larger the capacity of the MCS, the fewer the number of movements required to maximize coverage of the EV flow. However, when the capacity of the MCS exceeds the threshold value of 90, the MCS moving rate begins to rise from the bottom gradually. Furthermore, path options between OD pairs also affect the rate of MCS movement. The more available paths there are, the lower the moving rate for maximum EV flow capturing; the fewer the available paths, the higher the EV flow rate needed for capturing of MCSs. However, the MCS relocation numbers increase significantly if its capacity exceeds the threshold of 90.
This study also found that the MCS relocation rate did not increase significantly with variation in time period, even with the consideration that the traffic flow of the road network increases at a rate of 5% per year.
4.4. Variation of Link Equilibrium Traffic Flow with Operation Period
This study assumes that the traffic flow of the road network increases at a rate of 5% per year.
Figure 10 and
Figure 11 show that under consideration of traffic congestion and MCS availability situation, the equilibrium traffic flow of a single road segment will also rise slightly with change in time stage, and the equilibrium traffic flow between the road segments will be distinctly different. Compared with the results of Riemann et al.’s fixed-charge facility interception model, the equilibrium flow of road segments are significantly improved.
Furthermore,
Figure 10 and
Figure 11 present the equilibrium flow pattern for z = 2 and z = 3. For z = 2, the traffic distribution of each road segment is relatively balanced.
5. Conclusions
In this study, we construct a mixed-integer nonlinear mathematical model which describes the dynamic location and allocation optimization problem for coverage of EV flow in multi-periods. Compared to previous studies, the contributions of this study can be summarized as follows: (1). By modeling and solving based on a dynamic location planning of MCSs to capture the largest EV traffic flow, the proposed method is more space -saving than the traditional fixed charging station deployment; (2). The model considers the ability of the MCS to capture the maximum EV flow under the traffic assignment model of stochastic user equilibrium; (3). To describe the characteristics of EVs market penetration state more realistically, this study considers the MCS location optimization problem in multi-periods.
The key findings show that there is a threshold for the energy storage capacity of the MCS. The lower the MCS’s energy storage capacity, the higher moving rate for maximum capturing of EV flow. When the energy storage capacity exceeds the threshold, the system will converge to the state of the fixed charging station. This study also studies the relationship between the energy storage capacity of the MCS and the number of deployments. The results imply that there is also a capacity threshold. Within the threshold, the larger the capacity, the smaller the deployment requirement. Finally, the study uses a linearization algorithm to transform the original nonlinear integer programming model into a common linear integer programming model, and obtains a global optimal solution of the model using NEOS’s CPLEX server.
This model does not verify the scale of this type of charging facilities’ deployment. We assume that the recharging demand of the MCS is adequately covered, without mileage anxiety. However, the MCS still needs to return to a large public charging tower in the suburbs for recharging. How to combine the MCS recharging demand with large public charging towers to improve the system efficiency? How to make good use of the peak-to-valley effect of the electricity grid to promote energy conservation? There are questions that need to be studied in the future. Meanwhile, it is necessary to evaluate the breakeven point for investment in MCS and large-scale deployment in the urban cities to stimulate EV adoption.


