Article

Effect of Carbon Pricing on Optimal Mix Design of Sustainable High-Strength Concrete

Department of architectural engineering, Kangwon National University, Chuncheon-Si 24341, Korea
Sustainability 2019, 11(20), 5827; https://doi.org/10.3390/su11205827
Submission received: 24 September 2019 / Revised: 16 October 2019 / Accepted: 18 October 2019 / Published: 21 October 2019
(This article belongs to the Special Issue Sustainable Building Materials Research)

Abstract

:
Material cost and CO2 emissions are among the vital issues related to the sustainability of high-strength concrete. This research proposes a calculation procedure for the mix design of silica fume-blended high-strength concrete with an optimal total cost considering various carbon pricings. First, the material cost and CO2 emission cost are determined using concrete mixture and unit prices. Gene expression programming (GEP) is used to evaluate concrete mechanical and workability properties. Second, a genetic algorithm (GA) is used to search the optimal mixture, considering various constraints, such as design compressive strength constraint, design workability constraint, range constraints, ratio constraints, and concrete volume constraint. The optimization objective of the GA is the sum of the material cost and the cost of CO2 emissions. Third, illustrative examples are shown for designing various kinds of concrete. Five strength levels (from 95 to 115 MPa with steps of 5 MPa) and four carbon pricings (normal carbon pricing, zero carbon pricing, five-fold carbon pricings, and ten-fold carbon pricings) are considered. A total of 20 optimal mixtures are calculated. The optimal mixtures were found the same for the cases of normal CO2 pricing and zero CO2 pricing. Optimal mixtures with higher strengths are more sensitive to variation in carbon pricing. For five-fold CO2 pricing, the cement content of mixtures with higher strengths (105, 110, and 115 MPa) are lower than those of normal CO2 pricing. As the CO2 pricing increases from five-fold to ten-fold, for mixtures with a strength of 110 MPa, the cement content becomes lower. Summarily, the proposed method can be applied to the material design of sustainable high-strength concrete with low material cost and CO2 emissions.

1. Introduction

To achieve the aim of sustainable development of the modern concrete industry, construction companies and concrete factories are making every effort to lower the material cost and CO2 emissions from concrete production. Moreover, high-strength concrete is increasingly used to produce structural elements. High-strength concrete shows various advantages, such as reducing the size of the structural element, increasing the used space of a building, and extending the service life. Both construction companies and investors are interested in making high-strength concrete with lower material cost and CO2 emissions [1,2].
Lots of studies have been done on the assessment of the cost and CO2 emissions of concrete. Fattah et al. [3] suggested that replacing 50% of cement with slag and using the reject brine can reduce CO2 emissions by 176 kg and save 170–340 USD for 1 m3 of concrete. Rashid et al. [4] found that replacing 30% conventional aggregate with ceramic waste aggregate can provide higher strength and have less environmental impact. Sharma and Khan [5] reported that for producing self-consolidating concrete, replacing sand with copper slag can reduce cost, save embodied energy, and reduce CO2 emissions. Hassan and Kianmehr [6] showed that for producing pavement concrete, incorporating previous concrete combined with slag can lower cost, reduce the heat island effect and embodied energy, and offer a decrease in CO2 emissions. Based on a cost–benefit analysis of recycled aggregate, Senaratne et al. [7] found that combining recycle aggregate with steel fiber can obtain net savings. Anastasiou et al. [8] reported that for producing heavy weight concrete, using electric arc furnace slag aggregate can reduce the environmental load by 44%. Based on comparisons of CO2 emissions and compressive strength, Lin et al. [9] found that an environmental benefit can be achieved when quartz is used in concrete with low water-to-binder (w/b) ratios.
On the other hand, life cycle assessment (LCA) studies have been done about the sustainability of concrete. Carolina et al. [10] made LCA for concrete columns and glulam columns and found the production of the material was a critical stage of environmental impact. Tae et al. [11] found compared with ordinary-strength concrete, high-strength concrete could lower life cycle energy and life cycle CO2 emission of reinforced concrete structures. Teixeira et al. [12] found biomass and coal fly ash provided a benefit for concrete production in terms of environmental impact minimizations. Yang et al. [13] found compared with ordinary Portland cement concrete, alkali activation concrete can reduce the CO2 emissions by 55% to 75%. Heath et al. [14] found clay-based polymers can reduce the global warming potential by approximately 40%.
Although studies on the assessment of the cost and CO2 emissions of concrete are abundant [3,4,5,6,7,8,9,10,11,12,13,14], research on the mix design of sustainable concrete is relatively limited. Yeh [15] predicted the strength of concrete with neural networks and selected a lowest cost design using a commercial spreadsheet. Parichatprecha and Nimityongskul [16] evaluated the strength, workability, and chloride resistance of high-performance concrete using artificial neural networks, and designed low cost concrete considering various performance requirements using a genetic algorithm (GA). Kao et al. [17] analyzed the strength and slump of blended concrete using neural networks, and categorized the design dataset considering strength, mineral admixture content, and material cost. Yadollahi et al. [18] estimated the strength and slump of radiation shielding concrete using neural works and found the optimal mixtures based on parameter analysis of neural networks. Chiew et al. [19] predicted the properties of concrete using fuzzy adaptive resonance theory neural network and found the optimal mixtures based on similarity measurement. However, we should note that the methods in references [15,16,17,18,19] have some weak points. Previous studies mainly focused on the material cost of mixtures and ignored the carbon pricing [15,16,17,18,19]. Moreover, the effect of increasing the carbon pricing on mix design is not highlighted [15,16,17,18,19]. On the other hand, neural networks are a local search optimization method and are likely to fall into local extremum [15,16,17,18,19]. The physical meaning of weight matrix and bias vector in neural networks is not clear.
This research proposes a calculation procedure for the mix design of silica fume-blended high-strength concrete with an optimal cost considering various carbon pricings. Gene expression programming (GEP) is combined with a GA to find the optimal mixtures. The calculation procedure considers a variety of constraints, such as design compressive strength constraint, design workability constraint, range constraints, ratio constraints, and concrete volume constraint. Illustrative examples are shown for designing concrete with different strength levels and various carbon pricings. The proposed calculation procedure can be used as a simple and general tool for the material design of sustainable concrete.

2. Optimization Design of Concrete Mixture Ratios

To optimize the mix ratio of silica fume-containing high-strength concrete, it is necessary to establish the objective function and constraints. This study sets the objective function as the sum of CO2 emissions cost and material cost. The constraints consist of design compressive strength constraint, design workability constraint, range constraints, ratio constraints, and concrete volume constraint [20,21,22].
The reason for selecting the price of CO2 as an environmental indicator is not established with sufficient force. From the environmental perspective of a study that tries to sensitize the sustainable use of materials in construction, it is difficult to understand or accept that everything (materials, production, and CO2 emissions) has to be analyzed based on a comparative unit such as the dollar, the euro, or any currency. It is not suitable to use the price as a single indicator to measure sustainability. Money does not solve all the problems in sustainable development.
The aim of this study is to make the material design of sustainable high-strength concrete with low material cost and CO2 emissions. Because the unit of CO2 emissions is different from that of material cost, carbon pricing is used to transform the unit of CO2 emissions into the unit of material cost.

2.1. Object Function—Total Cost

Total cost equals the sum of material cost and CO2 emission cost. The optimized objective function (total cost) is
COS T = C O S T M + C O S T C O 2
where COST indicates the cost of concrete, C O S T M indicates the material cost of concrete, and C O S T C O 2 indicates the carbon dioxide emissions cost. For silica fume-blended concrete, based on the mass ingredient of concrete and unit price, the material cost of concrete can be calculated as follows:
COS T M = i = 1 6 m i Pr i
where m i is the mass of concrete components, such as cement, silica fume, sand, coarse aggregate, water, and superplasticizer; Pr i is the unit price of concrete components. The unit prices of the concrete component are shown in Table 1.
Similarly, based on the mass ingredient of concrete and unit CO2 emissions, the cost of CO2 emissions can be calculated as follows:
COS T C O 2 = Pr C O 2 i = 1 6 m i C O 2 i ,
where Pr C O 2 is the unit price of CO2 and C O 2 i is the CO2 emission of concrete components, such as cement, silica fume, sand, coarse aggregate, water, and superplasticizer [22]. Table 1 shows the unit CO2 emissions of the concrete component. The value of the unit price of CO2 is set as 0.482 NT dollar/kg [20].

2.2. Constraints

The object function is set as the total cost. The object function has several constraints, as mentioned above [20].
Design compressive strength constraint means that the real strength of concrete should be higher or equal to the required strength at characteristic ages. In engineering practice, 28 days is frequently used as a characteristic age.
Design workability constraint means that the workability of fresh concrete should meet the requirement of construction. Slump is a frequent index of workability. The real slump of fresh concrete should be higher or equal to the required slump. However, sometimes the exact opposite is needed. The higher slump may increase the bleeding of concrete, lower the quality of concrete, and reduce the service life of the concrete structures.
Range constraints means that the content of concrete components, such as cement, silica fume, binder, water, sand, coarse aggregate, and superplasticizer, should fall into the range of lower limit and upper limit. Range constraints are shown in Table 2 [21,23,24,25].
Ratio constraints mean that the component ratio, such as water-to-binder ratio, water-to-cement ratio, sand ratio, silica-fume-to-binder ratio, and superplasticizer-to-binder ratio, should fall into the lower limit and upper limit of ratio constraints. The ratio constraints are presented in Table 3 [21,23,24,25].
Concrete volume constraint means that the sum of the volume of concrete ingredients and air should be equal to one cubic meter. The equation of concrete volume constraint is shown as follows:
i = 1 6 m i ρ i + V a i r = 1
where ρ i is density of concrete ingredient, and V a i r is the volume of air in concrete. The densities of cement, silica fume, sand, coarse aggregate, water, and superplasticizer are 3150 kg/m3, 2260 kg/m3, 2610 kg/m3, 2700 kg/m3, 1000 kg/m3, and 1220 kg/m3, respectively [21,23,24,25].

2.3. Evaluation Strength and Slump of Concrete Using GEP

Experimental studies on the strength and slump of silica fume-blended high-strength concrete were conducted by Lim et al. [21]. As many as 77 mixture ratios with assorted w/b ratios, water contents, sand ratios, silica fume substitute ratios, and superplasticizer contents were studied. The compressive strength of high-strength concrete at 4 weeks ranged between 90 MPa and 120 MPa. The slump of concrete ranged between 180 mm and 235 mm. The lower and upper limits from the concrete component are presented in Table 2. The lower and upper limits of the number of the concrete component are presented in Table 3.
In this research, mathematical modeling of strength and slump was performed using GEP. GEP can overcome the weak points of neural network regression, such as local extremum and overfitting. Based on the combination of the GA and genetic programming (GP) ideas, Ferreira [26] proposed GEP, which is the inheritance and development of the GA and GP. As with the GA, GEP used linear chromosomes of a fixed length; as with GP, GEP used expressive parse trees of various sizes and shapes. The efficiency of GEP is much higher than that of GP. GEP creates computer programs which consist of multiple parse trees. These parse trees are called expression trees. The fundamental steps of the basic gene expression algorithm are setting of function and terminus, and evaluation of fitness, control parameters, and termination condition [26].

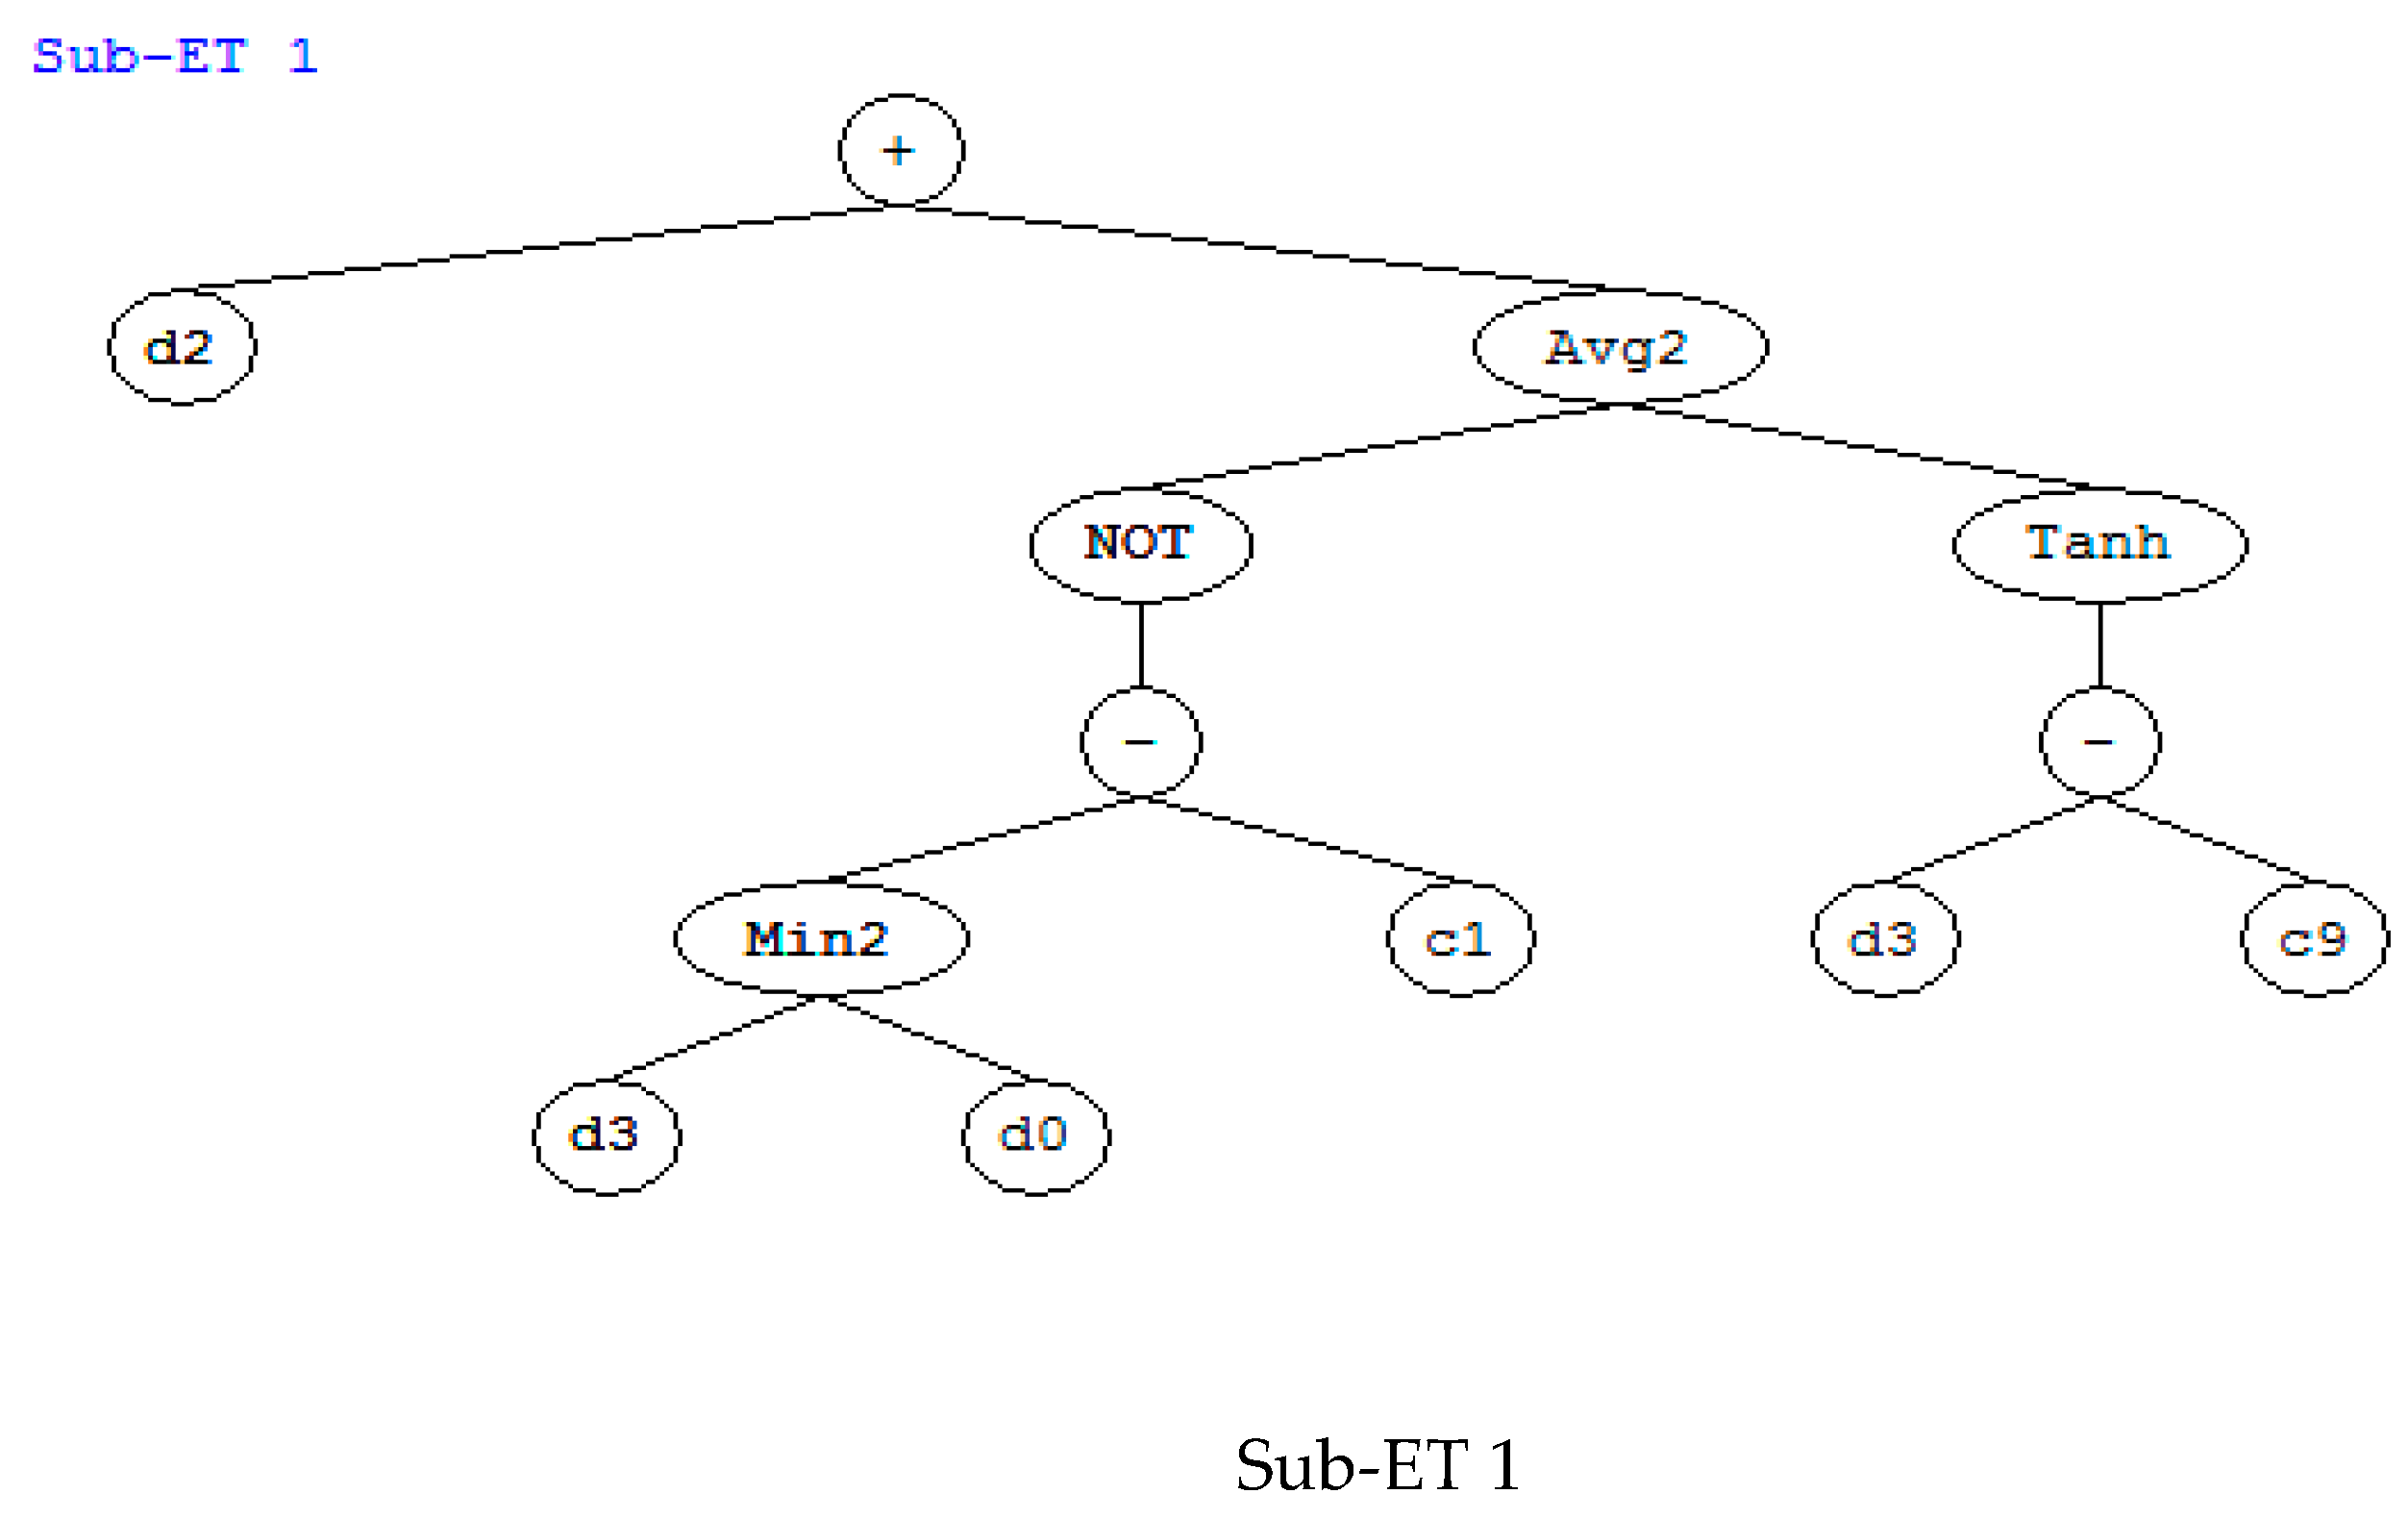
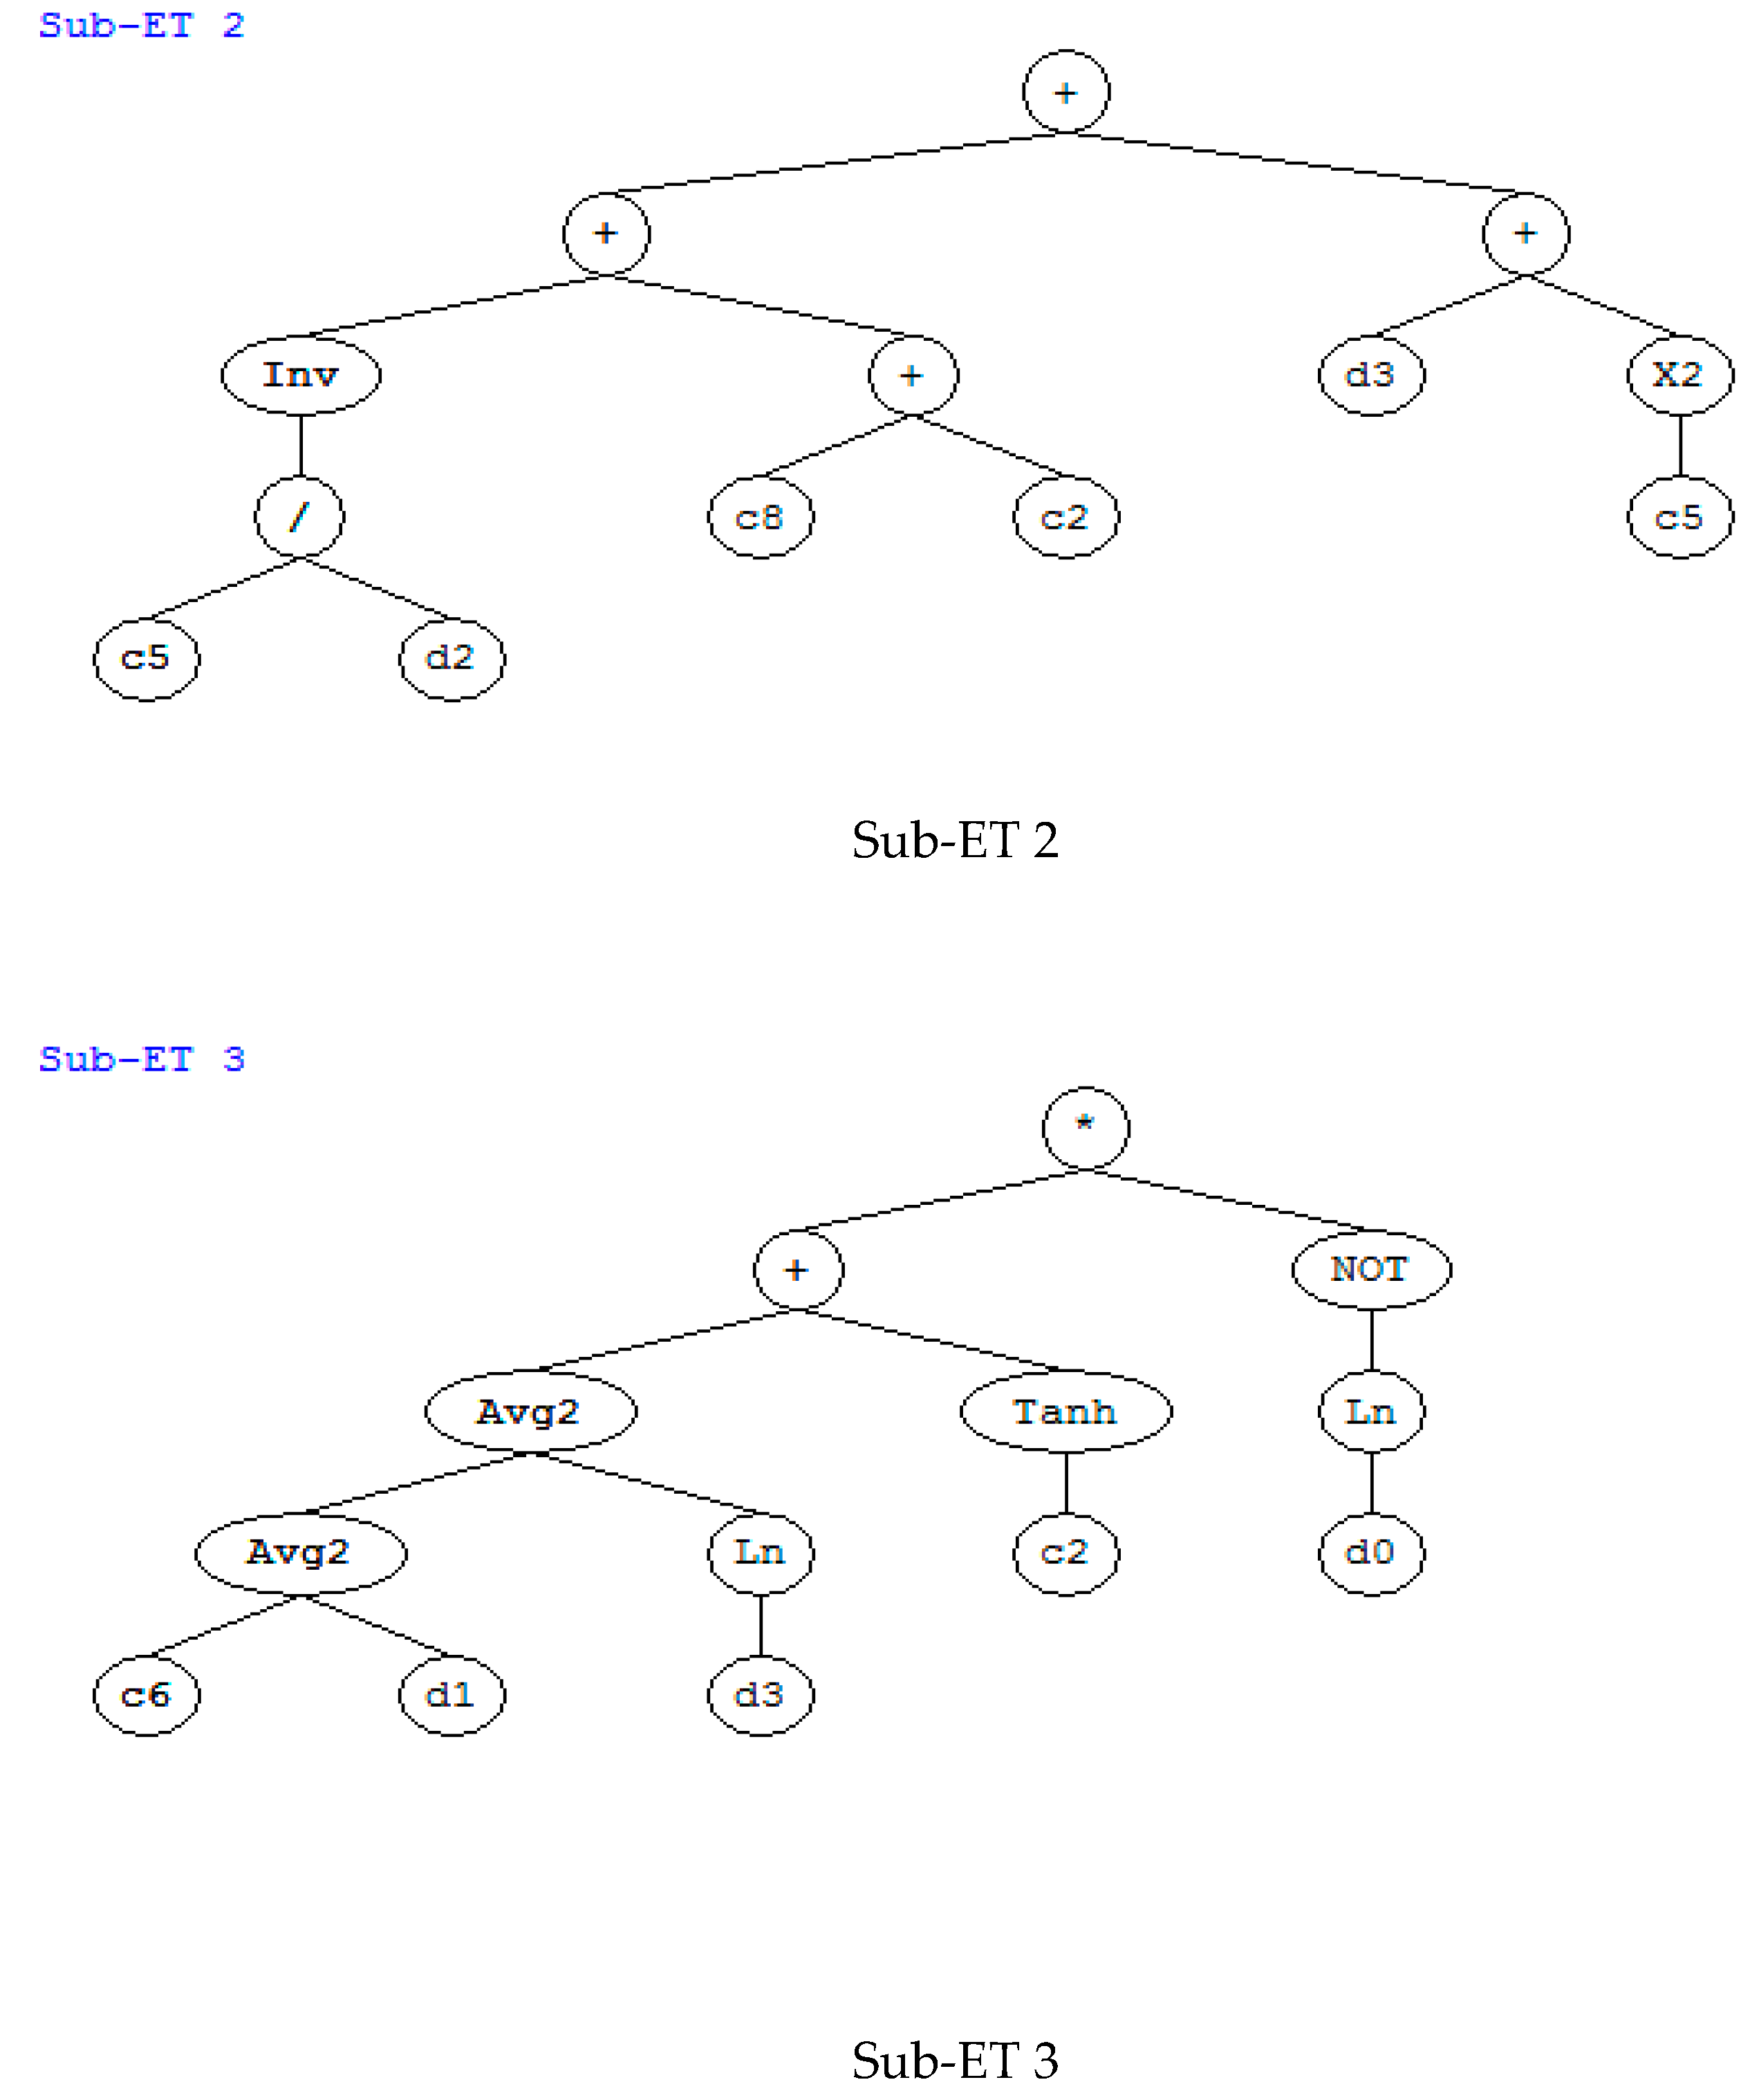
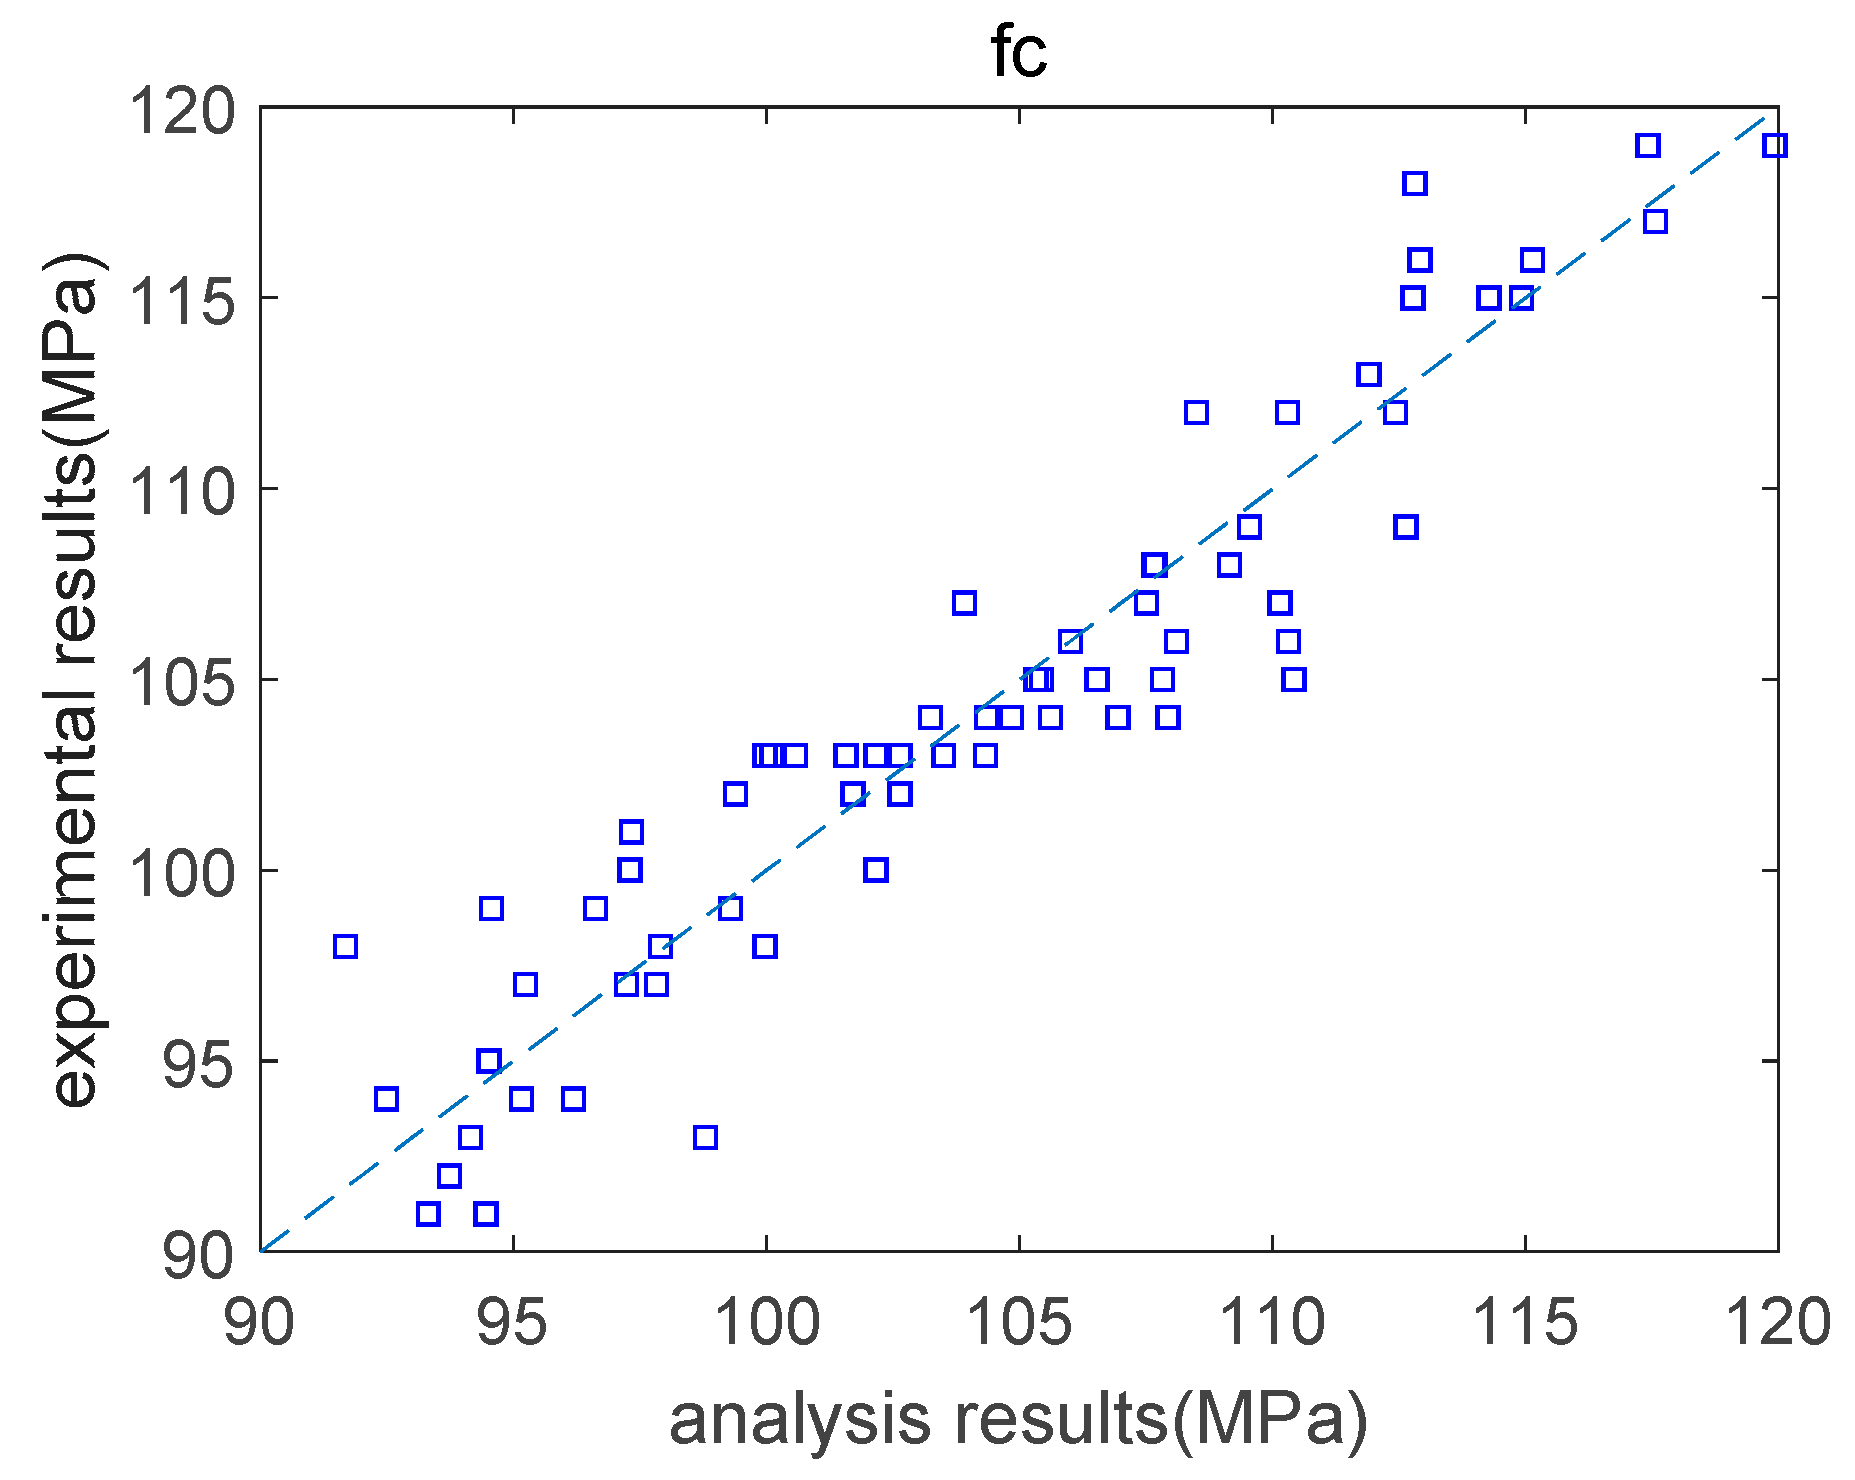
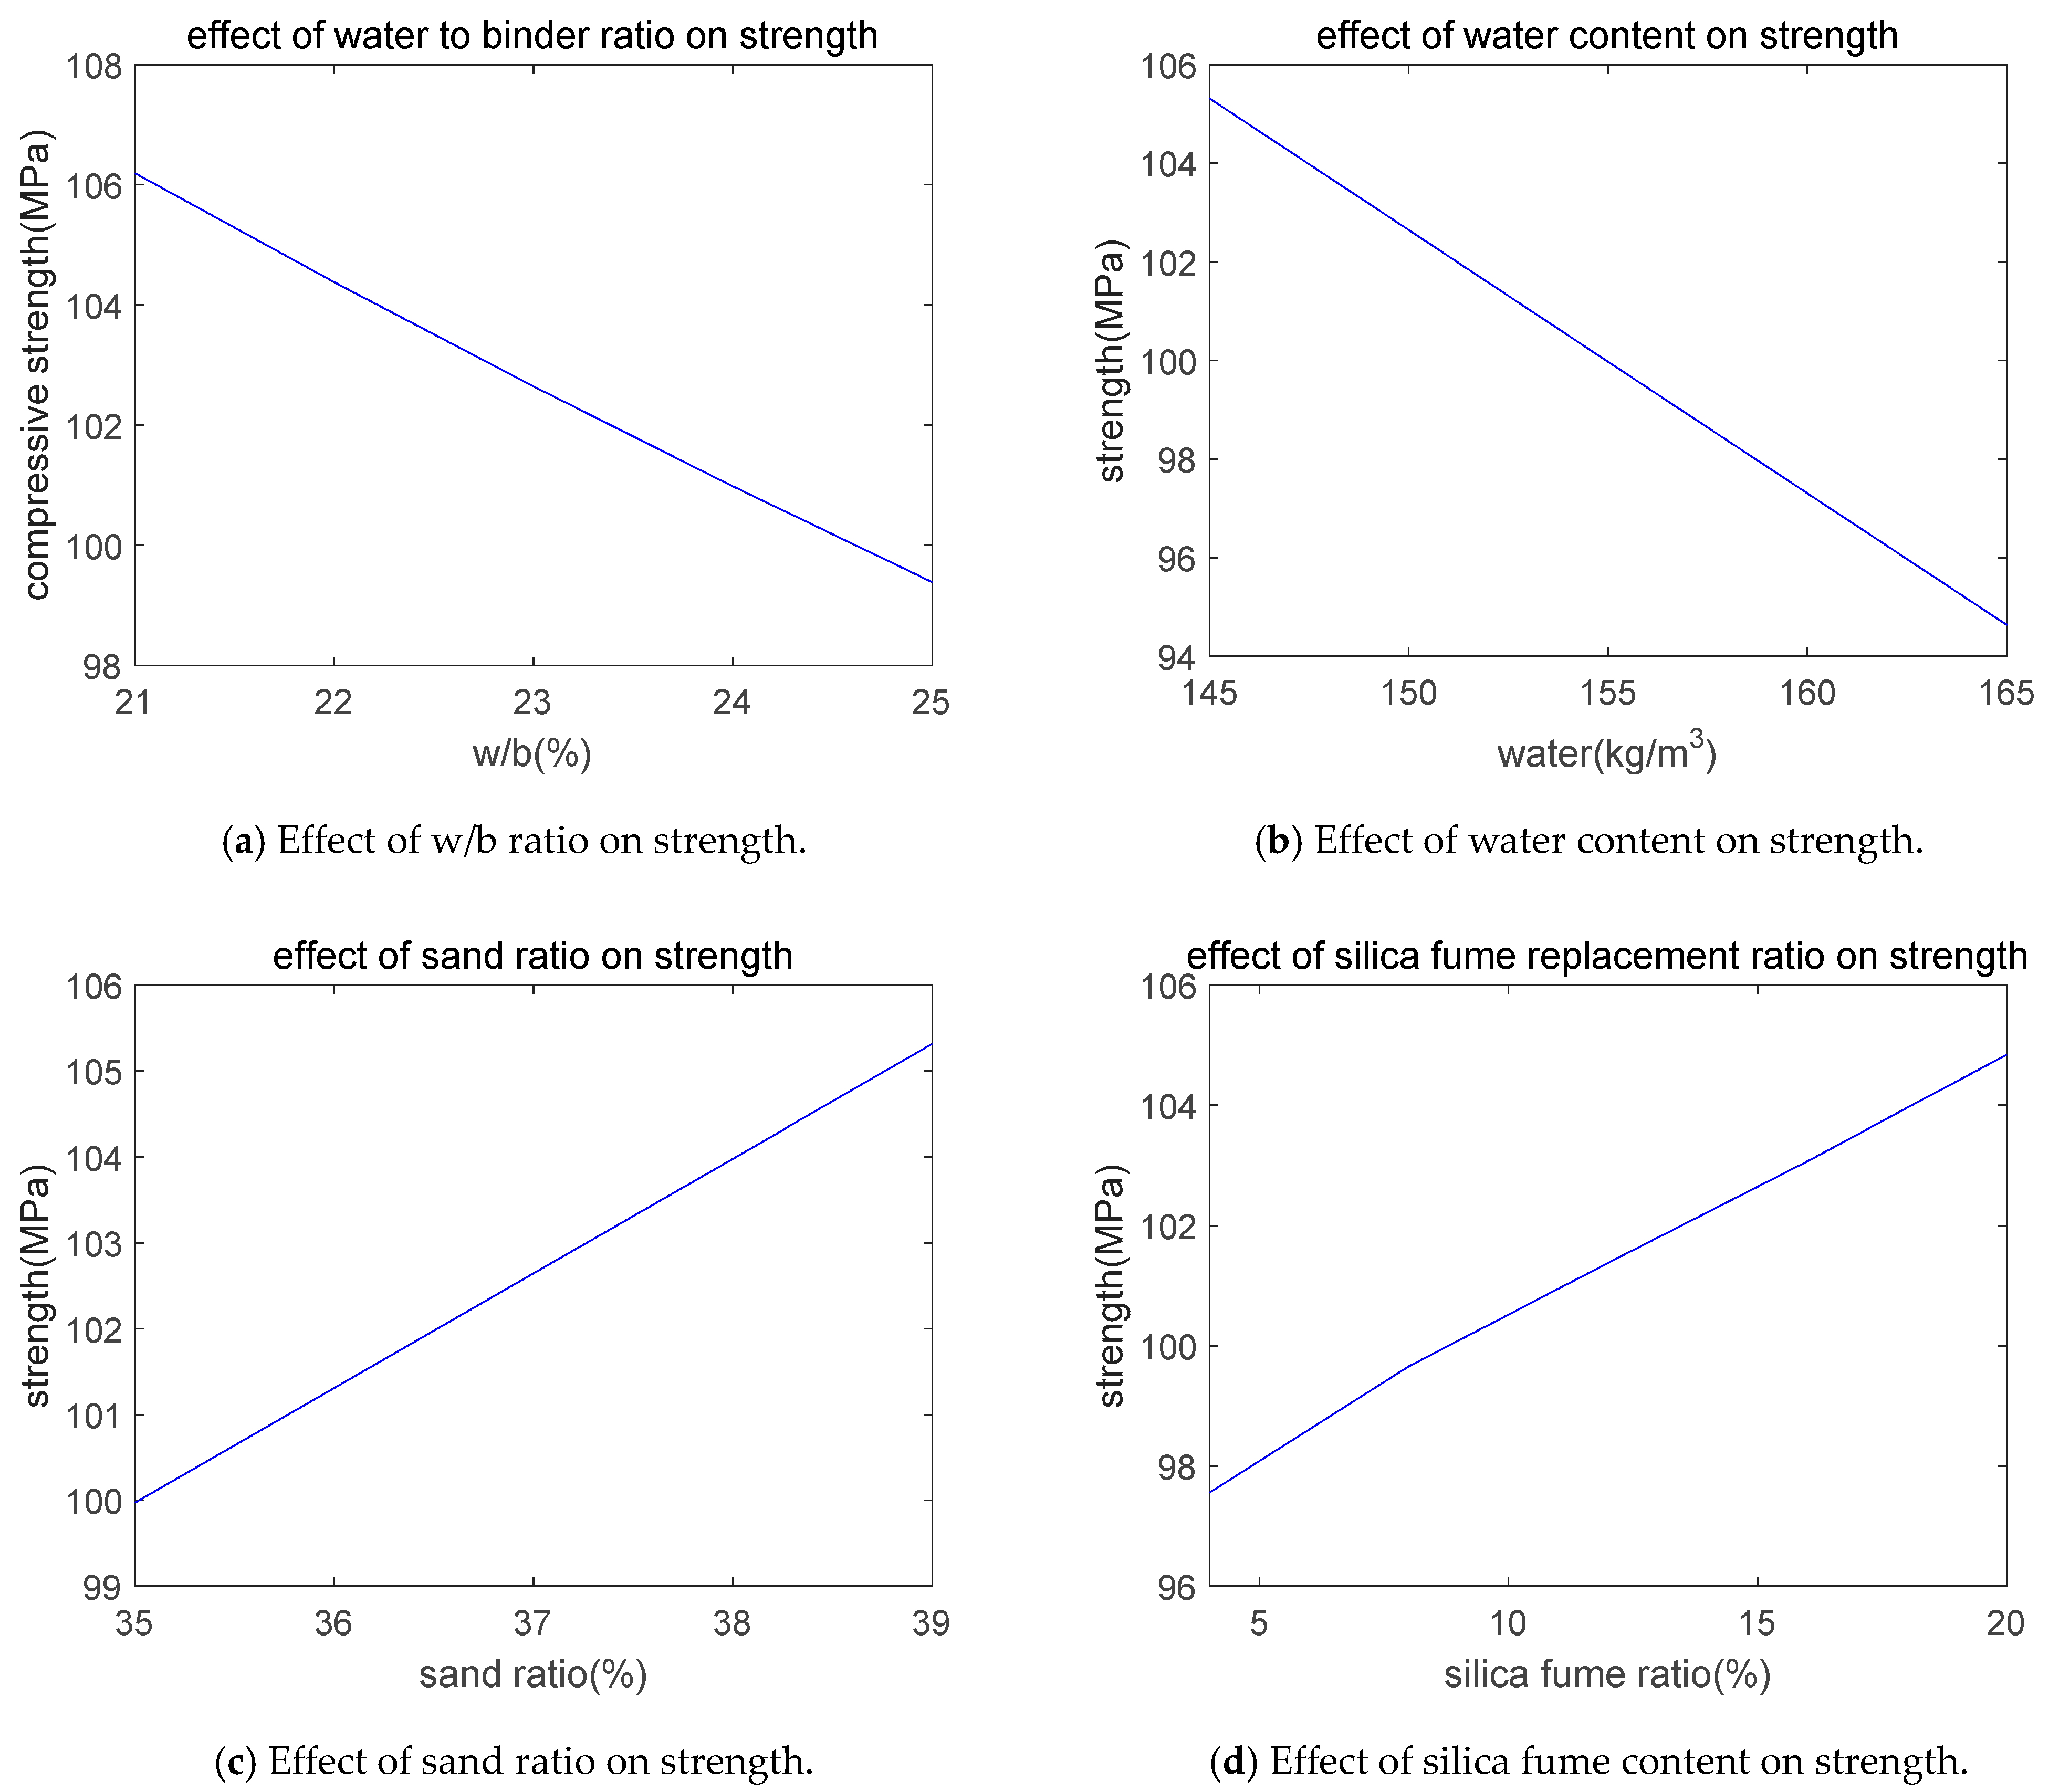
2.3.1. Evaluation Strength Using GEP

GEP is used to evaluate the 28-day strength of silica fume-blended concrete. The w/b ratio, silica-fume-replacement ratio, water content, and sand ratio are set as independent variables of GEP, and strength is set as a dependent variable of GEP. Figure 1 shows the expression tree of strength. The expression tree equals to the sum of three subexpression trees, i.e., Sub-ET1, Sub-ET2, and Sub-ET3. The equation for the expression tree of strength is shown as follows:
strength   =   ( d 2 + ( ( ( 1.0 ( min ( d 3 , d 0 ) 46.782 ) ) + tan h ( ( d 3 7.158 ) ) ) / 2.0 ) ) + ( ( ( 1.0 / ( ( 2.995 / d 2 ) ) ) + ( 86.191 + 9.564 ) ) + ( d 3 + ( 2.995 2 ) ) )   +   ( ( ( ( ( ( 3.526 + d 1 ) / 2.0 ) + ln ( d 3 ) ) / 2.0 ) + tan h ( 0.898 ) ) × ( 1.0 ln ( d 0 ) ) )
where d0 is w/b ratio (%), d1 is water content (kg/m3), d2 is water content (kg/m3), and d3 is the silica-fume-replacement ratio (%). In Equation (5), the first row, second row, and third row correspond to Sub-ET1, Sub-ET2, and Sub-ET3, respectively. As shown in Figure 2, the analysis results generally agree with the experimental results. The correlation coefficient between experimental results and analysis results of strength is 0.96. In line with the expression tree, a parameter analysis is performed, thinking about the person aftereffect of the w/b ratio, water content, sand ratio, and silica-fume-replacement ratio on strength. Whenever we obtain a result in the parameter analysis, we simply change one variable each time and keep the other three variables as constants. The outcomes from the parameter analysis of strength are presented in Figure 3. Because the w/b ratio and water content increase, the porosity of the concrete increases. Consequently, concrete strength decreases (Figure 3a,b). Next, because the sand ratio increases, the range of the interfacial transition zone decreases, and the strength of the concrete increases (Figure 3c). Third, because the silica-fume-replacement ratio increases, the pozzolanic reaction will make the concrete strength increase (Figure 3d). In reality, these relationships in Figure 3 are not usually direct or linear. For example, compressive strength varies inversely with the w/c ratio through Abram’s generalization law. The trend of regression depends on the source of regression data. When the source of data varies, the specific trends may be different.

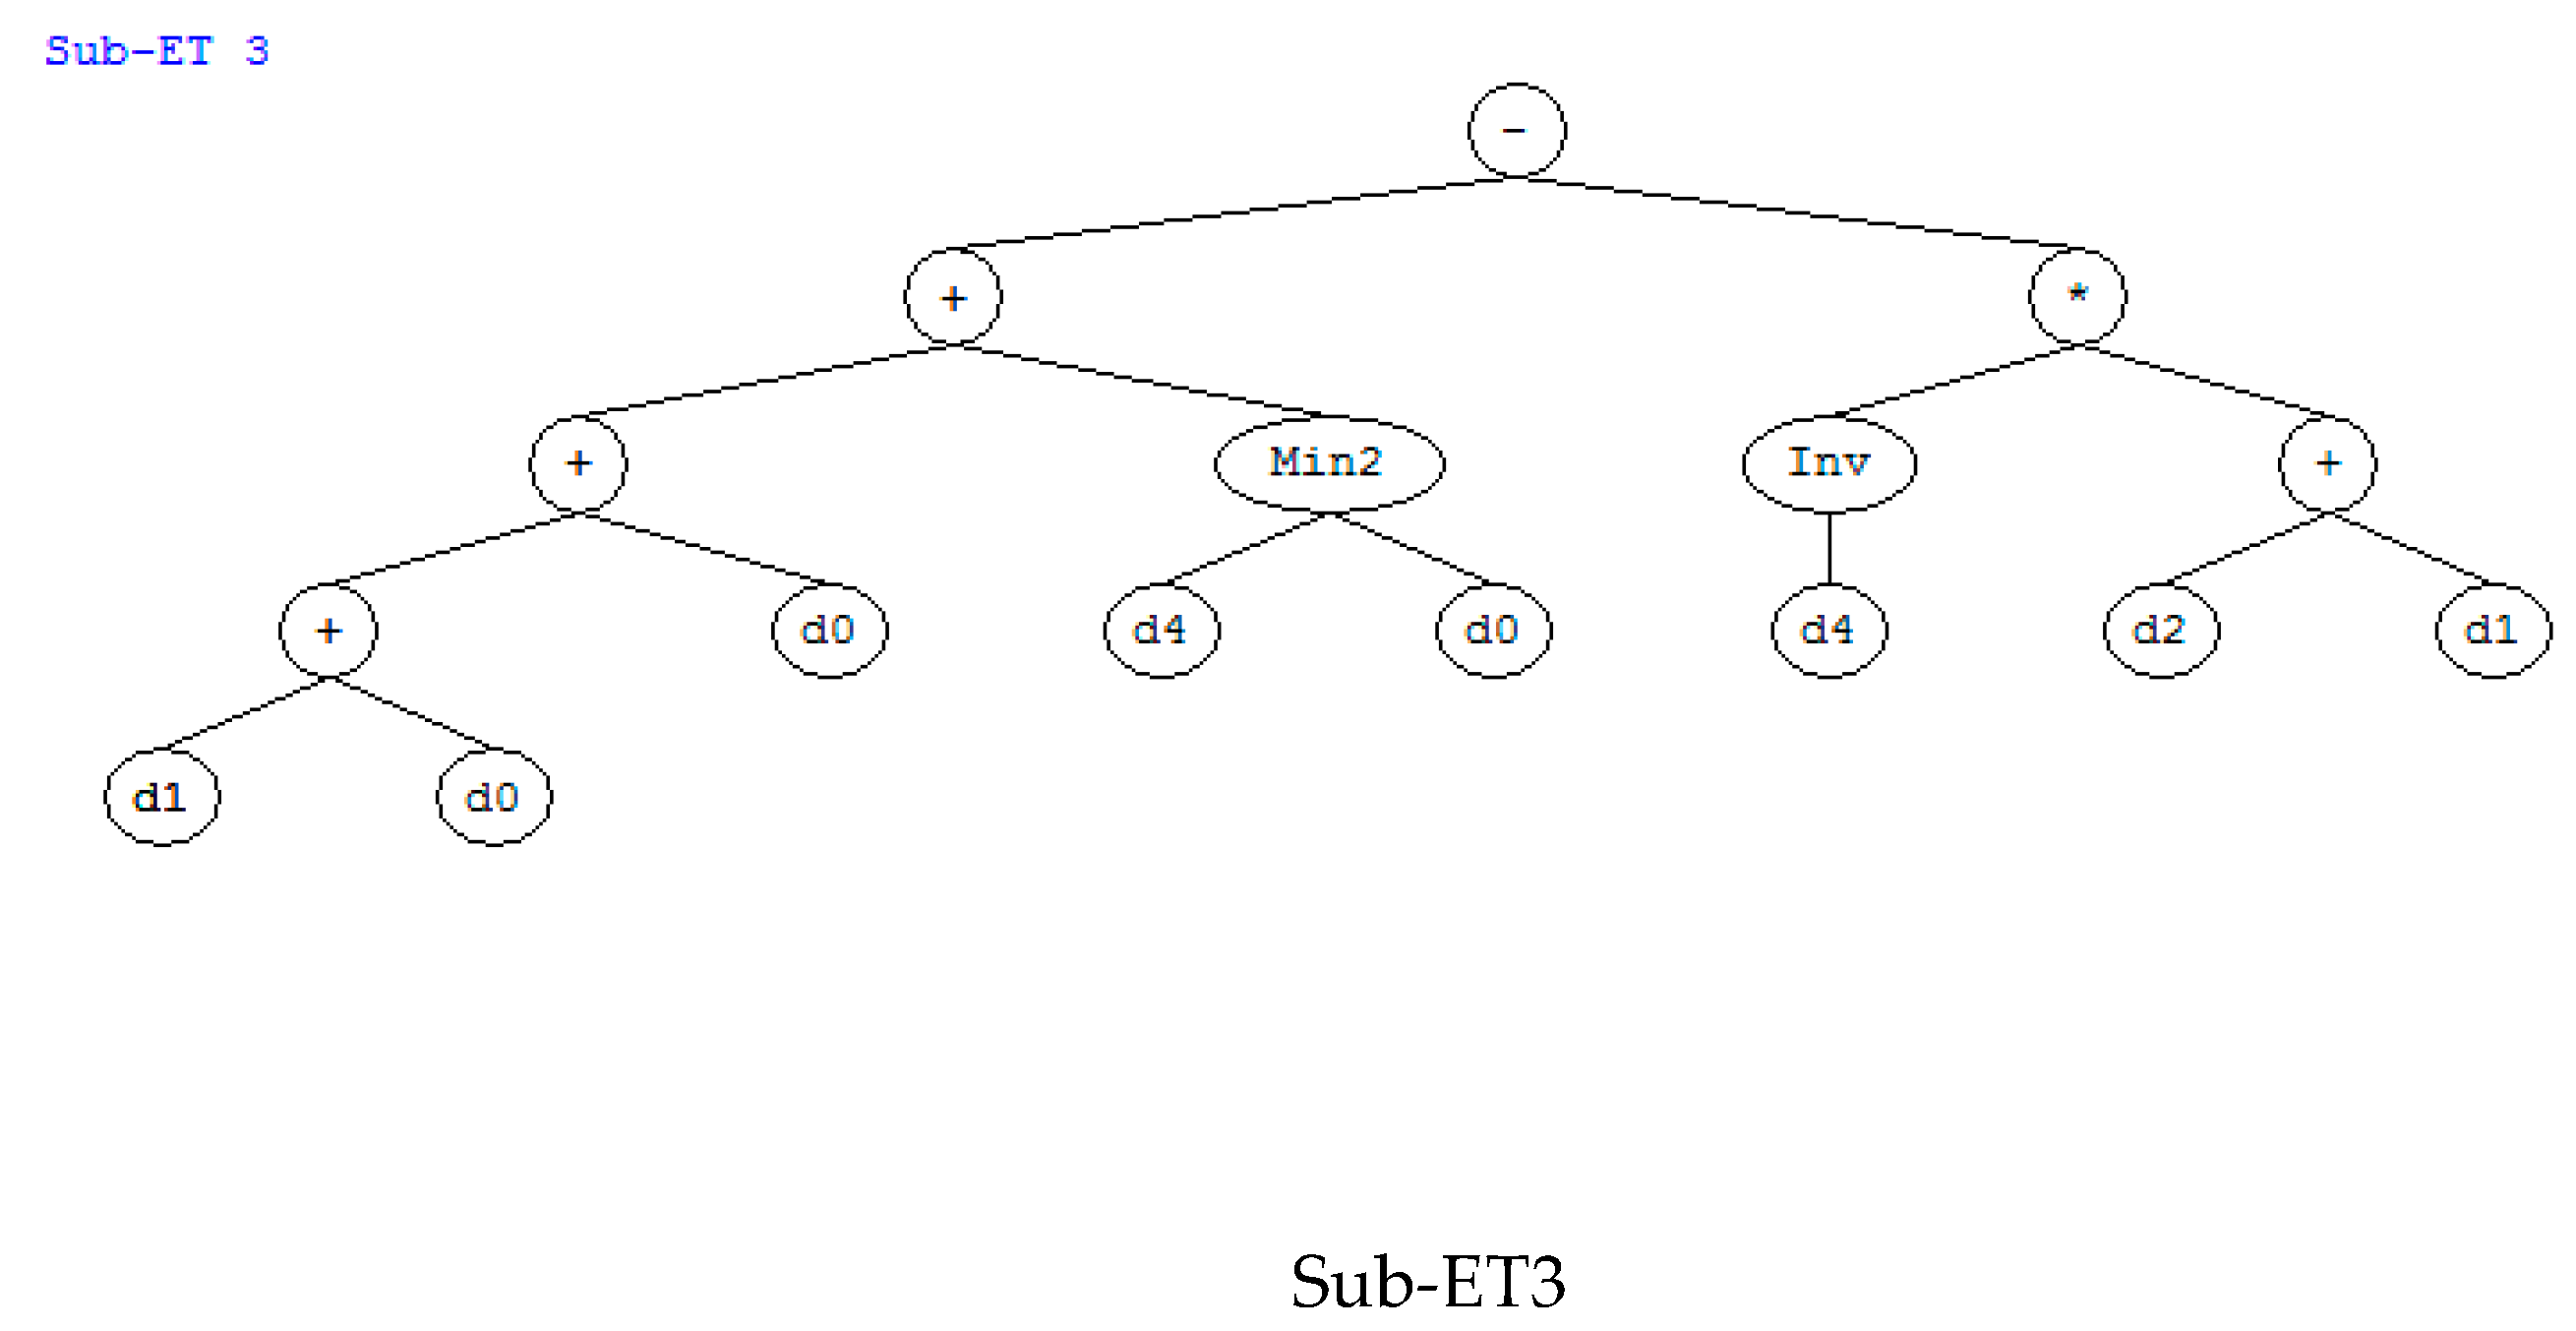
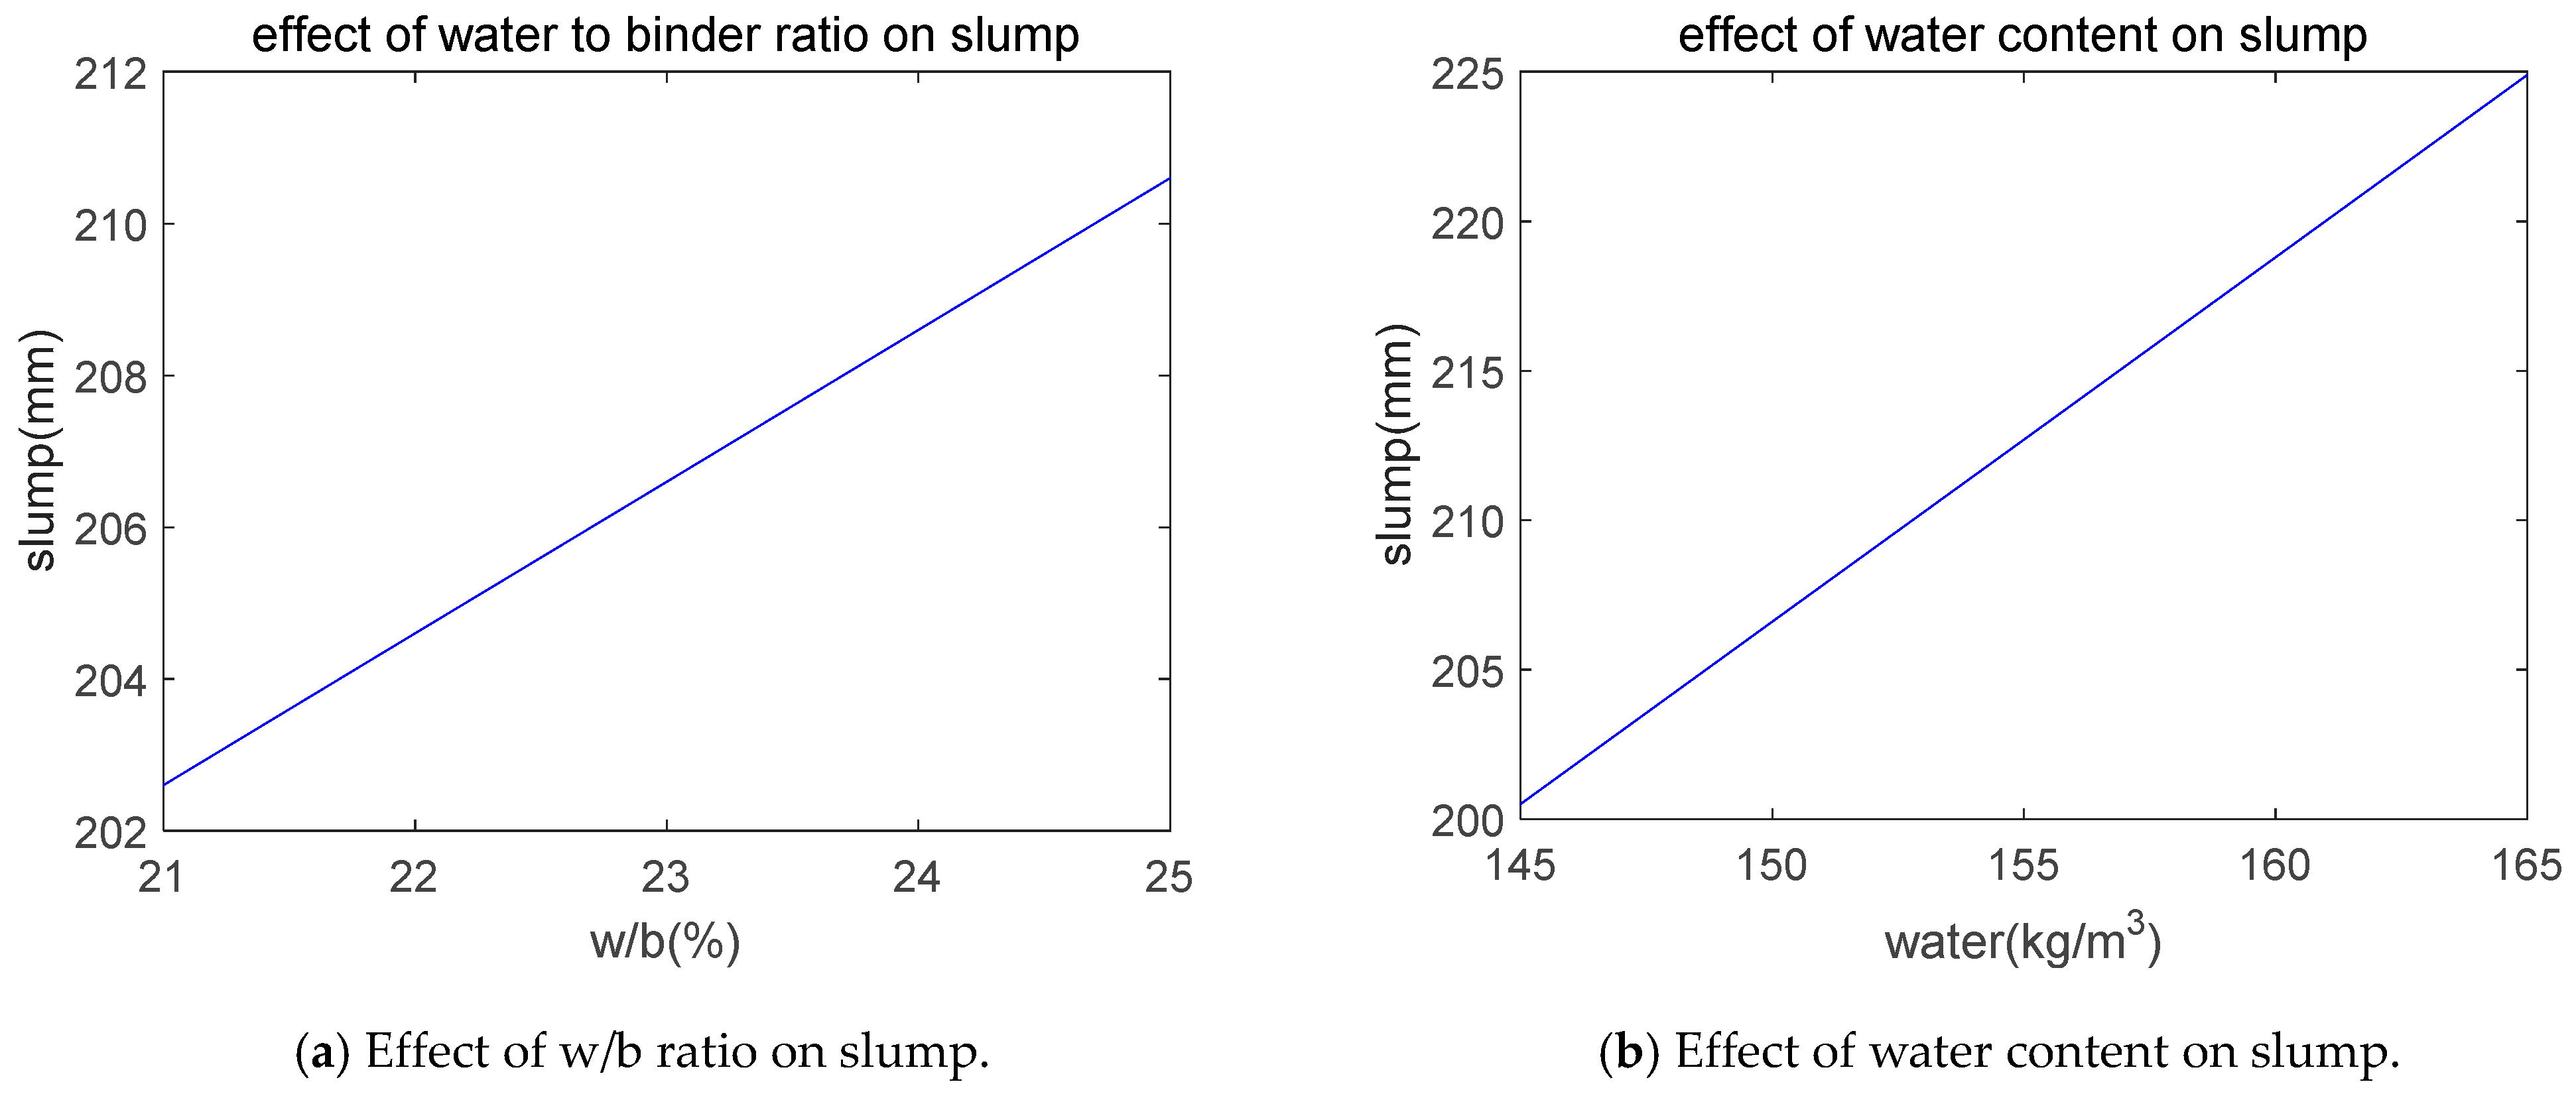
2.3.2. Evaluation Slump Using GEP

Gene expression programming is used to evaluate the slump of silica fume-blended concrete. The w/b ratio, silica-fume-replacement ratio, water content, sand ratio, and superplasticizer are set as independent variables of GEP, and slump is set as a dependent variable of GEP. Figure 4 shows the expression tree of slump, which equals to the sum of three subexpression trees, i.e., Sub-ET1, Sub-ET2, and Sub-ET3. The equation for the expression tree of slump is shown as follows:
  slump =   ( ( ( ( d 4 × 9.733 ) / max ( d 3 , 6.387 ) ) + ( ( d 2 d 3 ) / 1.839 ) ) d 2 )   +   ( ( ( 1.0 / ( 3.650 ) ) × max ( d 1 , d 4 ) ) + min ( ( d 4 14.717 ) , ( 0.128 × d 3 ) ) ) + ( ( ( ( d 1 + d 0 ) + d 0 ) + min ( d 4 , d 0 ) ) ( ( 1.0 / ( d 4 ) ) × ( d 2 + d 1 ) ) )
where d0 is the w/b ratio (%), d1 is the water content (kg/m3), d2 is the sand ratio (%), d3 is the silica-fume-replacement ratio (%), and d4 is the superplasticizer content (kg/m3). In Equation (6), the first row, second row, and third row correspond to Sub-ET1, Sub-ET2, and Sub-ET3, respectively. As shown in Figure 5, the analysis results, in general, agree with the experimental results. The correlation coefficient between experimental results and analysis results of slump is 0.71. In line with the expression tree in Figure 4, a parameter analysis is performed, considering the person aftereffect of w/b ratio, water content, sand ratio, silica fume substitute ratio, and superplasticizer content on slump. The outcomes of parameter analysis of slump are shown in Figure 6. As shown in this figure, because the w/b ratio, water content, and superplasticizer content increase, the concrete slump increases (Figure 6a,b,e). For Figure 6e, as the content of superplasticizer increases, the slope of the curve decreases. This is because the content of the superplasticizer is reaching its saturation point, and the water reducing effect becomes weaker at the saturation point of superplasticizer [27]. In addition, because the sand ratio and silica-fume-replacement ratio increase, the concrete slump decreases (Figure 6c,d). For Figure 6d, as the silica fume ratio increases, the absolute value of the slope of the curve decreases. This is because of the increase in the thickness of the paste layer, which can lubricate the flow of concrete.

2.4. Summary of Optimization Design Approach

In this section, we determine the aim function and constraint of concrete mixing design. The aim function is the total cost of concrete, which is equal to the material cost plus CO2 emissions cost. Constraints include various mechanical and workability properties—for example, design compressive strength constraint, design workability constraint, range constraints, ratio constraints, and concrete volume constraint. Concrete strength and slump are evaluated using GEP. The optimal mixture can be determined when object function with constraints are solved.
We use a GA to solve object functions with constraints. The GA is a global optimization algorithm developed based on natural selection. The main essential feature of GA is that it has a group search strategy and a simple genetic operator. Group search enables GAs to break through domain search. The genetic operator can reduce the reliance on human-computer interaction in the search process. In this study, we adopted the optimization toolbox of MATLAB [28]. After setting the optimization objective and constraint conditions, the optimal proportion of concrete can be calculated automatically.

3. Illustrative Examples and Discussions

The illustrative examples contain optimal mix design of high-strength concrete with different strength levels and various CO2 pricings. The design strength ranges from 95 MPa to 115 MPa with steps of 5 MPa. The Independent Chemical Information Service (ICIS) forecasted that carbon price will show a five-fold increase in the next ten years [29], and Prasodjo forecasted that carbon price will increase 5% annually in the next 50 years [30]. We considered the impact of an increase of carbon pricing on optimal mix design of high-strength concrete. Four types of CO2 pricing are considered: normal CO2 pricing, zero CO2 pricing, five-fold CO2 pricing, and ten-fold CO2 pricing. Through these illustrative cases, we can identify the effects of design strengths and the increase of CO2 price on the optimal mixtures of high-strength concrete.

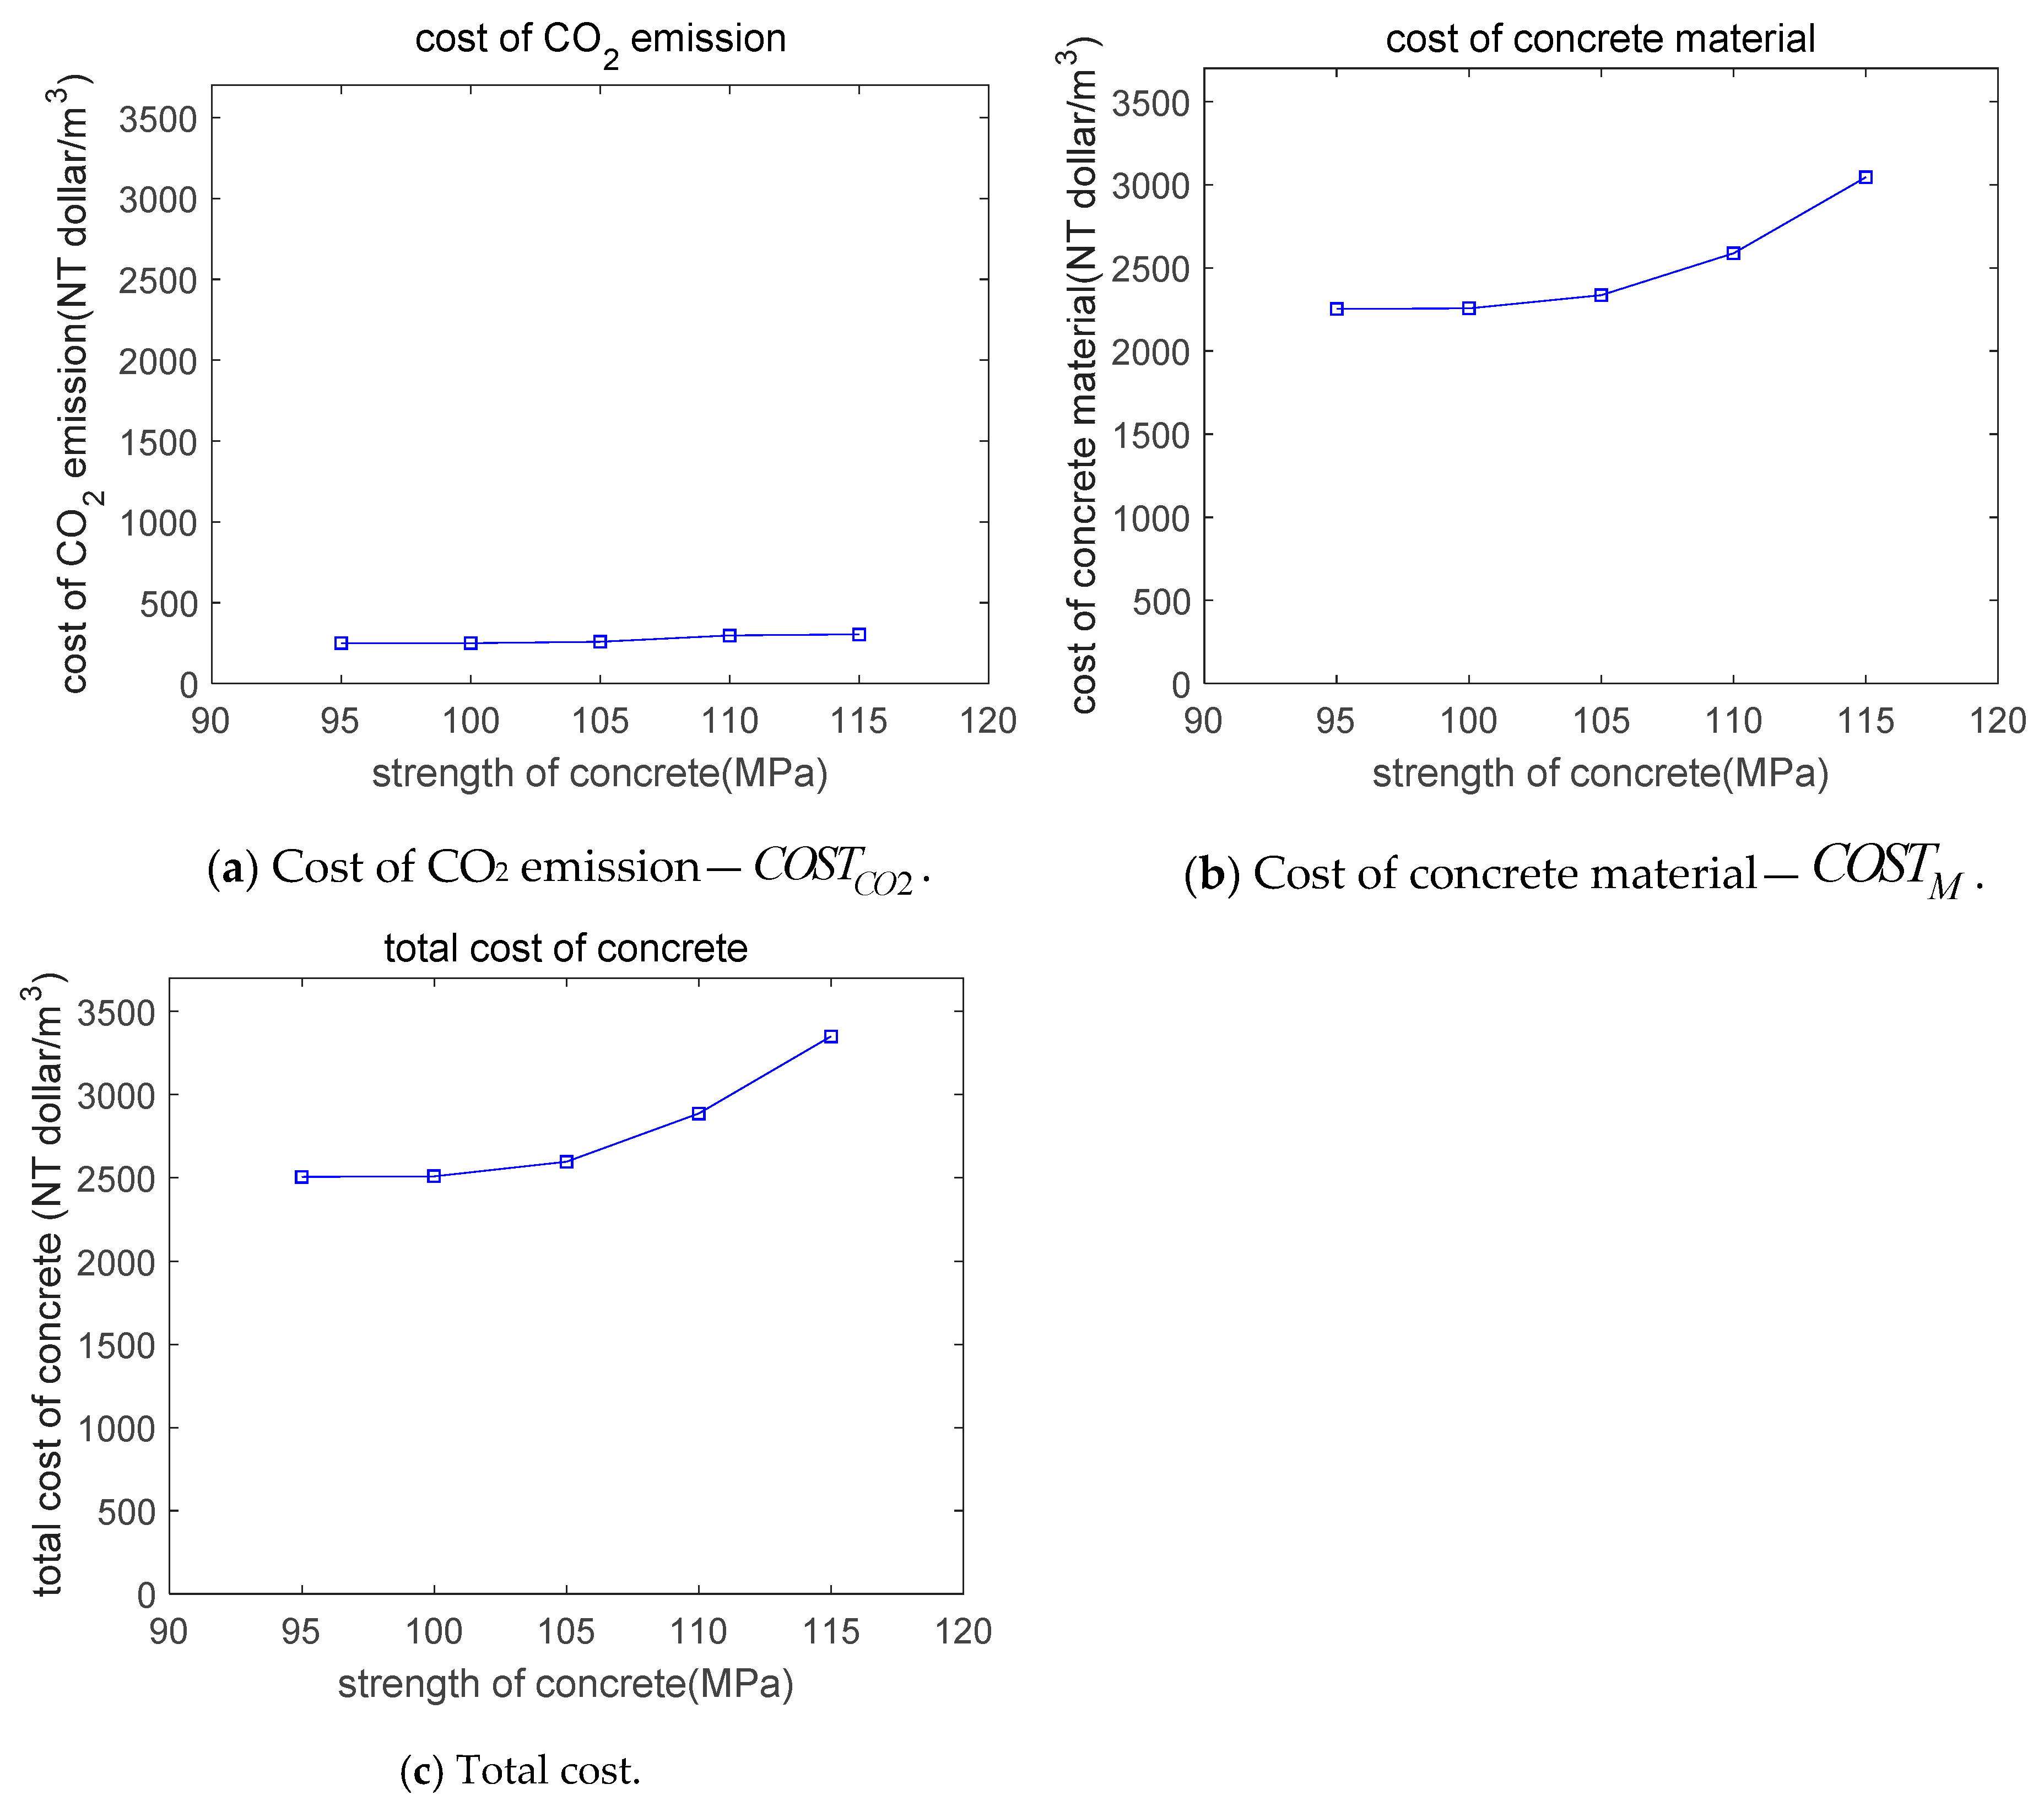
3.1. Optimal Mixtures with Normal CO2 Pricing

In this section, CO2 pricing is set as normal CO2 pricing Pr C O 2 . Examples are provided for that mixture style of high-strength concrete with various strength levels, from 95 MPa to 115 MPa, with steps of 5 MPa. The required slump was assumed to be 180 mm. The air content was assumed to be 2%. The item purpose of the genetic formula was the minimum total cost.
The compressive strength of concrete could be evaluated while using the expression tree provided in Figure 1, the slump of concrete could be evaluated while using the expression tree provided in Figure 4, and the total cost could be evaluated using Equation (1). The constraints consist of design compressive strength constraint, design workability constraint, range constraints, ratio constraints, and concrete volume constraint. In line with the GA that views the different constraints, the mixtures were calculated and therefore are provided in Table 4. The compressive strength of Mixture 1, Mixture 2, Mixture 3, Mixture 4, and Mixture 5 were 95 MPa, 100 MPa, 105 MPa, 110 MPa, and 115 MPa, respectively. The component ratios are provided in Table 5. The next outcome was acquired in line with the items in Table 4 and Table 5. First, because the required strength of concrete increased, the silica fume contents within the mixtures also increased. This shows the value of silica fume in producing high-strength concrete. The content of binder (cement plus silica fume) in Mixture 1 and Mixture 2 equals to the lower limit of binder (Table 2). Second, water contents for concrete with greater strengths, for example, Mixture 3 (105 MPa), Mixture 4 (110 MPa), and Mixture 5 (115 MPa), were comparable to the low limit water (Table 2). This means that smaller water submissions are useful for creating high-strength concrete. Third, the information from the concrete component and component ratios can satisfy the constraints provided in Table 2 and Table 3.
The performances of Mixture 1 to Mixture 5 are provided in Table 6. The next outcome was acquired in line with the items in Table 6. First, because the compressive strength of concrete increased from 95 MPa to 115 MPa, w/b ratio decreased from 0.26 to 0.19, and the silica fume substitute ratio elevated from 0.05 to 0.09. This means that a smaller w/b ratio along with a greater silica-fume-replacement ratio can increase the strength of concrete. Second, the sand ratio for each mixture was comparable to the top of the limit of sand ratio (Table 3). This is because the concrete strength increases with the sand ratio. Third, the slumps for every mixture are higher compared to the required slump of 180 mm. Fourth, as provided in Figure 7, as the strength of concrete increased, the cost of CO2 emissions increased (Figure 7a), the cost of concrete material increased (Figure 7b), and the all-inclusive costs of concrete also increased (Figure 7c). Similarly, Yeh [31] and Kim et al. [32] found the material cost of concrete increases as the increase of the strength of concrete. Park et al. [33] reported the CO2 emission of concrete increases as the compressive strength of concrete increases. Fifth, CO2 emissions cost is about 10% of the fabric cost. Quite simply, the mix design is dominated by material cost, not CO2 emissions cost.

3.2. Optimal Mixtures with Zero CO2 Pricing

In Section 3.1, the carbon pricing is set as normal CO2 pricing. In this section, carbon pricing is set as zero to show the effect of CO2 emissions cost on the optimal mix design. The object function of optimization is equal to the material cost. Other parameters are the same as those of Section 3.1. Based on the GA, the optimal mixtures are determined and shown in Table 7. The compressive strength of Mixture 6, Mixture 7, Mixture 8, Mixture 9, and Mixture 10 are 95, 100, 105, 110, and 115 MPa, respectively. The mixtures of Mixture 6, Mixture 7, Mixture 8, Mixture 9, and Mixture 10 were found the same as those of Mixture 1, Mixture 2, Mixture 3, Mixture 4, and Mixture 5, respectively. This is because the CO2 emissions cost is much lower when compared with the material cost (CO2 emissions cost is equal to about 10% of the material cost, shown in Table 6). In other words, ignoring CO2 pricing does not change the optimal mix design of sustainable high-strength concrete. However, the total cost will be lowered as the CO2 emission cost is ignored.

3.3. Optimal Mixtures with Five-fold CO2 Pricing

In this section, we consider the effect of an increase of carbon pricing on mix design of high-strength concrete. The unit price of CO2 in this section is set as five times that of normal CO2 pricing. Other parameters are the same as those of Section 3.1 and Section 3.2. Based on the GA, the optimal mixtures were determined, as shown in Table 8. The performances of optimal mixtures are shown in Table 9. The following items were obtained based on the contents of Table 8 and Table 9. First, the strength of Mixture 13, Mixture 14, and Mixture 15 were the same as Mixture 3, Mixture 4, and Mixture 5, respectively. However, the cement content of Mixture 13, Mixture 14, and Mixture 15 was lower than that of Mixture 3, Mixture 4, and Mixture 5, respectively. This is because the unit CO2 emission of cement was much higher than that of silica fume (shown in Table 1). When the unit price of CO2 has increased five-fold, the CO2 emission cost will be more significant in the optimal design. Consequently, the cement content in the optimal mixtures will be much lower. Furthermore, the cement content in Mixture 15 (strength 115 MPa) has reached the lower limit of cement content (shown in Table 2). Second, Mixture 11 (strength 95 MPa) and Mixture 12 (strength 100 MPa) are the same as Mixture 1 (strength 95 MPa) and Mixture 2 (strength 100 MPa), respectively. This may be because the cement content of Mixture 1 and Mixture 2 are lower than those of Mixture 3, Mixture 4, and Mixture 5. Mixtures with a relatively lower cement content are not sensitive to variation in carbon price. In addition, based on the comparisons of total cost of mixtures for normal CO2 pricing and five-fold CO2 pricing, it is found the total cost increases as the CO2 pricing increases.

3.4. Optimal Mixtures with Ten-fold CO2 Pricing

In Section 3.3, the unit price of CO2 has increased five-fold. In this section, the unit price of CO2 is increased ten-fold. Based on a similar optimization design process, we can calculate the optimal mixtures with ten-fold CO2 pricing. Table 10 shows optimal mixtures and Table 11 shows performance of optimal mixtures. Based on the comparisons of Table 8 (five-fold CO2 pricing) and Table 10 (ten-fold CO2 pricing), we can find the following items. First, Mixture 14 and Mixture 19 have equal compressive strength (110 MPa), but the cement content of Mixture 14 is much higher than that of Mixture 19. This is because the CO2 emissions of cement are much higher than that of silica fume. The increasing of the CO2 price will make the cement content of optimal mixtures much lower. This trend is similar to those in Section 3.3. Second, Mixture 20 (115 MPa) is the same as Mixture 15 as the CO2 price increases. This is because the cement content of Mixture 15 has reached the lower limit of cement. Third, Mixture 16, Mixture 17, and Mixture 18 are the same as those of Mixture 11, Mixture 12, and Mixture 13, respectively. This is because the cement contents of Mixture 11 to Mixture 13 are lower than that of Mixture 14. Mixtures with a relative lower cement content are not sensitive to variations in carbon price.

3.5. Discussion

The suggested method within this study could be considered to be replicating the style of high-strength concrete. To make use of the suggested method, first collect the accessible mixtures, making regressions concerning the strength and workability of concrete using GEP. Next, choose the object function, making optimizations using GA. For various countries, the equations of strength and slump might be not the same as equations used in this research [34,35,36]. However, the observation procedure is extremely similar. However, because high-strength concrete can satisfy the requirement in terms of durability, the proposed design procedure does not consider the durability constraints. For low- or ordinary-strength concrete, durability constraints should be considered [16].

4. Conclusions

Material cost and CO2 emission are important indexes for the sustainability of the concrete industry. Especially for high-strength concrete, the binder content, material cost, and CO2 emission are higher than those of ordinary-strength concrete. A sustainable high-strength concrete should have lower material cost and CO2 emission with adequate strength or workability.
This research proposed a calculation procedure for the mix design of silica fume-blended concrete with lower material cost and CO2 emission. The carbon pricing is used to transform the unit of CO2 emissions into the unit of material cost. The effects of carbon pricing on the optimal mixtures are highlighted.
Illustrative examples were presented for the design of high-strength concrete. Five strength levels (95, 100, 105, 110, and 115 MPa) and four CO2 pricings (normal, zero, five-fold, and ten-fold) were considered. Based on GEP and GA, a total of 20 optimal mixtures were determined. The following results were found:
(1) For normal CO2 pricing, a lower w/b ratio, along with a greater silica-fume-replacement ratio, can improve the strength of concrete. As the strengths of concrete increased, the cost of CO2 emissions, the cost of concrete material, and the total cost rose.
(2) For zero CO2 pricing, the optimal mixtures are the same as those of normal CO2 pricing. This is because CO2 emissions cost is much lower than the material cost. The mix design is dominated by material cost, not CO2 emissions cost. The total cost will be lowered as the CO2 emissions cost is ignored.
(3) For five-fold CO2 pricing, the cement content of mixtures with higher strengths (105, 110, and 115 MPa) are lower than those of normal CO2 pricing. This is because mixtures with relative higher cement contents are sensitive to variations in the carbon price. The total cost will increase as the CO2 pricing increases.
(4) As the CO2 pricing increases from five-fold to ten-fold, for mixtures with a strength of 110 MPa, the cement content becomes lower, but for mixtures with other strength levels, the mix proportions do not change.

Funding

This research was supported by the Basic Science Research Program through the National Research Foundation of Korea (NRF) funded by the Ministry of Science, ICT, and Future Planning (No. 2015R1A5A1037548) and an NRF grant (NRF–2017R1C1B1010076).

Conflicts of Interest

The authors declare no conflict of interest.

References

  1. Damme, H.V. Concrete material science: Past, present, and future innovations. Cem. Concr. Res. 2018, 112, 5–24. [Google Scholar] [CrossRef]
  2. Gartner, E.; Hirao, H. A review of alternative approaches to the reduction of CO2 emissions associated with the manufacture of the binder phase in concrete. Cem. Concr. Res. 2015, 78, 126–142. [Google Scholar] [CrossRef]
  3. Fattah, K.P.; Tamimi, A.K.A.; Hamweyah, W.; Iqbal, F. Evaluation of sustainable concrete produced with desalinated reject brine. Int. J. Sustain. Built Environ. 2017, 6, 183–190. [Google Scholar] [CrossRef]
  4. Rashid, K.; Razzaq, A.; Ahmad, M.; Rashid, T.; Tariq, S. Experimental and analytical selection of sustainable recycled concrete with ceramic waste aggregate. Constr. Build. Mater. 2017, 154, 829–840. [Google Scholar] [CrossRef]
  5. Sharma, R.; Khan, R.A. Sustainable use of copper slag in self compacting concrete containing supplementary cementitious materials. J. Clean. Prod. 2017, 151, 179–192. [Google Scholar] [CrossRef]
  6. Hassan, H.E.; Kianmehr, P. Pervious concrete pavement incorporating GGBS to alleviate pavement runoff and improve urban sustainability. Road Mater. Pavement Des. 2018, 19, 167–181. [Google Scholar] [CrossRef]
  7. Senaratne, S.; Gerace, D.; Mirza, O.; Tam, V.W.Y.; Kang, W.H. The costs and benefits of combining recycled aggregate with steel fibres as a sustainable, structural material. J. Clean. Prod. 2016, 112, 2318–2327. [Google Scholar] [CrossRef]
  8. Anastasiou, E.K.; Liapis, A.; Papachristoforou, M. Life Cycle Assessment of Concrete Products for Special Applications Containing EAF Slag. Procedia Environ. Sci. 2017, 38, 469–476. [Google Scholar] [CrossRef]
  9. Lin, R.S.; Wang, X.Y.; Zhang, G.Y. Effects of Quartz Powder on the Microstructure and Key Properties of Cement Paste. Sustainability 2018, 10, 3369–3384. [Google Scholar] [CrossRef]
  10. Carolina, G.G.D.; Manuel, G.S.J.; Ramon, C.H.; Luis, A.S.J.; Consolacion, G.S.M.; Alberto, G.S.L. LCA as Comparative Tool for Concrete Columns and Glulam Columns. J. Sustain. Archit. Civ. Eng. 2015, 2, 21–31. [Google Scholar]
  11. Tae, S.H.; Baek, C.H.; Shin, S.W. Life cycle CO2 evaluation on reinforced concrete structures with high-strength concrete. Environ. Impact Assess. Rev. 2011, 31, 253–260. [Google Scholar] [CrossRef]
  12. Teixeira, E.R.; Mateus, R.; Camoes, A.F.; Bragança, L.; Branco, F.G. Comparative environmental life-cycle analysis of concretes using biomass and coal fly ashes as partial cement replacement material. J. Clean. Prod. 2016, 112, 2221–2230. [Google Scholar] [CrossRef] [Green Version]
  13. Yang, K.H.; Song, J.K.; Song, K.I. Assessment of CO2 reduction of alkali-activated concrete. J. Clean. Prod. 2013, 39, 265–272. [Google Scholar] [CrossRef]
  14. Heath, A.; Paine, K.; McManus, M. Minimising the global warming potential of clay based geopolymers. J. Clean. Prod. 2014, 78, 75–83. [Google Scholar] [CrossRef] [Green Version]
  15. Yeh, I.C. Modeling Concrete Strength with Augment-Neuron Networks. J. Mater. Civ. Eng. 1998, 10, 263–268. [Google Scholar] [CrossRef]
  16. Parichatprecha, R.; Nimityongskul, P. An integrated approach for optimum design of HPC mix proportion using genetic algorithm and artificial neural networks. Comput. Concr. 2009, 6, 253–268. [Google Scholar] [CrossRef]
  17. Kao, C.Y.; Shen, C.H.; Jan, J.C.; Hung, S.L. A Computer-Aided Approach to Pozzolanic Concrete Mix Design. Adv. Civ. Eng. 2018. [Google Scholar] [CrossRef]
  18. Yadollahi, A.; Nazemi, E.; Zolfaghari, A.; Ajorloo, A.M. Application of artificial neural network for predicting the optimal mixture of radiation shielding concrete. Prog. Nucl. Energy 2016, 89, 69–77. [Google Scholar] [CrossRef]
  19. Chiew, F.H.; Ng, C.K.; Chai, K.C.; Tay, K.M. A Fuzzy Adaptive Resonance Theory-Based Model for Mix Proportion Estimation of High-Performance Concrete. Comput. Aided Civ. Infrastruct. Eng. 2017, 32, 772–786. [Google Scholar] [CrossRef]
  20. Park, H.S.; Kwon, B.K.; Shin, Y.A.; Kim, Y.S.; Hong, T.H.; Choi, S.W. Cost and CO2 Emission Optimization of Steel Reinforced Concrete Columns in High-Rise Buildings. Energies 2013, 6, 5609–5624. [Google Scholar] [CrossRef]
  21. Lim, C.H.; Yoon, Y.S.; Kim, J.H. Genetic algorithm in mix proportioning of high-performance concrete. Cem. Concr. Res. 2004, 34, 409–420. [Google Scholar] [CrossRef]
  22. Yang, K.H.; Moon, J.H. Design of Supplementary Cementitious Materials and Unit Content of Binder for Reducing CO2 Emission of Concrete. J. Korea Concr. Inst. 2012, 24, 597–604. [Google Scholar] [CrossRef]
  23. Behnood, A.; Ziari, H. Effects of silica fume addition and water to cement ratio on the properties of high-strength concrete after exposure to high temperatures. Cem. Concr. Compos. 2008, 30, 106–112. [Google Scholar] [CrossRef]
  24. Shannag, M.J. High strength concrete containing natural pozzolan and silica fume. Cem. Concr. Compos. 2000, 22, 399–406. [Google Scholar] [CrossRef]
  25. Mazloom, M.; Ramezanianpour, A.A.; Brooks, J.J. Effect of silica fume on mechanical properties of high-strength concrete. Cem. Concr. Compos. 2004, 26, 347–357. [Google Scholar] [CrossRef]
  26. Ferreira, C. Gene Expression Programming: Mathematical Modeling by an Artificial Intelligence, 2nd ed.; Springer: Berlin/Heidelberg, Germany, 2006. [Google Scholar]
  27. Xiao, L.Z.; Li, Z.J.; Wei, X.S. Selection of superplasticizer in concrete mix design by measuring the early electrical resistivities of pastes. Cem. Concr. Compos. 2007, 29, 350–356. [Google Scholar] [CrossRef]
  28. Mathworks. Available online: http://www.mathworks.com (accessed on 1 August 2019).
  29. Independent Chemical Information Service. What Are the Effects of the Price Increase for the CO2 Allowances on the EU ETS Market? Available online: https://beyond-ratings.com/publications/what-effects-price-increase-CO2-allowances-eu-ets-market/ (accessed on 1 August 2019).
  30. Prasodjo. Modeling CCS Deployment under Cap and Trade. Available online: http://darmawanprasodjo.com/economic-modeling/modeling-ccs-under-cap-and-trade/ (accessed on 1 August 2019).
  31. Yeh, I.C. Computer-aided design for optimum concrete mixtures. Cem. Concr. Compos. 2007, 29, 193–202. [Google Scholar] [CrossRef]
  32. Kim, T.H.; Tae, S.H.; Roh, S.J. Assessment of the CO2 emission and cost reduction performance of a low-carbon-emission concrete mix design using an optimal mix design system. Renew. Sustain. Energy Rev. 2013, 25, 729–741. [Google Scholar] [CrossRef]
  33. Park, J.H.; Tae, S.H.; Kim, T.H. Life cycle CO2 assessment of concrete by compressive strength on construction site in Korea. Renew. Sustain. Energy Rev. 2012, 16, 2940–2946. [Google Scholar] [CrossRef]
  34. Life365 Consortium III. Life-365 Service Life Prediction Model. 2018. Available online: http://www.life-365.org/ (accessed on 1 August 2019).
  35. Ministry of housing and urban-rural development of the People’s republic of China. Standard for Durability Assessment of Existing Concrete Structures; China Architecture & Building Press: Beijing, China, 2019. [Google Scholar]
  36. Papadakis, V.G.; Tsima, S. Supplementary cementing materials in concrete Part I: Efficiency and design. Cem. Concr. Res. 2002, 32, 1525–1532. [Google Scholar] [CrossRef]
Figure 1. Expression tree of strength.
Sustainability 11 05827 g001aSustainability 11 05827 g001b
Figure 2. Experimental results vs analysis results of concrete strength.
Sustainability 11 05827 g002
Figure 3. Parameter analysis of concrete strength.
Sustainability 11 05827 g003
Figure 4. Expression tree of slump.
Sustainability 11 05827 g004aSustainability 11 05827 g004b
Figure 5. Experimental results vs analysis results of slump.
Sustainability 11 05827 g005
Figure 6. Parameter analysis of slump.
Sustainability 11 05827 g006aSustainability 11 05827 g006b
Figure 7. Cost of concrete with different strengths.
Sustainability 11 05827 g007
Table 1. Unit cost and unit carbon dioxide emissions of the concrete component [15,22].
Unit Cost
(NT dollar/kg)
Unit CO2 Emissions
(kg/kg)
Cement2.250.931
Silica fume11.250.014
Water0.010.000196
Sand0.280.0026
Coarse aggregate0.2360.0075
Superplasticizer25.10.25
Table 2. Range constraints (unit: kg/m3) [21,23,24,25].
Lower LimitUpper Limit
Cement450710
Silica fume25210
Binder (cement + silica fume)574833
Water140165
Sand500900
Coarse aggregate7001050
Superplasticizer10.936.5
Table 3. Ratio constraints [21,23,24,25].
Lower limitUpper limit
Water-to-binder ratio0.180.27
Water-to-cement ratio0.2110.317
Sand ratio0.350.39
Silica-fume-to-binder ratio0.050.25
Superplasticizer-to-binder ratio0.01880.0469
Table 4. Mixing proportions of concrete—normal CO2 pricing (unit: kg/m3).
Cement Silica FumeWaterFine AggregateCoarse AggregateSuperplasticizer
Mixture 1—95 MPa545.30 28.70 150.71 659.31 1031.22 10.90
Mixture 2—100 MPa545.30 28.70 144.60 665.65 1041.15 10.90
Mixture 3—105 MPa564.96 29.73 140.00 662.65 1036.45 11.87
Mixture 4—110 MPa649.21 34.17 140.00 631.70 988.05 13.18
Mixture 5—115 MPa663.51 68.36 140.00 609.42 953.19 15.36
Table 5. Component ratio of mixtures—normal CO2 pricing.
w/b RatioSilica-Fume-to-Binder RatioSand RatioSuperplasticizer-to-Binder RatioWater-to-Cement RatioAbsolute Volume
Mixture 1—95 MPa0.2620.050.390.01890.2761
Mixture 2—100 MPa0.2510.050.390.01890.2651
Mixture 3—105 MPa0.2350.050.390.01990.2471
Mixture 4—110 MPa0.2040.050.390.01920.2151
Mixture 5—115 MPa0.1910.0930.390.02090.2111
Table 6. Performance of concrete—normal CO2 pricing.
Compressive Strength
(MPa)
Slump
(mm)
CO2 Emission Cost
(NT dollar/m3)
Material Cost
(NT dollar/m3)
Total Cost
(NT dollar/m3)
Mixture 1—95 MPa95.00 193.31 250.61 2252.87 2503.48
Mixture 2—100 MPa100.00 183.96 250.65 2256.93 2507.59
Mixture 3—105 MPa105.00 180.00 259.58 2335.27 2594.85
Mixture 4—110 MPa110.00 180.00 297.33 2587.49 2884.82
Mixture 5—115 MPa115.00 180.00 304.08 3044.43 3348.51
Table 7. Optimal mix design—zero CO2 pricing (unit: kg/m3).
CementSilica FumeWaterFine AggregateCoarse AggregateSuperplasticizer
Mixture 6—95 MPa545.30 28.70 150.71 659.31 1031.22 10.90
Mixture 7—100MPa545.30 28.70 144.60 665.65 1041.15 10.90
Mixture 8—105 MPa564.96 29.73 140.00 662.65 1036.45 11.87
Mixture 9—110 MPa649.21 34.17 140.00 631.70 988.05 13.18
Mixture 10—115 MPa663.51 68.36 140.00 609.42 953.19 15.36
Table 8. Optimal mixtures—five-fold CO2 pricing (unit: kg/m3).
CementSilica FumeWaterFine AggregateCoarse AggregateSuperplasticizer
Mixture 11—95 MPa545.30 28.70 150.71 659.31 1031.22 10.90
Mixture 12—100 MPa545.30 28.70 144.60 665.65 1041.15 10.90
Mixture 13—105 MPa532.22 41.78 140.00 668.04 1044.88 11.72
Mixture 14—110 MPa592.97 53.44 140.00 641.30 1003.06 13.29
Mixture 15—115 MPa450.00 147.96 140.00 645.11 1009.02 13.17
Table 9. Performance of optimal mixtures—five-fold CO2 pricing.
Compressive Strength
(MPa)
Slump
(mm)
CO2 Emissions Cost
(NT dollar/m3)
Material Cost
(NT dollar/m3)
Total Cost
(NT dollar/m3)
Mixture 11—95 MPa95.00 193.31 1253.05 2252.87 3505.93
Mixture 12—100 MPa100.00 183.96 1253.27 2256.93 3510.20
Mixture 13—105 MPa105.00 180.00 1224.95 2396.73 3621.68
Mixture 14—110 MPa110.00 180.00 1361.60 2686.69 4048.28
Mixture 15—115 MPa115.00 180.00 1044.26 3427.71 4471.97
Table 10. Optimal mixtures—ten-fold CO2 pricing (unit: kg/m3).
CementSilica FumeWaterFine AggregateCoarse AggregateSuperplasticizer
Mixture 16—95 MPa545.30 28.70 150.71 659.31 1031.22 10.90
Mixture 17—100 MPa545.30 28.70 144.60 665.65 1041.15 10.90
Mixture 18—105 MPa532.22 41.78 140.00 668.04 1044.88 11.72
Mixture 19—110 MPa468.16 105.84 140.00 658.85 1030.51 12.74
Mixture 20—115 MPa450.00 147.96 140.00 645.11 1009.02 13.17
Table 11. Performance of optimal mixtures—ten-fold CO2 pricing.
Compressive Strength
(MPa)
Slump
(mm)
CO2 Emission Cost
(NT dollar/m3)
Material Cost
(NT dollar/m3)
Total Cost
(NT dollar/m3)
Mixture 16—95 MPa95.00 193.31 2506.11 2252.87 4758.98
Mixture 17—100 MPa100.00183.96 2506.54 2256.93 4763.47
Mixture 18—105 MPa105.00 180.00 2449.90 2396.73 4846.63
Mixture 19—110 MPa110.00 180.00 2167.57 2992.86 5160.43
Mixture 20—115 MPa115.00 180.00 2088.52 3427.71 5516.23

