Article

The Impact of Government Role on High-Quality Innovation Development in Mainland China

1
Business School, Hohai University, Nanjing 211100, China
2
Business School, Henan University, Kaifeng 475004, China
3
College of Economics & Management, China Three Gorges University, Yichang 443002, China
4
International Economic &Technical Cooperation and Exchange Center, Ministry of Water Resources, Beijing 100038, China
*
Authors to whom correspondence should be addressed.
Sustainability 2019, 11(20), 5780; https://doi.org/10.3390/su11205780
Submission received: 9 August 2019 / Revised: 13 October 2019 / Accepted: 15 October 2019 / Published: 18 October 2019

Abstract

:
Innovation serves as the first impetus for high-quality development. The role of government in promoting high-quality innovation development has become a chief driving force. Therefore, based on role theory, this paper will discuss the effect of different government roles on high-quality innovation development and regional alienation, providing policy recommendations for China. In this paper, firstly, a super-efficiency DEA model is introduced to measure the high-quality innovation development level among 30 provinces and municipalities in mainland China from 2010 to 2017. Secondly, a Tobit model is used to analyze the impact of different government roles on high-quality innovation development. The following conclusions are drawn through a super-efficiency DEA model: (1) From the holistic perspective, the high-quality innovation development in mainland China shows a fluctuating growth trend, but its level still needs improvement. (2) From the regional perspective, there is a patchwork pattern of ‘the eastern region ranks highest, followed by the western region and the middle region that stays at the lowest’. In addition, the three regions’ average of total factor productivity of high-quality innovation development has shown a smooth upward trend over the years. Then, the results of Tobit regression analysis are as follows: (1) Apart from the role in supporting talent, roles in constructing innovation platforms, cultivating the innovation environment, and coordinating social resources all pass the significance test. (2) Demands of different government roles vary significantly in different regions from the regional perspective. For the betterment of an innovation society, this paper puts forward suggestions according to different regional development statuses, such as shifting our focus from quantity to quality, strengthening cooperation among provinces and municipalities, and formulating appropriate governance role strategies.

1. Introduction

In a world full of opportunities and challenges, it is imperative for different countries to attach supreme importance to the high quality of development. To gain a first-mover advantage in the new round of international economic competition, the majority of the world’s players have embarked on strategies for future-oriented development [1]. The number of countries propelled by national development plans has more than doubled, from about 62 in 2006 to 134 in 2018, making over 80% of the global population subject to a national plan of one form or another [2].
Against the backdrop of intensifying global competition and novel domestic development environment, China has become a leader among emerging economies in the process of actively exploring new growth paths and development models. However, excessive energy consumption, environmental deterioration, imbalance of economic structure, and a widening income gap have become increasingly prominent [3]. For these reasons, the path of high-quality development has become the optimal way to handle the current difficulties and achieve a leap in the future.
With the reflection on the rapid economic development in the past 40 years of reform and opening-up, China’s economic development has shifted its focus from scale and speed to efficiency and quality, which also symbolizes the start of China’s high-quality development. According to the government work report 2018 of China’s State Council, a new statement on high-quality development has been made. Compared to the traditional development model, the high-quality development model in China represents high efficiency, equitable, and sustainable development, which is aimed at meeting the growing needs of the people for a better life [4]. Additionally, how to correctly position the governments’ role in the high-quality development of mainland China has also been proposed. Following the state’s guidelines, academics have begun to conduct extensive studies revolving around three aspects: high-quality development connotations [5,6], high-quality development systems [7,8], and high-quality development paths [9,10,11]. Although the research contents differ, they all hold that innovation has become the first driving force for high-quality development.
The basis of in-depth study on these three aspects is to make an objective evaluation of high-quality innovation development levels of different regions in mainland China. On this basis, exploring the government role in high-quality innovation development will promote China’s economic advance. Therefore, this paper firstly evaluates the high-quality innovation development level of 30 provinces and municipalities in mainland China; secondly, on the basis of the evaluation results, it introduces role theory to determine the role of different governments in promoting high-quality innovation development of the provinces and municipalities.
At present, the main methods used in evaluating the high-quality development are AHP (analytic hierarchy process), the multi-objective linear weighting method, SFA (stochastic frontier analysis), and the entropy value method [12,13,14,15,16,17]. These research methods follow nearly the same research idea: firstly, establishing an evaluation system in advance; secondly, selecting different kinds of indicators; thirdly, determining the weights of them through the analytic hierarchy process, multi-objective linear weighting method, and entropy value method, etc.; and, finally, conducting a comprehensive assessment of the high-quality development of research objects. However, the above research methods have some limitations: the AHP method may be too subjective when comparing the importance of various indicators; the entropy weight method can obtain relatively objective results, but it has higher requirements on the number of data samples; and multi-objective linear weighting and SFA require a definite function to show the relationship between high-quality development efficiency and influencing factors, which is easily affected by the misspecification [18] and, thus, leads to inaccurate results.
Given the limitations of the above research methods, we introduce the super-efficiency DEA model and the Tobit regression model into this study to evaluate the high-quality innovation development level in different regions of mainland China. As to the advantages of super-efficiency DEA model, it does not need to determine the index construction function relation in advance, which can avoid the influence of subjective factors on the model construction and can distinguish the efficiency value of effective and non-effective decision-making units [19,20,21]. In addition, it can compare the decision-making units with a higher efficiency value that reaches 1. In addition, Tobit regression can analyze the real effect of exogenous variables. Thus, the research method not only has high credibility and applicability but also conforms to the research design of this paper [22,23].
Based on the correct evaluation of high-quality innovation development level of different regions in mainland China, how to specify the role of governments is the next core issue; particularly, the role of provincial governments remains controversial [24]. Therefore, this paper will attempt to identify the role of government from the perspective of role theory.
The term “role” was originally used to describe actors as characters in drama. When extended to the field of management, it refers to the relationship between the action of actors and society [25,26,27]. In the view of role theory, each role in the society has its special existence value which is reflected by social function and obligation [28,29,30,31]. Role theory makes up for the shortcomings of traditional assumptions of economics and sociology, illustrating that actors do not play a single role, but exist as a set of roles [32]. The government is generally supposed to play a combined role [33,34] in national development. For mainland China, the significant economic and social differences caused by geographical divisions and natural endowments make it more urgent to clarify the role of provincial governments and their heterogeneity.
Based on the above analysis and existing research results, we found that the existing research mostly focuses on high-quality economic development [35,36], regardless of innovation development. Moreover, most previous studies prefer to assess the high-quality development status of a target year rather than carry out a dynamic time series assessment.
In order to address these research gaps, from the perspective of role theory, this research will take high-quality innovation development as the entry point, and use the two-stage method of super-efficiency DEA and Tobit regression to explore the multiple effects of government behavior from the overall and subdivided dimensions. Based on the above results, constructive recommendations have been put forward for mainland China to achieve an economic leap, high-quality innovation development, and regional coordinated growth at the government level.
The rest of this paper is arranged as follows: Section 2 describes the research method and presents data collection. Section 3 shows the main results and discussion. The conclusion and recommendations are offered in Section 4.

2. Methods and Materials

2.1. Model Description

2.1.1. Super-Efficiency Data Envelopment Analysis (DEA) Model

Data envelopment analysis (DEA) is a method to evaluate the relative effectiveness of innovation efficiency among various factors. The super-efficiency DEA was a non-parametric efficiency evaluation method proposed by Anderson et al. [37]. Compared with the traditional DEA model, super-efficiency DEA can evaluate multiple relatively effective decision-making units without affecting the evaluation results of invalid decision making units [38,39].
This paper assumes that there are n decision-making units (DMU), using A kinds of input to produce B kinds of output. For the decision-making unit j , we can use vectors X j ( X j   =   ( x j 1 ,   x j 2 ,   x j 3 ,   , x j A ) ) and Y j ( Y j   =   ( y j 1 ,   y j 2 ,   y j 3 ,   , y j B ) ) to represent it. In terms of evaluating the efficiency of the decision-making unit j 0 , the specific calculation formula of the super-efficiency DEA model can be constructed as follows [40,41,42]:
min θ ε ( i = 1 m S i   +   r = 1 s S r + )
s . t . { j = 1 j j 0 n X j λ j   +   S   =   θ X j 0 j = 1 j j 0 n Y j λ j S +   =   Y λ j     0   ( j   =   1 , 2 , , n ) S +     0 , S     0
If θ     1 , and S +   =   S   =   0 , then the DMU j 0 could be proved valid; if   θ     1 , and S i     0 or S r +     0 , then the DMU j 0 means weakly valid; if θ   <   1 , and S i     0 ,   S r +     0 , then the DMU j 0 is represented as DEA invalid. For the invalid evaluation unit, the super-efficiency DEA and the traditional DEA efficiency value evaluation results are the same. Nevertheless, for the evaluation unit whose efficiency value reaches 1, the relative efficiency value can be compared [43,44]. As shown in Figure 1, it is assumed that points A, B, C and D are all high decision units with an efficiency value of 1, and point E represents a lower production efficiency point. When calculating the efficiency value of the point B1, the point B is excluded, so that the two points A and C are used as the frontier surface, and the value of line segment BB1 indicates actual efficiency value of B1. Therefore, the super efficiency value of the point B is calculated by ( O B + B B 1 ) /OB, which is greater than 1 [45]. The point E, which will not affect the production frontier when excluded, is the lower efficiency point. That is, the super-efficiency DEA model has no effect on the low-efficiency evaluation subject results, while it can be used to compare the relative size of the high-efficiency evaluation subjects [46].
Total factor productivity (TFP) refers to the ratio of the total output of a system to the real input of all production factors, which measures the utilization of the whole input factor from the view of the output [47,48]. The endogenous growth theory holds that TFP is the power source of sustainable growth [49]. Meanwhile, most of the literature also carries out relevant analyses on the understanding of high-quality development from the perspective of TFP [50]. This is the same definition of the efficiency value calculated by the super-efficiency DEA, so TFP will be used hereinafter as the replacement of the super-efficiency DEA.

2.1.2. Tobit Regression Model

After calculating the TFP of high-quality innovation development in mainland China’s provinces and municipalities by the super-efficiency DEA method, it is necessary to analyze the influence of different government roles on high-quality innovation development of different areas. Considering that the values of TFP are all greater than 0, and the collected data is truncated, the ordinary least square method (OLS) cannot completely present the data, which leads to the estimation deviation. Thus, the Tobit regression model [51,52] is adopted to analyze the influencing factors. The Tobit model emphasizes that the maximum likelihood method is used to estimate model parameters when dependent variables are limited [53,54,55]. The specific calculation formula of the Tobit model can be constructed as follows:
Y i *   =   X i δ   +   ε i Y i   =   Y i *     i f       Y i *   >   0 Y i   =   0     i f       Y i   *     0
In the above formula, Y i * is the latent dependent variable, Y i is the observed dependent variable, X i is the independent vector, δ is the correlation coefficient vector, ε i is the interference term independent and ε i N   ( 0 ,     σ ) , thus, Y i * N   ( X i δ ,   σ )   [56].
The two-stage research method framework of this paper is shown in Figure 2. Firstly, to ensure the accuracy of the research conclusion, data acquisition and accessible evaluation indices need to be completed based on the pre-processing of the model. Secondly, after comprehensively evaluating the advantages and disadvantages of existing research methods, super-efficiency DEA method is used to calculate the rankings and average annual growth rate of the TFP of high-quality innovation development. Finally, with the obtained data value as the dependent variable, exogenous variables are introduced based on the government role theory to obtain the effect of different roles of the government on high-quality innovation development.

2.2. Variables Description

2.2.1. Variables in the Super-Efficiency DEA Model

In order to reflect efficiency changes of high-quality innovation development, based on previous studies and the principles of correlation, comparability and accessible, this paper not only considers ‘full-time equivalent of R and D personnel’ and ‘intramural expenditure on R and D’ as two basic variables from a macro perspective, but also selects ‘the number of research and development institutions’, ‘the number of R and D projects in colleges’, and ‘investment in high-tech industries’ to measure the input of high-quality innovation development from the perspective of micro-sectors of innovation. The selection of the three indicators comes from the standard division of the three main innovation sectors by the National Bureau of Statistics of China. Moreover, these have become the basic subjects of measuring innovation efficiency in academic circles.
Meanwhile, scholars have found patent quantity highly correlated with alternative measures of innovation performance [57]. Therefore, this paper selects ‘the number of domestic patent applications’ as an output indicator. Then, the value of TFP is obtained through the calculation of super-efficiency DEA [58]. In addition, according to the requirements of the data envelopment analysis (Cooper et al.) [59], the total number of input-output indicators cannot be more than half of the total number of decision variable units. Otherwise, the hierarchy based on the levels of efficiency of the units to be evaluated could be questionable due to the inadequate number of degrees of freedom of the model [60]. The specific indicators and interpretation are shown in Table 1.

2.2.2. Variables in the Tobit Regression Model

In the aspect of innovation, the roles of government show different types of interaction patterns from the views of the interactionist school’s role theory [67,68]. By continuously and repeatedly verifying the expectation of innovation development on the characteristics of roles, the role theory has been applied to identify the role of government in high-quality innovation development. For example, Zheng et al. [69] summarized the roles of the government as a policy entrepreneur, policy designer, fund supporter, network builder, service provider, and environmental regulator in scientific and technological innovation. Qin et al. [70] analyzed the orientations of government roles in industrial transformation, innovation, and upgrading, such as ones that are government-led, government-fostered, market-maintained, and market-enhanced. Based on the integration of existing research, the government forms an interactive and interdependent innovation development system with the relations among people, resources, and the environment, and derives three roles—‘talent support role’, ‘social resources coordination role’, and ‘innovation environment cultivation role’—from the perspective of the system. In addition, with the change of social structure network, the government role of innovation platform construction emerges at a historic moment. Therefore, this paper divides the core variables of the government’s roles into four categories, namely, the talent support role, social resources coordination role, innovation environment cultivation role, and innovation platform construction role. The specific measure indicators of the government’s roles are shown in Table 2.
Based on the variables’ description, the model is constructed as follows:
G R i t   =   c   +   β 1 T S R i t   +   β 2 I E C R i t   +   β 3 I P B R i t   +   β 4 S R C R i t   +   ε i t
In the above formula, i ,   t represent the corresponding values of different provinces and different periods and, respectively, ε is the random error term and obeys normal distribution.

2.3. Data Source

Since the relevant data of Tibet, Hong Kong, Macao, and Taiwan are not accessible, the remaining 30 provinces and municipalities in mainland China are selected as samples. In the Tobit regression analysis, the data of the annual increase of innovation policies are collected from various government portals. Finally, we obtained 2240 pieces of relevant innovation policies that are issued by different provinces and municipalities. In addition, other data were acquired from the China Statistical Yearbook of Science and Technology (2011–2018) [74] and China Statistical Yearbook (2011–2018) [75].

3. Results and Discussion

3.1. Super-Efficiency DEA Analysis of High-quality Innovation Development

3.1.1. Holistic Super-Efficiency DEA Analysis of High-Quality Innovation Development

EMS (Efficiency Measurement System) 1.3 (developed by Csaba M’ esz aros in BPMPD platform), a software that can accept non-arbitrary data to calculate the efficiency of data envelopment analysis [76,77], is used to calculate the TFP of high-quality innovation development in mainland China’s 30 provinces and municipalities from 2010 to 2017. The macro results are shown in Table 3.
From the holistic perspective, we can observe the following phenomena: firstly, as for the trend of the mean value of TFP of high-quality innovation development, it shows a fluctuating growth trend. However, the mean value of 30 provinces and municipalities from 2010 to 2017 is relatively low and only 0.600, which is similar to the research conclusion of Bai et al. [78]. According to the results, the implementation of innovation-driven development strategy has achieved progress, not only promoting the research and development investment, invention, and patent applications, but also improving the overall innovation and development level. Although the innovation capacity has been greatly improved, mainland China still faces multiple difficulties, such as inferior innovation quality, inefficiency of scientific and technological achievements transformation, and an unfriendly innovation environment [79,80,81]. Meanwhile, we also note that TFP value shows some volatility, which reflects the synergy relationship between innovation and economic development. During 2011, the first year of the 12th five-year plan period, mainland China was faced with the arduous task of putting the economy back on the normal track of growth to support innovation quality. However, with great endeavors, the sustained growth trend after 2013 indicates that mainland China’s economy and the high-quality innovation development level will usher in a new leap forward.
Secondly, in the average ranking of TFP of high-quality innovation development in 30 provinces and municipalities, Zhejiang ranks the highest, while Inner Mongolia ranks the lowest. As an economically important province in the eastern region, Zhejiang focuses on novel technologies, fresh business models, and upgraded products, promoting reform in innovation quality, efficiency, and driving force through the digital economy. In the western province, Inner Mongolia has long been restricted by natural conditions. Its economic development mainly relies on four regional resources, namely sheep, gas, coal, and soil. These restrictions cause various problems, such as an imbalance of industry structure, inadequacy of independent innovation in core technologies, scarcity of innovative talent, and weak performance of innovation ability and vitality.
Finally, according to the average ranking of TFP of high-quality innovation development, using the “Ward method” for cluster analysis, 30 provinces and municipalities can be divided into three echelons. The first echelon includes Zhejiang, Beijing, Jiangsu, Guangdong (the average value of innovation high-quality TFP is above 0.9); the second echelon includes Chongqing, Sichuan, Guizhou, Shanghai, Anhui, Xinjiang, Fujian, Shandong, Jiangxi, Heilongjiang (the average value of innovation high-quality TFP is between 0.5 and 0.9); the third echelon includes the remaining 16 provinces and municipalities (the average value of innovation high-quality TFP is below 0.5). Zhejiang, Beijing, Jiangsu and Guangdong, which are in the first echelon, have laid an unparalleled foundation for high-quality innovation development by its geographical location and policy advantages.
As for the second echelon, there is a thought-provoking question that Shanghai, as a global financial center and transport hub, ranks behind Chongqing, Sichuan, and Guizhou. Guided by the Cheng Yu City Cluster Strategy, Chongqing and Sichuan, benefitting from the supply-side structural reform, fully fulfill their responsibilities as national central cities and innovative cities in the western region, taking the lead in promoting the normalization of inter-provincial high-quality innovation development. These measures have significantly facilitated innovation in the two provinces and municipalities. Guizhou, a major beneficiary of the national development strategies, namely “Great Poverty Alleviation Strategy, Big Data Strategy and Big Ecology Strategy”, has made tremendous progress in implementation of high-quality innovation development. Although Shanghai is a financial, information, and science and technology center, it has not formed a noticeable agglomeration of innovative industries. Compared with the provinces and municipalities in the first echelon, Huawei, Tencent, Alibaba, and other innovative-oriented enterprises are usually not headquartered in Shanghai, which results in a lack of momentum in Shanghai’s high-quality innovation development.
Regarding to the third echelon, it only comprises four provinces and municipalities in the eastern region, Tianjin, Hebei, Liaoning, and Hainan. Tianjin, and Hebei, as part of the “Capital Economic Circle” and greatly influenced by the tremendous radiating effect of Beijing, benefit from a win-win situation within the metropolitan area, while they also suffer an irreversible outflow of key innovative resources to Beijing. Although Liaoning remains to be the locomotive of the Northeast Old Industrial Base in mainland China, it is still crippled by the problems of system mechanism, such as lack of innovation consciousness, scarcity of innovation vitality, and inadequate marketization of innovation achievements. In terms of geographical location, Hainan is surrounded by the sea. Although Hainan is one of mainland China’s pilot free trade zones, given its negligible economic size and weak economy, it is faced with a challenging situation of how to achieve high-quality development in the future.
By observing the average annual growth rate changes of TFP of high-quality innovation development in 30 provinces and municipalities in Figure 3, we find the average annual growth rate of Beijing, Qinghai, Gansu, and Jiangxi provinces all exceed 20%. Beijing, as the scientific and technological innovation center, has long been a pioneer in implementing innovation-driven development strategy. This is why Beijing is second to none in terms of average annual growth rate nationwide. Located in mainland China’s inland areas, the three provinces of Qinghai, Gansu, and Jiangxi remain economically backward due to underdeveloped infrastructure, insufficient transportation, and resource constraints. Benefiting from the implementation of the “One Belt and One Road”, “the Yangtze River Economic Belt”, and the “National Deep Innovation Strategy”, the three provinces have formed an intensive innovation development pattern with their regional characteristics. As a result, the annual growth rate shows a rapid growth trend relative to other provinces and municipalities.
Additionally, except Beijing who enjoys the outstanding performance in TFP of high-quality innovation development, all the other three provinces in the first echelon show a low, or even negative, average annual growth rate. From the overall perspective, this meets the basic requirements of collaborative development of innovation, which is to promote high-quality innovation development of all provinces and municipalities in a comprehensive and balanced manner. From the provincial perspective, Guangdong’s innovation capacity is characterized by high openness, developed foreign trade economy, and an active market. In addition, under the strategy of the Guangdong–Hong Kong–Macao Greater Bay Area, Guangdong’s high-quality innovation development level ranks at the forefront. However, the higher starting point for it is bound to lead to a slower growth rate. Due to the geographical proximity, Jiangsu and Zhejiang can be easily trapped in the dilemma of compromising each other’s innovation competitiveness.

3.1.2. Regional Super-Efficiency DEA Analysis of High-Quality Innovation Development

According to the results of TFP of high-quality innovation development of three major regions in mainland China from 2010 to 2017 (see Appendix A), we can see that, from the regional perspective, the TFP of high-quality innovation development varies significantly in different regions, presenting a patchwork pattern of ‘the eastern region ranks highest, followed by the western region and the middle region that stays at the lowest’. There are two reasons for this: on the one hand, as the leading economic region in mainland China, the eastern region gathers abundant resources of talent, capital, and information. In addition, geographical advantage and diversified support policies act as a strong driving force for high-quality innovation development. On the other hand, compared with the traditional innovation in the middle region, the Great Western Development Strategy builds a solid foundation for innovation. Simultaneously, the “One Belt and One Road Strategy” brings new opportunities and impetus for innovation development in the western region from a more open and inclusive perspective.
Furthermore, according to Figure 4, the average of the three regions has shown a smooth upward trend over the years. It is worth noting that, starting from 2013, each region began to form a high-speed inflection point of growth. Considering the time lag effect between the input and output of innovation elements, the 18th Communist Party of China national congress held in 2012 fully recognized that extensive development was no longer suitable for mainland China’s needs. Mainland China needs to accelerate the transformation of the growth model, in order to effectively improve the quality and efficiency of economic development, and to fully implement the strategy of innovation-driven development. Meanwhile, a series of policy documents have been issued to support innovation and high-quality development, such as “Opinions on Deepening the Reform of the Science and Technology System and the Construction of the National Innovation System”, “Some Suggestions on Deepening Institutional and Institutional Reform and Accelerating driven Development Strategy”, which laid a solid foundation for the sustainable development of high-quality innovation development in the three regions.

3.2. Tobit Regression Analysis

3.2.1. The Tobit Regression Analysis in Mainland China

The impact of different government roles on high-quality innovation development with full sample is calculated by the software of Eviews 8.1, a special econometrics software developed by the company American QMS [82,83], which reveals the changing rules of economic phenomena by observing different objects, and can be used to calculate the Tobit regression model. The correlation between each factor and the level of high-quality innovation development can be judged by observing the p-value. When the p-value is greater than 0.1, it means that this indicator is not correlated with high-quality innovation and development. When the p-value is less than 0.1, it can be said that this factor is correlated with high-quality development. At the same time, when the p-value is smaller, the correlation between the indicator and the level of high-quality innovation development is stronger. Therefore, a p-value less than 0.01, 0.01 < p < 0.05, or 0.05 < p < 0.1, respectively, represents the degree of significance as great, good, and qualified. The results are shown in Table 4.
According to Table 4, the innovation platform construction role (IPCR), innovation environment cultivation role (IECR), and social resources coordination role (SRCR) are statistically significant at the 1%, 5%, and 10% levels, respectively, while the talent support role (TSR) shows non-significance at the three levels. The reasons for this situation are as follows:
First of all, Table 4 shows that innovation platform construction role (IPCR) can positively and significantly improve the level of high-quality innovation development. As the aggregation of innovation elements, such as talent, capital, information, and the demand relationship connector, an innovation platform is an important path for the government to guide the aggregation and optimization of elements, which promotes collaborative innovation, and strengthens support for innovative services. It is not only a realistic need to stimulate innovation vitality and improve innovation performance, but also an inherent requirement to enhance innovation capacity of high-quality development.
Secondly, the environment cultivation role (IECR) has a significant positive effect on high-quality innovation development. The high-quality innovation development does not solely rely on dominant factors such as geographical environment, resource endowment, and market basis. It also relies on implicit factors, such as innovation institution, policy, and atmosphere [84]. The government’s cultivation innovation environment role in creating a fair competition environment will contribute to the high-quality innovation development with a reasonable division of labor, optimized efficiency, and coordinated order.
Thirdly, the role of social resources coordination (SRCR), showing a negative sign, meaning the more the government gets involved in the social resources coordination, the lower the TFP of the high-quality innovation development score. The results mean the social resources coordination role (SRCR) has a significant negative effect on high-quality innovation development. It is different from Kogan’s conclusion that resource allocation has a positive impact on innovation growth based on Schumpeterian growth models with the example of American enterprise [85]. The difference lies in the fact that China, as a later-developed country, is a unique example that allocates resources in a “differential order pattern”, which means extensive investment can hardly promote high-quality innovation development, and wasted resources can hinder it. On the one hand, due to the existing institutional barriers and the lack of regulatory mechanisms, the innovation resources provided by the government cannot be effectively integrated into the innovation achievement’s transformation efficiency function. On the other hand, the excessive input of key innovation resources tends to occur without regard to resource scarcity, forming an “innovation illusion” of “focus on quantity over quality”, which goes against the basic connotation of high-quality innovation development. This conclusion, which contradicts previous cognition, suggests that, in mainland China, the role of the government is not always showing a positive influence on high-quality innovation development, and sometimes even produces an unexpected adverse reaction. This urgently requires mainland China’s government to accurately grasp the scope and intensity of each role, thus highlighting the value of study from the perspective of the role of government.
Finally, the talent support role has not passed the significance test. This result is in line with reality. Compared with the other three types of roles, the effectiveness of talent support role is more micro, which needs to take the role-playing effect of government as the basic premise in promoting high-quality innovation development at the macro level. At the present stage, the level of high-quality innovation development in mainland China has not reached the threshold for the government to play its role in supporting talent.

3.2.2. The Tobit Regression Analysis of Western, Middle, and Eastern Regions

In view of the different innovation development levels in eastern, middle, and western regions, this paper makes a comparative analysis on the impact of government roles on high-quality innovation development among different regions. The results are shown in Table 5.
As shown in Table 5, for the eastern region, the innovation platform construction role (IPCR) has a significant positive effect on high-quality innovation development; for the middle region, the innovation environment cultivation role (IECR) and social resources coordination role (SRCR) have significant positives effect; for the western region, the social resources coordination role (SRCR) has a significant positive effect. Furthermore, the inspirations are listed as follows:
Above all, the innovation platform construction role (IPCR) has the highest threshold for the implementation region. The eastern region, as the leading region in the wave of reform and opening up, has a robust foundation for high-quality innovation development. However, to exert the influence of innovation worldwide, the government is required to undertake the responsibility of the innovation platform constructor, including building a collaborative innovation community, promoting the open sharing of resources, and facilitating the efficient and high-quality transformation of innovation. Compared with the eastern region, the high-quality innovation development degree in the middle and western regions are relatively low. The main demand for the role of government is to provide guidance policies and key resources, which means an appeal to the high-level role of government, like building an innovation platform system, has not yet been obvious.
Next, the role of innovation environment cultivation (IECR) is only significant in the middle region. Different from the increasingly mature “mass innovation” atmosphere in the eastern region and the precise innovation support policies in the western region, the middle region is still in a stage of rapid development under the influence of the strong government, indicating that the middle region needs more policy support. In addition, owing to the strategy of “The Rise of Central China” having not achieved its expected effect, the middle region will be affected by the government’s policy promotion in the high-quality and innovative development for a long time.
Finally, the role of social resources coordination (SRCR) creates regional alienation for high-quality innovation development. Except for the eastern region, it has a positive effect on the middle and western regions. This conclusion indicates that regions with a low level of innovation development still need government support, and only by increasing the input of general public budget expenditure (science and technology expenditure) at a geometric level excellence high-quality innovation efficiency can be produced. Increasing the input scale of key innovation resources, optimizing the input mode and expanding the input object are not only to lay an important foundation for high-quality innovation development in the middle and western regions, but also to provide a strong guarantee for stimulating innovation vitality. This regional alienation highlights the timeliness and period of the role of the government. Therefore, for emerging economies represented by mainland China, it is necessary for the government to play different roles for innovation promotion at the initial stage and to weaken its role in a timely manner at the mature stage.

4. Conclusions and Recommendations

In this paper, the super-efficiency DEA model is used to measure the high-quality innovation development of 30 provinces and municipalities in mainland China from 2010 to 2017. Based on role theory, the Tobit regression method is used to analyze the influence of four different government roles in supporting talent, constructing innovation platform, cultivating innovation environment, and coordinating social resources on high-quality development innovation. The following conclusions are drawn:
(1)
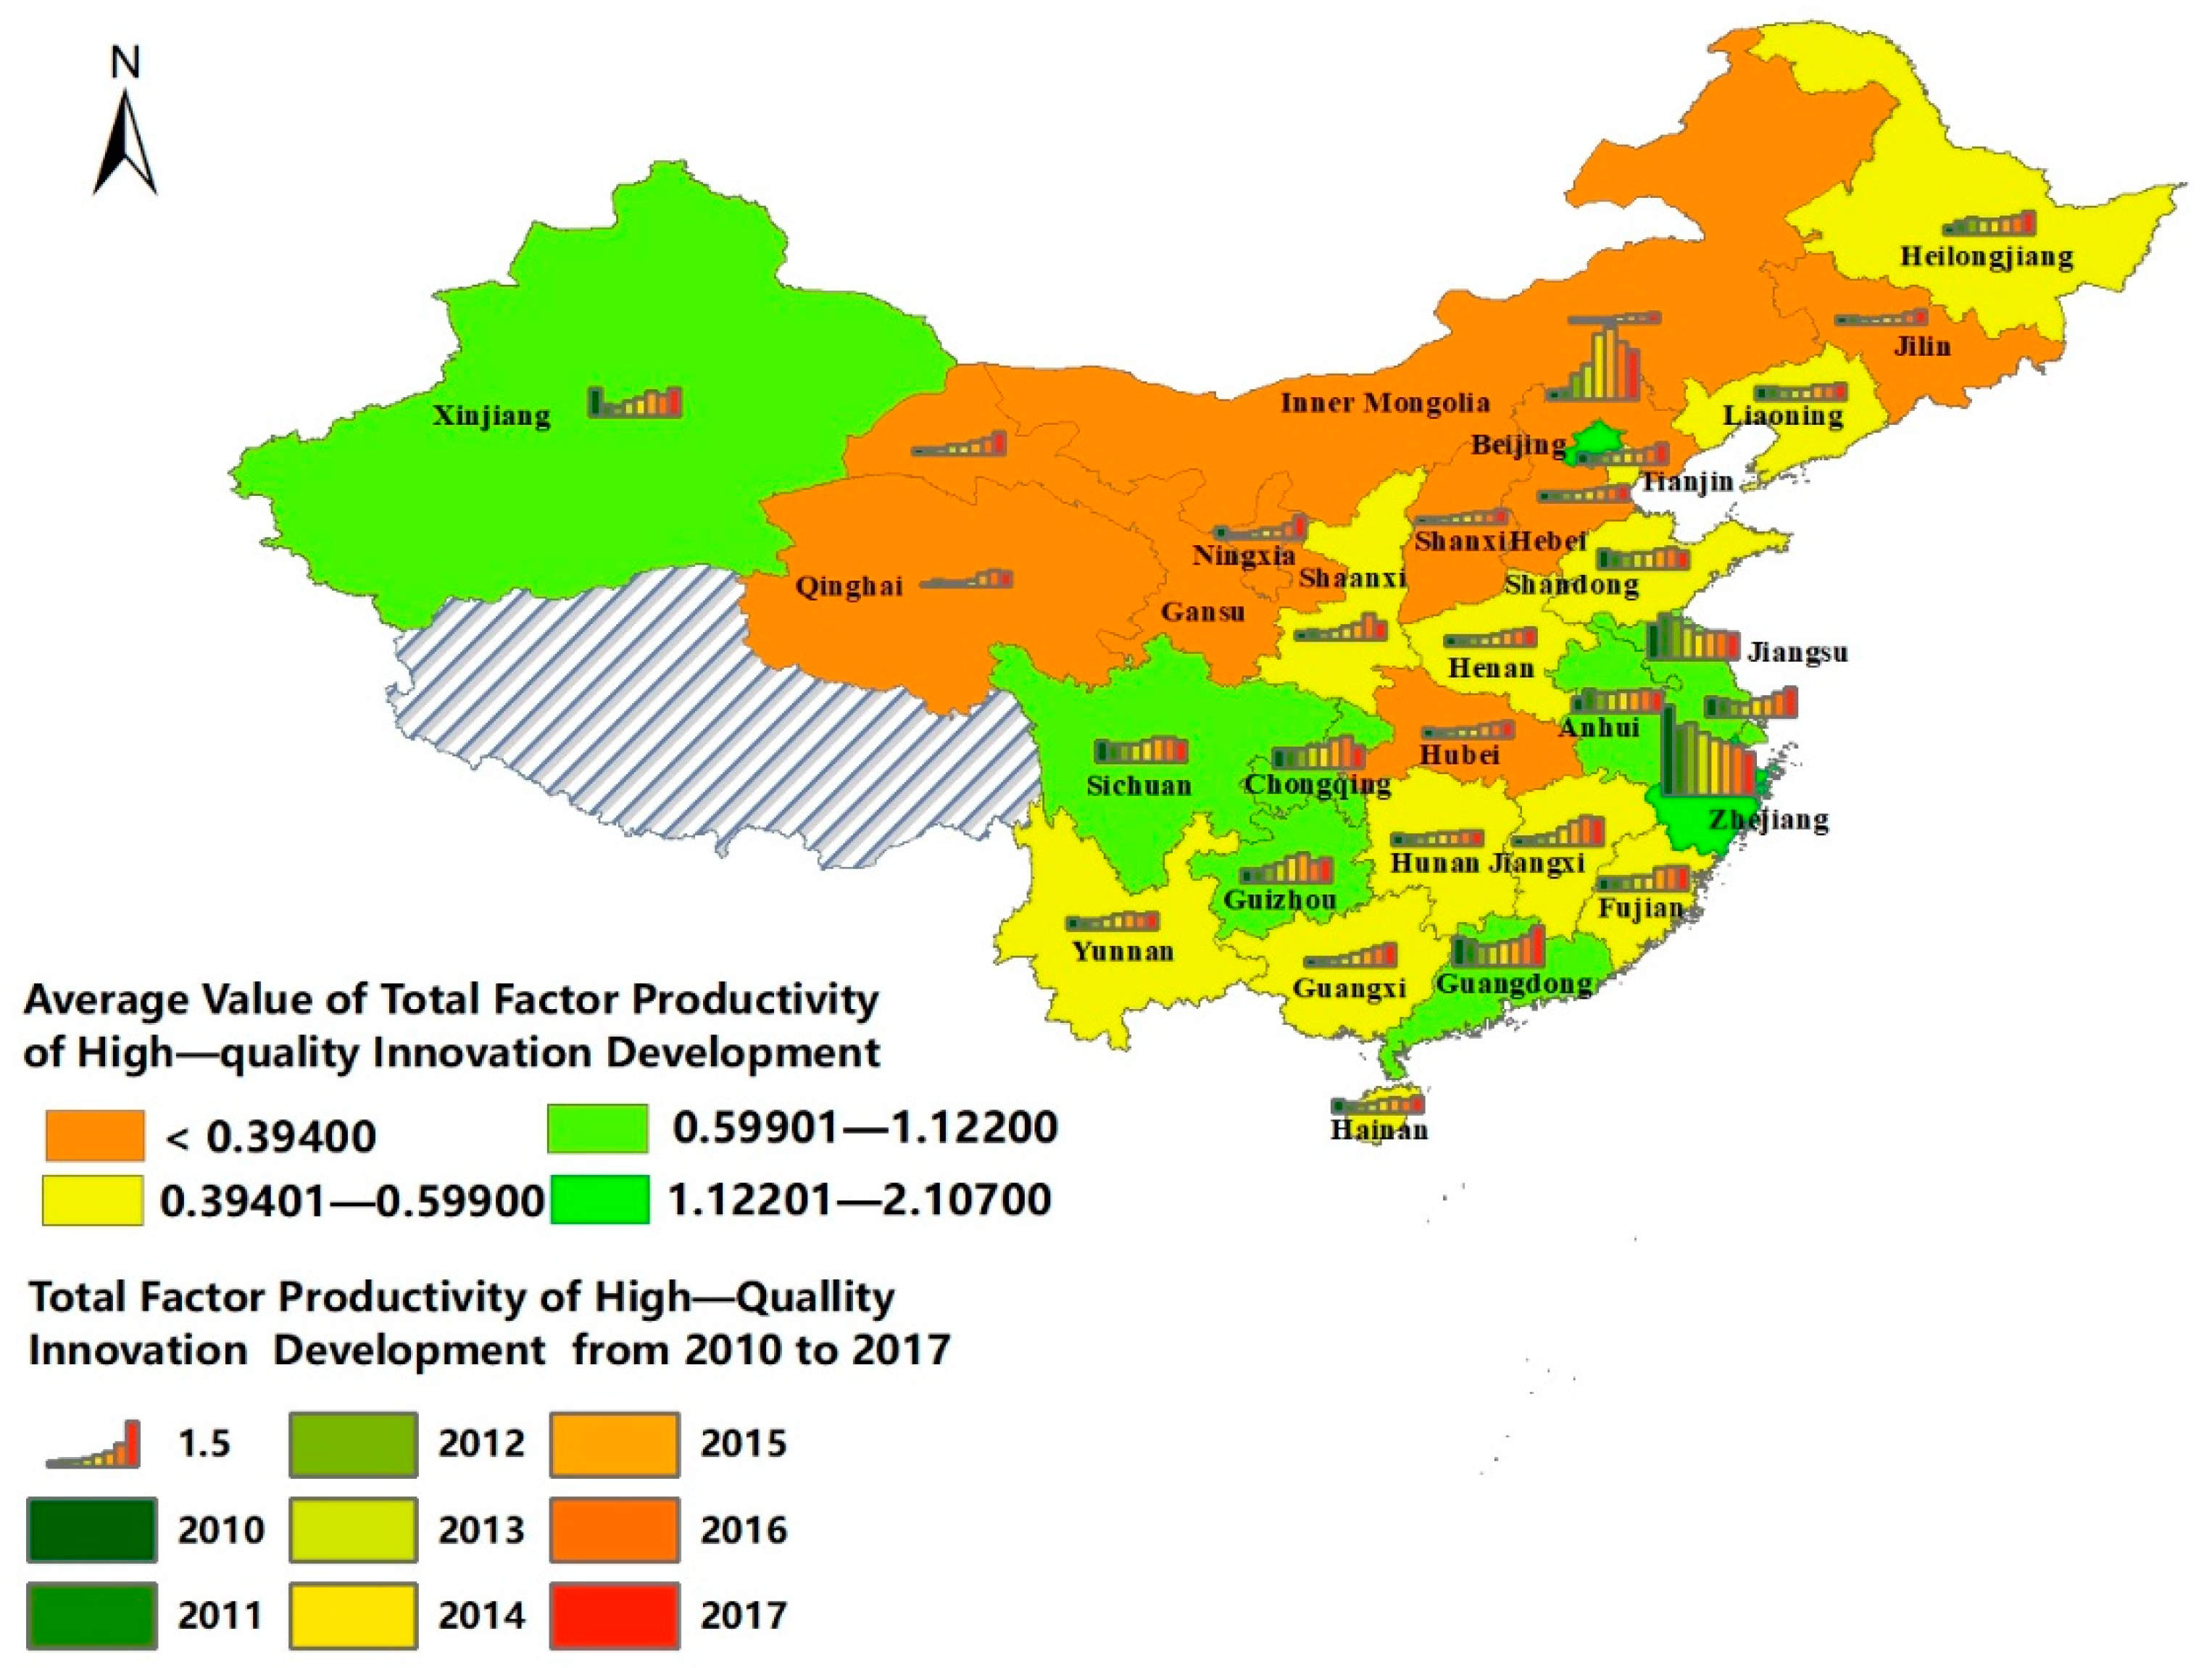
From the holistic perspective, according to the calculation of super-efficiency DEA model, the average of TFP of high-quality innovation development of 30 provinces and municipalities from 2010 to 2017 in mainland China is 0.600. Although the overall trend shows a fluctuating growth trend, the degree of high-quality innovation development still needs improvement. Among them, Zhejiang ranks the highest while Inner Mongolia the lowest. Using the Ward method for cluster analysis, 30 provinces and municipalities can be divided into three echelons. Except Beijing, which enjoys the outstanding performance in TFP of high-quality innovation development, all the other three provinces in the first echelon show a low, or even negative, average annual growth rate.
(2)
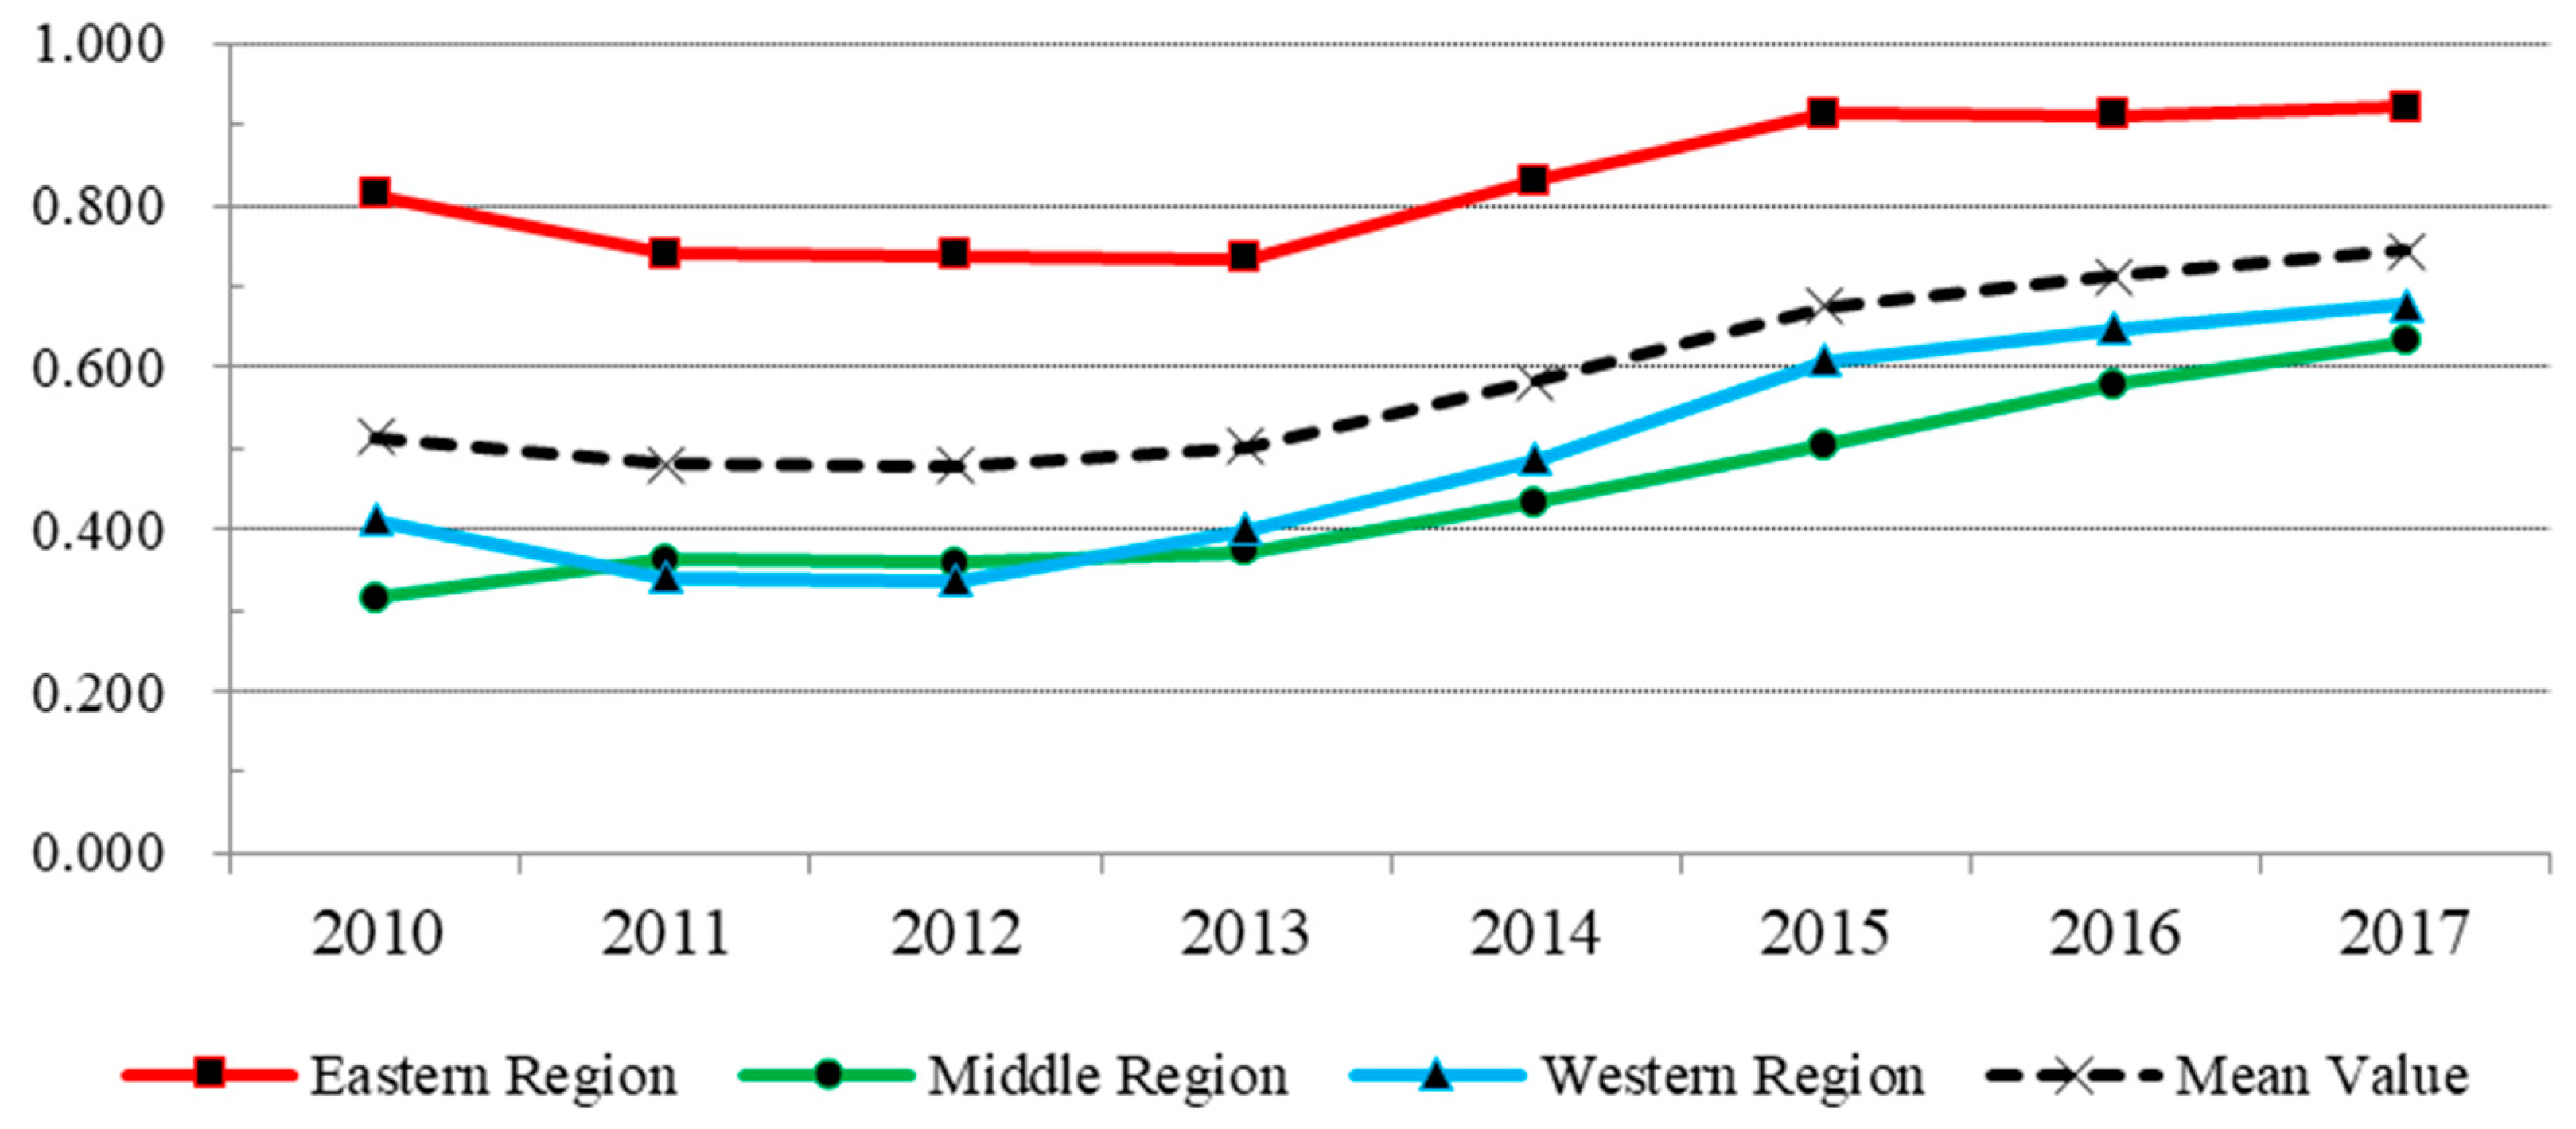
From the regional perspective, there is a patchwork pattern of “the eastern region ranks the highest, followed by the western region and the middle region that stays at the lowest”. In addition, the average of TFP of high-quality innovation development of the three regions has shown a smooth growth trend over the years. Starting from 2013, each region has begun to form a high-speed inflection point of growth.
(3)
The Tobit regression analysis of government roles on high-quality innovation development is carried out under the full sample data. Apart from the role in supporting talent, roles in constructing innovation platforms, cultivating an innovation environment, and coordinating social resources have all passed the significance test.
(4)
The Tobit regression analysis of government roles on high-quality innovation development is carried out under the partition data. The demands of different government roles vary significantly in different regions from the regional perspective. For the eastern region, the role in constructing an innovation platform has a significant positive effect on high-quality innovation development; for middle region, the roles in cultivating an innovation environment and coordinating social resources have the significant positive effect on it; for the western region, the role in coordinating social resources has a significant positive effect on it.
(5)
In general, first, in mainland China, the role of government is not always a positive influence on high-quality innovation development, and sometimes even produces an unexpected adverse reaction. Second, local government’s involvement in high-quality innovation development should be adjustable in different development stages, which means government is suggested to take the leading role in the early stage and play a supporting role in later stages.
Therefore, based on the above conclusions for the betterment of high-quality innovation development, we put forward the following suggestions and countermeasures that policy-makers may regard as constructive:
(1)
To realize high-quality development innovation, government needs to shift its focus from quantity to quality [86], optimize the infrastructure of the innovation system, improve the innovation input and output, and realize the scale advantage of innovation development. Meanwhile, the government should attach greater importance to disruptive innovation and original innovation by maximizing the integration of innovation, economic, and social development, to reach a higher level of innovation practice.
(2)
Under the principle of growth pole theory, provinces and municipalities need to strengthen cooperation to create a win-win situation. Different regions need to choose appropriate development strategies according to their own development orientation and resource endowment, and adjust the industrial layout in the light of different geographical advantages, in order to realize the innovative and coordinated development of the eastern, western, and central regions through strengthening cooperation.
(3)
The local government needs to formulate appropriate strategies of their governance role according to regional differences. For the eastern region, the government needs to set up a sound and promising innovation ecosystem for a better environment of employment and innovation. For the middle region, the government needs to take the national development strategy as the basis of innovation policies. For the middle and western regions, guided by a development direction of coordination and balance, the government needs to promote key innovation resources to the two regions.
Constrained by research methods, this study still has the following limitations: first of all, when measuring the high-quality innovation development of 30 provinces and municipalities in mainland China from 2010 to 2017, the time lag effect and delayed utility between innovation input and output have been neglected to some extent. Innovation input does not turn into innovation output in an instant. The digestion and absorption of innovation input often takes time to produce effective innovation outputs, which means future verification is indispensable. High-quality development innovation involves not only the government, but also universities and enterprises whose role in constructing innovative economy, culture, and climate is not discussed in this paper, but will be in the future. Finally, this paper studies the influence of a single government role on high-quality innovation development, but, in practice, the government often plays multiple roles in the same situation. Considering the degree of interaction between different government roles, it is a future research direction to explore the effect of interaction on high-quality innovation development.

Author Contributions

Conceptualization, X.Y. and Z.Z.; Methodology, Z.Z.; Software, Z.Z.; Validation, Z.T.; Formal Analysis, X.Y., W.L., and Z.Z.; Data collection, X.Y.; Writing-original Draft Preparation, X.Y. and X.Z.; Writing-Review & Editing, Z.T. and Z.W.; Visualization, W.L. and X.G.; Supervision, X.Z.

Funding

This work was jointly funded by the National Social Science Foundation of China (No. 16BGL013), Henan Soft Science Project (No. 192400410051), Humanities and Social Science Research Project of Henan Education Department (No. 2019-ZZJH-029), and the Henan Federation of Social Science Project (No.SKL-2019-2828). Meanwhile, this work was funded by the Fundamental Research Funds for the Central Universities (No. KYCX17_0515), and the Hubei Province Intellectual Achievement Procurement Project (No. HBZW-2019-07).

Acknowledgments

The authors sincerely thank the anonymous referees for their meaningful suggestions on a previous draft. The authors would like to acknowledge the funds for their support.

Conflicts of Interest

The authors declare no conflict of interest.

Appendix A

Table A1. The innovation high-quality TFP of three major regions in mainland China (2010–2017).
Regions20102011201220132014201520162017Mean ValueRankingAverage Annual Growth RateRanking
Eastern0.8140.7400.7390.7340.8300.9140.9110.9220.82611.796%3
Middle0.3150.3630.3580.3720.4330.5040.5780.6320.444310.459%1
Western0.4120.3410.3370.3990.4870.6090.6480.6770.48927.353%2
Mean Value0.5140.4810.4780.5020.5830.6760.7120.7440.586 6.536%
Notes: The eastern region includes: Beijing, Tianjin, Hebei, Liaoning, Shanghai, Jiangsu, Zhejiang, Fujian, Shandong, Guangdong, Hainan provinces and municipalities. The middle region including: Shanxi, Jilin, Heilongjiang, Anhui, Jiangxi, Henan, Hubei, Hunan provinces and municipalities. The western region includes: Inner Mongolia, Guangxi, Chongqing, Sichuan, Guizhou, Yunnan, Shaanxi, Gansu, Qinghai, Ningxia, Xinjiang provinces and municipalities.

References

  1. Fan, Z.Q. Development Trend of Global Technology Innovation and China’s Innovation Driven Strategic Choice. Acad. J. Zhongzhou 2018, 262, 50–56. [Google Scholar]
  2. Sebastian, M.P.; Joakim, J.; Erik, A. Challenging the “deficit model” of innovation: Framing policy issues under the innovation imperative. Res. Policy 2019, 48, 895–904. [Google Scholar] [CrossRef]
  3. Gao, X.; Shen, J.; He, W.; Sun, F.; Zhang, Z.; Zhang, X.; Yuan, L.; An, M. Multilevel Governments’ Decision-Making Process and Its Influencing Factors in Watershed Ecological Compensation. Sustainability 2019, 11, 1990. [Google Scholar] [CrossRef]
  4. Zhang, J.K.; Hou, Y.Z.; Liu, P.L.; He, J.W. High-quality Development Goals and Strategic Path. Manag. World 2019, 35, 1–7. [Google Scholar] [CrossRef]
  5. Guo, Z.M.; Zhang, X.L. The Connotation and Key Tasks of the High-quality Open Economic Development. Reform 2019, 299, 43–53. [Google Scholar]
  6. Wang, Y.C.; Yin, H.Y. The Basic Connotation and trend of the High-quality of Economic Development. Zhejiang Acad. J. 2019, 234, 91–95. [Google Scholar] [CrossRef]
  7. Held, B.; Rodenhäuser, D.; Diefenbacher, H.; Zieschank, R. The National and Regional Welfare Index (NWI/RWI): Redefining Progress in Germany. Ecol. Econ. 2018, 145, 391–400. [Google Scholar] [CrossRef]
  8. Atkinson, R.D.; Wu, J.J. The 2017 State New Economy Index: Benchmarking Economic Transformation in the States. Ssrn Electron. J. 2017. [Google Scholar] [CrossRef] [Green Version]
  9. Li, T.X.; Li, Y.; An, D.F. Mining of the Association Rules between Industrialization Level and Air Quality to Inform High-quality Development in China. J. Environ. Manag. 2019, 246, 564–574. [Google Scholar] [CrossRef]
  10. Zhong, J.Y.; Zhu, A.H. The Formation Mechanism of the Bay Area Economy and the Chinese mode of the Economic Development of Guangdong, Hongkong, and Macao Bay area. In Proceedings of the 3rd International Conference on Judicial, Administrative and Humanitarian Problems of State Structures and Economic Subjects (JAHP), Domodedovo, Russia, 1–4 April 2018. [Google Scholar]
  11. Wang, Y.B.; Lu, Y.; Wang, W.H. New Research Progress on the Coordinated Coupling of High-quality Economic Development and Ecological Environmental Protection. J. Beijing Univ. Technol. (Soc. Sci. Ed.) 2019, 19, 85–94. [Google Scholar] [CrossRef]
  12. Saaty, T.L.; Tran, L.T. On the invalidity of fuzzifying numerical judgments in the Analytic Hierarchy Process. Math. Comput. Model. 2006, 46, 962–975. [Google Scholar] [CrossRef]
  13. Mannan, B.; Haleem, A. Understanding major dimensions and determinants that help in diffusion & adoption of product innovation: Using AHP approach. J. Glob. Entrep. Res. 2017, 7, 12. [Google Scholar] [CrossRef]
  14. Li, M.X.; Ren, B.P. Comprehensive Evaluation and Path Choice of China’s High-Quality Development in the New Era. Financ. Econ. 2018, 374, 26–40. [Google Scholar]
  15. Cai, Y.S.; Lv, J.W. Evaluation of Regional Development Quality in Beijing-Tianjin-Hebei Region Based on Entropy Method. J. Ind. Technol. Econ. 2018, 301, 67–74. [Google Scholar] [CrossRef]
  16. Wei, M.; Li, S.H. Research on Measuring the High-quality Development Level of Chinese Economy in the New Era. J. Quant. Tech. Econ. 2018, 35, 4–21. [Google Scholar] [CrossRef]
  17. Sun, J.; Du, T.; Sun, W.; Na, H.; He, J.; Qiu, Z.; Yuan, Y.; Li, Y. An evaluation of greenhouse gas emission efficiency in China’s industry based on SFA. Sci. Total Environ. 2019, 690, 1190–1202. [Google Scholar] [CrossRef]
  18. Wang, H.; Ang, B.W.; Wang, Q.W.; Zhou, P. Measuring energy performance with sectoral heterogeneity: A non-parametric frontier approach. Energy Econ. 2017, 62, 70–78. [Google Scholar] [CrossRef]
  19. Narbon-Perpina, I.; De Witte, K. Local governments’ efficiency: A systematic literature reviewpart I. Int. Trans. Oper. Res. 2018, 25, 431–468. [Google Scholar] [CrossRef]
  20. Yu, M.M.; Hsiao, B. Single-phase slack-based centralized DEA for resource reallocation. Int. Trans. Oper. Res. 2018, 25, 737–751. [Google Scholar] [CrossRef]
  21. Hsiao, B.; Shu, L.; Chou, F.Y. Assessing the efficiency of the accounting industry using multiactivity network DEA: Evidence from Taiwan. Int. Trans. Oper. Res. 2019, 26, 2362–2386. [Google Scholar] [CrossRef]
  22. Wu, Y.; Ke, Y.; Zhang, T.; Liu, F.; Wang, J. Performance efficiency assessment of photovoltaic poverty alleviation projects in China: A three-phase data envelopment analysis mode. Energy 2018, 159, 599–610. [Google Scholar] [CrossRef]
  23. Dai, Z.; Guo, L.; Jiang, Z. Study on the industrial eco-efficiency in east China based on the super efficiency DEA model: An example of the 2003–2013 panel data. Appl. Econ. 2016, 48, 5779–5785. [Google Scholar] [CrossRef]
  24. Ren., B.P.; Wen, F.A. The Criteria, Determinants and Ways to Achieve High-Quality Development in China in the New Era. Reform 2018, 37, 5–16. [Google Scholar]
  25. Biddle, B.J. Recent developments in role theory. Annu. Rev. Sociol 1986, 12, 67–92. [Google Scholar] [CrossRef]
  26. Eagly, A.H.; Wood, W. Social role theory. Handb. Theor. Soc. Psychol. 2012, 2, 458–476. [Google Scholar] [CrossRef]
  27. Anglin, A.H.; Wolfe, M.T.; Short, J.C.; McKenny, A.F.; Pidduck, R.J. Narcissistic Rhetoric and Crowdfunding Performance: A Social Role Theory Perspective. J. Bus. Ventur. 2018, 33, 780–812. [Google Scholar] [CrossRef]
  28. Solomon, M.R.; Surprenant, C.; Czepiel, J.A.; Gutman, E.G. A Role Theory Perspective on Dyadic Interactions: The Service Encounter. J. Mark. 1985, 49, 99–111. [Google Scholar] [CrossRef]
  29. Stryker, S.; Burke, P.J. The Past, Present, and Future of an Identity Theory. Soc. Psychol. Q. 2000, 63, 284–297. [Google Scholar] [CrossRef]
  30. Sluss, D.M.; Dick, R.V.; Thompson, B.S. Role Theory in Organizations: A Relational Perspective; APA Handbook of Industrial and Organizational Psychology: Washington, DC, USA, 2010; pp. 505–534. [Google Scholar]
  31. Hoyt, C.L.; Price, T.L.; Poatsy, L. The Social Role Theory of Unethical Leadership. Leadersh. Q. 2013, 24, 712–723. [Google Scholar] [CrossRef]
  32. Wathne, H.K.H. Friends, Businesspeople, and Relationship Roles: A Conceptual Framework and a Research Agenda. J. Mark. 2006, 70, 90–103. [Google Scholar] [CrossRef]
  33. Oi, J.C. The Role of the Local State in China’s Transitional Economy. China Q. 1995, 144, 1132–1149. [Google Scholar] [CrossRef]
  34. Armanios, D.E.; Eesley, C.E.; Jizhen, L.; Eisenhardt, K.M. How Entrepreneurs Leverage Institutional Intermediaries in Emerging Economies to Acquire Public Resources. Strateg. Manag. J. 2016, 38, 1373–1390. [Google Scholar] [CrossRef]
  35. Ma, R.; Luo, H.; Wang, H.W.; Wang, T.C. Study of Evaluating High-quality Economic Development in Chinese Regions. China Soft Sci. 2019, 343, 60–67. [Google Scholar]
  36. Guo, H.B.; Deng, Z.T. Research on the Integrative High-quality Development of Yangtze River Delta Regional Economy Under the New Normal. Econ. Manag. 2019, 33, 22–30. [Google Scholar]
  37. Andersen, P.; Petersen, N.C. A Procedure for Ranking Efficient Units in Data Envelopment Analysis. Manag. Sci. 1993, 39, 1261–1264. [Google Scholar] [CrossRef]
  38. Charnes, A.; Cooper, W.W.; Rhodes, E. Measuring the Efficiency of Decision Making Units. Eur. J. Oper. Res. 1978, 2, 429–444. [Google Scholar] [CrossRef]
  39. Avkiran, N.K. Association of DEA Super-efficiency Estimates with Financial Ratios: Investigating the Case for Chinese Banks. Omega 2011, 39, 323–334. [Google Scholar] [CrossRef]
  40. Poveda, A.C. Economic Development and Growth in Colombia: An Empirical Analysis with Super-efficiency DEA and Panel Data Models. Socio-Econ. Plan. Sci. 2011, 45, 154–164. [Google Scholar] [CrossRef]
  41. Fan, J.L.; Zhang, X.; Zhang, J.; Peng, S. Efficiency Evaluation of CO2 Utilization Technologies in China: A Super-efficiency DEA Analysis based on Expert Survey. J. CO2 Util. 2015, 11, 54–62. [Google Scholar] [CrossRef]
  42. Kong, Y.; He, W.J. Analysis of Carbon Emission Efficiency Evaluation and Its Influencing Factors in the Nine Western Provinces. Environ. Eng. Res. 2019, in press. [Google Scholar]
  43. Cooper, W.W.; Seiford, L.M.; Zhu, J. Data Envelopment Analysis. Handb. Data Envel. Anal. 2004, 1–39. [Google Scholar] [CrossRef]
  44. Deng, G.Y.; Li, L.; Song, Y. Provincial Water Use Efficiency Measurement and Factor Analysis in China: Based on SBM-DEA Model. Ecol. Indic. 2016, 69, 12–18. [Google Scholar] [CrossRef]
  45. Veettil, P.C.; Speelman, S.; Huylenbroeck, G.V. Estimating the Impact of Water Pricing on Water Use Efficiency in Semi-arid Cropping System: An Application of Probabilistically Constrained Nonparametric Efficiency Analysis. Water Resour. Manag. 2013, 27, 55–73. [Google Scholar] [CrossRef]
  46. Mohamad, N.H.; Said, F. Using Super-efficient DEA Model to Evaluate the Business Performance in Malaysia. World Appl. Sci. J. 2012, 17, 1167–1177. [Google Scholar] [CrossRef]
  47. Rosegrant, M.W.; Evenson, R.E. Total Factor Productivity and Sources of Long-Term Growth in Indian Agriculture; International Food Policy Research Institute (IFPRI): Washington, DC, USA, 1995. [Google Scholar]
  48. Ma, X.; Liu, Y.; Wei, X.; Li, Y.; Zheng, M.; Li, Y.; Cheng, C.; Wu, Y.; Liu, Z.; Yu, Y. Measurement and decomposition of energy efficiency of Northeast China-based on super efficiency DEA model and Malmquist index. Environ. Sci. Pollut. Res. 2017, 24, 19859–19873. [Google Scholar] [CrossRef]
  49. Young, A. The Tyranny of Numbers: Confronting the Statistical Realities of the East Asian Growth Experience. Q. J. Econ. 1995, 110, 641–680. [Google Scholar] [CrossRef] [Green Version]
  50. Yu, Y.Z.; Yang, X.Z.; Zhang, S.H. Research on the Characteristics of Time and Space Conversion of China’s Economy from High-speed Growth to High-quality Development. J. Quant. Tech. Econ. 2019, 36, 3–21. [Google Scholar] [CrossRef]
  51. Tobin, J. Estimation of Relationships for Limited Dependent Variables. Econometrica 1958, 26, 24–36. [Google Scholar] [CrossRef]
  52. Ameniya, T. Regression Analysis when the Dependent Variable is Truncated Normal. Econometrica 1973, 41, 997–1016. [Google Scholar] [CrossRef]
  53. Liu, J.; Zhang, J.F.; Fu, Z.B. Tourism eco-efficiency of Chinese coastal cities-Analysis based on the DEA-Tobit Model. Ocean Coast. Manag. 2017, 148, 164–170. [Google Scholar] [CrossRef]
  54. Yang, C.; Lee, L.F.; Qu, X. Tobit Models with Social Interactions: Complete vs Incomplete Information. Reg. Sci. Urban Econ. 2018, 73, 30–50. [Google Scholar] [CrossRef]
  55. Sağlam, Ü. A Two-stage Performance Assessment of Utility-scale Wind Farms in Texas using Data Envelopment Analysis and Tobit Models. J. Clean. Prod. 2018, 201, 580–598. [Google Scholar] [CrossRef]
  56. Kirjavainen, T.; Loikkanen, H. Efficiency Differences of Finnish Senior Secondary Schools: An Application of DEA and Tobit Analysis. Econ. Educ. Rev. 1998, 17, 377–394. [Google Scholar] [CrossRef]
  57. Sun, S.L.; Lee, R.P. Enhancing Innovation Through International Joint Venture Portfolios: From the Emerging Firm Perspective. J. Int. Mark. 2013, 21, 1–21. [Google Scholar] [CrossRef]
  58. He, D.; Ren, W.L. Research on the Influence of Industrial Policy on the High-quality Development of China’s Cultural Industry. Jiangsu Soc. Sci. 2019, 302, 19–27. [Google Scholar] [CrossRef]
  59. Cooper, W.W.; Seiford, L.M.; Tone, K. Data Envelopment Analysis. A Comprehensive Text with Models, Applications, References and Dea-Solver Software; Kluwer Academic Publishers: Dordrecht, The Netherland, 1999; ISBN 0-7923-8693-0. [Google Scholar]
  60. Fuentes, R.; Lillo-Bañuls, A. Smoothed bootstrap Malmquist index based on DEA model to compute productivity of tax office. Expert Syst. Appl. 2015, 42, 2442–2450. [Google Scholar] [CrossRef]
  61. Song, C.; Oh, W. Determinants of innovation in energy intensive industry and implications for energy policy. Energy Policy 2015, 81, 122–130. [Google Scholar] [CrossRef]
  62. Chen, J.; Cheng, J.; Dai, S. Regional eco-innovation in China: An analysis of eco-innovation levels and influencing factors. J. Clean. Prod. 2017, 153, 1–14. [Google Scholar] [CrossRef]
  63. Zhang, Z.S.; Zhao, L.X.; Wang, D. Study on Competitiveness and Its Acting Factors of Provincial Science, Technology and Innovation Evaluation Based on Direct Evaluation Approach, Science and Technology. Manag. Res. 2016, 36, 76–82. [Google Scholar] [CrossRef]
  64. Wang, F.; Zhou, L.; Bai, Y.P.; Che, L.; Ma, X.E. Influencing Factors and Spatio-temporal Pattern of Scientific and Technological Innovation of Universities in China. Resour. Dev. Mark. 2018, 34, 155–159. [Google Scholar] [CrossRef]
  65. Zhu, Y.; Deng, X.Q.; Lei, J.Q. The Coupling Evaluation of R&D and Manufacturing of High-Tech Industry on China’s Provincial Level. Sci. Technol. Prog. Policy 2019, 36, 58–67. [Google Scholar] [CrossRef]
  66. Zhou, K.Z.; Gao, G.Y.; Zhao, H. State ownership and firm innovation in china: An integrated view of institutional and efficiency logics. Adm. Sci. Q. 2016, 62, 375–404. [Google Scholar] [CrossRef]
  67. Anadón, L.D. Missions-oriented R&D Institutions in Energy between 2000 and 2010: A Comparative Analysis of China, the United Kingdom, and the United States. Res. Policy 2012, 41, 1742–1756. [Google Scholar] [CrossRef]
  68. Gabriel, C.; Goldstein, A.P.; Amitai, B.N.; Laura, D.A.; Venkatesh, N. Six Principles for Energy Innovation. Nature 2017, 552, 25–27. [Google Scholar] [CrossRef]
  69. Zheng, Y.; Yang, R.Y.; Liu, Y. The Research Advance and Theoretical Framework Construction of Government Role in S&T Innovation: Based on the Perspective of Bibliometric Analysis and Grounded Theory. Sci. Sci. Manag. S T 2017, 38, 46–61. [Google Scholar]
  70. Qin, L.; Zhang, W.G. Government’s Role in China’s Industrial Transformation and Upgrading, Economic. Review 2018, 393, 56–64. [Google Scholar] [CrossRef]
  71. Demirkan, H.; Spohrer, J. T-shaped innovators: Identifying the right talent to support service innovation. Res. Technol. Manag. 2015, 58, 12–18. [Google Scholar] [CrossRef]
  72. Chen, C.J.; Wu, H.L.; Lin, B.W. Evaluating the development of high-tech industries: Taiwan’s science park. Technol. Forecast. Soc. Chang. 2006, 73, 452–465. [Google Scholar] [CrossRef]
  73. Su, T.N. Research on three-dimensional evaluation and optimization countermeasures of scientific and technological innovation competitiveness in the eastern region. Southeast Acad. Res. 2014, 244, 127–134. [Google Scholar] [CrossRef]
  74. Innovation and Development Division, Ministry of Science and Technology of China. China Science and Technology Statistics Yearbook (2011–2018); China Statistica Press: Beijing, China, 2019. [Google Scholar]
  75. National Bureau of Statistics of China. China Statistics Yearbook (2011–2018); China Statistica Press: Beijing, China, 2019. [Google Scholar]
  76. Zhang, Z.F.; Shen, J.Q.; He, W.J.; An, M. An Analysis of Water Utilization Efficiency of the Belt and Road Initiative’s Provinces and Municipalities in China Based on DEA-Malmquist-Tobit Model. J. Hohai Univ. Philos. Soc. Sci. 2018, 20, 66–72, 98–99. [Google Scholar] [CrossRef]
  77. Yang, L.; Ouyang, H.; Fang, K.; Ye, L.; Zhang, J. Evaluation of Regional Environmental Efficiencies in China based on Super-Efficiency-DEA. Ecol. Indic. 2015, 51, 13–19. [Google Scholar] [CrossRef]
  78. Bai, J. On Regional Innovation Efficiency: Evidence from Panel Data of China’s Different Province. Reg. Stud. 2013, 47, 773–788. [Google Scholar] [CrossRef]
  79. Wu, Y.; Pan, Y.; Zhang, Y.; Ma, Z.; Pang, J.; Guo, H.; Xu, B.; Yang, Z. China Scientific and Technical Papers and Citations (CSTPC): History, Impact and Outlook. Scientometrics 2004, 60, 385–397. [Google Scholar] [CrossRef]
  80. Chen, J.; Zhang, X.W. Innovation-driven development and scientific and technical structural reform (2012-2017). Stud. Sci. Sci. 2018, 36, 2116–2121. [Google Scholar] [CrossRef]
  81. Yuan, L.; He, W.J.; Xu, S.S. Countermeasures for Yichang Rural Tourism Transformation and Upgrading in the Context of Rural Revitalization. J. China Three Gorges Univ. (Humanit. Soc. Sci.) 2019, 41, 29–34. [Google Scholar] [CrossRef]
  82. Afzal, I. An empirical investigation of the National Innovation System (NIS) using Data Envelopment Analysis (DEA) and the TOBIT model. Int. Rev. Appl. Econ. 2014, 28, 507–523. [Google Scholar] [CrossRef]
  83. Yuan, R.H.; Hao, F. Eco-efficiency Evaluation Based on Super Efficiency DEA-Tobit Model for Park Rehabilitation. J. Harbin Univ. Commer. 2018, 161, 15–25. [Google Scholar]
  84. Doloreux, D.; Gomez, I.P. A Review of (almost) 20 Years of Regional Innovation Systems Research. Eur. Plan. Stud. 2017, 25, 371–387. [Google Scholar] [CrossRef]
  85. Kogan, L.; Papanikolaou, D.; Seru, A.; Stoffman, N. Technological Innovation, Resource Allocation and Growth. Soc. Sci. Electron. Publ. 2012, 1–33. [Google Scholar] [CrossRef]
  86. Galambos, L.; Amatori, F. The Entrepreneurial Multiplier Effect. Enterp. Soc. 2016, 17, 763–808. [Google Scholar] [CrossRef]
Figure 1. Super-efficiency DEA model. A, B, C, and D respectively represents four different decision units whose efficiency value reaches 1, E represents the lower efficiency point, B1 represents the higher efficiency of decision unit.
Sustainability 11 05780 g001
Figure 2. The two-stage research method framework.
Sustainability 11 05780 g002
Figure 3. The TFP of high-quality innovation development trend of 30 provinces and municipalities in mainland China.
Sustainability 11 05780 g003
Figure 4. The TFP of innovation development trend of three major regions in mainland China.
Sustainability 11 05780 g004
Table 1. The efficiency index system of high-quality innovation development.
Input IndicatorsEvaluation IndicatorsIndicators Meaning
Full-time equivalent of R and D personnel (X1) [61]The sum of the actual working hours of full-time (which accounts for 90% or more of the annual cumulative working time of R and D activities) and part-time R and D personnel.
Intramural expenditure on R and D (X2) [62]The internal expenditures of innovation activities are used for basic research, applied research, and experimental development.
The number of research and development institutions (X3) [63]The number of organizations that specialize in scientific innovation and technology.
The number of R and D projects in colleges (X4) [64]The basic support source for the transformation of innovative achievements in colleges.
Investment in high-tech industries (X5) [65]Large-scale operating funds allocated for enterprise innovation.
Output Indicatorsthe number of domestic patent applications (Y1) [66]The direct results of innovation output.
Table 2. The measured variables of the government’s roles.
Government RoleMeasure Indicator
Talent support role (TSR)R and D personnel full time equivalent of R and D institutions [71]
Innovation environment cultivation role (IECR)Annual increase of innovation policies [58]
Innovation environment cultivation role (IECR)National high-tech zone enterprise net profit [72]
Social resources coordination role (SRCR)General public budget expenditure (science and technology expenditure) [73]
Table 3. The TFP of high-quality innovation development of 30 provinces and municipalities in mainland China (2010–2017).
Provinces/
Municipalities
20102011201220132014201520162017Mean ValueRankingAverage Annual Growth RateRanking
Beijing0.3370.3670.8571.2312.2712.4481.9461.7021.395226.02%1
Tianjin0.3650.3340.3260.3810.4170.4660.5620.6930.443169.59%11
Hebei0.3150.2770.2880.3120.3580.4370.4780.5380.375247.96%15
Shanghai0.6970.6180.4960.4510.6020.6650.8351.0070.67185.41%20
Jiangsu1.2191.5481.3891.0950.8950.9650.9620.9031.1223−4.19%29
Zhejiang3.0682.3242.4532.1291.9021.8211.7021.4542.1071−10.12%30
Fujian0.4590.4530.4320.4820.5130.7560.8460.8480.599119.17%12
Shandong0.6400.5490.4990.5240.5370.6100.6910.5600.57612−1.88%28
Guangdong1.0230.9030.7230.7500.8310.9031.0481.3580.94244.13%22
Hainan0.4390.3390.3050.3620.4550.5230.4560.5470.428183.20%24
Liaoning0.3940.4250.3590.3510.3520.4580.4910.5260.420214.23%21
Shanxi0.2280.2030.2260.2690.3070.3630.3880.5230.3132712.61%7
Anhui0.4860.7460.6200.6290.6720.6860.7510.7120.66395.60%19
Jiangxi0.2440.2770.3090.3520.5710.8061.0050.9080.5591320.68%4
Henan0.3590.3350.3310.3360.4020.4730.5390.6110.423197.87%16
Hubei0.3460.3090.2940.3320.3610.4440.5010.5630.394237.22%17
Hunan0.3720.3460.3420.3630.4450.4600.4710.4930.412224.08%23
Heilongjiang0.2380.4370.5320.4860.4600.5200.6040.7360.5021417.53%5
Jilin0.2470.2540.2070.2100.2470.2800.3650.5130.2902911.01%9
Chongqing0.6350.6610.6520.7250.7480.9821.0600.7470.77652.34%25
Sichuan0.7490.6000.6360.6470.7070.8630.8300.7510.72360.03%27
Guizhou0.4440.4280.5570.6780.8770.9750.7330.8100.68878.97%14
Yunnan0.3730.3440.3260.3670.4780.5380.4960.5580.435175.90%18
Shaanxi0.2670.3030.2670.3430.4220.5590.8470.5980.4511513.13%8
Gansu0.1920.2260.2320.2910.3370.4150.5170.7300.3682521.03%3
Qinghai0.1250.2280.1540.1620.2350.4710.5440.5230.3052822.68%2
Ningxia0.4050.1950.1780.2340.3390.3150.4970.7450.364269.10%13
Xinjiang0.9220.3680.3320.4860.6000.8020.7100.9380.645100.26%26
Inner Mongolia0.1650.1470.1430.1580.1990.2240.2480.3270.2013010.26%10
Guangxi0.2500.2500.2330.2980.4210.5520.6440.7230.4212016.37%6
Mean Value0.5330.4930.4900.5140.5990.6930.7260.7550.600 8.34%
Table 4. Tobit regression results with full sample.
VariableRegression CoefficientsStandard Errorz-Valuep-Value
Talent support role (TSR)3.44 × 10−60.00003250.110.918
Innovation environment cultivation role (IECR) **0.00775420.0030662.530.011
Innovation platform construction role (IPCR) ***3.62 × 10−87.42 × 10−94.880.000
Social resources coordination role (SRCR) *−0.00065930.0003996−1.650.099
C0.77516390.1997153.880.0241
Notes: *, ** and *** represent a significance level under 1% (great), 5% (good), and 10% (qualified) level, respectively, and C is a constant term.
Table 5. Tobit regression results in eastern, middle, and western regions.
Regional DivisionVariableRegression CoefficientsStandard Errorz-Valuep-Value
Eastern RegionTalent support role (TSR)−0.00006160.0000693−0.890.374
Innovation environment cultivation role (IECR)0.00212490.00006930.440.663
Innovation platform construction role (IPCR) ***4.43 × 10−81.03 × 10−84.290.000
Social resources coordination role (SRCR)−0.00078420.0005406−1.450.147
C0.77516390.1997153.880.000
Middle RegionTalent support role (TSR)0.00002650.00002281.170.244
Innovation environment cultivation role (IECR) ***0.01751040.00376684.650.000
Innovation platform construction role (IPCR)1.75 × 10−21.23 × 10−8−0.530.598
Social resources coordination role (SRCR) *0.00122640.00065541.870.061
C0.16573850.06560952.530.012
Western RegionTalent support role (TSR)−1.40 × 10−53.71 × 10−5−0.3782610.7052
Innovation environment cultivation role (IECR)−0.0004820.006759−0.0712640.9432
Innovation platform construction role (IPCR)−1.74 × 10−82.29 × 10−8−0.7605030.447
Social resources coordination role (SRCR) ***0.0072810.0024842.9310140.0034
C0.3051030.064514.7295180.000
Notes: *, **, and *** represent significance levels under 1% (great), 5% (good), and 10% (qualified), respectively, and C is a constant term.

