Article

Could Gwadar Port in Pakistan Be a New Gateway? A Network Simulation Approach in the Context of the Belt and Road Initiative

1
Department of Systems Innovation, School of Engineering, The University of Tokyo, Bunkyo, Tokyo 113-8656, Japan
2
PADECO Co. Ltd., Minato, Tokyo 113-0034, Japan
3
Department of Civil Engineering, School of Engineering, The University of Tokyo, Bunkyo, Tokyo 113-8656, Japan
4
Maritime Logistics and Free Trade Islands Research Center, Ocean College, Zhejiang University, Zhoushan 316021, China
*
Author to whom correspondence should be addressed.
Sustainability 2019, 11(20), 5757; https://doi.org/10.3390/su11205757
Submission received: 20 August 2019 / Revised: 16 September 2019 / Accepted: 1 October 2019 / Published: 17 October 2019
(This article belongs to the Section Sustainable Transportation)

Abstract

:
Central Asia (CA), comprising six independent countries and the Xinjiang Uygur Autonomous Region of China (XUAR), is an archetypal landlocked region suffering from poor access to global markets. Possible gateway seaports for CA cargo are scattered across the Eurasian continent, and access requires long-haul transport. Thanks to their shorter hinterland transport distances, Pakistani ports, including Gwadar Port, which has drawn attention in the context of China’s Belt and Road Initiative, are investing a substantial amount in their infrastructure, with the aim of becoming the new gateway seaport for CA cargo. This paper aims to analyse the market potential of Gwadar Port and other Pakistani ports as gateways of the cargo to/from CA countries, including China and Russia, applying a two-layered network assignment model, developed from the perspective of shippers, under six scenario conditions. To overcome the lack of data availability in the region, surveys and interviews were conducted. The simulation results, based on several policy scenarios concerning the use of Gwadar Port, with hinterland connections and reduced border barriers, show that the port could handle a sustainable number of containers. If the hinterland rail network effectively connected the port to the CA countries via the XUAR, Pakistani ports could become gateways for CA cargo.

1. Introduction

The Central Asia (CA) region, comprising Afghanistan, Kazakhstan, Kyrgyz, Tajikistan, Turkmenistan and Uzbekistan, is a typical landlocked area that has suffered from limited access to global markets [1,2]. CA is surrounded by Russia, China, Pakistan, Iran and the South Caucasus across the Caspian Sea. Therefore, all of the countries aim to become gateways for maritime cargo to/from the CA countries. While the current major trade partners of the CA countries are those adjacent countries, accessibility to seaports is crucial for CA countries’ sustainable economic growth. As Gallup et al. [3] pointed out, the lower economic growth of landlocked countries can be attributed to their limited access to seaports.
Many studies have shown the importance of transport infrastructure for the international trade of CA. China’s Belt and Road Initiative (BRI), promoting regional infrastructure integration among Eurasian countries, is also concerned with transport infrastructure that would connect China to Europe. For example, regular container train services (China–Europe Railway Express) that connect Chinese cities (mainly inland cities, such as Chongqing, Chengdu, Wuhan and Xi’an) with European cities, including Russian ones, have been increasing rapidly in both their number and the amount of area that they cover in both China and Europe. The Silk Road Economic Belt concept also involves intermodal routes with land–seaport connectivity, covering Iran, the South Caucasus, Turkey and other European countries via the CA countries, without having to pass through Russia.
Meanwhile, the CA Regional Economic Cooperation (CAREC) programme, led by the Asian Development Bank (ADB), has been promoting regional cooperation and development in CA since 1997. Currently, the CAREC programme has 11 partner countries, comprising not only the CA countries, but also China (focusing on the Xinjiang Uygur Autonomous Region (XUAR)), Mongolia, Pakistan, Azerbaijan and Georgia. From the viewpoint of the international logistics environment, the XUAR is similar to the CA countries, being over 3000 km away from Chinese seaports. Thanks to the best ‘physical connectedness’ of the port-hinterland [4] in Pakistan and China’s Belt and Road Initiative, the country’s ports, including Gwadar Port, are investing a substantial amount in their infrastructure, with the aim of becoming the new gateway seaports for CA cargo. In other words, Pakistani seaports (Karachi, Bin Qasim and Gwadar) are becoming promising gateways for CA, including the XUAR, to connect their hinterland, because most cities in CA are closer to the Pakistani seaports than the ports in Russia, China, Iran, Georgia and the Baltic countries. In fact, Pakistan joined the CAREC programme in 2010, with the aim of offering new seaport gateways for the hinterland in CA. However, the current hinterland of the Pakistani seaports extends only to Afghanistan, rather than to Pakistan itself, because of insufficient infrastructure, especially in Afghanistan, which makes it impossible to access the CA. In order for Pakistani seaports to serve the hinterland, many projects to overcome the present constraints in infrastructure in the country are either being planned or have already been implemented. For example, the China–Pakistan economic corridor (CPEC), in the context of BRI, includes launching a new seaport (Gwadar Port), enhancing domestic and international rail connections and reducing the physical and institutional barriers at the national land borders.
As ADB [5] pointed out, most of the access routes to CA used to be for the east–west traffic, rather than the north–south traffic, even though the latter provides a shorter access to the gateway seaports. Pakistan aims to break the status quo in infrastructure investment and cross-border facilitation. While the literature, including the CPEC, has mainly highlighted the traffic analysis and role of the CPEC from the Pakistani perspective, few studies have focused on the gateway role of her seaports for CA, based on a quantitative analysis, to estimate container cargoes at major ports in Pakistan using scenario analysis. This has motivated this study to highlight a potential role of Pakistan in providing seaport gateways for CA because of her geographical advantages, which could support the sustainable development of the CA region. To the best of the authors’ knowledge, there have been no successful studies on the choice of transport routes for containers to/from CA to cover any gateway seaports across the Eurasian continent, which is due mainly to the availability of data and is partly because CA is remote in relation to world markets. To overcome the lack of data, the authors conducted a field survey for years, including several national land borders (see Table A1 and Table A2 in the Appendix A). This study applies a two-layered network assignment model (NAM), developed from the perspective of shippers [6,7], to analyse the market potential of Gwadar Port and other Pakistani ports, as gateways of the cargo to/from CA countries, including China and Russia, under six scenario conditions. The study covers the entire maritime container cargo for CA, not only China through Pakistani seaports. The authors provide a tool for quantitatively analysing them by incorporating the know-how accumulated by the analyses of different regions of the world.
The remainder of this paper is organised as follows. Section 2 details a literature review. Section 3 presents the current situation regarding the gateways available to CA among the Eurasian ports for maritime containers to/from CA. Section 4 describes the model and its input data and assesses its performance. Section 5 applies an extended two-layered network assignment model, developed from the perspective of shippers, to simulate policies related to infrastructure investment and cross-border facilitation in Pakistan and its neighbouring countries. Finally, Section 6 concludes the paper with further study issues.

2. Literature Review

Landlocked countries with a lack of transport infrastructure and poor trade facilitation face disadvantages in terms of connectivity to trade corridors and intermodal transport, causing higher transport and logistics costs [3,8,9,10,11,12]. Specifically, Limao and Venables [8] focused on the overland transport costs of landlocked countries and estimated the elasticity of their trade volume in relation to their quality of infrastructure. Arvis and Raballand [9] highlighted the complexity of the supply chains in landlocked developing countries and clarified their logistics cost structures. Anukoonwattaka and Saggu [10] emphasised the importance of trade policy in landlocked countries, finding that trade barriers, service trade restrictions and a poor trade facilitation performance caused high trade costs in Asian landlocked developing countries. Kashiha et al. [11], analysing the shipment records of several countries in Europe, found that shippers in landlocked countries avoid long-haul transport, readily cross borders and place more value on transport infrastructure. Lim et al. [12] specified key factors affecting transport corridor development in Northern Asian countries, including Mongolia, the only landlocked nation in the region. Landlocked countries recognise the importance of the geo-relationship, in terms of transport and trade corridors, between landlocked economies and their surrounding countries having seaports [13,14,15]. Some of the aforementioned studies also indicated that landlocked countries often depend on a single transport route, which makes their economies vulnerable, emphasising the importance of transport corridor diversification in enabling them to negotiate sea access. Additionally, some papers focused on port selection and competition for cargo to/from some specific landlocked territories, such as Austria [11,16], Niger [17], Laos [18,19] and the northeast part of the Southern Asian region [20].
CA is a good exemplary and complicated landlocked area in the world. The World Bank [2] categorised CA into regions far from world markets, indicating that it is comparatively difficult to reduce trade costs due to their distant hinterlands. However, CA has been recently considered as an international trade hub and as a trade partner, which is in line with the recent economic growth of its neighbours, such as China, India and Russia [21]. In this context, some studies attempted to highlight their unsustainable trade patterns, represented by their insufficient intra-regional trade and dependence on natural resource-based exports [22,23] and transport corridors [24,25,26,27] in CA. Vinokurov et al. [24] focused mainly on the access to CA from the European perspective, discussing the prioritisation of logistics investment policies, as well as the need for an integrated transport system. Kulipanova [25] discussed the reasons for the difficulties in regional cooperation regarding transport, highlighting major physical and nonphysical barriers to international transport. Rodemann and Templar [26] discussed the enablers and inhibitors of the promotion of rail freight transport between Europe and Asia, not only from an economic perspective, but also from political, technical, legal and environmental perspectives. Islam et al. [27] also investigated the same issue through interview surveys with several stakeholders.
Additionally, some studies examined the bottleneck of regional trade supply chains in CA that are adjacent to emerging economies and located it at the centre of the Eurasian continent [9,28]. Several studies have focused on the international logistics of a specific country or route in CA, such as Bulis and Skapars [29], who focused on the Riga port in Latvia, as a gateway for CA cargo, and Regmi and Hanakoka [30], who compared two specific rail routes between South Korea and European Russia. As for the quantitative approach to simulating route choice related to CA, Wang and Yeo [31,32] evaluated three transport routes for second-hand cars from Korea to CA and the routes from Korea to Kazakhstan via multiple Chinese ports and land borders. Meanwhile, ADB [5] pointed out that, given regional economic development and the accession of Turkmenistan and Pakistan to the CAREC programme, ‘an adjustment in emphasis is needed, giving as much importance to north–south and intra-regional links as with the east–west corridors between East Asia and Europe.’ In this context, Yousefi [33] highlighted the role of Iran as a gateway for CA cargo.
There are a few studies related to Pakistan. Sayareh [34] compared the performance of Chabahar port in Iran and that of Gwadar port in Pakistan through interviews with stakeholders. Anwar [35] and Masood et al. [36] discussed the potential of Pakistan as a gateway for CA. From the Chinese perspective, Khan [37] focused on the CPEC between the XUAR and Pakistan, including a new rail connection. The CPEC is regarded as an important link and one of the key examples with which to forecast the future development of the BRI [38,39,40]. Sheu and Kundu [41] and Wang et al. [42] applied the quantitative approach to simulate the choice of routes for importing oil from Middle Eastern countries into China, between the CPEC (via Pakistan), Myanmar and the direct sea route (via the Malacca Strait), although they did not consider container cargo. Shao et al. [43] and Yang et al. [44,45] focused on the rail transport that connects China with countries in the Eurasian continent and their route competitions in the BRI context, but they did not consider Pakistani seaports.
In summary, no studies have quantitatively considered CA’s connectivity to seaports in the neighbouring countries in terms of their competitiveness, focusing on Pakistani seaports, including Gwadar Port. This paper aims to fill this research gap.

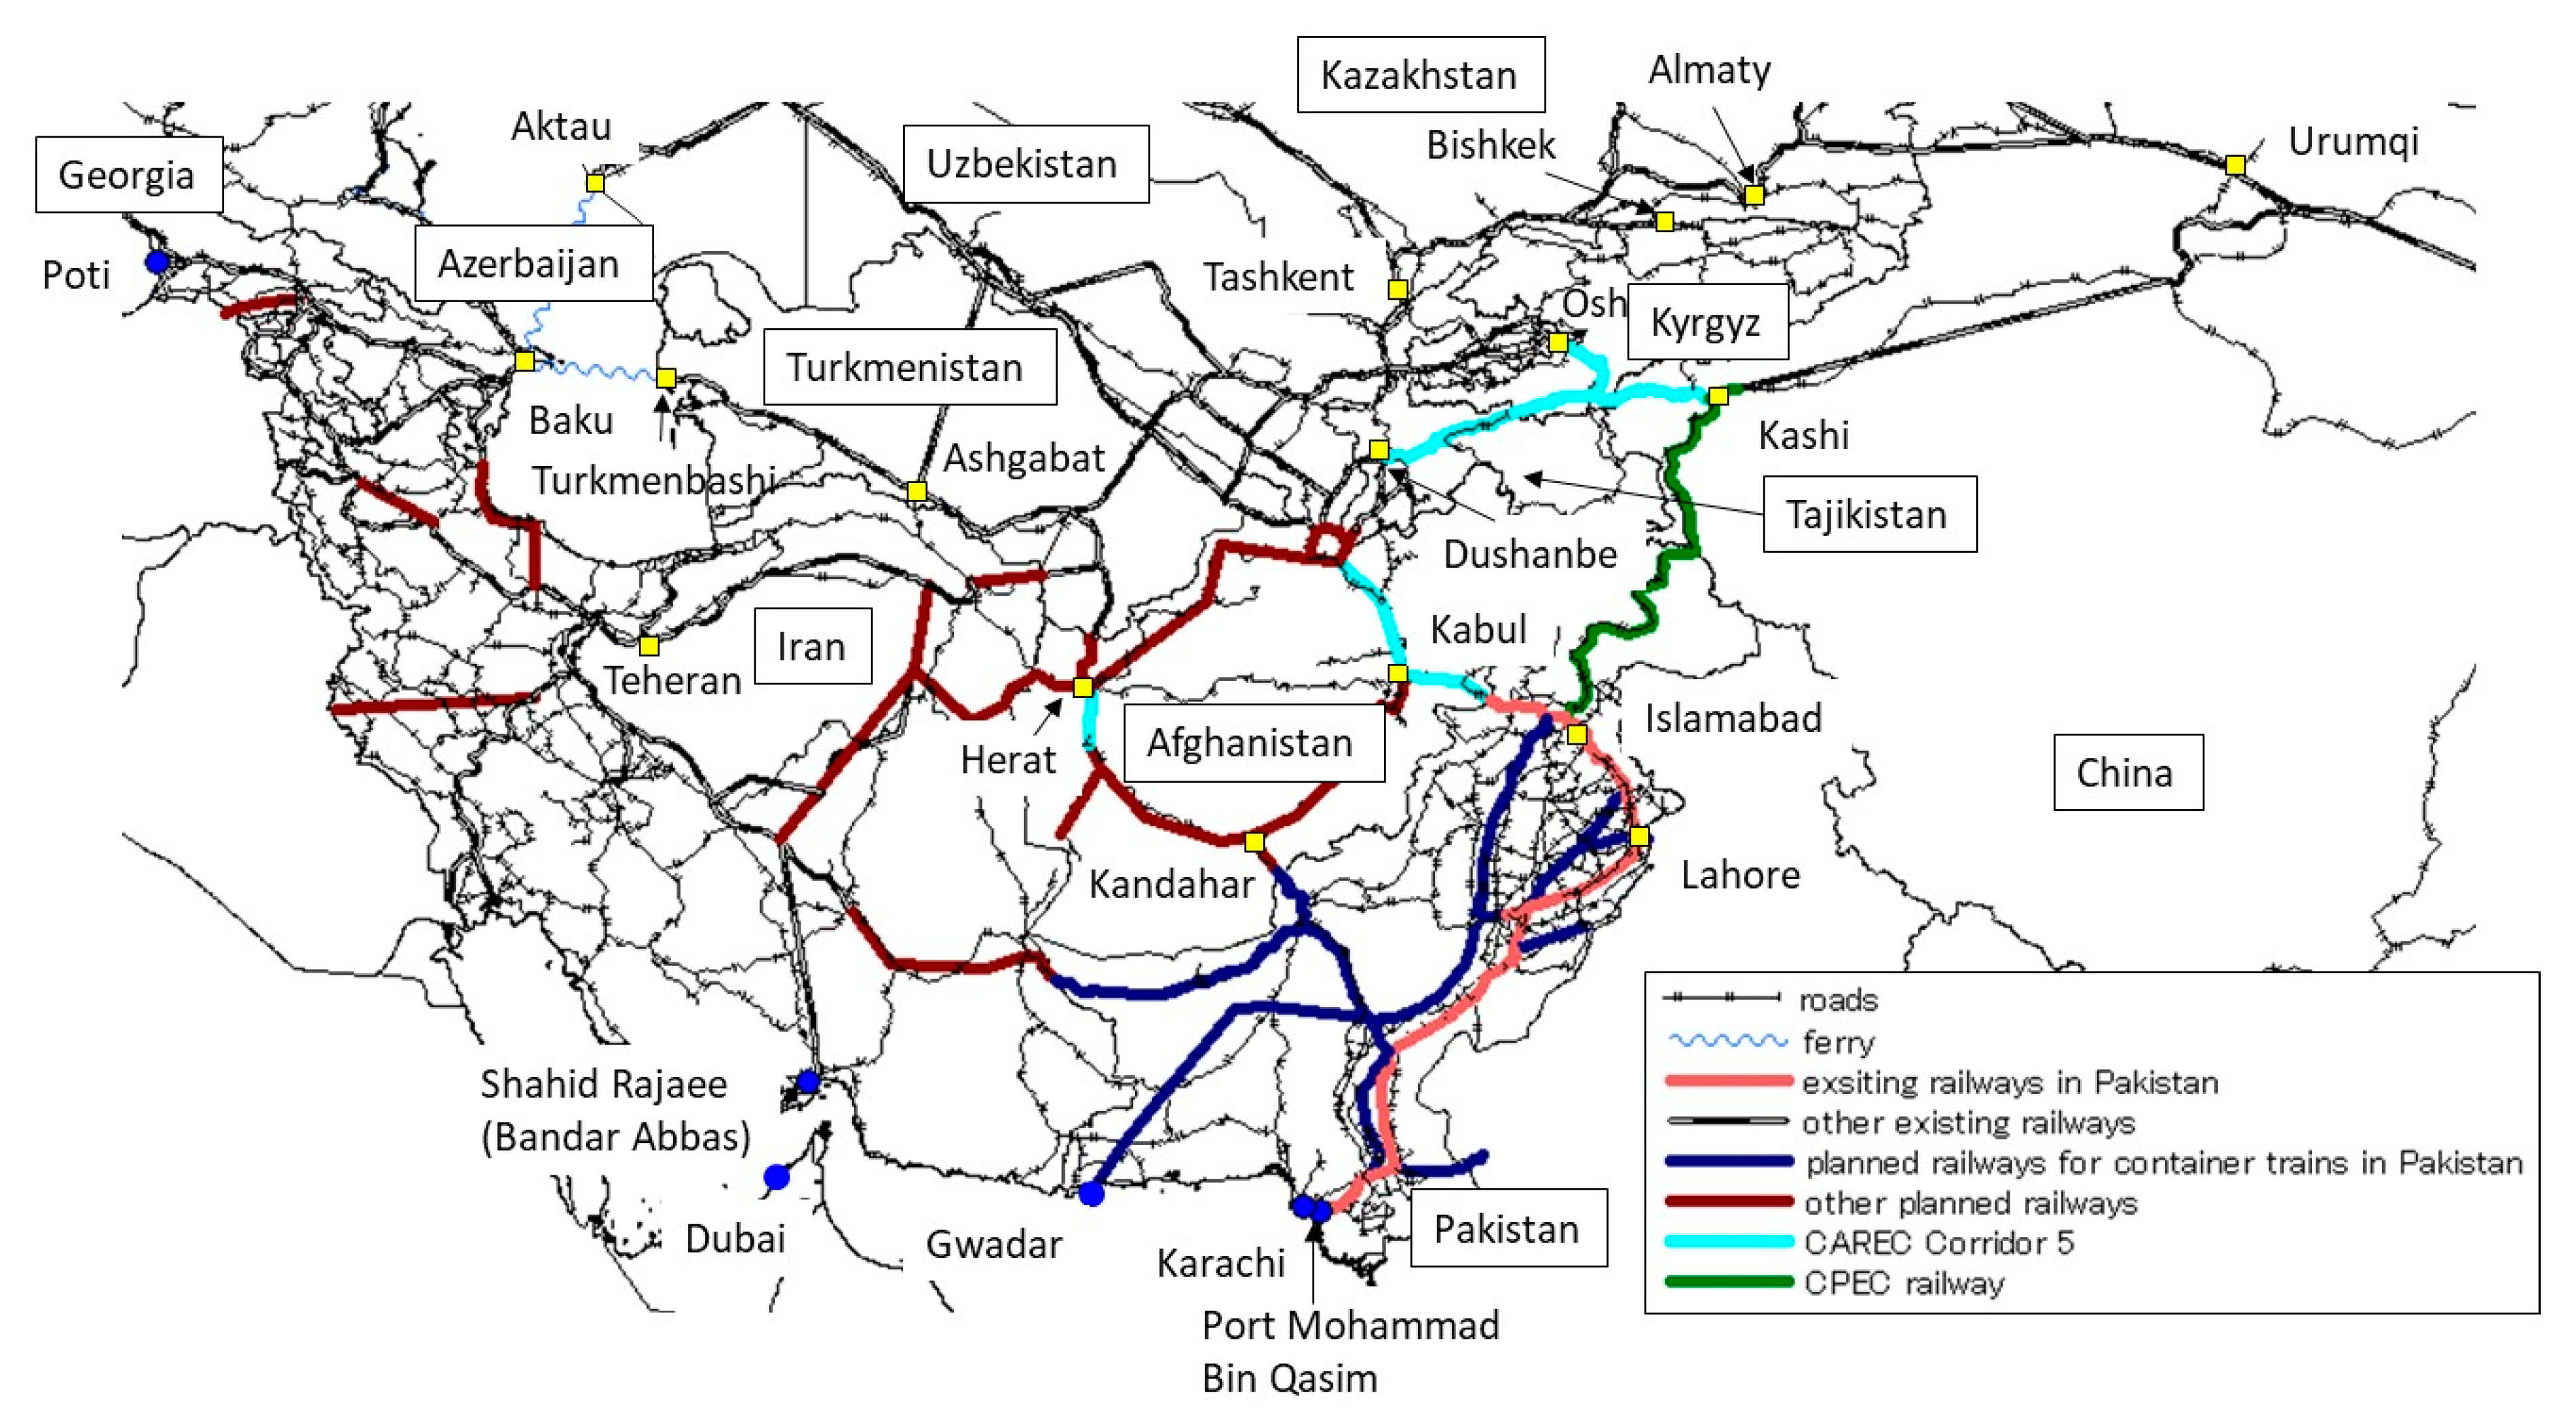
3. Pakistani Seaports as a Gateway of Central Asia

The competitors of Pakistani ports, as gateways for CA cargo, are spread broadly across the Eurasian continent. Figure 1 shows the major gateway seaports and their access routes for international maritime cargo to/from CA. Broadly speaking, they have three directions in six regions, namely, (i) Far East Russia and China to the east, (ii) the Black Sea (including Georgia and Russia) and Baltic Sea (including Russia and the Baltic countries) to the west, which is a component of the Transport Corridor Europe–Caucasus–Asia (TRACECA), and (iii) Iran and Pakistan to the south. While various gateway seaports to/from CA are available across the continent, the transport time and costs associated with the three access routes are considerably high.
Among them, the Arabian Sea coast is the nearest coast for almost all CA regions, including the XUAR in China, in terms of the direct distance. However, the route to the Arabian Sea has many national borders and political/geographical difficulties, including unstable and unsafe areas, for instance, in Afghanistan and Baluchistan in Pakistan, and mountainous terrains, for instance, at the border between China and Pakistan. Guaranteeing the security of transport along this access route remains a challenge.
Currently, the sole available gateway seaport in the Arabian Sea, except for the Afghani cargo transported to the Pakistani ports, is Bandar Abbas, which is the largest seaport in Iran, located at the mouth of the Persian Gulf. It takes approximately one week to transport cargo from Tashkent to Bandar Abbas port by truck, which is almost half the time that it takes for the cargo to reach the Chinese coastal ports [46]. It is worth noting that Chabahar port, which is located near the border with Pakistan, is expected to be a future alternative gateway among the Iranian ports.
Pakistani ports, including Karachi, Muhammad Bin Qasim and Gwadar, are becoming attractive for CA countries with respect to their potential function as new gateways, enabling the sustainable development of CA countries, since Pakistan joined the CAREC programme in 2010. However, the hinterland of these ports currently covers only Pakistan and some areas of Afghanistan because of the underdeveloped infrastructure, as well as poor security, when crossing Afghanistan, as already mentioned.
The cargo volume data and specifications of each Pakistani port are summarised in Table 1. The development of hinterland infrastructure is planned, such as a circular railway network (Figure 2) for Afghanistan to connect CA with the infrastructure network of Pakistan and Iran [47].
Currently, approximately 60% of the total international cargo handled by the Pakistani ports is either going to or coming from the Punjab province, far from the Arabian Sea coast (over 1200 km away). However, the railway services in Pakistan are currently insufficient to meet such a transport demand. The current modal share of rail transport accounts for only 4% out of the total freight flow [50]. This very low share of the rail transport mode is caused by (i) the lack of railroad freight cars; (ii) single tracks, even along the main railway line; and (iii) the poor service capacity in terms of port access, not to mention the substandard surface condition of the national roads.
Gwadar Port is a deep-sea port, located in the Balochistan Province of Pakistan, which is 120 km away from the border point with Iran. The initial construction was completed in 2005, and its concessional rights were transferred to China Overseas Ports Holding Company Limited in 2013 for 40 years. The port has been underused, so that it received only 145 TEUs in 2017. The first commercial container shipment was dispatched from Gwadar to UAE in March 2018 [49]. The port development is associated directly with the CPEC [38]. The economic corridor that will connect the port with the XUAR city of Kashi, giving China a direct access to the Arabian Sea, is planned. The corridor development covers a wide range of transport infrastructure projects, such as linking Gwadar Port with the main artery of the national highway network, developing the motorway between Gwadar city and Karachi city, expanding and reconstructing the existing main railway line in Pakistan and facilitating border-crossing transport infrastructure [51].

4. Model

4.1. Model Structure

This paper applies a two-layered NAM, developed from the perspective of shippers [6,7] in CA and its surrounding countries, for covering every gateway of the global maritime container shipping (MS) network. Figure 3 shows the entire structure of the model, which consists of a super-network for intermodal transport in the upper layer and two real networks, representing each MS and hinterland transport (HT) network in the lower layer. Only full (i.e., laden) containers are considered, and the regional cargo shipping demand is fixed. Therefore, the impact of some policies or changes in the economic environment in altering the transport demand is beyond the scope of the simulation in this paper; it should rather be considered in other models that can forecast the transport demand (see Shibasaki et al. [52] as an example of applying the international economic model to measure the impact on trade and the cargo transport demand of changes in the economic and transport environment).
The super-network model in the upper layer includes the outputs of the real network submodels in the lower layer, namely, the freight charge and transport time for the MS and HT networks. The MS and HT cargo demands, which are the inputs of the two submodels in the lower layer, are cargo flows of the MS and HT links in the super-network model. There are two major reasons for why the model is divided into two layers. One is that a single-layered network assignment model that incorporates a stochastic approach with a capacity constraint (stochastic user equilibrium (SUE)) is an alternative approach. However, if the Gumbel distribution is assumed for the error terms of the utility function, the results can be affected by the density of the real network, owing to the independent axiom. In contrast, if a normal distribution is assumed, SUE cannot be applied to a huge network. The other reason is that the freight charge is generally decided in the real MS market, based on a combination of export and import ports (i.e., on a path basis in the given MS network), irrespective of the actual shipping route on the sea. Therefore, different layered networks are necessary to compute both the freight charge and transport cost.

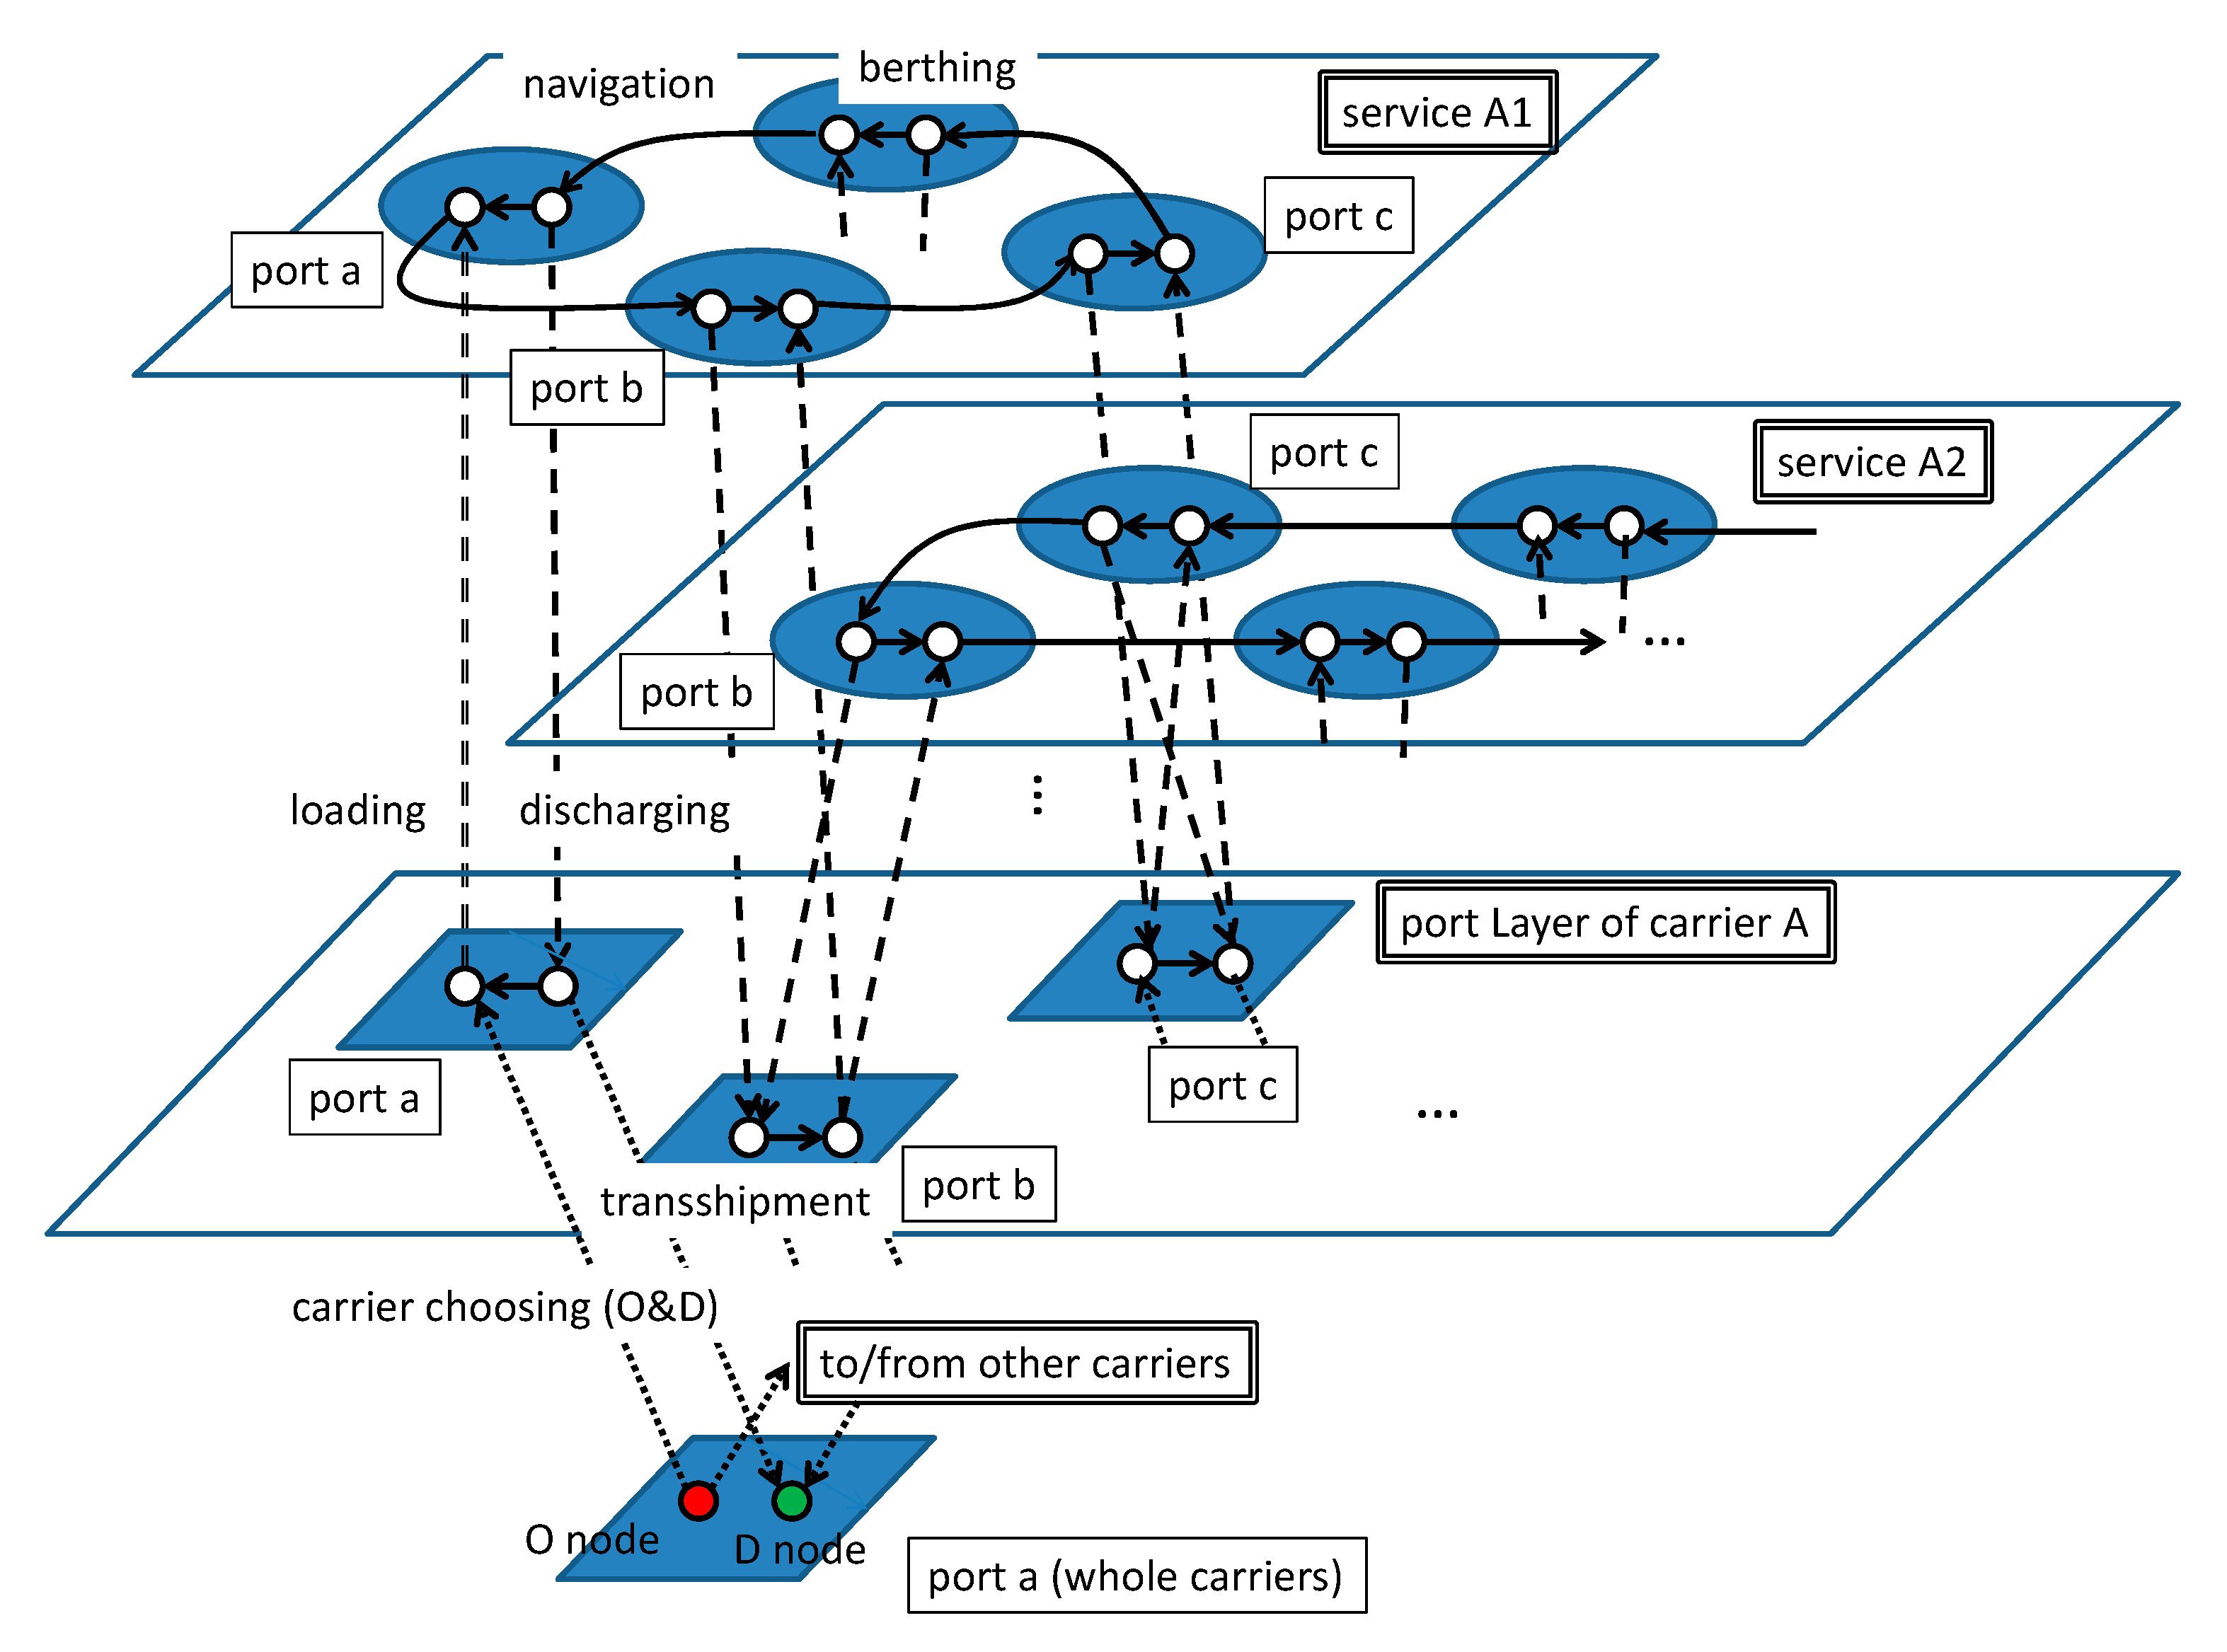
4.1.1. Super-Network Model

In the upper layer, each shipper is assumed to choose the ports to be used for export and import, given the freight charges and shipping time for MS and HT on the intermodal network. When Hod is the path choice set of the cargo shipping demand Qod (TEU) from origin o to destination d, a path h is chosen for a cargo l to maximise utility Uodhl, including an error term εodhl. That is,
U h l o d > U h l o d ,   h , h H o d ,   h h ,   ( o , d ) O × D ,
s . t .   U h l o d = V h o d + ε h l o d ,
where O is the set of origins; D is the set of destinations; and Vodh is the deterministic term of path h, from origin o to destination d. If the error term εodhl follows a Gumbel distribution, the choice of shipper is formulated as
F h o d = Q o d exp ( θ V h o d ) exp ( θ V h o d ) + h H o d exp ( θ V h o d )
where Fodh is the cargo volume on path h, from origin o to destination d; and θ is the distribution parameter. The deterministic term Vodh for each path is expressed as the summation of the freight charge and cost related to the transport time:
V h o d = ( F L o i + F T O i j + F L j d ) v t ( T L o i + T P X i + T T M i j + T P M j + T L j d ) ,   i , j h ,
where vt is the shippers’ value of time (US$/TEU/hour); FLoi and FLjd are the HT freight charge (US$/TEU), from origin o to port i and from port j to destination d, respectively; TLoi and TLjd are the HT time (hour), from origin o to port i and from port j to destination d, respectively; TPXi is the lead time (hour), when exporting from port i; FTOij is the total ocean freight charge (US$/TEU), from port i to port j, including port charges; TTMij is the total MS time (hour), from port i to port j; and TPMj is the lead time (hours), when importing in port j. It should be noted that all port charges are included in the ocean freight charge, FTOij, and any monetary costs are not considered in the port links (i.e., export and import links), since we assume that the ocean freight charge includes not only export and import ports, but also transshipment ports on the way.
Unlike in the study of Shibasaki and Kawasaki [7], inter-carrier transshipment is considered in the model, which is described as a dotted line in Figure 3, for obtaining a more realistic consideration of the actual MS market. It should be noted that intra-carrier transshipment is considered in the global MS submodel. Therefore, unlike in the previous model, the total ocean freight charge, FTOij, and total MS time, TTMij, are described as follows:
F T O i j = ( r , s ) h F O r s + m h , m i , m j ( τ C R m C P X m C P M m )   and
T T M i j = ( r , s ) h T M r s + m h , m i , m j τ T R m
where FOrs is the ocean freight charge (US$/TEU), from port r to port s, in path h including port charges; CRm is the container handling charges (US$/TEU), when container cargo is transshipped in the same liner shipping company in port m; τ is the multiplier of inter-carrier transshipment (τ > 1); CPXm and CPMm are the container handling charges (US$/TEU), when container cargo is loaded and unloaded, respectively; TMrs is the total MS time (hour), from port r to port s in path h; and TRm is the transshipment time (hour) in the same liner shipping company in port m. It should be noted that the transshipment charge, CRm, is usually set between the average and the sum of the loaded and unloaded charges, although detailed information on this for each port is generally not available. Therefore, in this model, we assume that it is as follows:
C R m = 0.75 ( C P X m + C P M m ) .
The ocean freight charge, FOrs, and MS time, TMrs, are acquired from the calculation results of the MS submodel in the lower layer, while the freight charge, FLoi and FLjd, and transport time, TLoi and TLjd, of HT are from the HT submodel. Detailed formulations of both submodels are shown as follows.
A cargo flow of each link in this model represents the inputs (i.e., cargo shipping demand) of the submodels in the lower layer, namely
q r s = x r s ,
q o i = x o i   and   q j d = x j d ,
where qrs is the MS cargo demand (TEU/year), from export port r to import port s; xrs is the cargo flow (TEU/year) of the MS link; qoi and qjd are the HT cargo demand (TEU/year), from origin o to export port i and import port j to destination d, respectively; and xoi and xjd are the cargo flows (TEU/year) of the HT link.
The stochastic assignment model under the intermodal super-network is performed, based on an algorithm proposed by Dial [53].

4.1.2. Global MS Submodel

In the lower layer, the MS submodel is defined as a problem of allocating container cargo to the global liner service (GLS) network, based on containership movement data (i.e., the MDS containership databank [54]). Each liner service (LS) network is structured as shown in Figure 4. Each container of the shipper chooses a link from the maritime origin node of an export port to the maritime destination node of an import port. In this submodel, every container of each maritime origin–destination (OD) pair is assumed to choose a route to minimise the total shipping time. The shipper chooses a carrier, considering only the shipping time, not the freight charge. This assumption is based on the idea that the international MS market is oligopolistic, but a freight charge for an OD pair is the same among carriers, if the service is provided and used.
Since vessels for each service have their own capacities, a diseconomy of scale is attained by concentrating on a specific service. Therefore, the congestion of the link is considered, and a user equilibrium (UE) assignment is applied as a network assignment methodology.
min x   z ( x ) = a A 0 x a t ( x a ) d x ,
s . t .   x a = ( r , s ) R × S k K r s δ a , k r s f k r s ,   a ,  
k K r s f k r s q r s = 0 ,   r , s ,   and
f k r s 0 ,   k , r , s ,  
where a is the link; A is the set of links; xa is the flow of the link a; ta(.) is the cost function of link a; z(.) is the objective function; r is the maritime origin; s is the maritime destination; R is the set of the export port; S is the set of the import port; k is the path; Krs is the set of paths for the maritime OD pair rs; δakrs is the Kronecker delta; and fkrs is the flow on path k. Kronecker delta, δakrs, is written as
δ a , k r s = { 1   if   a k 0   if   a k .
For a detailed description of the cost function for each link, please see Shibasaki et al. [6].
Regarding networks, only the navigating link has a flow-dependent cost function. The cost functions of the other links are flow independent. According to the UE assignment definition, the MS time, TMrs, is defined as
T M r s = min k { a k t ( x a ) } .
The ocean freight charge on each MS link, FOrs, provided by a carrier is generally different from the monetary cost of the route for the carrier, reflecting the balance of demand and supply on the market. A detailed calculation is also shown in Shibasaki et al. [6]. The UE problem, shown in Equation (10), is solved through the Frank–Wolfe algorithm [55].

4.1.3. Regional HT Submodel

Another model in the lower layer is the HT submodel. It is also defined as a problem of allocating container cargo on the HT network in CA and related regions, including roads, rails and inland waterways, with a capacity constraint of each mode. The transport demand, qoi (or qjd), between inland origin o (or destination d) in the CA region and export port i (or import port j) is given. The model is defined as the UE problem, like the MS submodel. It should be noted that, since many enterprises, such as truck companies, are considered to participate in the HT market, the market is sufficiently competitive. Therefore, the shipper chooses the transport mode and route to minimise the total generalised cost, including not only the transport time, but also the freight charge. Namely,
min x   z ( x ) = a A 0 x a u ( x a ) d x ,
s . t .   x a = ( o , i ) O × I k K o i δ a , k o i f k o i + ( j , d ) J × D k K j d δ a , k j d f k j d ,   a ,  
( k K o i f k o i + k K j d f k j d ) ( q i r + q s j ) = 0 ,   o , d , i , j ,   and
f k o i 0 , f k j d 0 ,   o , d , s , i , j ,
where u(.) is the cost function of each link; z’(.) is the objective function; I is the set of the export ports; and J is the set of the import ports. It should be noted that the cost function of each HT link, ua(.), is defined as a generalised cost, not the transport time.
The network structure of the HT submodel is shown in Figure 5. Road and rail networks are connected with a rail connection link, while a ferry link is directly connected with a road or rail link. It should be noted that the cargo origin and destination are connected with only road networks by an OD link, but not by rail, since the last one mile of container transport should be served by a trailer. Another point is that additional transport and time costs are added to each cost function if a road, rail or ferry link crosses the national border, considering the border barrier effect.
Regarding networks, each road, rail and ferry link has different flow-dependent cost functions, as shown in Appendix A. According to the UE assignment definition, the generalised cost of HT, GLoi (or GLjd), is defined as
G L o i ( o r   G L j d ) = min k { a k u ( x a ) }
These generalised costs are related to the freight charge and transport time of HT, which are included in Equation (4) and can be expressed as
G L o i = F L o i + v t T L o i and
G L j d = F L j d + v t T L j d

4.2. Data

4.2.1. Ports

The GLS network formed by the major liner shipping companies is covered by the NAM model. In principle, all container ports whose international throughput was over 500,000 TEU per year, as of 2013 (including empty containers but excluding domestic containers), are included [6]. Additionally, the model includes five gateway seaports (i.e., Vostochny in Russia, Poti in Georgia, Klaipeda in Lithuania, Riga in Latvia and Tallinn in Estonia), which were mentioned in Section 3, although their throughput is less than 500,000 TEU, as of 2013. It should be noted that Gwadar Port is not included in the current GLS network, because container throughput data were unavailable for 2013. Furthermore, several local container ports along the Arabian Sea and the Indian Ocean, such as Sohar in Oman, are included, because we later focus on the CA gateway seaports along the Arabian Sea in the scenario analyses. Consequently, the total number of container ports considered in the NAM model is 187.
The lead times at a terminal for exports and imports, and the handling charges at a container terminal for exports and imports, were set by country, following the ‘Doing Business—Trading Across Borders’ website [56]. The transshipment time for each port is estimated by evaluating the comprehensive level of service in each port [6].

4.2.2. Global MS Network

The MS network is developed based on the MDS containership databank data [54]. Because the model focuses on the container flow in the GLS network and the transshipment of containers at hub ports, some liner services provided by smaller local companies are eliminated from the network for the sake of computational simplicity [6]. Specifically, the model includes the 20 largest liner shipping companies in the world, as of 2013, as well as 17 local companies that have a liner service network at CA gateway seaports. Consequently, 1018 services are included in the model, covering 72.1% of the global annual vessel capacity and 86.7% of the annual capacity of vessels that call at the gateway seaports of CA.

4.2.3. Eurasian HT Network

The HT network covers 19 countries in the Eurasian continent, including all CA countries and all potential gateway seaports for CA cargo, as shown in Figure 6. After all road networks and selected rail links are extracted from the ADC WorldMap [57], international ferry links in the Caspian Sea, connecting Baku (Azerbaijan) with Turkmenbashi (Turkmenistan) or Aktau (Kazakhstan), are added, including both road and rail ferries.

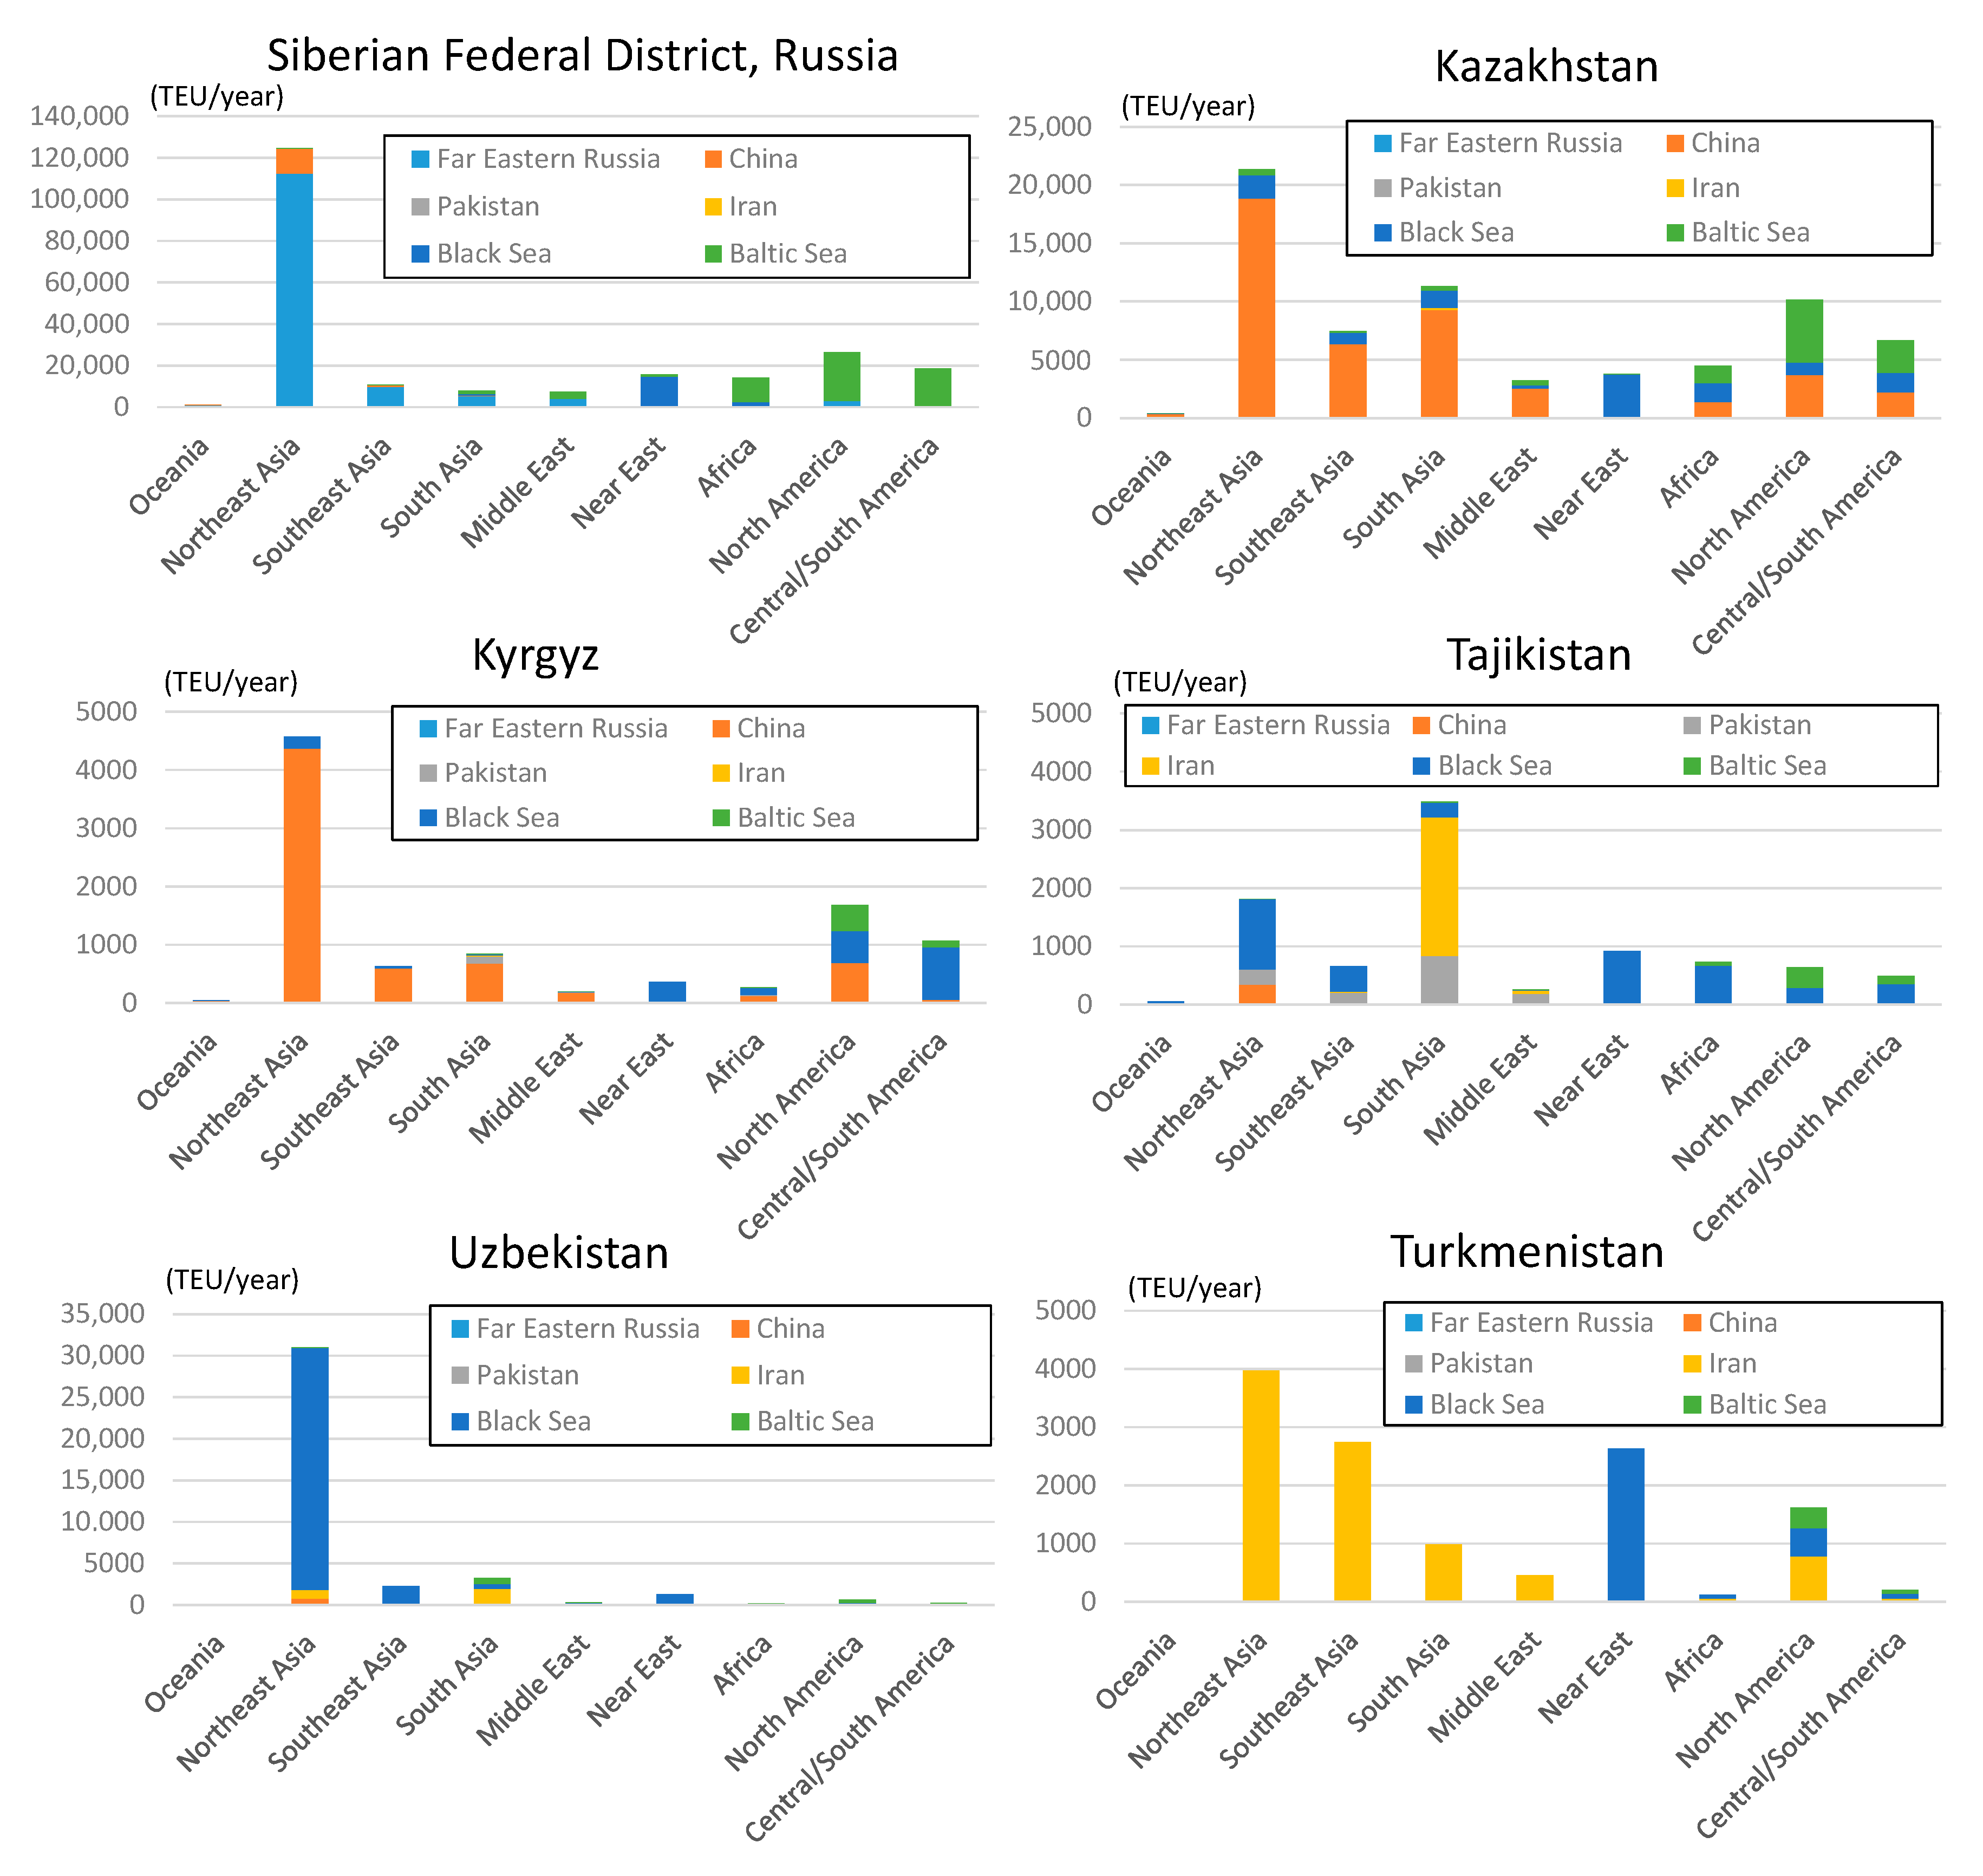
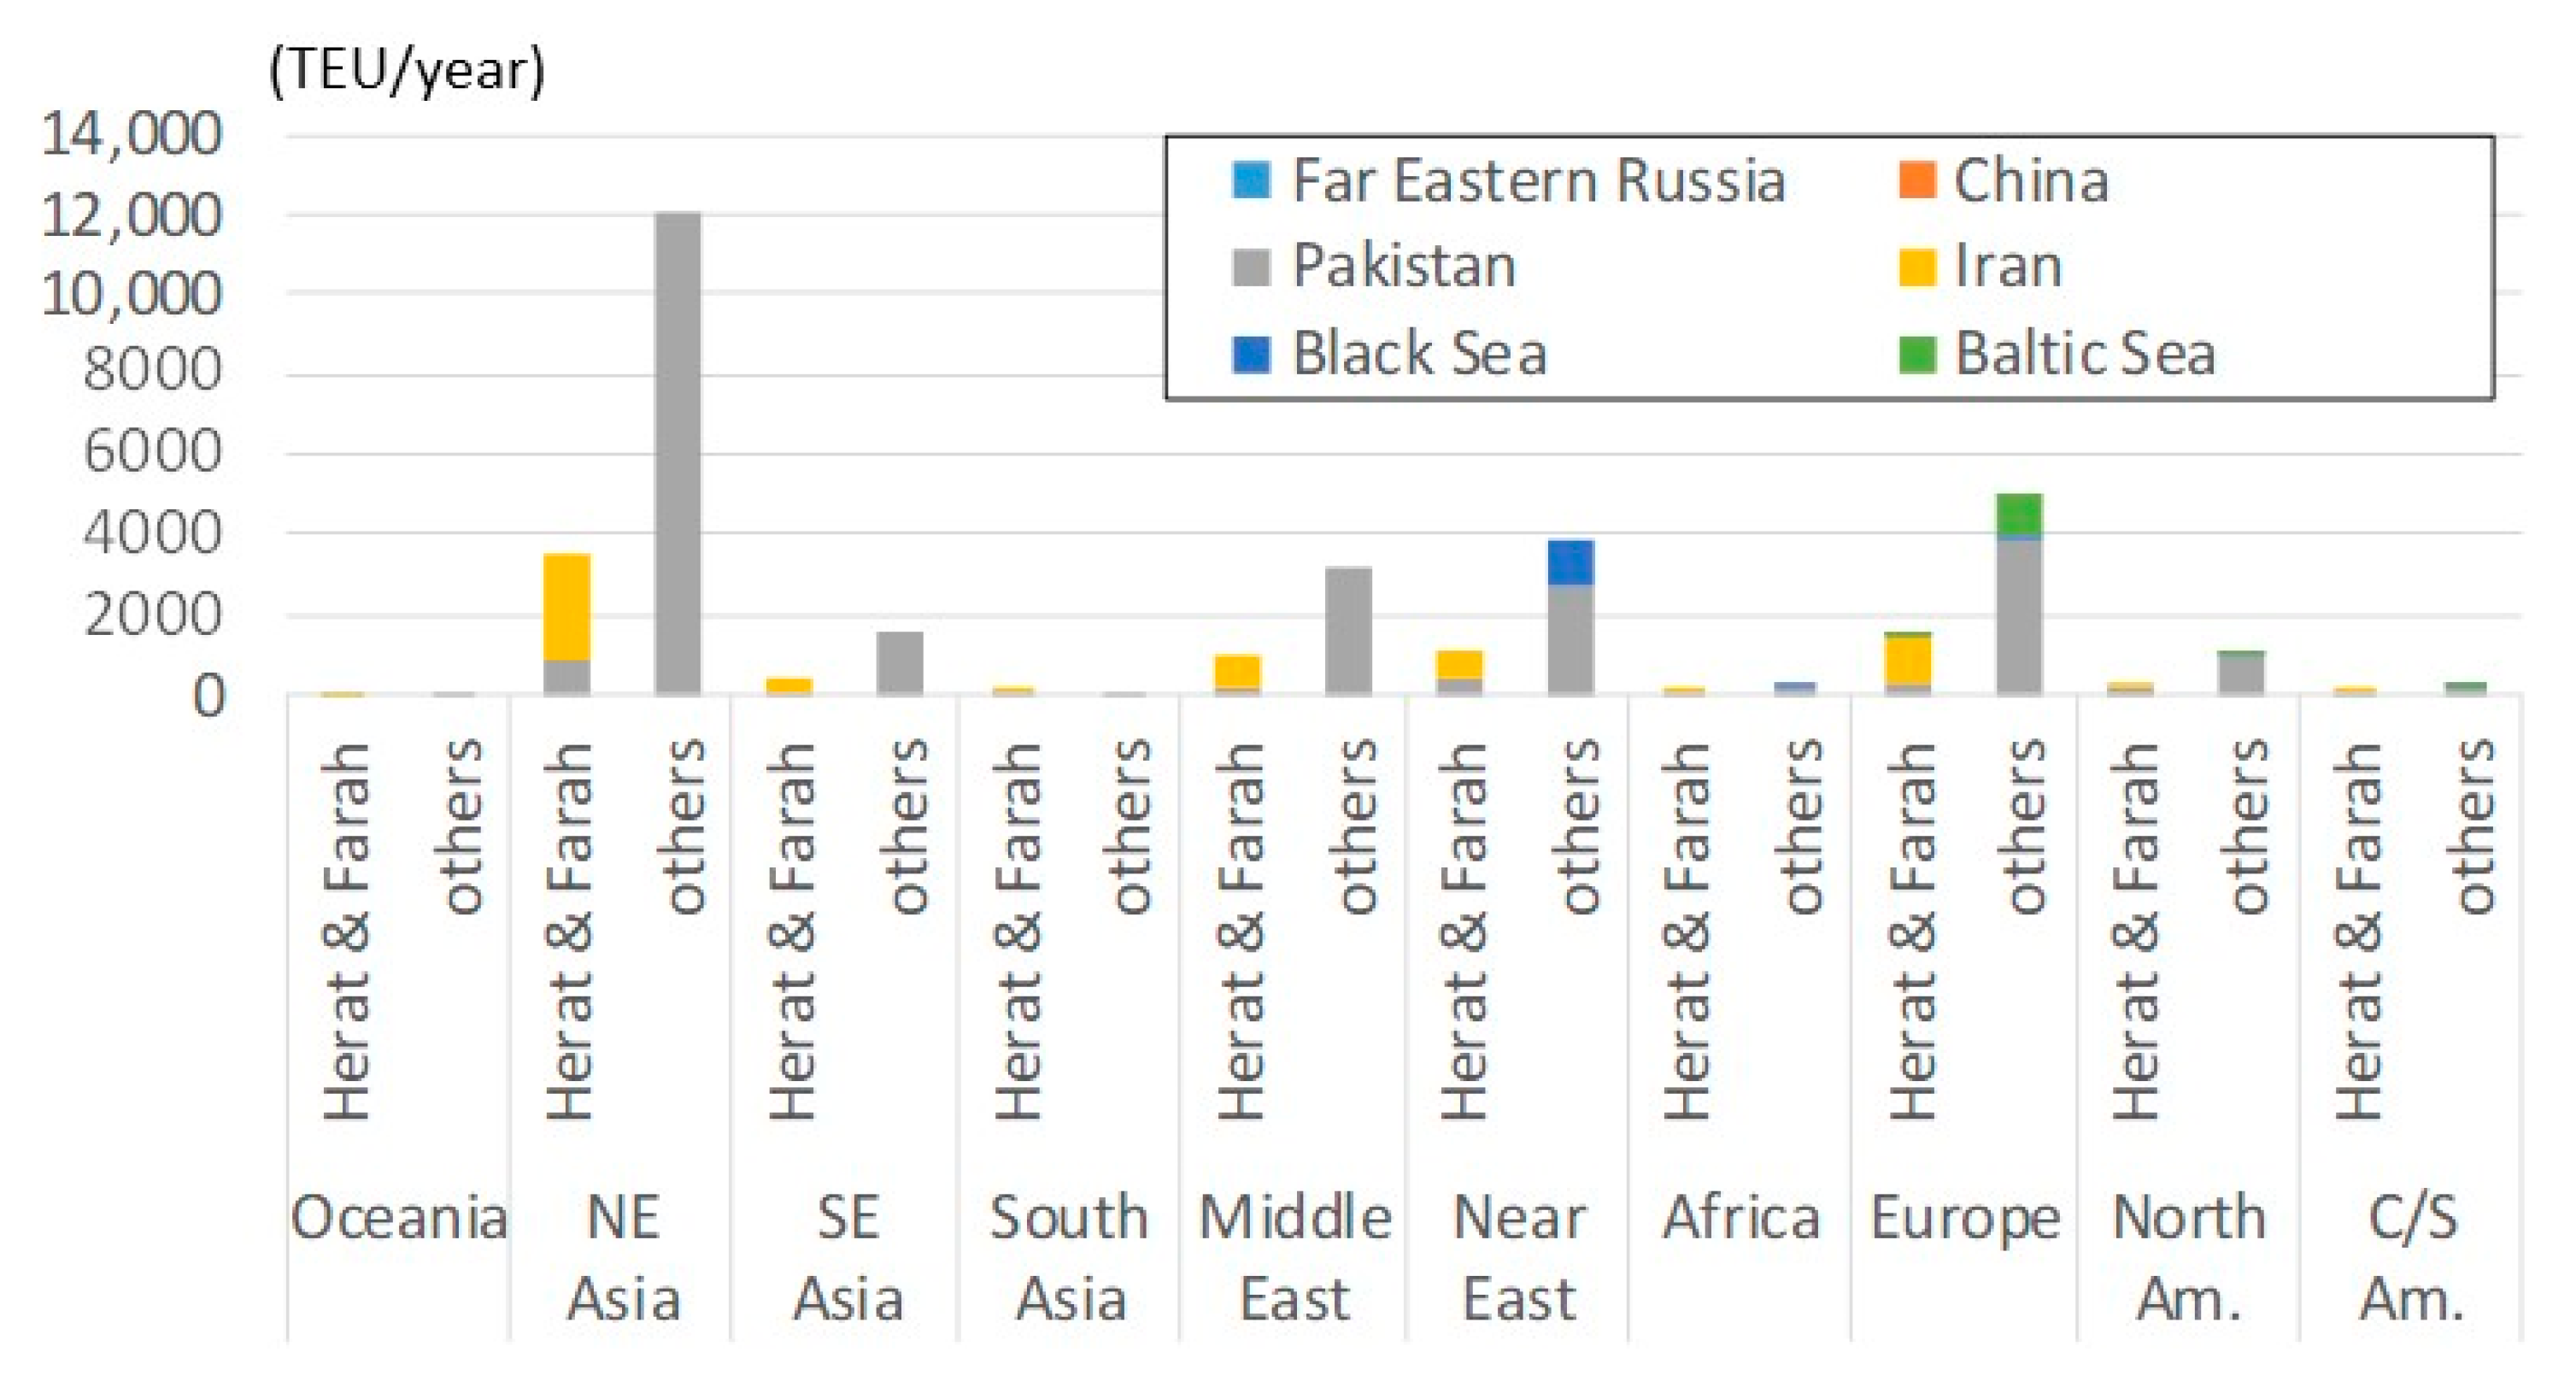
4.2.4. Container Shipping Demand between Regions (Container OD Cargo)

The shipping demand for container cargo (container OD cargo), as well as the initial MS demand, is estimated using various existing data sources, which is the same methodology used in the previous models [6,7].
Firstly, the demand for container cargo shipping (OD matrix) between countries or regions on a TEU basis is obtained from the World Trade Service (WTS) data [58]. The WTS data provide the container shipping demand among 116 countries/regions of the world in 2013. Next, after aggregating the OD matrix into 64 countries/regions to integrate certain countries, they are divided again into a port-based OD matrix, with each port’s share of the local container cargo throughput in the aggregated regions.
Then, a region-based OD matrix is estimated for nineteen countries in the Eurasian continent. The port-based OD matrix to/from these countries is again aggregated into a country-based OD matrix (Note that both the breakdown of CA into Kazakhstan, Kyrgyz, Tajikistan, Turkmenistan and Uzbekistan and that of South Caucasus into Armenia, Azerbaijan and Georgia are conducted using the data specially provided by IHS, Inc., from 2011, according to the share by partner country/region. Additionally, the shipping demand to/from Afghanistan is separated from those to/from Bhutan and Nepal using the exported and imported shares in terms of the trade amount (on a value basis), as acquired from the United Nations Comtrade database [59]). Subsequently, we divide it into sub-country levels (zones), such as provinces, federal districts and oblasts, based on the available statistics for the economy of each zone (see Table 2).
Another point to note is that the shipping demand among European countries (including Russia, CA (except Afghanistan) and the South Caucasus) are not considered in the model, because they are not included in the WTS data. In other words, any cargo between European countries (e.g., between CA and Western Europe) is assumed to be transported by land, rather than by MS.

4.3. Model Performance

4.3.1. Port Throughput

The developed two-layered NAM is validated from the perspective of its agreement with the observed data. These performance checks are important, especially for a huge simulation model that has many parameters. We also confirmed that the model computation converges well (see Shibasaki and Kawasaki [7,70] for detailed information). For example, Figure 7 indicates the agreement of the model-estimated annual rate and number of laden transshipment containers in major world hubs, with the observed number. These figures show the high multiple correlation coefficients in terms of both the transshipment rate and throughput.
Figure 8 and Figure 9 compare the observed export and import container throughputs with the model-estimated ones for all the CA gateway seaports. The charts on the left of both figures show the throughputs in all 25 seaports, which are included in the regional HT submodel. It should be noted that some Chinese ports (i.e., (i) Qingdao and Yantai; (ii) Shanghai and Ningbo; (iii) Fuzhou, Xiamen and Shantou; and (iv) Shenzhen (two terminals) and Guangzhou ports) are integrated in the figures; the ports categorised in the same group are located so closely to each other that breaking the throughputs down by each port is beyond the scope of the model. The charts on the right of both figures show the throughputs of twelve seaports, none of which are Chinese ports, because the throughputs of Chinese ports are so large, relative to those of other ports, that comparing the latter with the Chinese ports would be impractical.
From these figures, the model accurately estimates the observed throughputs of export and import containers for each gateway seaport. The observed throughputs are different from the model-estimated ones for several Chinese ports, such as Shenzhen–Guangzhou and Qingdao–Yantai, for exports, and Tianjin and Shanghai–Ningbo for imports. These should be improved by focusing on Chinese cargo and dividing the country into more detailed zones. Additionally, especially regarding exports, some trade-offs between the observed and model-estimated throughputs are observed among the closely located ports, such as Karachi versus Bin Qasim in Pakistan and Vladivostok versus Vostochny in Far Eastern Russia. It may be difficult to differentiate these ports precisely under the current zoning system, because both are located in the same zone. A more detailed zoning system is therefore required for making such a differentiation more reasonable.

4.3.2. Choice of Gateway Seaport

Figure 10 shows the breakdown of gateway seaports by partner regions for the selected countries/regions. It should be noted again that the model does not include the container shipping demand of CA (including Russia but excluding Afghanistan) and Europe.
The finding is that the gateway seaports significantly differ according to both the CA country and its partner regions. For example, Figure 10 shows that the containers transported between the Siberian Federal District (SFD) of Russia and (North- and South-) East Asia/South Asia/the Middle East (referred to hereinafter as the eastern regions) are mainly transported via the Far Eastern Russian ports, whereas those transported between the SFD and the Near East/Africa/the American continent (the western regions) are mainly transported via the Black Sea ports and Baltic Sea ports. The same finding can be observed in the containers transported to/from Kazakhstan and Kyrgyz (see Figure 9), although those transported to/from the eastern regions mainly use Chinese ports, instead of the Far Eastern Russian ports. Additionally, some containers transported between these countries and African/American continents are transported via Chinese ports. In summary, the choice of gateway seaports for the SFD, Kazakhstan and Kyrgyz cargo mainly crosses the Eurasian continent in the east–west direction.
The choice of gateway seaports for the containers transported to/from the other four CA countries (i.e., Tajikistan, Uzbekistan, Turkmenistan and Afghanistan) seems to be different from that in the above countries and regions. The main gateway seaports for such cargo are the Pakistani ports (Karachi and Muhammad Bin Qasim), one Iranian port (Bandar Abbas) and the Black Sea ports (Novorossiysk and Poti). Specifically, most Uzbekistani containers are transported via the Black Sea ports, even though they come mostly from Northeast Asia, except for those transported to/from South Asia using an Iranian port, as shown in Figure 10. A similar trend is observed in the containers transported to/from Tajikistan, while some containers transported to/from the eastern regions use Pakistani ports, which is different from the Uzbekistani containers. The usage pattern of gateway seaports for containers transported to/from Turkmenistan is different from that of the above countries; the latter mainly use an Iranian port, and only containers transported to/from the Near East (Turkey is one of the most important partners for Turkmenistan) use Black Sea ports. Furthermore, the containers exported from/imported to Afghanistan mainly use Pakistani ports, but sometimes an Iranian port. This choice is based on the region within Afghanistan, rather than the partner regions: most containers to/from the western regions of Afghanistan (i.e., Herat and Farah) use an Iranian port, as shown in Figure 11.
In conclusion, most of these above-mentioned differences in gateway seaports among the CA countries (including the XUAR and SFD) and trade partner regions seem reasonable, as well as consistent with our qualitative observations, introduced in Section 3, although the estimation results cannot be quantitatively compared with the observed data because of the imperfect data availability. A significant exception is that the share of Chinese ports in the containers imported to Uzbekistan seems very small, although containers imported from the Far East constitute a significant portion of it. According to our interview survey in Uzbekistan, the share of Chinese ports should be larger than that estimated by the model. This difference implies that Uzbek cargo is the most difficult to model, because it is one of two double-landlocked countries (a landlocked country surrounded only by landlocked countries) in the world.
The other main difference in our estimation results is that some Tajik containers use Pakistani ports, whereas the actual hinterland of Pakistani ports is currently only part of Afghanistan, as acquired from the interview of Pakistani forwarders. This may be because the model insufficiently considers the unsafe conditions for logistics within Afghanistan. In other words, the model estimation results suggested a potential of Pakistani ports as gateways for not only Afghanistan, but also other CA countries, while the containers transported to/from the XUAR in China do not use Pakistani ports under the present conditions.

5. Scenario Analysis for the Pakistani Intermodal Network

5.1. Scenarios Prepared

Since its accession to the CAREC programme in 2010, Pakistan has implemented several policies related to its ports becoming gateways for the sea trade of the CA countries (including the XUAR in China), such as developing Gwadar Port and investing in infrastructure along the CAREC corridors and the CPEC, as partly described in Section 3. The scenarios to be examined in this section involve the operation of Gwadar Port and improvement of the rail connections within Pakistan and with its neighbour countries, as described in Table 3. A base scenario (s0) considers the original parameter settings prepared for this model—the results of which are validated in Section 4.3. In all of the following scenarios, including scenario s1, we assume that all regional (i.e., within the Arabian Sea, including off the coast of East Africa) LSs on the way call at Gwadar Port. Specifically, among over 1000 LSs globally, twelve services that call at any of the other Pakistani ports (i.e., Karachi and Bin Qasim), as well as any of the Persian Gulf ports (e.g., Bandar Abbas, Dubai and Khor Fakkan), are assumed to call at Gwadar Port. Additionally, the port is assumed to be connected with its hinterland by road in all of the scenarios.
Additionally, scenario s2 to s6 assume the development of the rail network in and around Pakistan. Scenario s2 assumes an improvement of the capacity in the existing rail network by increasing the service frequency, as well as a new rail construction throughout Pakistan, except for the CPEC, based on the development plan proposed by the Pakistani government (see Figure 2). Scenario s3 additionally assumes the launch of services in the planned railway along the CAREC corridor 5, outside Pakistan (except for the CPEC), as well as those in other planned railways in Afghanistan, Iran and the South Caucasus, as shown in Figure 2. Scenario s4 assumes the opening of the CPEC railway, in addition to scenario s3. Two additional scenarios assume that the CAREC border barriers decline to half of the current level (s5) and to zero (s6), in addition to scenario s4.

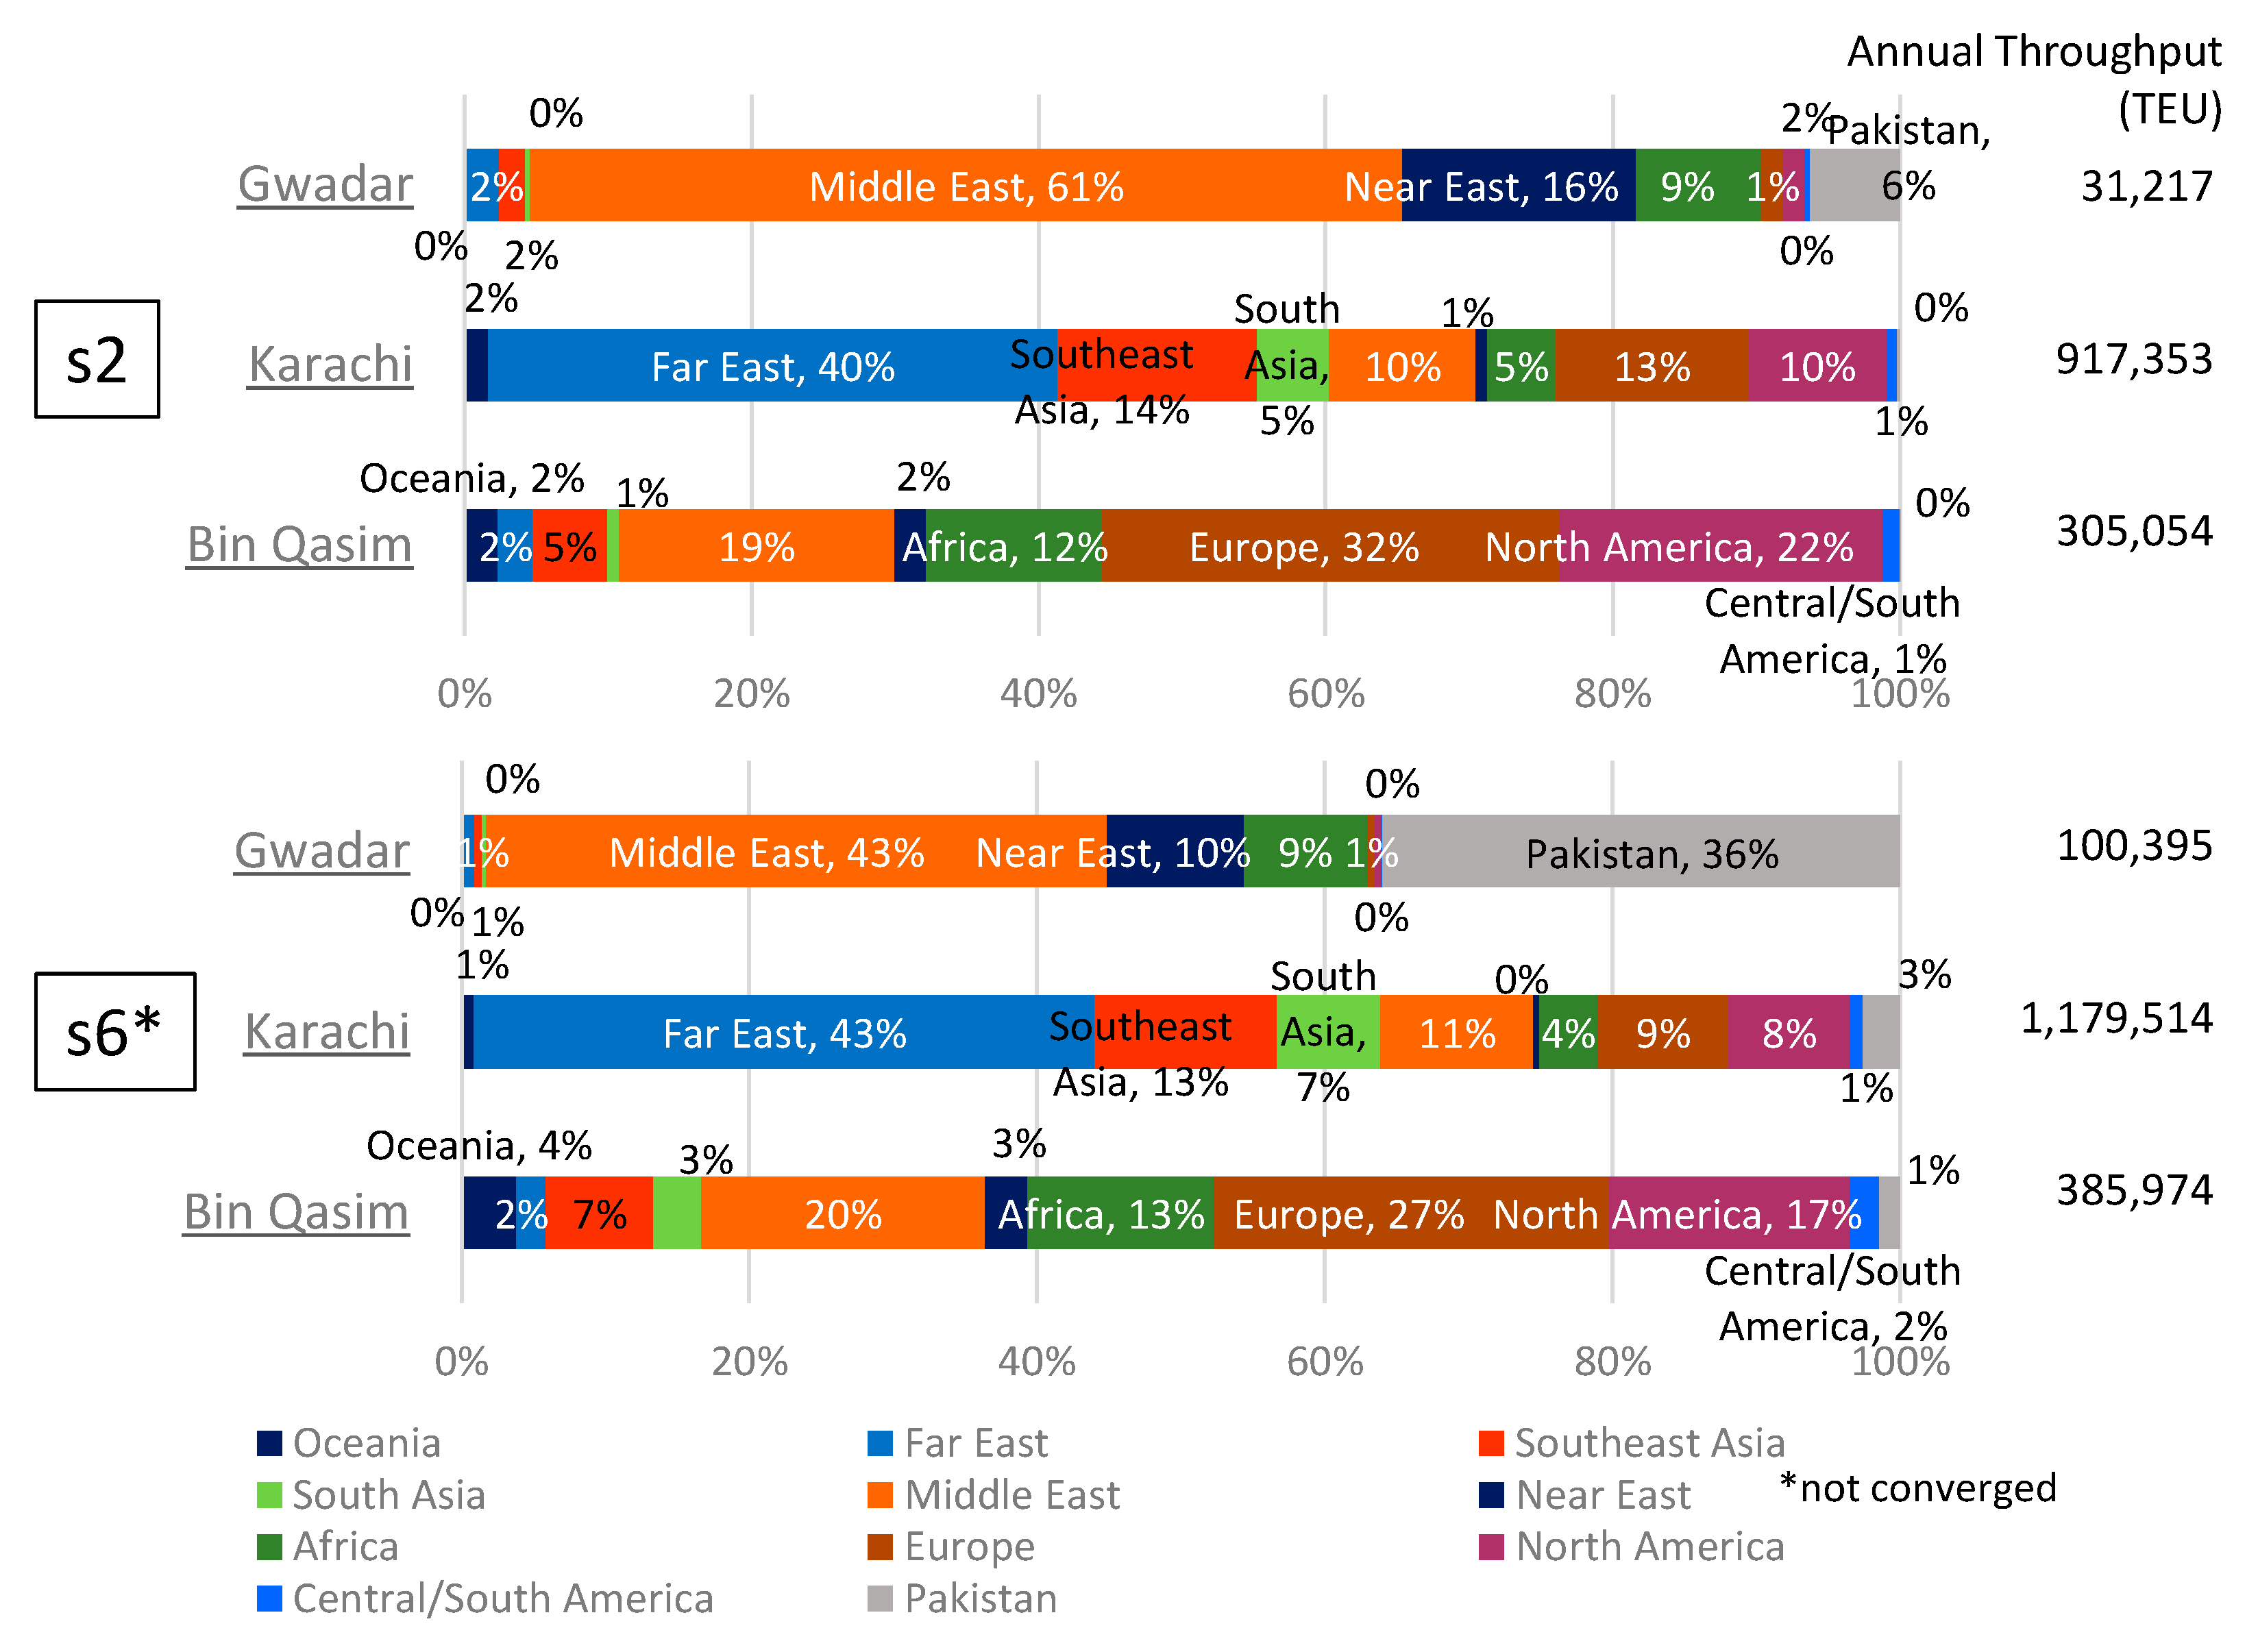
5.2. Port Throughputs and HT Flows Estimated

Table 4 summarises the estimated annual throughputs of export and import containers for Gwadar Port in each scenario and provides breakdowns by origin/destination country in the hinterland. Table 5 shows the changes by region in the annual throughputs of export and import containers, estimated in the six scenarios, compared to those estimated in the base scenario (s0). The results of scenario s6 are regarded as a reference, because the model computation does not converge with the given number of maximum iterations, namely, ten.
Table 4 indicates that the container throughputs of Gwadar Port are estimated to exceed 10,000 TEUs for both exports and imports, if the railways are connected with the port (s2 onward). The results of scenario s2 and s3 also indicate that most containers using Gwadar Port are either going to or coming from Pakistan, while some import containers are going to Afghanistan and other CA countries (mainly to Tajikistan). Table 5 shows that some containers using Gwadar Port are shifted from other Pakistani ports, because the regional throughput for each region does not change significantly, compared to scenario s0.
In contrast, in scenario s4, assuming the launch of the CPEC railways, we find not only that the container throughputs of Gwadar Port increase by over 20,000 TEUs for both exports and imports, but also that the total throughputs of Pakistani ports increase by approximately 20,000 TEUs for both exports and imports, shifting from Chinese ports and the Black Sea ports. Particularly, the import containers that shifted to Pakistani ports in scenario s4 are mainly going to China (i.e., the XUAR) and Northern CA countries (i.e., Kazakhstan and Kyrgyz). Figure 12 shows the differences in container flow estimated in scenarios s4 and s0, suggesting not only shifts in containers from road to rail in and around Pakistan, but also shifts from the east–west direction (to China or European Russia) to the north–south direction between Siberian Russia and Pakistani ports via Kazakhstan and China.
Additionally, the total container throughputs of Pakistan and those of Gwadar Port, in particular, increase significantly with the decline of border barriers, as shown in scenarios s5 and s6. In these scenarios, even some containers to/from Russia and the South Caucasus use Pakistani ports, in addition to the majority of containers to/from Tajikistan, Uzbekistan, Turkmenistan and Afghanistan.

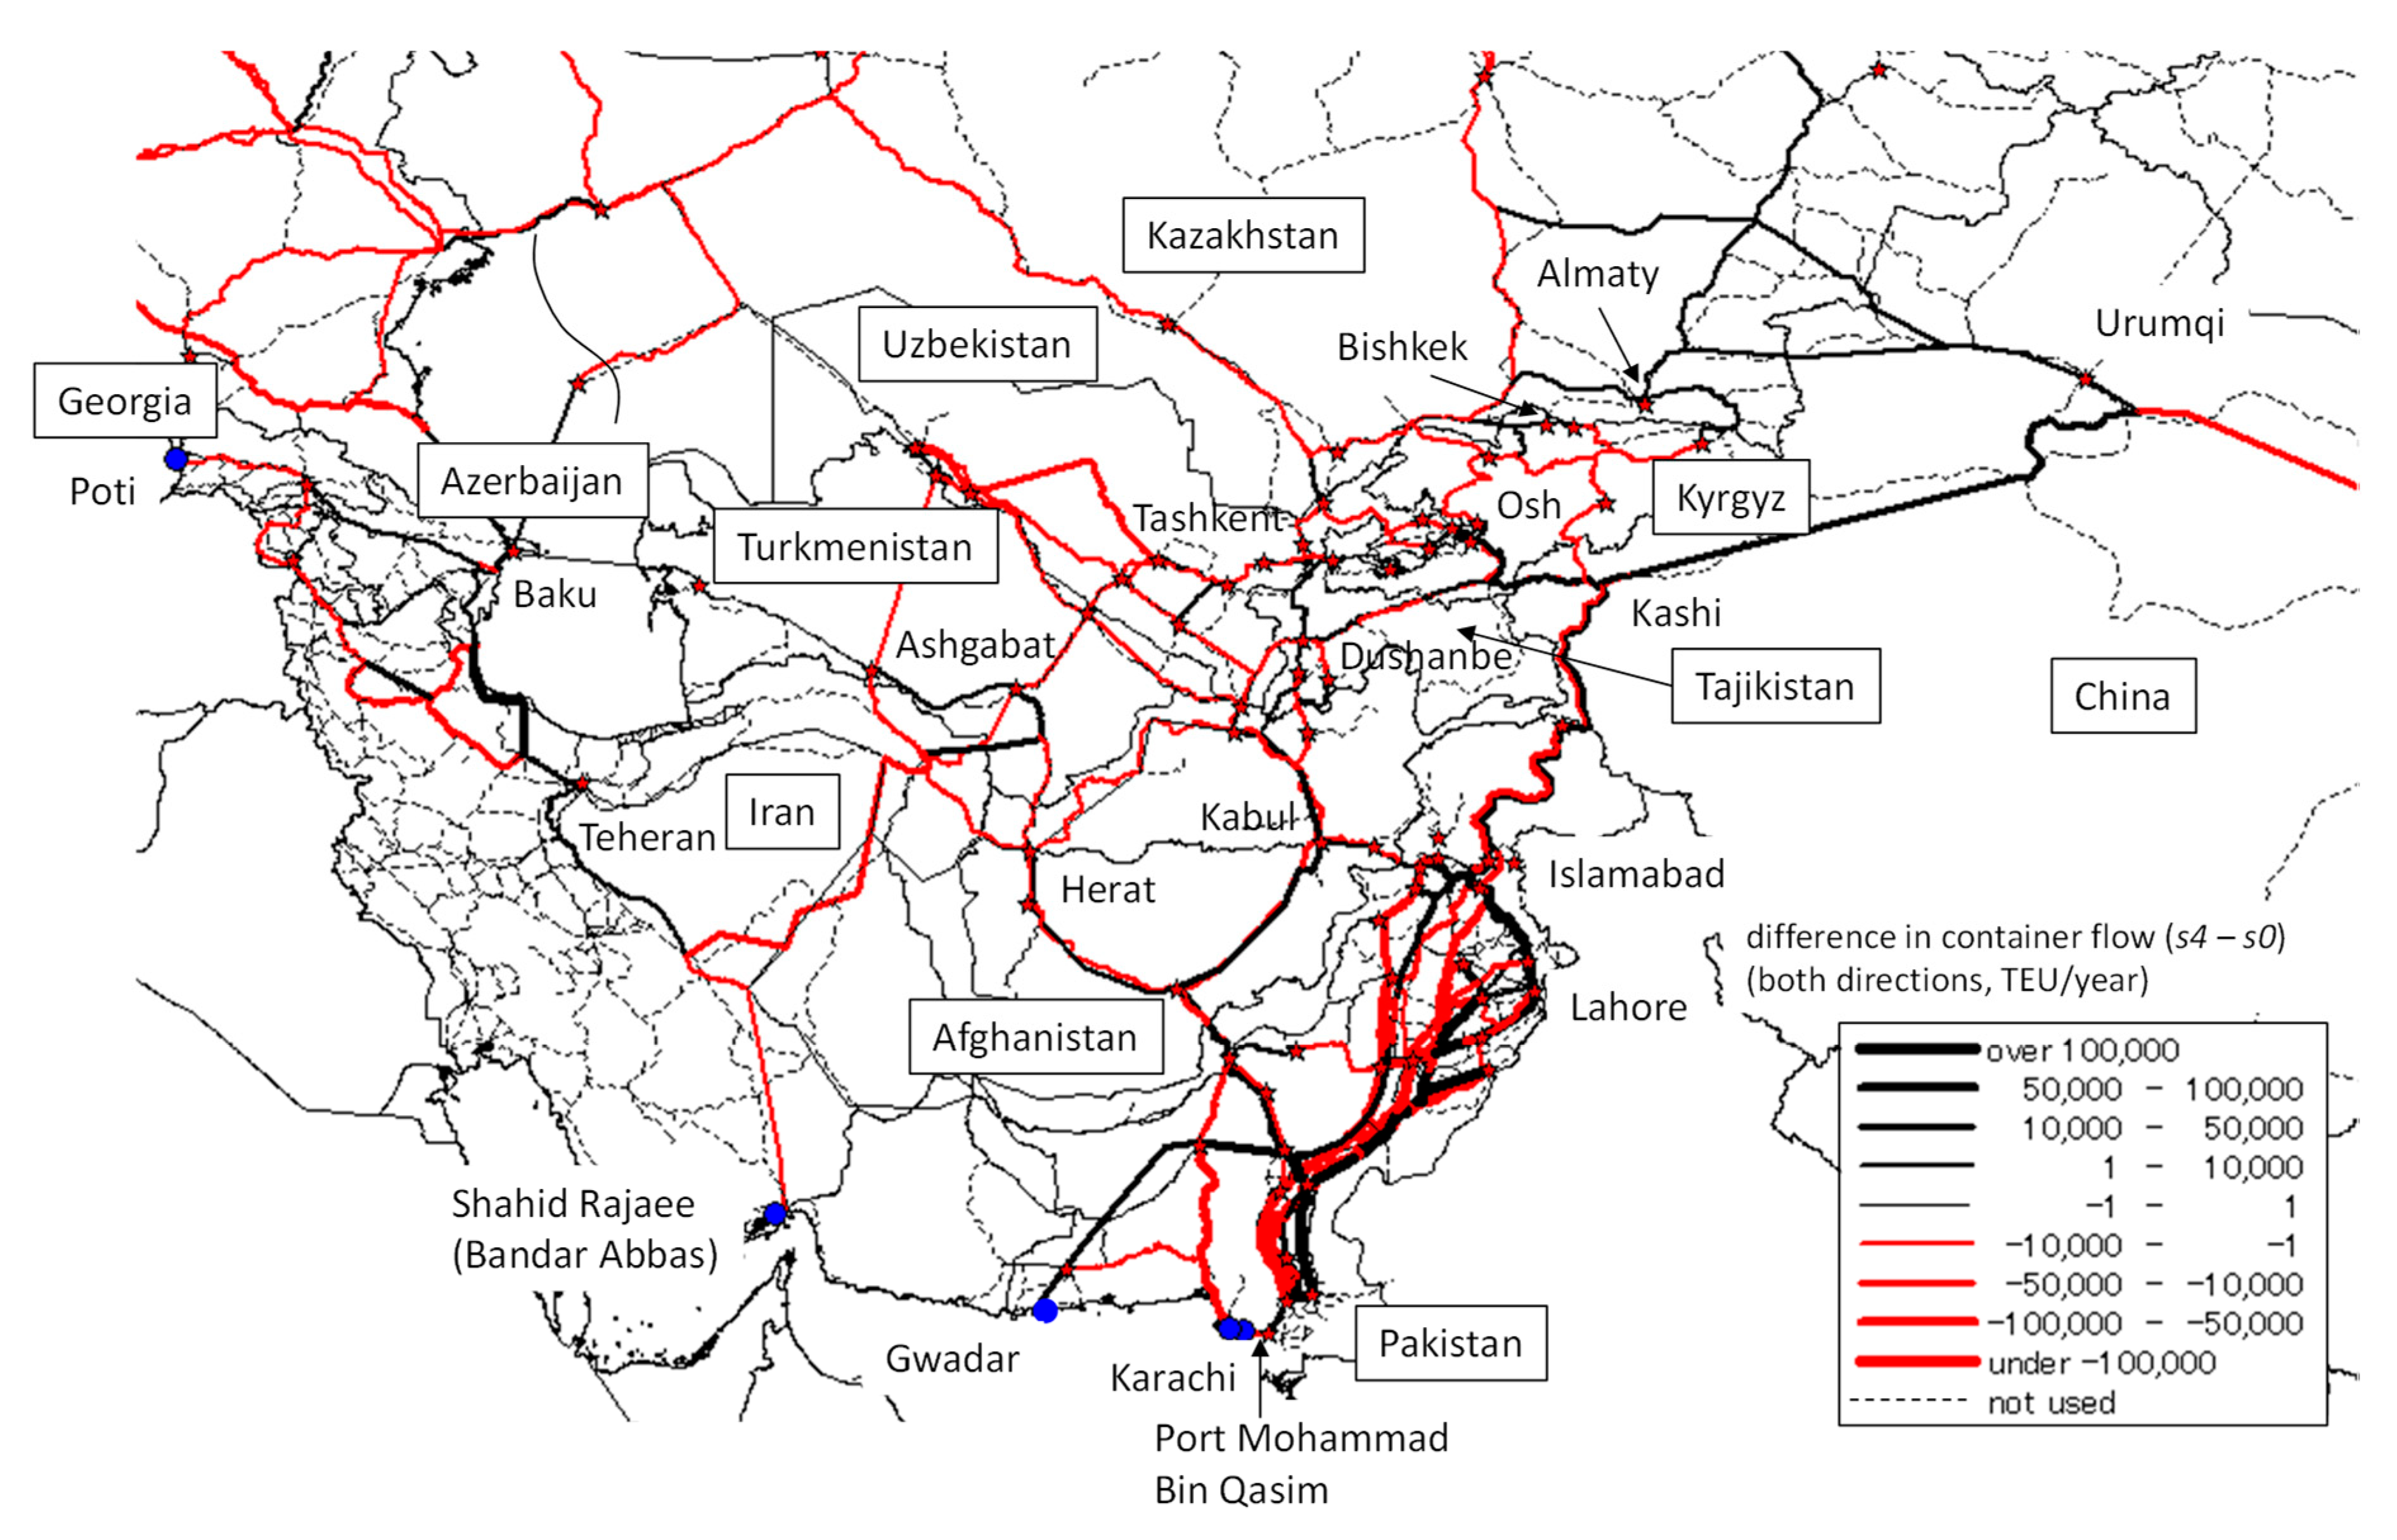
5.3. Estimated MS Flows

Gwadar Port could handle over 30,000 TEUs per year (or 500 TEUs per week) in total, for both exported and imported laden containers, if the rail connectivity between Gwadar Port and each area of Pakistan was well developed and its capacity was sufficient (in scenario s2 onward). Since it is often said that 100 to 200 TEUs per week is necessary to maintain one LS to call, the above scenarios would enable several LSs (but not all LSs considered in the simulation) to sustainably call at the Gwadar Port.
Figure 13 shows the regional breakdown of the partner ports for maritime containers handled in three Pakistani ports in scenarios s2 and s6. It should be noted that this is estimated based on the total throughputs, including not only exports and imports, but also transshipment containers, although they share only small portions of the total amount. It should also be noted that the partner port is defined as a port, where containers are finally discharged or first loaded into the LS network of a single company, because of the network structure of the super-network model (see Figure 3). Specifically, the partner port is an export or import port in most cases, but some containers are occasionally transshipped there into a different company’s LS.
Figure 13 reveals that the regional shares of partner ports vary across Pakistani ports, while they are not significantly different among scenarios, including other scenarios that are not shown in the figure. The main partners of Gwadar Port are the Middle East and Near East, while those of Karachi port are (North- and South-) East Asia and those of Bin Qasim Port are Africa, Europe and North America. These regional differences are mainly caused by the differences in the GLS network with which each port is connected. In other words, the pattern of partner regions estimated in Gwadar Port is mainly based on the assumption that all the GLSs to call at Gwadar Port are regional services to connect with Middle East and South Asia. It should be noted that Pakistani ports (i.e., Karachi and Bin Qasim) share a significant portion of the partner ports for maritime containers handled in Gwadar Port in scenario s6. While some containers are considered to be transshipped in these ports, other containers are coming from their hinterland, such as CA countries, and are transported to Gwadar Port by domestic shipping. This is partly because the model assumes the use of MS at least once.
In summary, the above six scenario analyses show that Gwadar Port could handle over 30,000 TEUs annually, if the rail connectivity from the port was well developed, although some cargo would shift within the Pakistani ports. If the railway is connected not only with CA, but also with China, as in scenario s4, more containers (approximately 50,000 TEUs per year for laden containers) would use Gwadar Port. These additional containers would shift partly from the gateway seaports in regions other than Pakistan. This implies that the improvement of the intermodality between ports and railways in Pakistan would only shift containers within the country, whereas Pakistan could offer gateway seaports to CA, if its international rail connections were also improved, especially those with China. Additionally, the impact on the throughputs would increase synergistically, if the border barriers decreased through an international cooperation (i.e., the CAREC programme) framework.

6. Conclusions

This study analysed the market potential of Gwadar Port and other Pakistani ports as gateways of the cargo to/from CA countries including China (the XUAR) and Russia (SFD). The results estimated with the model simulations revealed that Gwadar Port could handle a sustainable volume of containers, if the hinterland rail was well connected. If an international rail connectivity with CA via Afghanistan and China was available, Pakistani ports could play a key role as gateways for CA cargo, and the role would be intensified by lowering national border barriers under the CAREC framework. Particularly, improving the connections with China would obviously increase the cargo volume handled by Pakistani ports. In reality, the cooperation between China and Pakistan under the CPEC has been accelerated, including not only infrastructure investment in Pakistan and border facilitation between the two countries, but also the enhanced functionality of a Chinese city (Kashi), as a logistics hub. As the political instability in Afghanistan is unlikely to improve immediately, a Chinese route to connect CA with the Pakistani seaports is more realistic. Indeed, according to our interviews, some logistics companies and forwarders in CA are actively considering this option.
The major advantage of Pakistani ports is that they provide shorter distances, in terms of HT from most cities in CA, than other competing ports. If the infrastructure in and around the country was developed, and the barriers at the cross-borders were significantly reduced, the market potential of Pakistani ports, which enables the shifting of cargo from transport in the east–west directions to the north–south directions, would be realised. In addition, the three Pakistani ports, i.e., Karachi, Bin Qasim and Gwadar, have different partner regions. Particularly, Gwadar Port has a geographical advantage over the Middle East because of its MS network, although this partly depends on the GLS network with which each port is connected.
While this study showed empirical evidence regarding the market potential of Gwadar Port in terms of the container volumes drawn from the NAM, there are still many further issues to be resolved. First, a more detailed zoning system, especially for the larger countries (e.g., China and Russia) and for some European countries, is necessary to improve the model accuracy, using customs statistics and other sources in the region by country.
The second issue is the need for integrated modelling to cover both international MS and land transport cargo in the region. Herein, we considered only international maritime containers, which means that all cargo considered in the model are assumed to be moved by containerships at least once. This led to difficulties in handling the drastic change of cargo transport in this region from MS to wholly land transport by trucks or trains, and vice versa. To resolve this, the current land transport cargo demand, which is often not transported by containers, needs to be integrated in future studies.
A further issue is incorporating the networking of GLS into the NAM model. As the existing model does not consider the networking behaviour of international liner shipping companies (i.e., all GLSs are given), we should also preliminarily assume a change in the GLS network as a given input, as shown in Section 5, for the scenario involving Gwadar Port. It is difficult to check ex post facto whether such assumptions concerning the network change are reasonable. Internalising the behaviour of the liner shipping companies is another challenging issue.

Author Contributions

Conceptualization, R.S.; Data curation, R.S. and S.T.; Formal analysis, R.S. and S.T.; Funding acquisition, R.S. and H.K.; Investigation, R.S., S.T. and H.K.; Methodology, R.S. and S.T.; Project administration, R.S. and H.K.; Supervision, H.K. and P.T.-W.L.; Validation, R.S.; Visualization, R.S. and S.T.; Writing—original draft, R.S. and S.T.; Writing—review and editing, H.K. and P.T.-W.L.

Funding

This research was funded by Japan Society for the Promotion of Science (JSPS KAKENHI), grant number 17H03327 and 25289159.

Conflicts of Interest

The authors declare no conflict of interest.

Appendix A. Summary of the Interview Survey and Field Trip

Table A1. List of interview surveys.
CountryPlaceDateIntervieweeInterviewee’s Organization
PakistanKarachiJuly, 2015Ministry of Ports and ShippingGovernment
Karachi Port Trust (KPT)Port administrator
Karachi International Container Terminal (KICT)Terminal operator
Pakistan International Container Terminal (PICT)Terminal operator
DP World KarachiTerminal operator
Sojitz Corporation, Sumitomo CorporationCargo owners and Investors
P.S.S Container, PAKLINK Shipping ServicesForwarders to Afghanistan
Bin QasimQasim Port Authority (QPA)Port administrator
National Industrial Park (NIP)Special Economic Zone (SEZ)
KazakhstanAstanaAugust, 2017Deutsche Gesellschaft für Internationale Zusammenarbeit (GIZ)International organization (Germany)
Ministry of Investment and DevelopmentGovernment
Kazakhstan Temir Zholy (KTZ) ExpressRailway company (Container train operator)
Marubeni CorporationCargo owner and Investor
August, 2018Kazakhstan RailwayRailway company
Continental LogisticsDistribution Centre/ICD
Embassy of JapanDiplomatic organization
AlmatyAugust, 2017Association of National ForwardersForwarder (railway)
Globalink, Senko, Azuma Shipping, NisshinLogistics companies
Mitsubishi CorporationCargo owner and Investor
August, 2018European Bank for Reconstruction and Development (EBRD) Almaty Branch OfficeInternational organization
UnicoLogistics companies
Damu LogisticsDistribution Centre
KhorgosAugust, 2017International Center for Boundary Cooperation (ICBC)Free Trade Zone (FTZ)
Khorgos SEZSEZ, Dry port
AktauAugust, 2018Aktau PortTerminal operator
Aktau North PortTerminal operator
UzbekistanTashkentSeptember, 2009State Customs CommitteeGovernment
Uzbek Agency of Road and River TransportationGovernment
State-Joint-Stock Railway Company (SJSRC)Railway company
Association of International Road CarriersLogistics companies
Association of International Forwarders of UzbekistanForwarders
Inland Container DepotDry Port (railway)
November, 2013Tashkent office, Japan External Trade Organization (JETRO)Public organization
Itochu CorporationCargo owner and Investor
TurkmenistanAshkhabadNovember, 2013Embassy of JapanDiplomatic organization
Sojitz CorporationCargo owner and Investor
KyrgyzBishkekNovember, 2013Freight Operators Association of the Kyrgyzstan
(KGZ FOA)
Logistics companies
TajikistanDushanbeAugust, 2017JICA Tajikistan officeInternational organization
Ministry of TransportGovernment
AzerbaijanBakuNovember, 2013Transport Corridor Europe/Caucasus/Asia
(TRACECA)
International organization (EU)
Azerbaijan International Road Carriers Association (ABADA)Logistics companies
Itochu CorporationCargo owner and Investor
GeorgiaTbilisiAugust, 2018JICA Georgia officeInternational organization
Anaklia Development ConsortiumTerminal developer
Association of Freight Forwarders of GeorgiaForwarders
PotiAPM Terminals PotiTerminal operator
ChinaLiangyungangDecember, 2006Lianyungang Port CompanyPort administrator/Terminal operator
UrumqiNovember, 2013Xinjiang Logistics AssociationLogistics association/University
Xinjiang Huacheng International Transportation service CO., LTD.Logistics company
DB Schenker Urumuch branchLogistics company
RussiaVladivostokDecember, 2012Primorsky Krai GovernmentLocal government
Pacific Strategy Development Center, Regional Fund, Administration of Primorsky TerritoryGovernmental research institute
Commercial Port of VladivostokTerminal operator
Far Eastern Marine Research, Design and Technology Institute (FEMRI)Research institute
VostochnyVostochnaya Stevedoring Company (VSC)Terminal operator
Vostochny PortTerminal operator
Rosmorport Vostochny BranchPort administrator (landlord)
JapanTokyoNovember, 2013ITS NipponLogistics company, Consultant
June, 2017Toyota Tsusho CoCargo owner and Investor
July, 2017Senko Co.Logistics company
Source: Compiled by the authors.
Table A2. Field visit list of land national borders in the CA region.
Visiting PointDateVisiting RouteUsed Transport
Ala Shankou (China)—Dostik (Kazakhstan)17 August 2008crossed from China to Kazakhrail
Chorgos (China)—Khorgos (Kazakhstan)5 August 2017crossed from Kazakh to Chinacar
Irkeshtam (China)—Irkeshtam (Kyrgyz)7 August 2017crossed from China to Kyrgyzcar
Korday (Kazakhstan)—Akjol (Kyrgyz)18 August 2008crossed from Kazakh to Kyrgyzcar
6 November 2013accessed from the Kyrgyz sidecar
Karasu (Kazakhstan)—Aktilek (Kyrgyz)6 November 2013accessed from the Kyrgyz sidecar
Konsybaeva (Kazakhstan)—Yallama (Uzbekistan)2 October 2009accessed from the Uzbek sidecar
6 November 2013accessed from the Uzbek sidecar
Dustlik (Uzbekistan)—Osh (Kyrgyz)8 August 2017crossed from Kyrgyz to Uzbekcar
Jartepa (Uzbekistan)—Sarazm (Tajikistan)2 October 2009accessed from the Uzbek sidecar
Andarkhon (Uzbekistan)—Patar (Tajikistan)8 August 2017crossed from Uzbek to Tajikcar
Alat (Uzbekistan)—Farab (Turkmenistan)30 September 2009accessed from the Uzbek sidecar
5 November 2013crossed from Turkmen to Uzbekcar
Artyk (Turkmenistan)—Lotfabad (Iran)4 November 2013accessed from the Turkmen sidecar
Source: Compiled by the authors.

References

  1. Shepherd, B.; Wilson, J.S. Road Infrastructure in Europe and Central Asia: Does Network Quality Affect Trade? World Bank Policy Research Working Paper (No. 4104); World Bank: Washington, DC, USA, 2006; Available online: http://documents.worldbank.org/curated/en/685631468034174351/Road-infrastructure-in-Europe-and-Central-Asia-does-network-quality-affect-trade (accessed on 29 April 2018).
  2. World Bank. World Development Report 2009: Reshaping Economic Geography; World Bank: Washington, DC, USA, 2009. [Google Scholar]
  3. Gallup, J.L.; Sachs, J.D.; Mellinger, A.D. Geography and economic development. Int. Reginal Sci. Rev. 1999, 22, 179–232. [Google Scholar] [CrossRef]
  4. Hall, P.; McCalla, R.J.; Comtois, C.; Slack, B. (Eds.) Integrating Seaports and Trade Corridors; Routledge: New York, NY, USA, 2010. [Google Scholar]
  5. Asian Development Bank (ADB). CAREC Transport and Trade Facilitation Strategy 2020. Available online: https://www.adb.org/sites/default/files/institutional-document/34107/files/carec-ttfs-2020.pdf (accessed on 29 April 2018).
  6. Shibasaki, R.; Iijima, T.; Kawakami, T.; Kadono, T.; Shishido, T. Network assignment model of integrating maritime and hinterland container shipping: Application to Central America. Marit. Econ. Logist. 2017, 19, 234–273. [Google Scholar] [CrossRef]
  7. Shibasaki, R.; Kawasaki, T. International intermodal container shipping network in South Asia: Modelling and policy simulations. Int. J. Shipp. Transp. Logist. Accepted.
  8. Limao, N.; Venables, A.J. Infrastructure, geographical disadvantage, transport costs, and trade. World Bank Econ. Rev. 2001, 15, 451–479. [Google Scholar] [CrossRef]
  9. Arvis, J.; Raballand, G.; Marteau, J. The Cost of Being Landlocked: Logistics Costs and Supply Chain Reliability; World Bank: Washington, DC, USA, 2010; Available online: https://openknowledge.worldbank.org/bitstream/handle/10986/2489/558370PUB0cost1C0disclosed071221101.pdf?sequence=1 (accessed on 29 April 2018).
  10. Anukoonwattaka, W.; Saggu, A. Trade performance of Asian landlocked developing economies: State of play and the way forward. Trade, Investment and Innovation, Working Paper Series No.1, United Nations Economic and Social Commission for Asia and the Pacific (UN-ESCAP). 2016. Available online: http://www.unescap.org/sites/default/files/Trade-performance-of-Asian-LLDCs.pdf (accessed on 29 April 2018).
  11. Kashiha, M.; Thill, J.C.; Depken, C.A. Shipping route choice across geographies: Coastal vs. landlocked countries. Transp. Res. 2016, 91E, 1–14. [Google Scholar] [CrossRef]
  12. Lim, S.-W.; Suthiwartnarueput, K.; Abareshi, A.; Lee, P.T.-W.; Duval, Y. Key factors in developing transit trade corridors in Northeast Asia. J. Korea Trade 2017, 21, 191–207. [Google Scholar] [CrossRef]
  13. Faye, M.L.; McArthur, J.W.; Sachs, J.D.; Snow, T. The challenges facing landlocked developing countries. J. Hum. Dev. 2004, 5, 31–68. [Google Scholar] [CrossRef]
  14. Carrere, C.; Grigoriou, C. Landlockedness, infrastructure and trade: New estimates for Central Asian countries. Centre d’Etude et de Recherches sur le Développement International (CERDI) Working Paper, No 2008.01. Available online: http://publi.cerdi.org/ed/2008/2008.01.pdf (accessed on 29 April 2018).
  15. Lahiri, B.; Masjidi, F.K. Landlocked countries: A way to integrate with coastal economies. J. Econ. Integr. 2012, 27, 504–519. [Google Scholar] [CrossRef]
  16. de Langen, P.W. Port competition and selection in contestable hinterlands, the case of Austria. Eur. J. Transp. Infrastruct. Res. 2007, 7, 1–14. [Google Scholar]
  17. Lihoussou, M.; Limbourg, S. Network design model for intermodal transport: The case of the hinterland of the Port of Cotonou. In Proceedings of the 4th International Conference on Information Systems, Logistics and Supply Chain. (ILS) 2012, Quebec, QC, Canada, 26–29 August 2012. [Google Scholar]
  18. Iwata, T.; Kato, H.; Shibasaki, R. Influence of transportation infrastructure development on freight traffic flow patterns in GMS. In Gender, Roads and Mobility in Asia; Kusakabe, K., Ed.; Practical Action Publishing: Rugby, Warwickshire, UK, 2012; pp. 25–32. [Google Scholar]
  19. Kawasaki, T.; Hanaoka, S.; Nguyen, L.X. Inland cargo flow modelling considering shipment time variability on cross-border transport. Transp. Plan. Technol. 2015, 38, 664–683. [Google Scholar] [CrossRef]
  20. Munim, Z.H.; Haralambides, H. Competition and cooperation for intermodal container transhipment: A network optimization approach. Res. Transp. Bus. Manag. 2018, 26, 87–99. [Google Scholar] [CrossRef]
  21. World Bank. The Impact of China on Europe and Central Asia; World Bank: Washington, DC, USA, 2009; Available online: http://www.worldbank.org/en/region/eca/publication/europe-and-central-asia-economic-update-april-2016 (accessed on 29 April 2018).
  22. Kurmanalieva, E.; Parpiev, Z. Geography and Trade in Central Asia. Available online: http://dx.doi.org/10.2139/ssrn.1824933 (accessed on 29 April 2018).
  23. Peyrouse, S.; Raballand, G. Central Asia: The New Silk Road Initiative’s questionable economic rationality. Eurasian Geogr. Econ. 2015, 56, 405–420. [Google Scholar] [CrossRef]
  24. Vinokurov, E.; Dzhadraliyev, M.; Shcherbanin, Y. The EurAsEC Transport Corridors; Eurasian Development Bank. 2009. Available online: http://eabr.org/general/upload/docs/EurAsEC_Trans_Cor.pdf (accessed on 29 April 2018).
  25. Kulipanova, E. International Transport in Central Asia: Understanding the Patterns of (Non-) Cooperation. University of Central Asia, Institute of Public Policy and Administration Working Paper. 2012, Volume 2. Available online: http://www.ucentralasia.org/Content/downloads/UCA-IPPA-WP2-International%20Transport%20in%20Central%20Asia.pdf (accessed on 29 April 2018).
  26. Rodemann, H.; Templar, S. The enablers and inhibitors of intermodal rail freight between Asia and Europe. J. Rail Transp. Plan. Manag. 2014, 4, 70–86. [Google Scholar] [CrossRef]
  27. Islam, D.M.Z.; Zunder, T.H.; Jackson, R.; Nesterova, N.; Burgess, A. The potential of alternative rail freight transport corridors between Central Europe and China. Transp. Probl. 2013, 8, 45–57. [Google Scholar]
  28. Rastogi, C.; Arvis, J. The Eurasian Connection Supply-Chain Efficiency along the Modern Silk Route through Central Asia; International Bank for Reconstruction and Development, World Bank: Washington, DC, USA, 2014; Available online: https://openknowledge.worldbank.org/bitstream/handle/10986/18779/888910PUB0Box300EPI199120June122014.pdf?sequence=1 (accessed on 29 April 2018).
  29. Bulis, A.; Skapars, R. Development of “New Silk Road” Northern branch through seaport of Riga in Latvia. Procedia-Soc. Behav. Sci. 2014, 150, 1222–1229. [Google Scholar] [CrossRef]
  30. Regmi, M.B.; Hanakoka, S. Assessment of intermodal transport corridors: Cases from North-East and Central Asia. Res. Transp. Bus. Manag. 2012, 5, 27–37. [Google Scholar] [CrossRef]
  31. Wang, Y.; Yeo, G.-T. A Study on International Multimodal Transport Networks from Korea to Central Asia: Focus on Secondhand Vehicles. Asian J. Shipp. Logist. 2016, 32, 41–47. [Google Scholar] [CrossRef]
  32. Wang, Y.; Yeo, G.-T. Intermodal route selection for cargo transportation from Korea to Central Asia by adopting Fuzzy Delphi and Fuzzy ELECTRE I methods. Marit. Policy Manag. 2018, 45, 3–18. [Google Scholar] [CrossRef]
  33. Yousefi, H. Strategic Planning for Port Development: Improvement of Container Transit from the Iranian Southern Ports Terminals. TransNav, Int. J. Mar. Navig. Saf. Sea Transp. 2013, 7, 433–440. [Google Scholar] [CrossRef] [Green Version]
  34. Sayareh, J. Chabahar port vs. Gwadar port: A logistics performance comparison. In Proceedings of the International Association of Maritime Economists (IAME) 2016 Conference, Hamburg, Germany, 23–26 August 2016. paper ID: 112. [Google Scholar]
  35. Anwar, Z. Development of infrastructural linkages between Pakistan and Central Asia. South Asian Stud. 2011, 26, 103–115. [Google Scholar]
  36. Masood, M.T.; Farooq, M.; Hussain, S.B. Pakistan’s potential as a transit trade corridor and transportation challenges. Pak. Bus. Rev. 2016, 18, 267–289. [Google Scholar] [CrossRef]
  37. Khan, S.A. Geo-economic imperatives of Gwadar Sea Port and Kashgar Economic Zone for Pakistan and China. IPRI J. 2013, 13, 87–100. [Google Scholar]
  38. Li, K.X.; Jin, M.; Qi, G.; Shi, W.; Ng, A.K.Y. Logistics as a driving force for development under the Belt and Road Initiative—the Chinese model for developing countries. Transp. Rev. 2017, 38, 457–478. [Google Scholar] [CrossRef]
  39. Lee, P.T.-W.; Hu, Z.-H.; Lee, S.-J.; Choi, K.-S.; Shin, S.-H. Research trends and agenda on the Belt and Road (B&R) initiative with a focus on maritime transport. Marit. Policy Manag. 2018, 45, 282–300. [Google Scholar] [CrossRef]
  40. Wang, J.J.; Yau, S. Case studies on transport infrastructure projects in belt and road initiative: An actor network theory perspective. J. Transp. Geogr. 2018, 71, 213–223. [Google Scholar] [CrossRef]
  41. Sheu, J.B.; Kundu, T. Forecasting time-varying logistics distribution flows in the One Belt–One Road strategic context. Transp. Res. 2018, 117E, 5–22. [Google Scholar] [CrossRef]
  42. Wang, S.; Yang, D.; Lu, J. A connectivity reliability-cost approach for path selection in the maritime transportation of China’s crude oil imports. Marit. Policy Manag. 2018, 45, 567–584. [Google Scholar] [CrossRef]
  43. Shao, Z.-Z.; Ma, Z.-J.; Sheu, J.-B.; Gao, H.O. Evaluation of large-scale transnational high-speed railway construction priority in the belt and road region. Transp. Res. 2018, 117E, 40–57. [Google Scholar] [CrossRef]
  44. Yang, D.; Pan, K.; Wang, S. On service network improvement for shipping lines under the one belt one road initiative of China. Transp. Res. 2018, 117E, 82–95. [Google Scholar] [CrossRef]
  45. Yang, D.; Jiang, L.; Ng, A.K.Y. One Belt one Road, but several routes: A case study of new emerging trade corridors connecting the Far East to Europe. Transp. Res. 2018, 117A, 190–204. [Google Scholar] [CrossRef]
  46. Japan External Trade Organization (JETRO). Rail and Air Transport to the Moscow and Siberia Region via Russian Far Eastern Customs. 2010. Available online: https://www.jetro.go.jp/ext_images/jfile/report/07000390/russia_foodexport.pdf (accessed on 29 April 2018). (In Japanese)
  47. Pleis, L.; Lliteras, R.; David, W.; Bain, M.; Hendrickson, S. The Afghanistan National Railway A Plan of Opportunity. 2014. Available online: http://ndupress.ndu.edu/Portals/68/Documents/jfq/jfq-75/jfq-75_19-27_Pleis-et-al.pdf (accessed on 31 December 2016).
  48. Pakistan Bureau of Statistics, Government of Pakistan. Pakistan Statistical Year Book 2016. Available online: http://www.pbs.gov.pk/sites/default/files//PAKISTAN%20STATISTICAL%20YEAR%20BOOK%2C%202016.pdf (accessed on 17 July2019).
  49. Neelum, N. CPEC: Gwadar Port Becomes Operational for Container Vessels. Issue Brief, Institute of Strategic Studies Islamabad. 27 March 2018. Available online: http://issi.org.pk/wp-content/uploads/2018/03/IB_Neelum_March_27_2018.pdf (accessed on 19 August 2019).
  50. Ministry of Railways, Government of Pakistan. Pakistan Railways Year Book 2014–15. Available online: https://www.docdroid.net/t84Dro5/pak-railways.pdf.html (accessed on 29 April 2018).
  51. China Pakistan Economic Corridor (CPEC). CPEC Infrastructure Projects Website. Available online: http://cpec.gov.pk/infrastructure (accessed on 29 April 2018).
  52. Shibasaki, R.; Usami, T.; Furuichi, M.; Teranishi, H.; Kato, H. How do the new shipping routes affect Asian LNG markets and economy?—Case of the Northern Sea Route and Panama Canal Expansion. Marit. Policy Manag. 2018, 45, 543–566. [Google Scholar] [CrossRef]
  53. Dial, R. A probabilistic multipath traffic assignment algorithm which obviates path enumeration. Transp. Res. 1971, 5, 83–111. [Google Scholar] [CrossRef]
  54. MDS Transmodal Inc. MDS Containership Databank; MDS Transmodal Inc.: Chester, UK, 2013. [Google Scholar]
  55. Sheffi, Y. Urban Transportation Networks: Equilibrium Analysis with Mathematical Programming Methods; Prentice-Hall, Inc.: Englewood Cliffs, NJ, USA, 1985. [Google Scholar]
  56. World Bank Group, Doing Business Website “Trading Across Borders” 2015 Rank. Available online: http://www.doingbusiness.org/data/exploretopics/trading-across-borders (accessed on 15 September 2015).
  57. American Digital Cartography Inc. (ADC). ADC World Map Version 4.0; ADC: Appleton, WI, USA, 2005. [Google Scholar]
  58. IHS, Inc. World Trade Service (WTS) Database. Available online: https://ihsmarkit.com/products/world-trade-service.html (accessed on 21 May 2015).
  59. United Nations. UN Comtrade Database. Available online: https://comtrade.un.org/ (accessed on 21 May 2015).
  60. Ministry of National Economy of the Republic of Kazakhstan Committee on Statistics. The Official Statistical Information, Operational Data. 2015. Available online: http://stat.gov.kz/faces/publicationsPage/publicationsOper?_adf.ctrl-state=bm75ob63i_17&_afrLoop=16789316187516983 (accessed on 29 April 2018).
  61. National Statistics Committee of the Kyrgyz Republic. Kyrgyzstan in Figures 2013. Available online: http://www.stat.kg/media/publicationarchive/6a89fb49-cc30-4ead-8c47-d53810976f17.pdf (accessed on 29 April 2018). (In Russian)
  62. Agency on Statistics under President of the Republic of Tajikistan. Socio-Economic Situation in Tajikistan January–December 2013. Available online: http://www.stat.tj/ru/img/a6069090cb7edbe5efb67aec241e9816_1359030405.pdf (accessed on 29 April 2018). (In Russian)
  63. State Committee of the Republic of Uzbekistan on Statistics. Uzbekistan in Figures: Statistical Yearbook 2013; State Committee of the Republic of Uzbekistan on Statistics: Tashkent, Uzbekistan, 2013.
  64. National Institute of State Statistics and Information of Turkmenistan. Social-Economic Situation of Turkmenistan in 2001; State Committee of the Republic of Uzbekistan on StatisticsNational Institute of State Statistics and Information of Turkmenistan: Ashgabat, Turkmenistan, 2001. (In Russian)
  65. Central Statistics Organization, Government of Afghanistan. Statistical Yearbook 2014–2015. Available online: http://www.mrrd.gov.af/nabdp/Provincial%20Development%20Plan.htm (accessed on 26 September 2015).
  66. Bengali, K.; Sadaqat, M. Regional Accounts of Pakistan: Methodology and Estimates, 1973–2000; Social Policy and Development Centre: Karachi, Pakistan, 2005; Available online: http://www.spdc.org.pk/Data/Publication/PDF/WP5.pdf (accessed on 29 April 2018).
  67. Pakistan Bureau of Statistics. Area and Population of Administrative units by rural/urban: 1951–1998 Censuses. Available online: http://www.pbs.gov.pk/sites/default/files/population_census/Administrative%20Units.pdf (accessed on 31 December 2016).
  68. Federal State Statistics Service, Russian Federation. The Gross Regional Product of the Subjects of the Russian. Available online: http://mrd.gks.ru/wps/wcm/connect/rosstat_ts/mrd/ru/statistics/grp/ (accessed on 29 April 2016).
  69. National Bureau of Statistics of China. China Statistical Yearbook 2015. Available online: http://www.stats.gov.cn/tjsj/ndsj/2015/indexeh.htm (accessed on 29 April 2018).
  70. Shibasaki, R.; Kawasaki, T. A transhipment hub in South Asia and its competition: Application of network equilibrium assignment model for global maritime container shipping. Asian Transp. Stud. 2019, 5, 546–569. [Google Scholar] [CrossRef]
Figure 1. Main access routes to the seaports to/from Central Asia (CA). Source: Compiled by the authors.
Sustainability 11 05757 g001
Figure 2. Land transport networks connected with the Arabian Sea coastal ports. Source: Compiled by the authors based on the CA Regional Economic Cooperation (CAREC) programme.
Sustainability 11 05757 g002
Figure 3. The two-layered network assignment model (NAM) structure. Source: Compiled by the authors, based on Shibasaki and Kawasaki [7].
Sustainability 11 05757 g003
Figure 4. Network structure of a maritime container shipping (MS) submodel [6].
Sustainability 11 05757 g004
Figure 5. Network structure of a hinterland transport (HT) submodel [7].
Sustainability 11 05757 g005
Figure 6. HT network in the NAM. Source: Compiled by the authors, based on ADC WorldMap [57].
Sustainability 11 05757 g006
Figure 7. Comparison of the observed and model-estimated transshipped containers at global hub ports. Source: Compiled by the authors.
Sustainability 11 05757 g007
Figure 8. Comparison of the observed and model-estimated export container throughputs of gateway seaports. Source: Compiled by the authors.
Sustainability 11 05757 g008
Figure 9. Comparison of the observed and model-estimated import container throughputs of gateway seaports. Source: Compiled by the authors.
Sustainability 11 05757 g009
Figure 10. Breakdown of the container throughput at gateway seaports by partner region and by country. Source: Compiled by the authors.
Sustainability 11 05757 g010
Figure 11. Breakdown of the container throughput at gateway seaports by partner regions for Afghan containers. Source: Compiled by the authors.
Sustainability 11 05757 g011
Figure 12. Estimated container flow differences between scenario s4 and the base scenario (s0). Source: Compiled by the authors.
Sustainability 11 05757 g012
Figure 13. Regional breakdown of the partner ports for maritime containers in Pakistani ports in scenario s2 and s6. Source: Compiled by the authors.
Sustainability 11 05757 g013
Table 1. Cargo volume handled at the major ports in Pakistan, 2015–2016.
PortCargo TypeDraftImportExportTotalAnnual Capacity
Unit (Cargo: Million Tonnes, Container: Million TEUs)
KarachiCargo10–13 m40.3 *9.78 *50.0 *N/A
Container13 m1.010.8971.901.78
Port QasimCargo10–13 m25.7 *7.44 *33.2 *63
Container12, 13 m0.5560.5681.122.03
GwadarCargo12.5 mN/AN/A0.00360 **N/A
Container12.5 mN/AN/A0.000145 **N/A
* The tonnage of cargo, including that of containers. ** The annual cargo tonnage of the Gwadar Port was reported in 2017. Sources: several studies [48,49], the authors’ interview and the website of each port authority.
Table 2. Zonal division into the sub-country level and representative economy indices by the zone of each country in the HT submodel.
CountryNumber of Sub-countries (zones)Zone LevelRepresentative of Zonal EconomySource
Kazakhstan14Oblast levelImport: zonal value of imports (2013)[60]
Export: zonal value of manufacturing production (2013)
Kyrgyz8Oblast levelGross Regional Product (2012)[61]
Tajikistan5Province levelGross Regional Product (2012)[62]
Uzbekistan13Province levelGross Regional Product (2012)[63]
Turkmenistan6Province levelPopulation (2001)[64]
Afghanistan7United Nation region levelPopulation (2014–2015 estimates)[65]
Pakistan31Division levelGross Regional Product (2000) at the province level and population (1998) at the division level[66,67]
Russia8Federal district levelGross Regional Product (2009)[68]
China31Province levelregional value of exports and imports (2014)[69]
Armenia, Azerbaijan, Belarus, Estonia, Georgia, Iran, Latvia, Lithuania, Moldova, Mongolia and Ukraine1Country level--
Table 3. Scenarios involving the intermodal network improvement in and around Pakistan.
Scenario CodeScenario ConditionDescription
s0Base scenarioIn addition to the original settings prepared in this model, the changes in the border barriers since 2013 are considered
s1Gwadar Port openingIn addition to s0,
the opening of Gwadar Port (12 services calling), with hinterland connection by road, is considered
s2Rail construction within PakistanIn addition to s1,
the increase in the service frequency of the existing rail network (from 5 to 50 trains/week) and
new rail construction (10 trains/week) in the whole of Pakistan, except for the CPEC, are considered
s3International rail connection with neighbouring countriesIn addition to s2,
the opening of the planned railway along the CAREC corridor 5, outside Pakistan, except for the CPEC (10 trains/week),
and other planned railways in Afghanistan, Iran and the South Caucasus (at the same level of frequency as the existing rail service in each country) are considered
s4The CPEC railway openingIn addition to s3,
the opening of the CPEC railway (10 trains/week) is considered
s5CAREC border reductionIn addition to s4,
the CAREC border barriers decline to half of the current level is considered
s6CAREC border removalIn addition to s4,
the CAREC border barriers decline to zero is considered
Source: Compiled by the authors.
Table 4. Estimated annual throughputs of export/import containers in Gwadar Port by origin/destination country in the hinterland by scenario (TEU).
ExportImport
s1s2s3s4s5s6 *s1s2s3s4s5s6 *
Russia00025492854310001157124616,697
China00091742106479000209427492963
CA countries
(except Afghanistan)
039632073695650168929378030892910,917
Afghanistan0389483798631484025683015308231063769
South Caucasus Countries000001068000002554
Pakistan213017,56217,11521,50020,69522,0742410809981719595988618,687
Total213017,99017,66123,67626,83236,101241012,35614,12323,95725,91655,587
* not converged. Source: Compiled by the authors.
Table 5. Estimated changes in annual throughputs by region and by scenario, compared to the base scenario (s0).
ExportImport
s1s2s3s4s5s6 *s1s2s3s4s5s6 *
Far Eastern Russian Ports−201−22−233−2141−19,646−23,954−357−134−275−4320−8963−94,906
Chinese Ports3411207−10,395−4309−5021171−108941−16,387−23,438105,850
Pakistani Ports−2071,126572818,31737,513120,739402636116,69443,68086,489292,128
Iranian Port−1651−2127−2935−2977−3398−14,6992103−3805−1709−2508−10,206−67,781
Black Sea Ports2218103−709−2654−4183−24,9103012−6035−14,424−19,624−41,613−28,549
Baltic Sea Ports−500800−1858−151−5977−52,155−53314702−328−840−2267−206,742
* Not converged. Source: Compiled by the authors.

