Article

A New Eco-Friendly Porous Asphalt Mixture Modified by Crumb Rubber and Basalt Fiber

College of Transportation, Jilin University, Changchun 130025, China
*
Author to whom correspondence should be addressed.
Sustainability 2019, 11(20), 5754; https://doi.org/10.3390/su11205754
Submission received: 10 September 2019 / Revised: 8 October 2019 / Accepted: 16 October 2019 / Published: 17 October 2019

Abstract

:
In this paper, the performance of environmentally friendly porous asphalt mixture was optimized by the response surface method. Taking the asphalt-aggregate ratio, crumb-rubber content, and basalt fiber content as the independent variables, the air void, Marshall stability, flow value, Marshall quotient, and Cantabro particle loss are the response values. The best model was determined by fitting the experimental data. After the influence of the independent variables on the response values was clarified, the models were used to optimize the dosage of the asphalt, crumb rubber, and basalt fiber through comprehensive analysis. The results showed that the application of the response surface method can complete the establishment of the models and the optimization of the performance of the porous asphalt mixture with sufficient accuracy. The optimum dosage of the asphalt to aggregate ratio, crumb rubber, and basalt fiber is 4.51%, 11.21%, and 0.42%, respectively. The high-temperature stability, low-temperature crack resistance, water stability, and Cantabro particle loss resistance of the optimized porous asphalt mixture were effectively improved, which provides a reference for the construction of eco-friendly pavement.

1. Introduction

Porous asphalt mixture (PAM) has been widely studied worldwide due to its superior permeability and noise reduction performance [1,2,3,4]. The application of permeable pavement in urban roads can not only improve the rainy driving safety and increase the comfort of pedestrian travel, but also accelerate the urban water cycle, reduce the probability of urban waterlogging, and decrease the adverse impact of urbanization on the natural environment [5]. The State Council of China has also begun to vigorously promote the construction of sponge cities since 2015. Many southern cities in China have adopted the design of permeable asphalt pavement, which has achieved excellent pavement performance and ecological effect in the early stage. Despite its many advantages, the PAM has inferior strength compared with traditional asphalt concrete (AC) owing to its inherent large void structure. In the practical application of permeable pavement, the water stability and the adhesion of aggregate to asphalt of PAM have higher requirements, which limits the application of the porous asphalt mixture to a certain extent [6,7]. In view of this inherent shortcoming of PAM, many scholars have conducted a large number of experimental studies from the perspective of applying modifiers.
The modifiers currently used in PAMs mainly include fibers, epoxy resins, crumb rubber, etc. [8,9,10,11,12,13]. Crumb rubber is produced from used tires and there are approximately 140 million used tires generated per year in China. However, the recycling rate is only 45%, which puts tremendous pressure on the natural environment. Therefore, applying crumb rubber to pavement materials can reduce environmental pollution to a certain extent and improve the sustainability of social development. It is worth mentioning that there have been many studies showing that crumb rubber can improve the performance of PAM more comprehensively. Specifically, Jiao et al. [14] researched the failure mode of SBS (styrene-butadiene-styrene)-modified PAM and SBS-crumb-rubber modified PAM by compression and splitting experiments, the results showed that PAM modified by crumb rubber has a more uniform structure and more stable performance. Xie et al. [15] studied the pavement performance of crumb rubber-modified PAM in a long-term operation stage and the results showed that the pavement still showed good anti-rutting performance after five years of operation. Sangiorgi et al. [16] conducted a comprehensive evaluation of the performance of a crumb rubber-modified asphalt mixture. The results showed that although the application of rubber powder reduces the permeability of PAM, it increases the adhesion between the binder and aggregate and decreases the Cantabro particle loss of the mixture. At the same time, the rubber powder-modified asphalt mixture improves its low-temperature crack resistance. The above studies have proved the beneficial effect of crumb rubber on PAM. However, the considerations are relatively simple, and it is impossible to combine various factors to determine the optimum amount of crumb rubber.
Fiber-based modifiers have been extensively studied in PAMs [17,18]. It is worth mentioning that basalt fiber is gradually used in modified asphalt mixture due to its high strength, good corrosion resistance, and high-temperature resistance. Cheng et al. [19] determined that the optimum dosage of diatomite and basalt fiber in an asphalt mixture was 14% and 0.32%, respectively, through an orthogonal experimental design. It was found that basalt fiber significantly improves the low-temperature crack resistance of the asphalt mixture through the analysis of mechanical properties. Wang et al. [20] studied the decay of various properties of a basalt fiber-modified asphalt mixture after freeze-thaw cycles. The results showed that the basalt fiber-modified asphalt mixture has better mechanical properties than the unmodified asphalt mixture before and after the freeze-thaw cycles. In addition, the basalt fiber-modified asphalt mixture reduced the damage degree by 25% and the damage growth rate by 45% according to the logistic damage models. Wu et al. [21] studied the low-temperature crack resistance of different fiber-modified asphalt concrete by a three-point bending test. The results showed that the low-temperature crack resistance of the basalt fiber-modified asphalt mixture is more significant compared with polyester fiber and lignin fiber. It can be seen that basalt fiber can improve the low-temperature crack resistance of the asphalt mixture. However, most of the current research was to apply basalt fiber to the traditional asphalt mixture, and there is almost no research on PAM. Therefore, the research of basalt fiber-modified porous asphalt mixture provides a new reference for promoting the application of permeable pavement.
As a by-product of steel production, hundreds of millions of tons of steel slag is produced per year in China. However, its utilization rate is about 10%. The accumulation of a large amount of steel slag wastes land resources and also causes environmental pollution. According to the previous research of our group [22], the porous asphalt mixture made of steel slag has good mechanical properties. Therefore, the use of steel slag for pavement materials can not only obtain good pavement performance, but it also reduces environmental pollution and increases resource utilization.
Response surface methodology (RSM) is a regression design method based on the statistical analysis of data, including experimental design, model establishment, model checking, and process optimization [23]. In the process of data analysis, not only can the relationship between the independent variable and the response value be clearly described, but the influence of the interaction between the two variables on the response value can also be fully reflected. Therefore, the response surface method has been widely used in the optimization design of asphalt mixtures [24,25,26,27].
This paper aims to produce a new eco-friendly porous permeable asphalt mixture with basalt fiber and crumb rubber as modifiers, determine the optimum amount of modifiers by using RSM, further optimize the performance of PAM, and expand the scope of its application.

2. Materials and Methods

2.1. Raw Materials

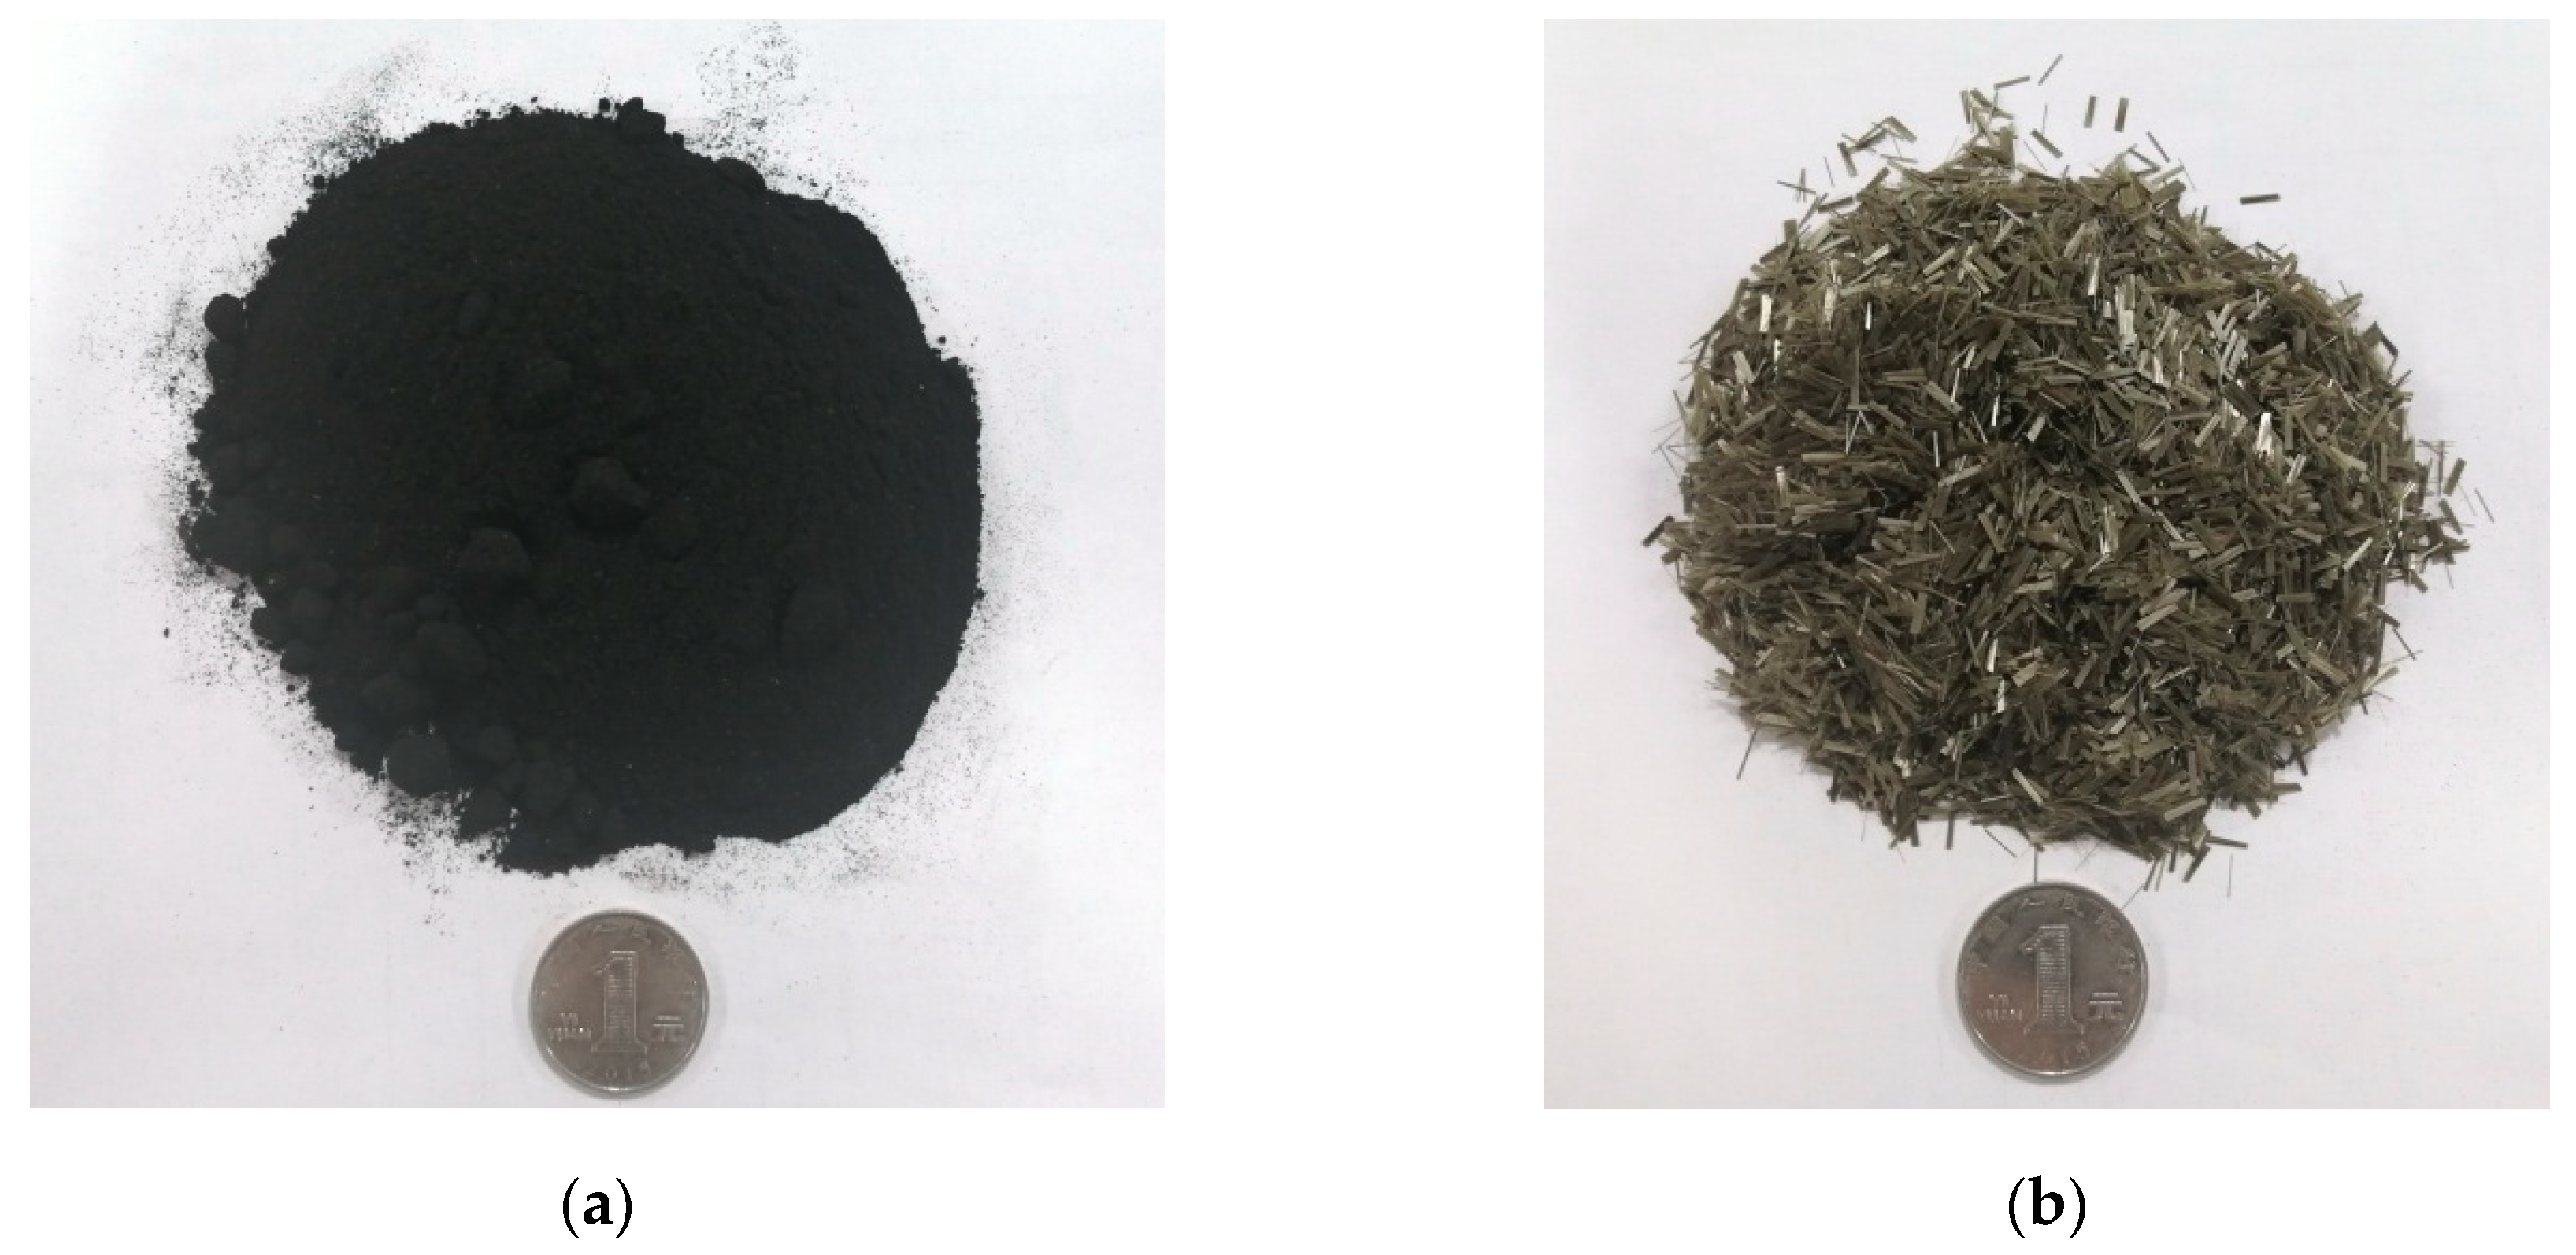
The binder used in this study was SBS-modified bitumen. The amount of SBS modifier is 4%, which is produced in Panjin City, Liaoning Province, China, and its main indicators are shown in Table 1. The aggregate used in this study was steel slag, and the filler was limestone powder, all of which are produced in Jilin City, Jilin Province, China, their main physical and mechanical properties are shown in Table 2. The rubber powder used was produced in Changchun City, Jilin Province, China, and its main physical properties are shown in Table 3. In addition, the basalt fiber used in this study was produced in Jilin City, Jilin Province, China, its main physical indicators are shown in Table 4. The appearance of crumb rubber and basalt fiber is shown in Figure 1.

2.2. Response Surface Methodology

In this study, the face-centered central composite design (FCCD) was used. First, the asphalt to aggregate ratio (A), crumb-rubber content (B), and basalt fiber content (C) were determined as three independent variables. Then, based on our previous study [22,25,28], the asphalt to aggregate ratio was determined at 4.0, 4.5, and 5.0, and crumb rubber to asphalt ratio was 8%, 10%, and 12%. Basalt fiber content was 0.25%, 0.40%, and 0.55% in relation to the asphalt mixture.
Air void content is a very important volume indicator for asphalt mixes and it greatly affects the mechanical properties of mixture. In addition, the size of air void determines the quality of permeability for permeable asphalt mixture. Marshall stability is an important mechanical indicator of asphalt mixtures. Additionally, there must be sufficient adhesion between the binder and aggregate in the PAM. If the adhesion is insufficient, not only will the strength of the mixture be lowered, but the aggregate on the surface of pavement will also fall off, thereby affecting water permeability. The Cantabro particle loss test was used to evaluate the adhesion between aggregate and asphalt. In summary, the air void, Marshall stability, flow value, Marshall quotient, and Cantabro particle loss were selected as response values.
There were 19 experimental groups designed using Design Expert 8.0 software (Stat-Ease, Inc., Minneapolis, MN, USA). Five of them were set to the “center point” in response surface design, that is, the amount of all modifiers in each group was the same, which was to correct the error during experiment. The numbers of these five groups are 8, 9, 14, 15, and 18. The remaining 14 groups were used to explore the relationship between the independent variables and the response values. Each experimental group consisted of six specimens, three of which were tested for volume index and Marshall stability, and three for Cantabro particle loss test. A total of 114 standard Marshall specimens were prepared in the experiment.

2.3. Specimen Preparation and Experiment

2.3.1. Specimen Preparation

The aggregate gradation of PAM in this experiment is shown in Figure 2. First, the mass of the aggregate, mineral powder, crumb rubber, and basalt fiber were accurately weighed, then the weighed aggregate and the mineral powder were held in an oven at 175 °C for five hours while the SBS-modified asphalt was melted to a flowing state in an oven at 175 °C. According to the Standard Test Methods of Bitumen and Bituminous Mixtures for Highway Engineering (JTG E20-2011) [29], the production process of the test piece is as follows:
Step1: Place the aggregate immediately in a mixing pot at 175 °C while adding the corresponding basalt fiber. Start the mixing pot and stir for 90 s.
Step2: According to the mass calculated in the corresponding experimental group, add the SBS-modified asphalt and stir for another 90 s.
Step3: Add the corresponding crumb rubber and mineral powder, stir for 90 s to obtain a mixed PAM.
Step4: Use a standard Marshall compacting hammer to compact the specimen 50 times per side.
The heights of the specimens used in this experiment were all in the range of 63.5 ± 1.3 mm.

2.3.2. Air Voids

The void characteristics of specimens were tested according to the Chinese standard (T 0705-2011), the calculation method is as shown in Equation (1):
V A = ( 1 γ f / γ t ) × 100
where γ f is the bulk specific gravity; γ t is the theoretical maximum specific density.

2.3.3. Marshall Stability Test (MS)

The MS test was carried out according to the Chinese standard (GB/T 0709-2011) and specific experimental steps refer to a previous study [22], the Marshall quotient can be calculated from the measured MS and flow value, its calculation method is shown in Equation (2):
M Q = M S / F V
where MS is the Marshall stability; and FV is the flow value.

2.3.4. Cantabro Particle Loss Test (CPL)

The CPL test was carried out according to the Chinese standard (T 0733-2011), and the adhesion between the binder and aggregate is characterized by the mass loss rate. Its specific experimental steps and calculation method refer to previous study [22].

3. Results and Discussion

3.1. Test Results

The independent variable parameters and results of the response values are shown in Table 5. As mentioned above, the asphalt to aggregate ratio (A), crumb rubber content (B), and basalt fiber content (C) are set as independent variables, and the air void (VA), Marshall stability (MS), flow value (FV), Marshall quotient (MQ), and Cantabro particle loss (CPL) are set as the response values.

3.2. Statistical Analysis and Discussion

Data results obtained from the experiments were further utilized to determine the suitable models by the sequential F-test, lack of fit tests, and the R2 value. Then the independent variable parameters were evaluated using the analysis of variance (ANOVA). Finally, the relationship between each response value and the independent variables is analyzed by the 3D model diagram.

3.2.1. Analysis of Air Voids (VA)

The ANOVA results of the air void model and the ANOVA results of the independent variables are shown in Table 6 and Table 7, respectively.
Table 6 illustrates that the quadratic model had a good fitting effect based on the experimental data. In the model, R2 was 0.9463, Adj. R2 was 0.8926, and their values are close to 1, which indicates that the model can reflect the inherent law between independent variables and response values well. Table 7 shows the results of ANOVA of the independent variables in the quadratic model, including the linear and quadratic terms of the asphalt to aggregate ratio (A), the crumb rubber content (B), the basalt fiber content (C), and the interaction between the three independent variables. The p-value represents the degree of influence of independent variable on response value, when the p-value is less than 0.05, there is a statistically significant relationship between the independent variable and the response value. Therefore, it can be seen in Table 7 that A, B, AB, and B2 are important factors affecting the air void model. Finally, by leaving out the insignificant factors, the quadratic equation for VA can be established as:
Y 1 = 1.22 + 2.97 A + 4.25 B 2.38 C 0.37 AB 2.43 AC + 0.03 BC 0.08 ( A ) 2 0.14 ( B ) 2 + 17.39 ( C ) 2
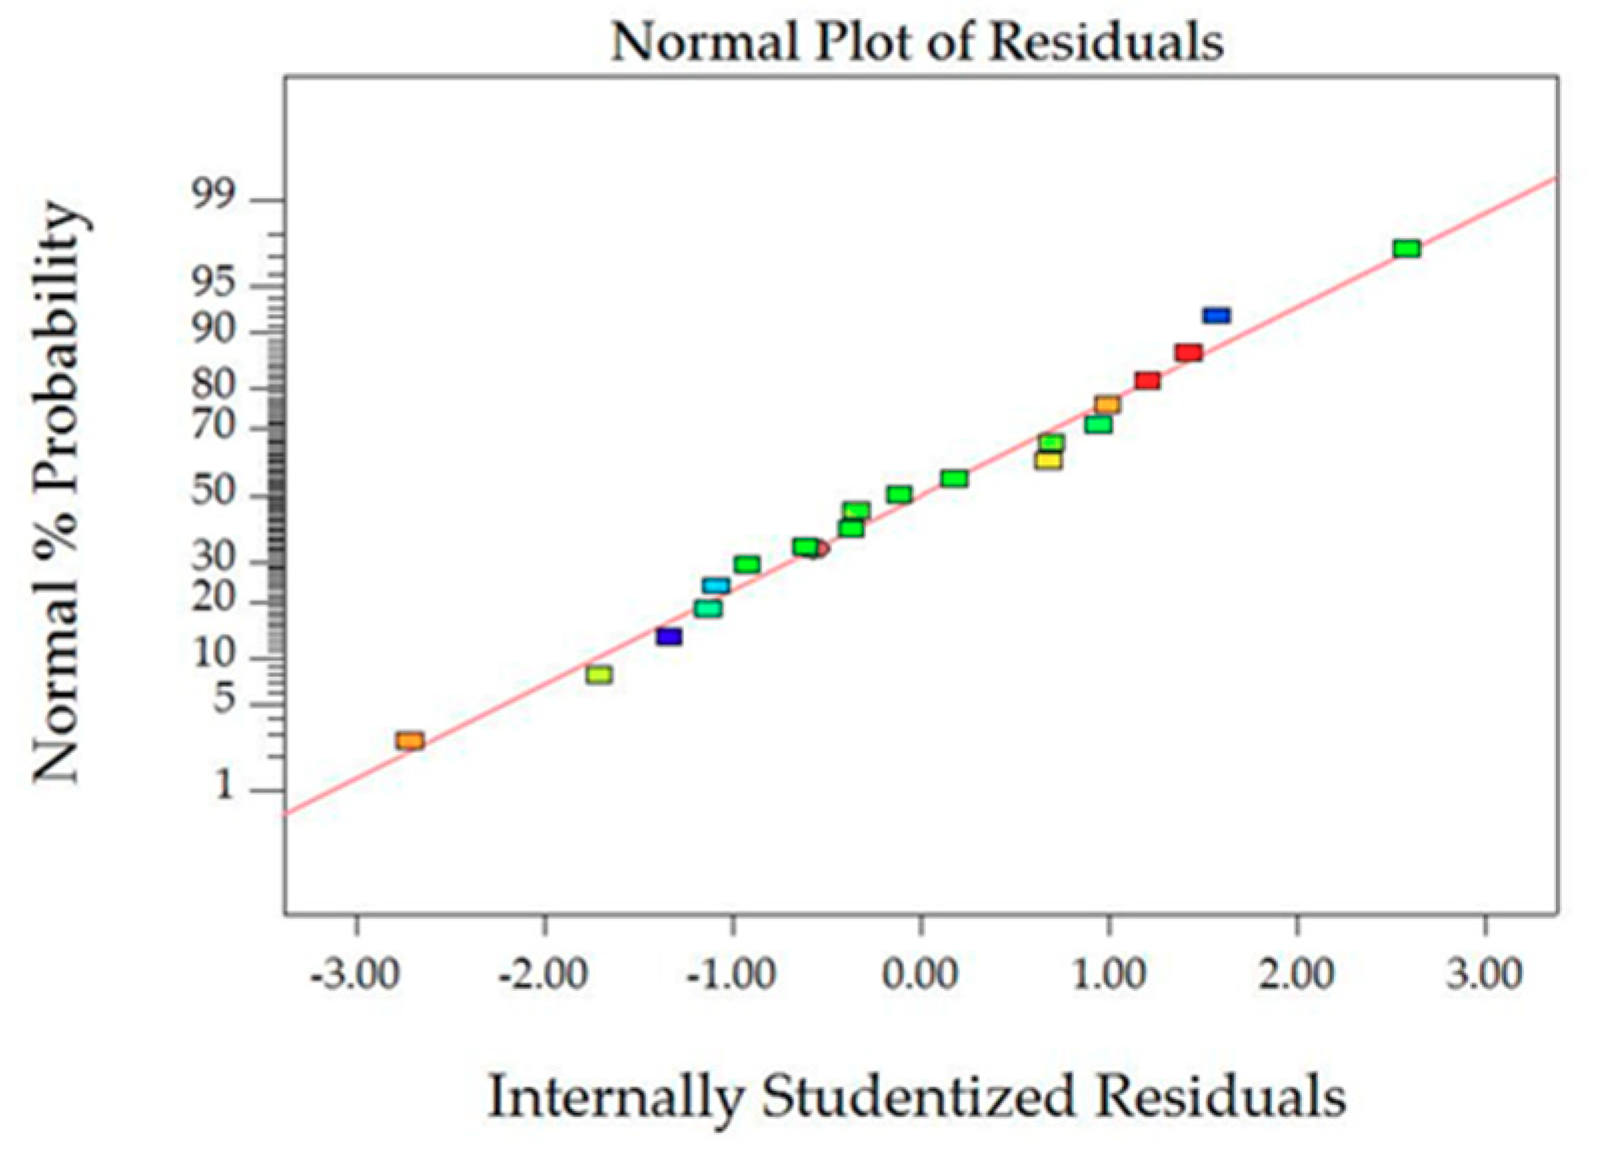
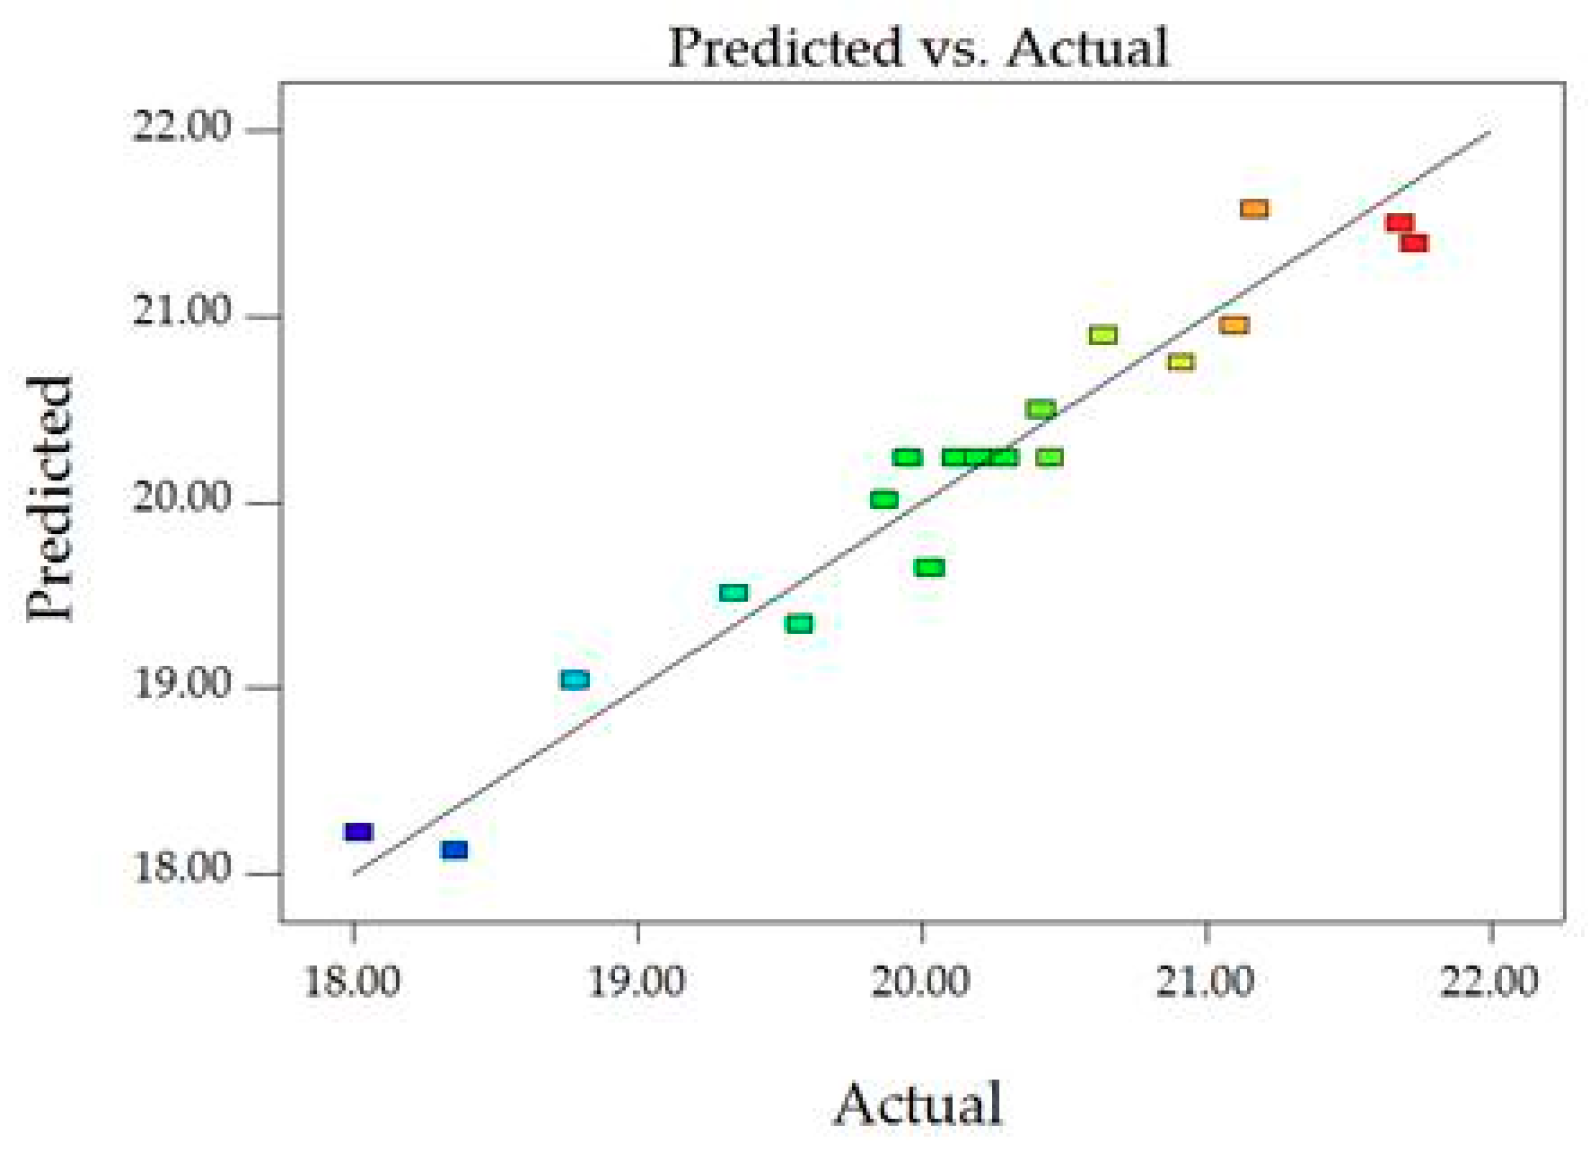
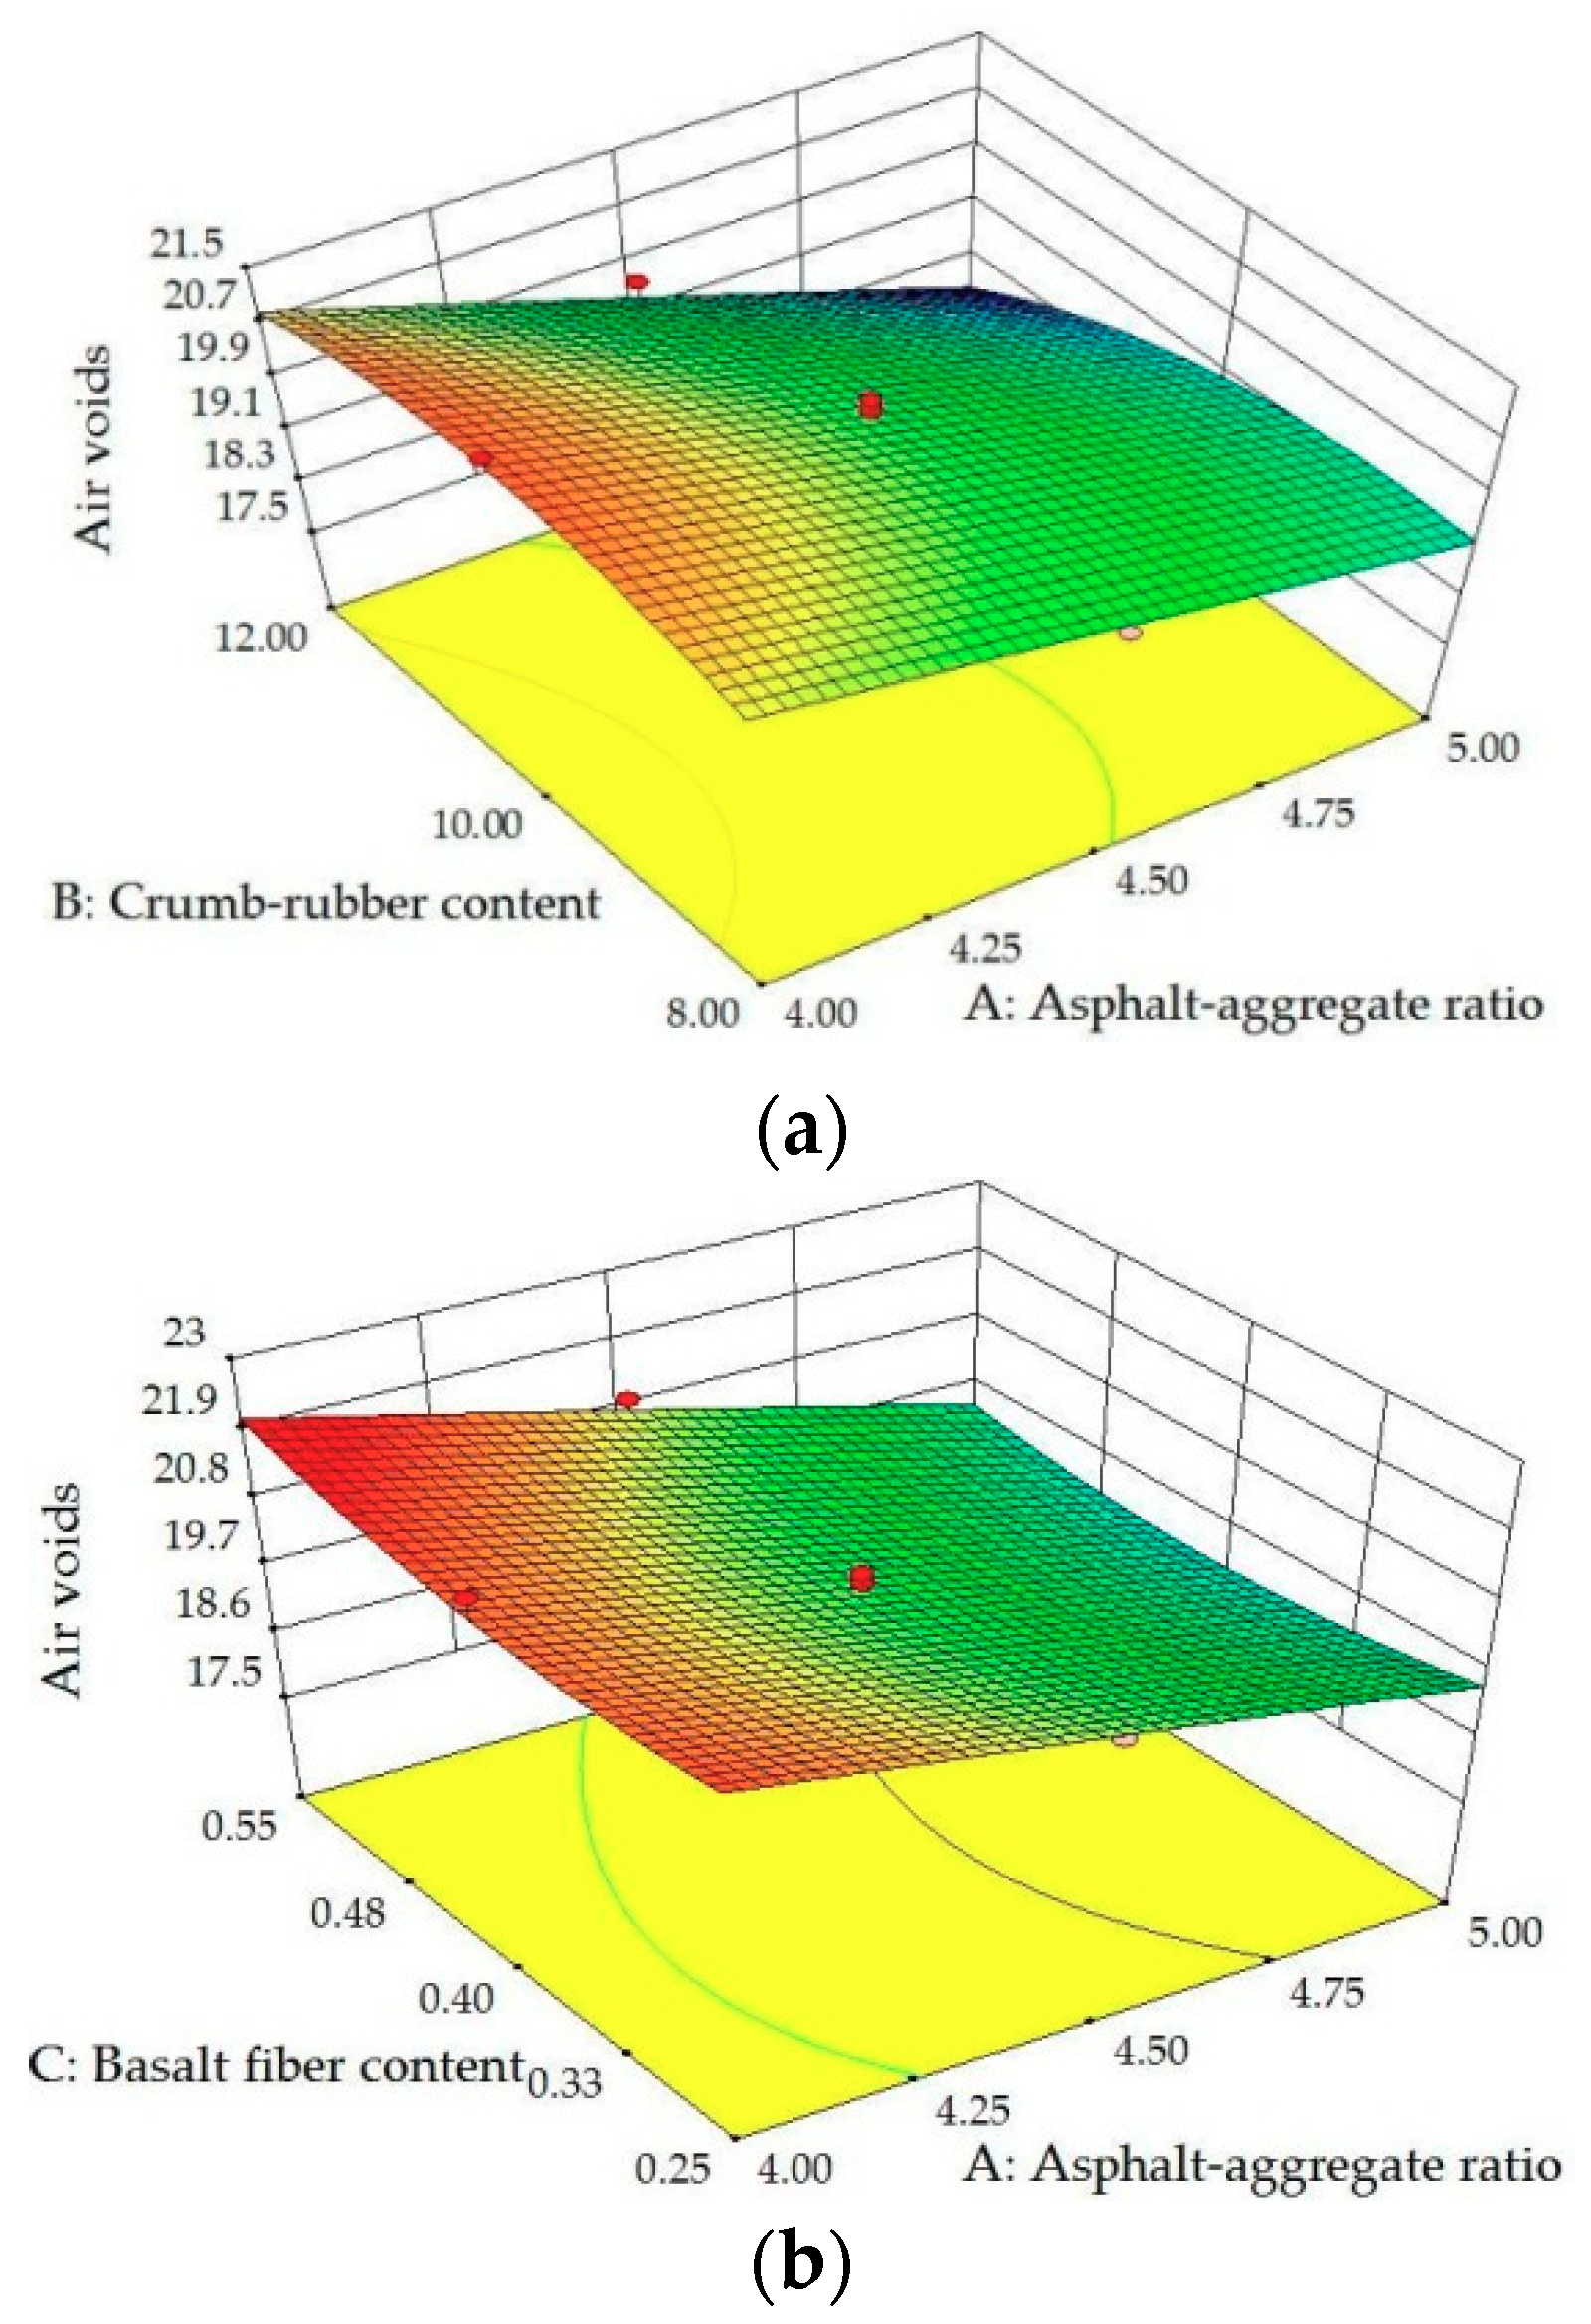
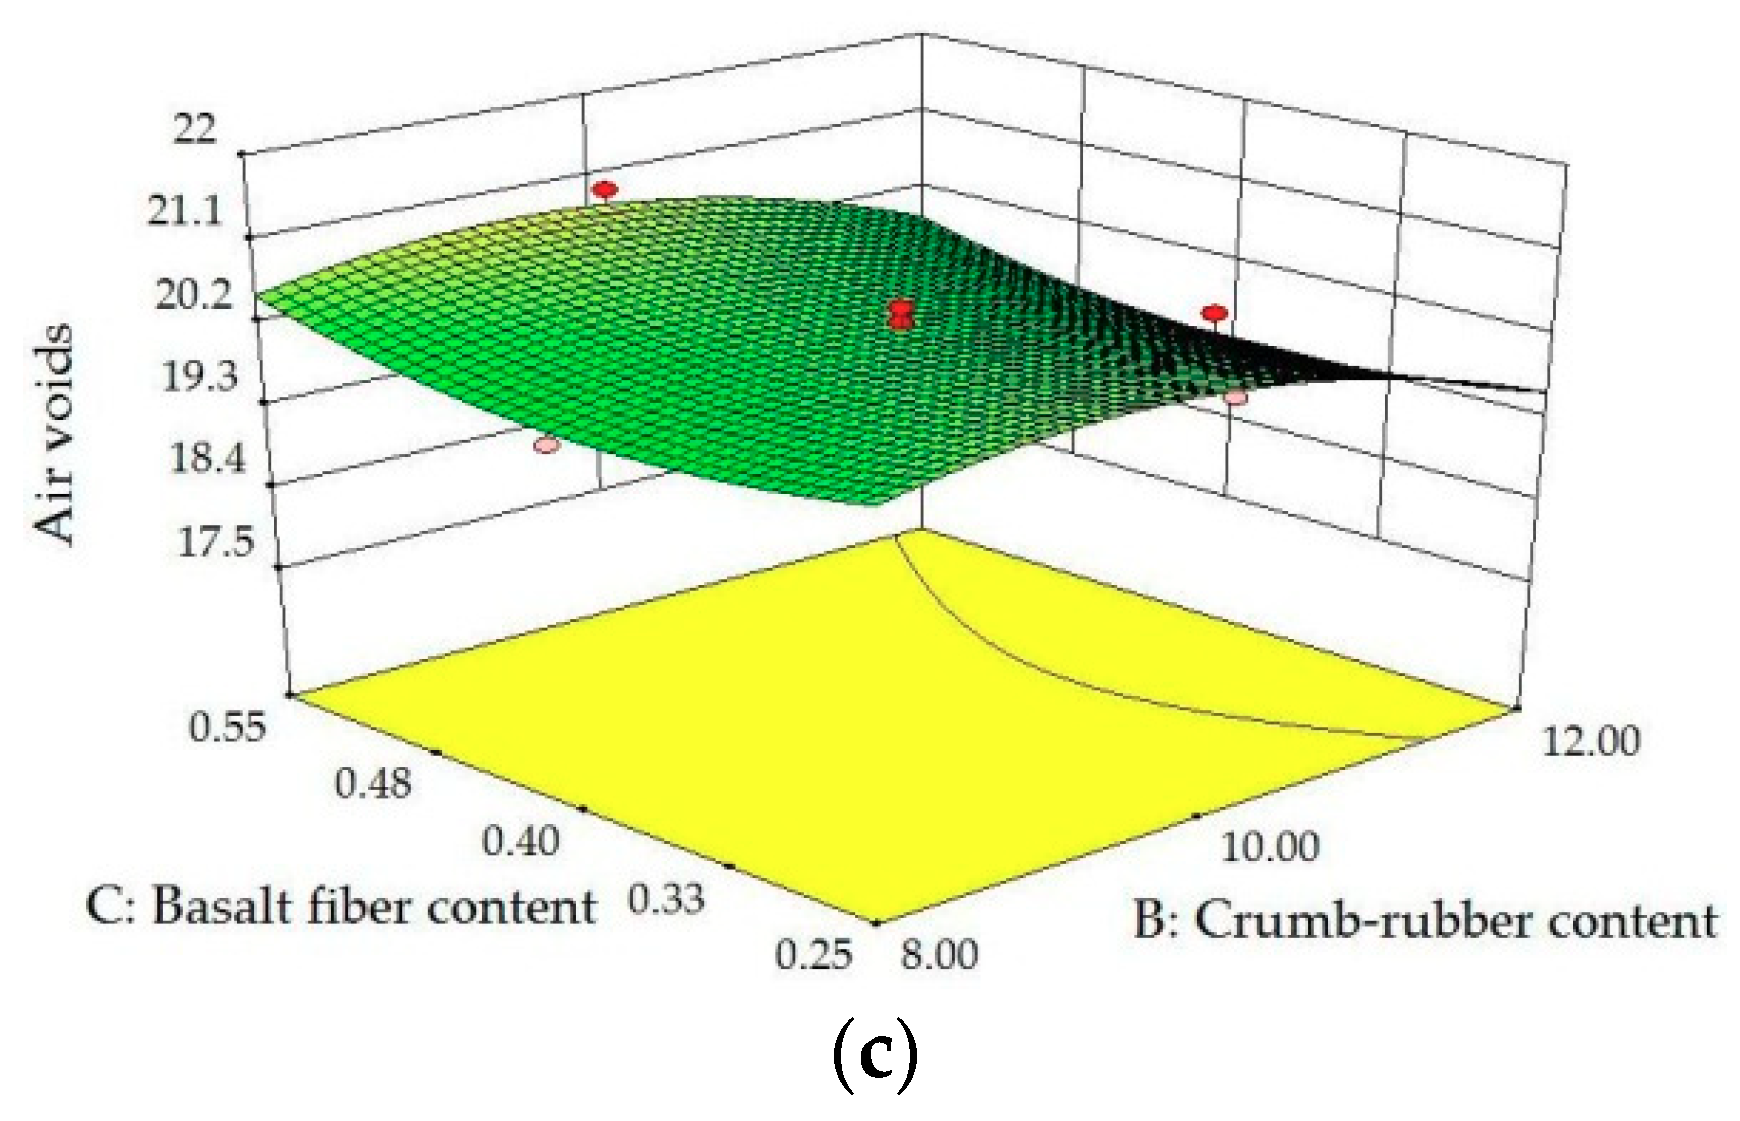
Figure 3 shows the residual normal distribution diagram of VA and Figure 4 shows the distribution of forecast and actual values of VA, these data basically fall into a straight line, which reveals that the model has sufficient accuracy and can be used to describe the relationship between VA and three factors well. Figure 5 shows a 3D model diagram of air voids with respect to the three independent variables, revealing the relationship between the air voids and the independent variables and the interaction between various factors.
As shown in Figure 5a,b, the asphalt to aggregate ratio is most pronounced with respect to the air voids. As the asphalt to aggregate ratio increases, the air voids of the PAM decreases. This is because, as the amount of asphalt increases, there is more free asphalt in addition to the structural asphalt wrapped on the aggregate surface, and these asphalt fill the voids in PAM, thereby reducing the air voids [30,31]. It can be seen in Figure 5a,c that as the rubber powder content increases, the air voids increase first, and then decrease. This is because when the amount of rubber powder is increased from 8% to 10%, it mainly reflects the viscosity-increasing effect on the asphalt, which makes the mixture more difficult to compact under the same conditions, resulting in an increase in voids. When the amount of rubber powder is increased from 10% to 12%, the air voids are reduced because more rubber powder fills the voids. The amount of basalt fiber has a little effect on the air voids.

3.2.2. Analysis of Marshall Stability (MS)

The ANOVA results of the MS model and the ANOVA results of the independent variables are shown in Table 8 and Table 9, respectively.
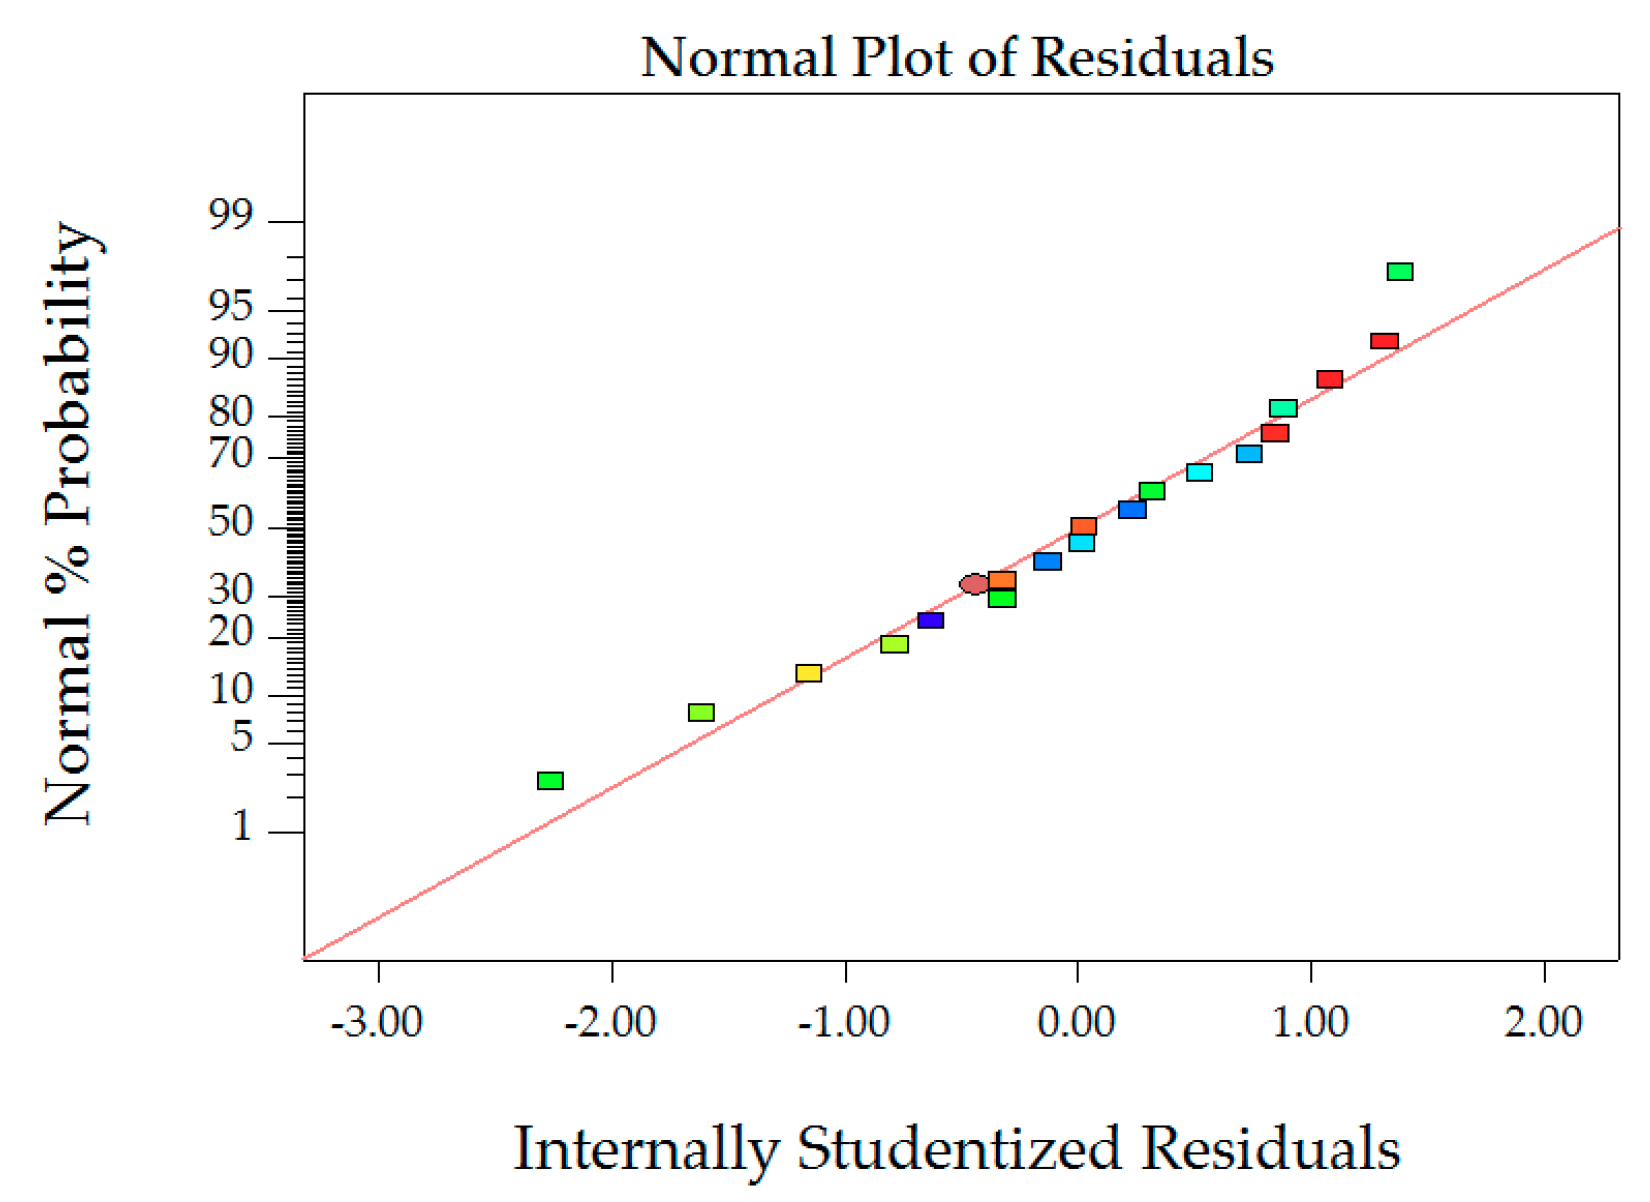
It can be seen from Table 8 that the quadratic model had a good fitting effect based on the experimental data. The model had an R2 of 0.9754 and an Adj. R2 of 0.9509. In Table 9, p values of A, C, A2, B2, and C2 are less than 0.05, which are important factors in the MS model. According to the least squares method, a fitted quadratic model expression is obtained, as shown in Equation (4):
Y 2 = 18.52 + 8.77 A + 0.71 B + 18.90 C 0.03 AB 0.23 AC + 0.05 BC 0.98 ( A ) 2 0.04 ( B ) 2 22.20 ( C ) 2
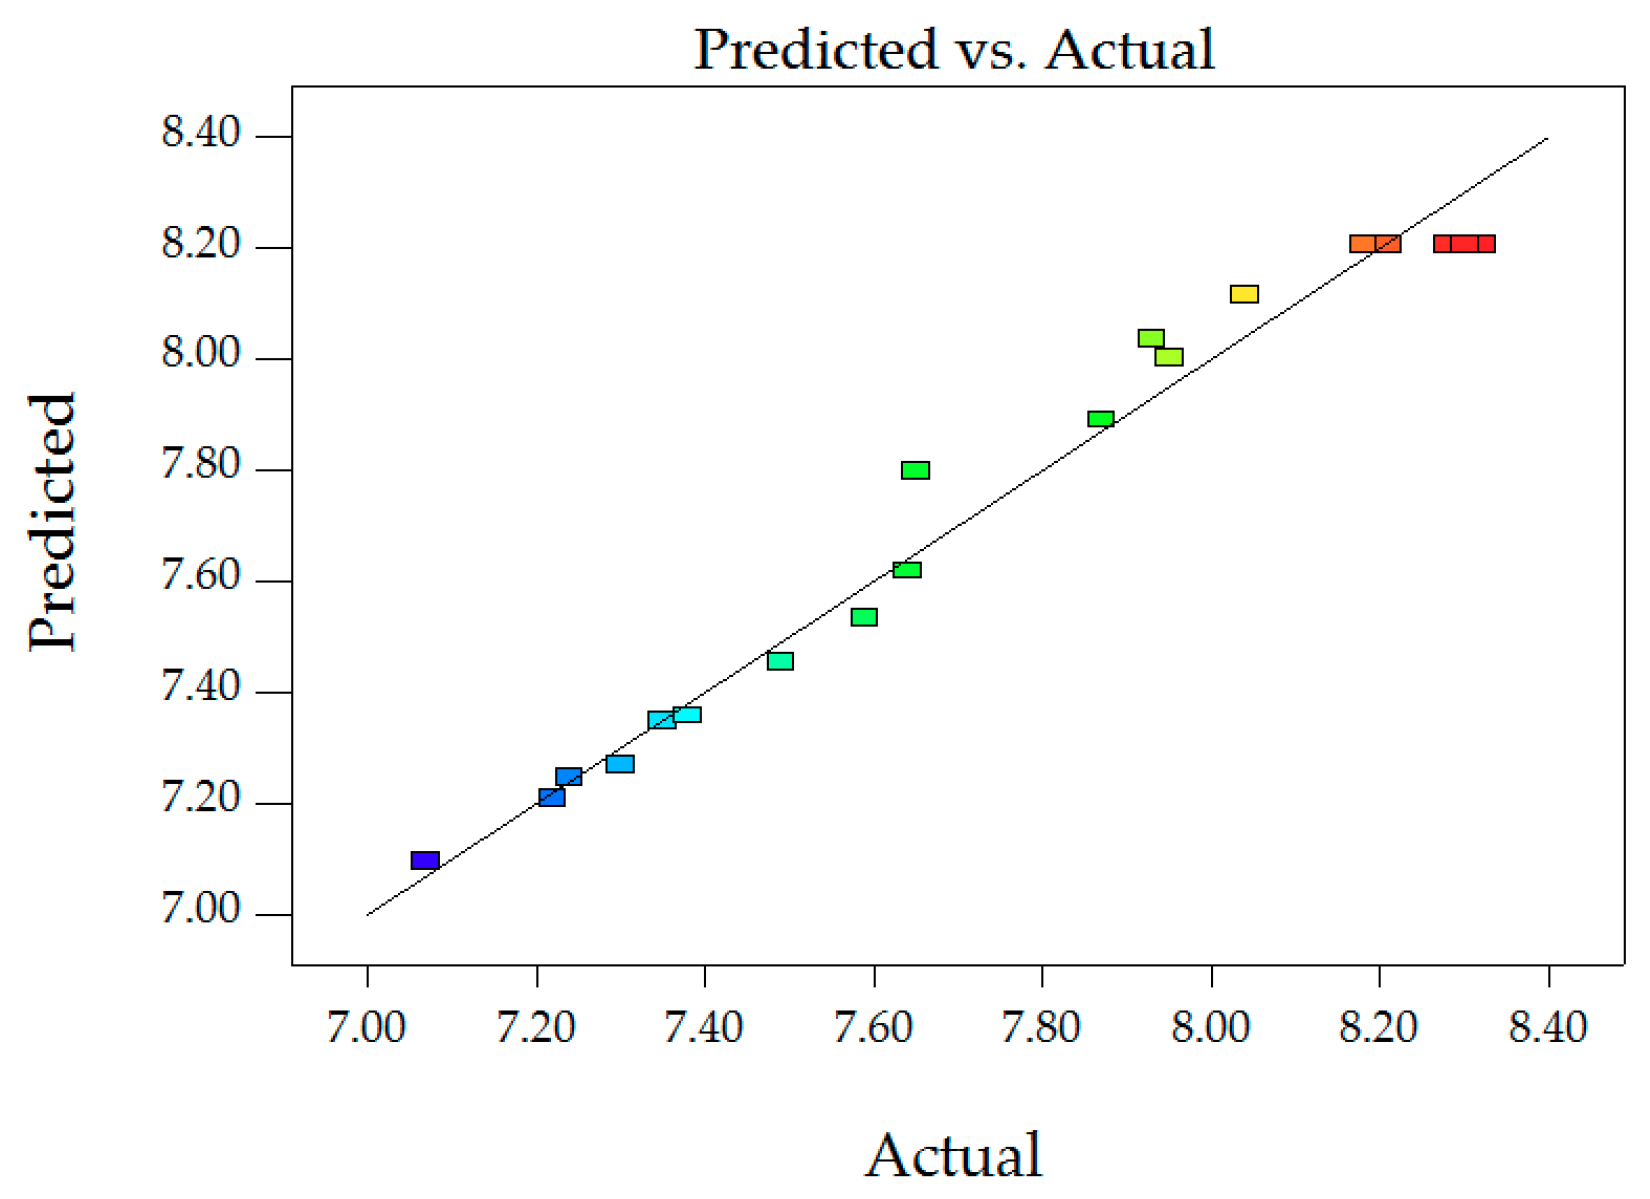
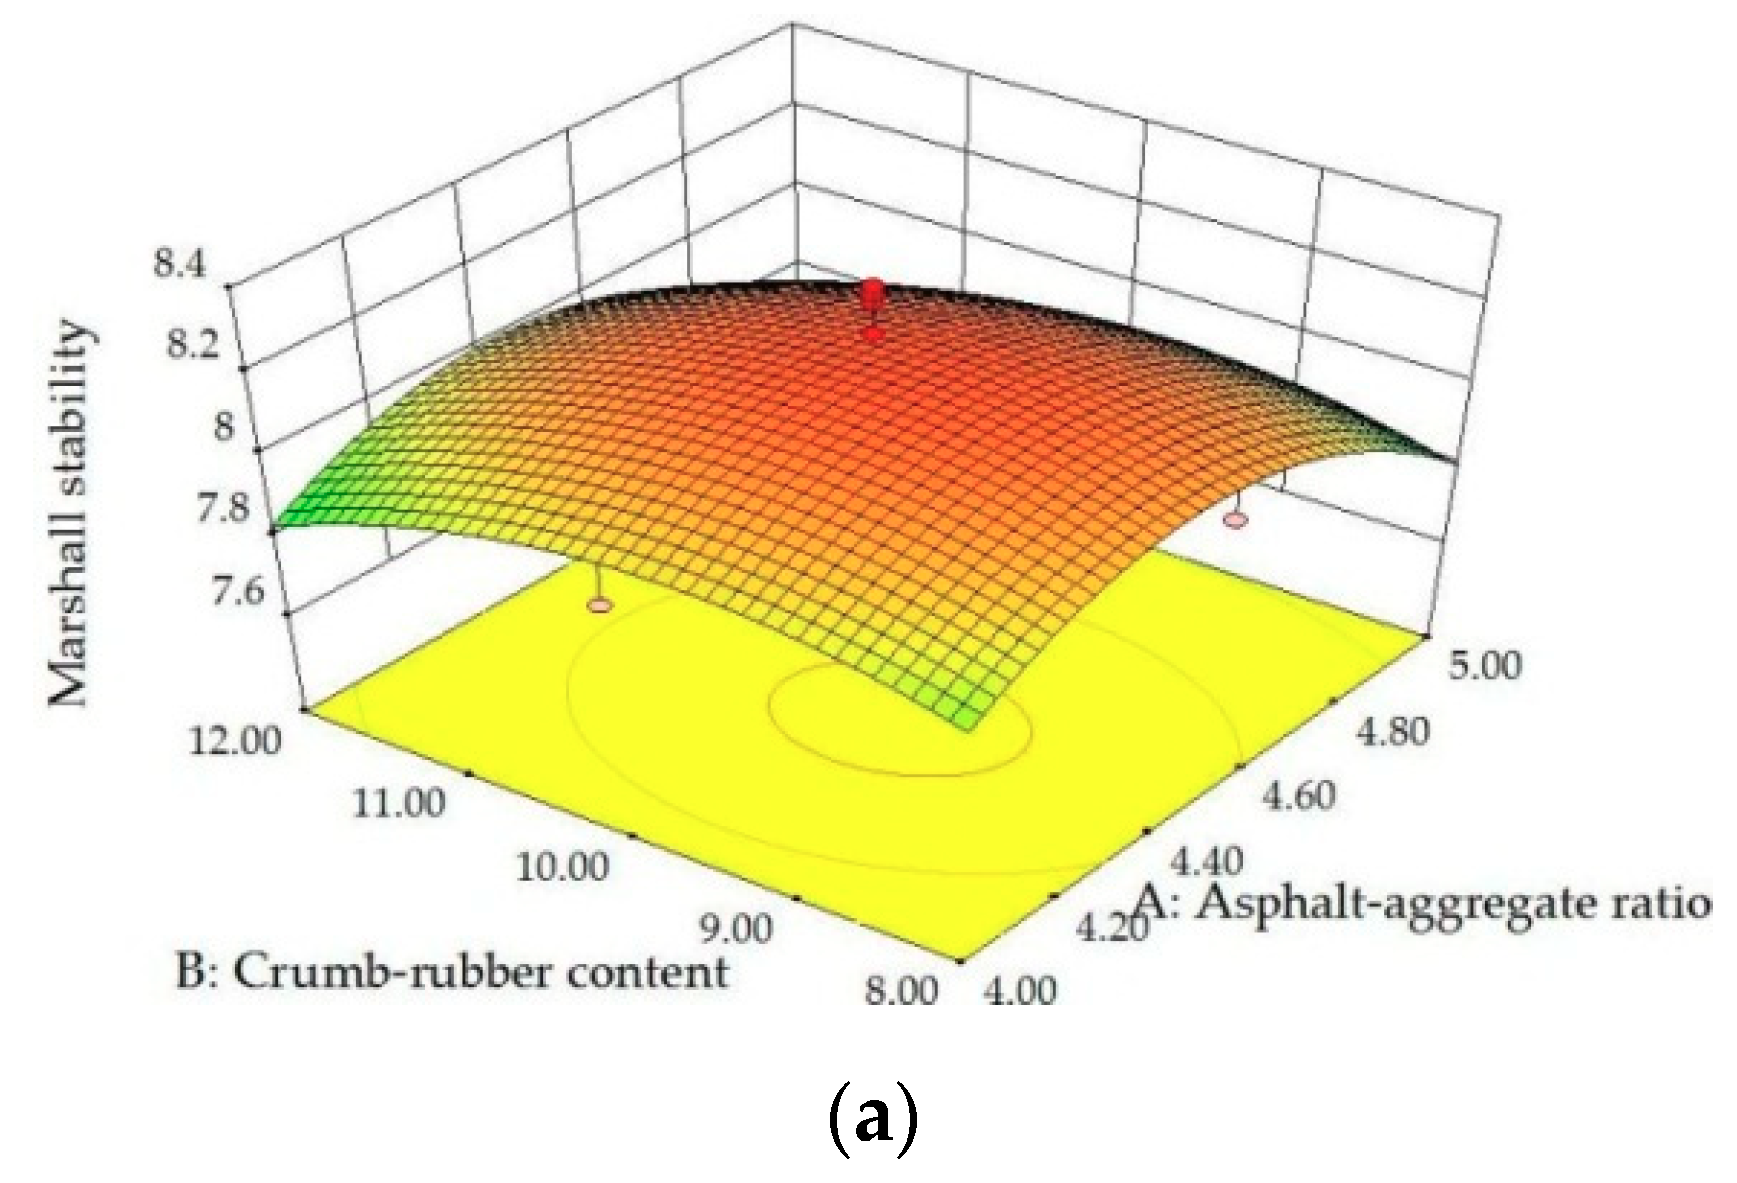
Figure 6 shows the residual normal distribution diagram of MS and Figure 7 shows the distribution of forecast and actual values of MS. These data basically fall into a straight line, which shows that the model has superior accuracy and can be used to describe the relationship between the MS and the three factors well. Figure 8 shows a 3D model diagram of MS with respect to the three independent variables, revealing the relationship between MS and the independent variables.
It can be seen from Figure 8 that MS has a tendency to increase first and then decrease with the increase of the three independent variables. The effect of the asphalt to aggregate ratio and basalt fiber content is most obvious. The low amount of bitumen will result in insufficient cohesiveness of the mixture, and the excessive use of bitumen will result in insufficient stability at high temperatures, which will reduce MS. When the basalt fiber content is increased from 0.25% to 0.40%, the fiber mainly acts to reinforce and conduct internal forces, which make the PAM stronger. However, when the amount of basalt fiber is increased from 0.4% to 0.55%, more agglomerated fibers appear inside the mixture, resulting in defects inside [32,33]. In addition, more fibers absorb more bitumen and it may cause insufficient adhesion between the aggregate and bitumen.

3.2.3. Analysis of Flow Value (FV)

The ANOVA results of FV model and the ANOVA results of the independent variables are shown in Table 10 and Table 11, respectively.
From the results in Table 10, the quadratic model had a good fitting effect based on the experimental data. In the model, R2 was 0.9604 and Adj. R2 was 0.9209, which shows that the model has good accuracy. In Table 11, the p values of A, B, C, AC, and A2 are less than 0.05, which are important factors in the FV model. Based on the least squares method, the reasonable quadratic equation can be obtained as:
Y 3 = 18.12 9.21 A + 0.66 B + 5.24 C 0.03 AB 1.47 AC 0.34 BC + 1.23 ( A ) 2 0.02 ( B ) 2 + 3.90 ( C ) 2
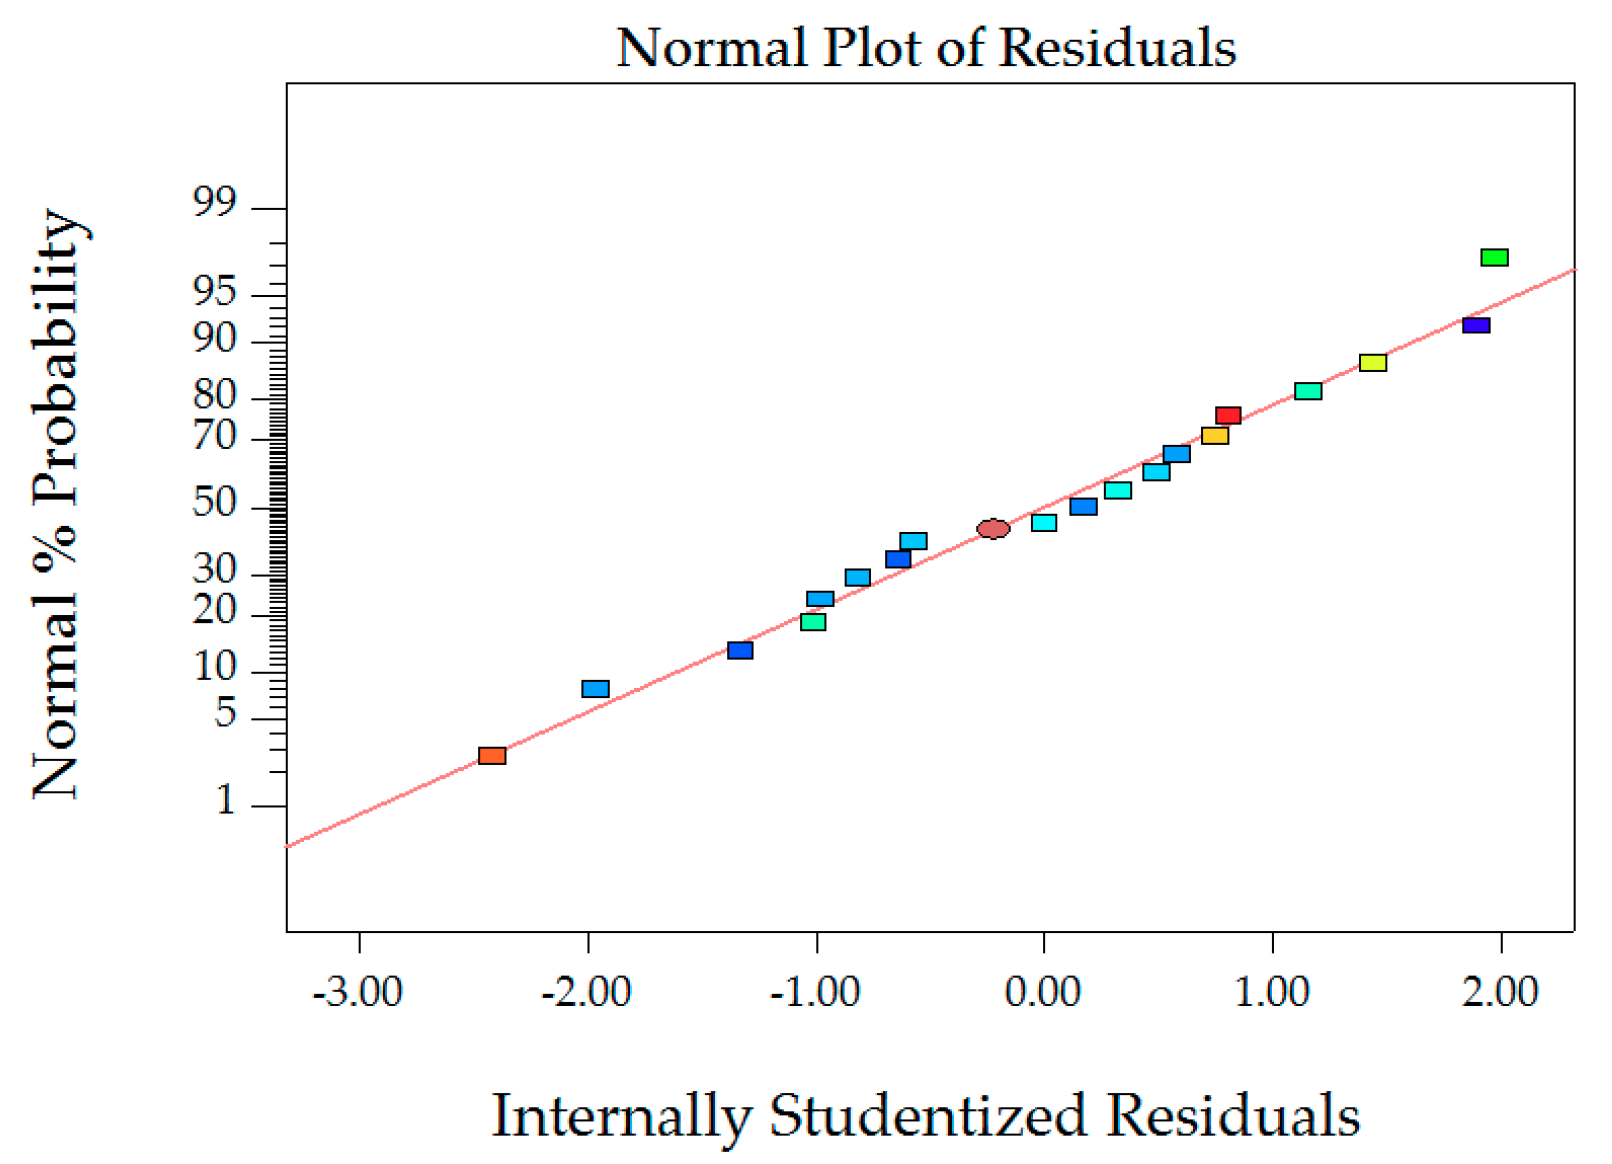
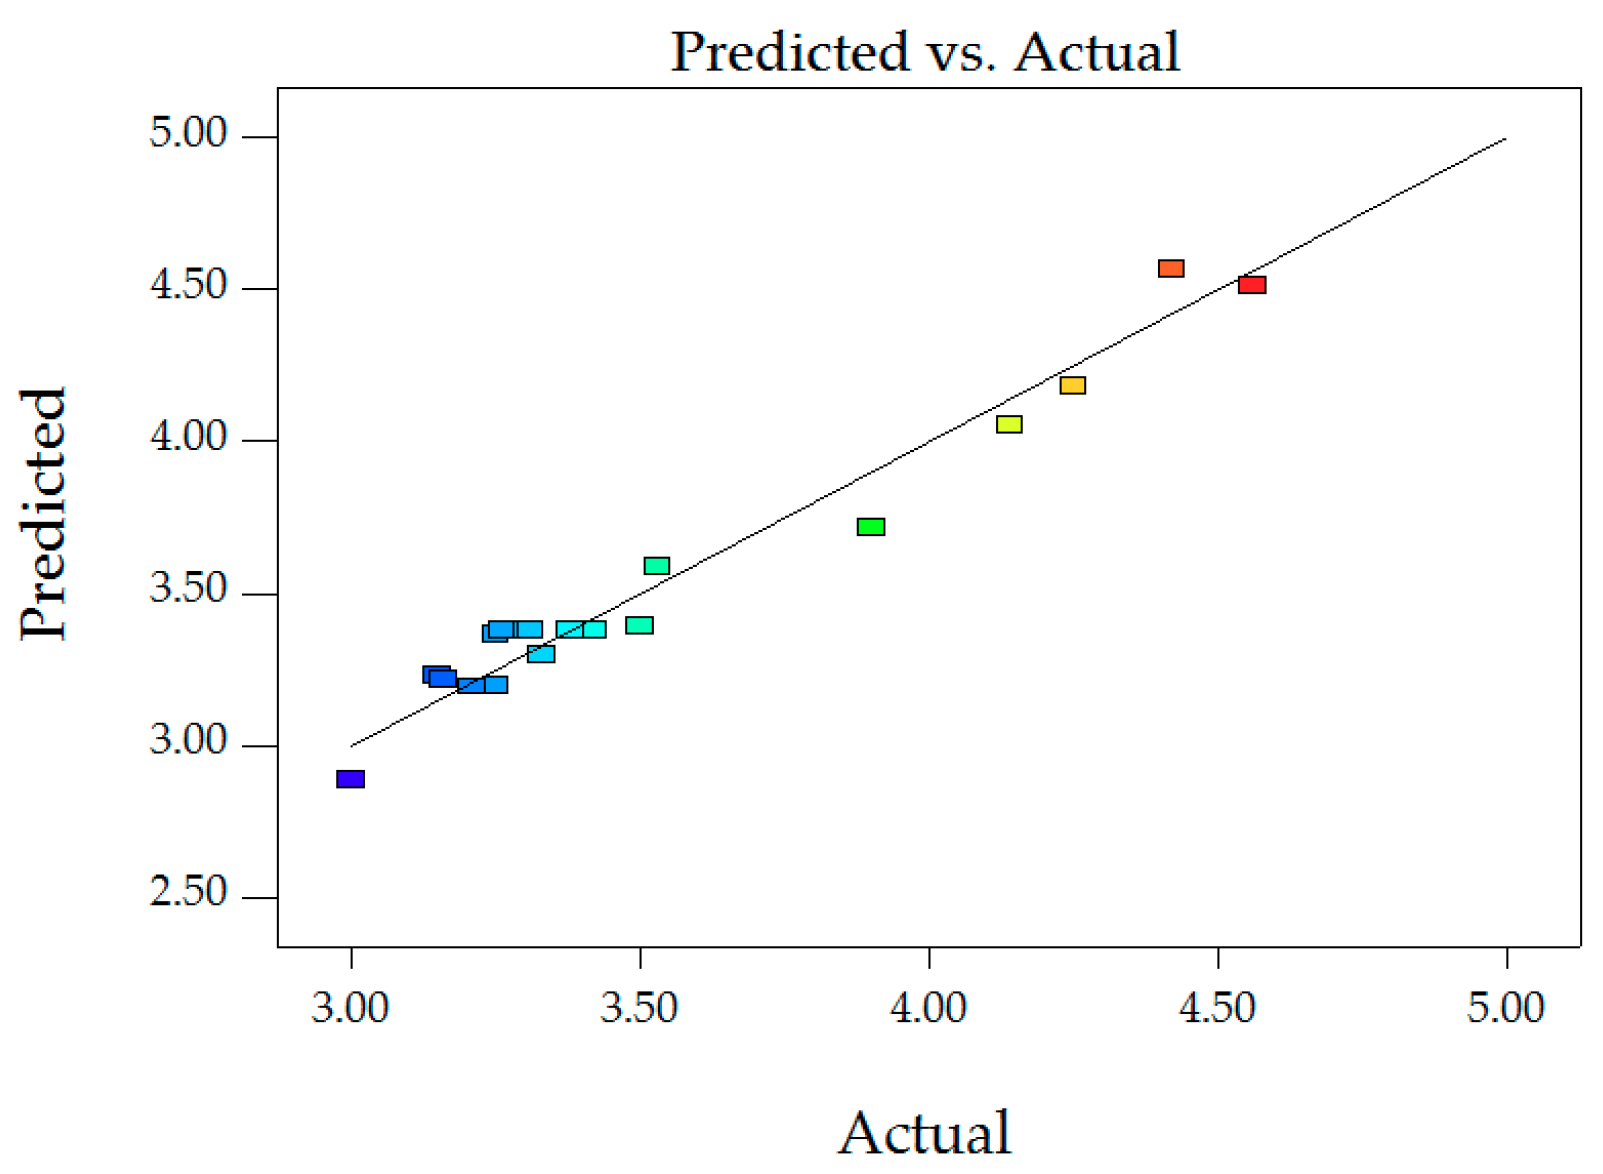
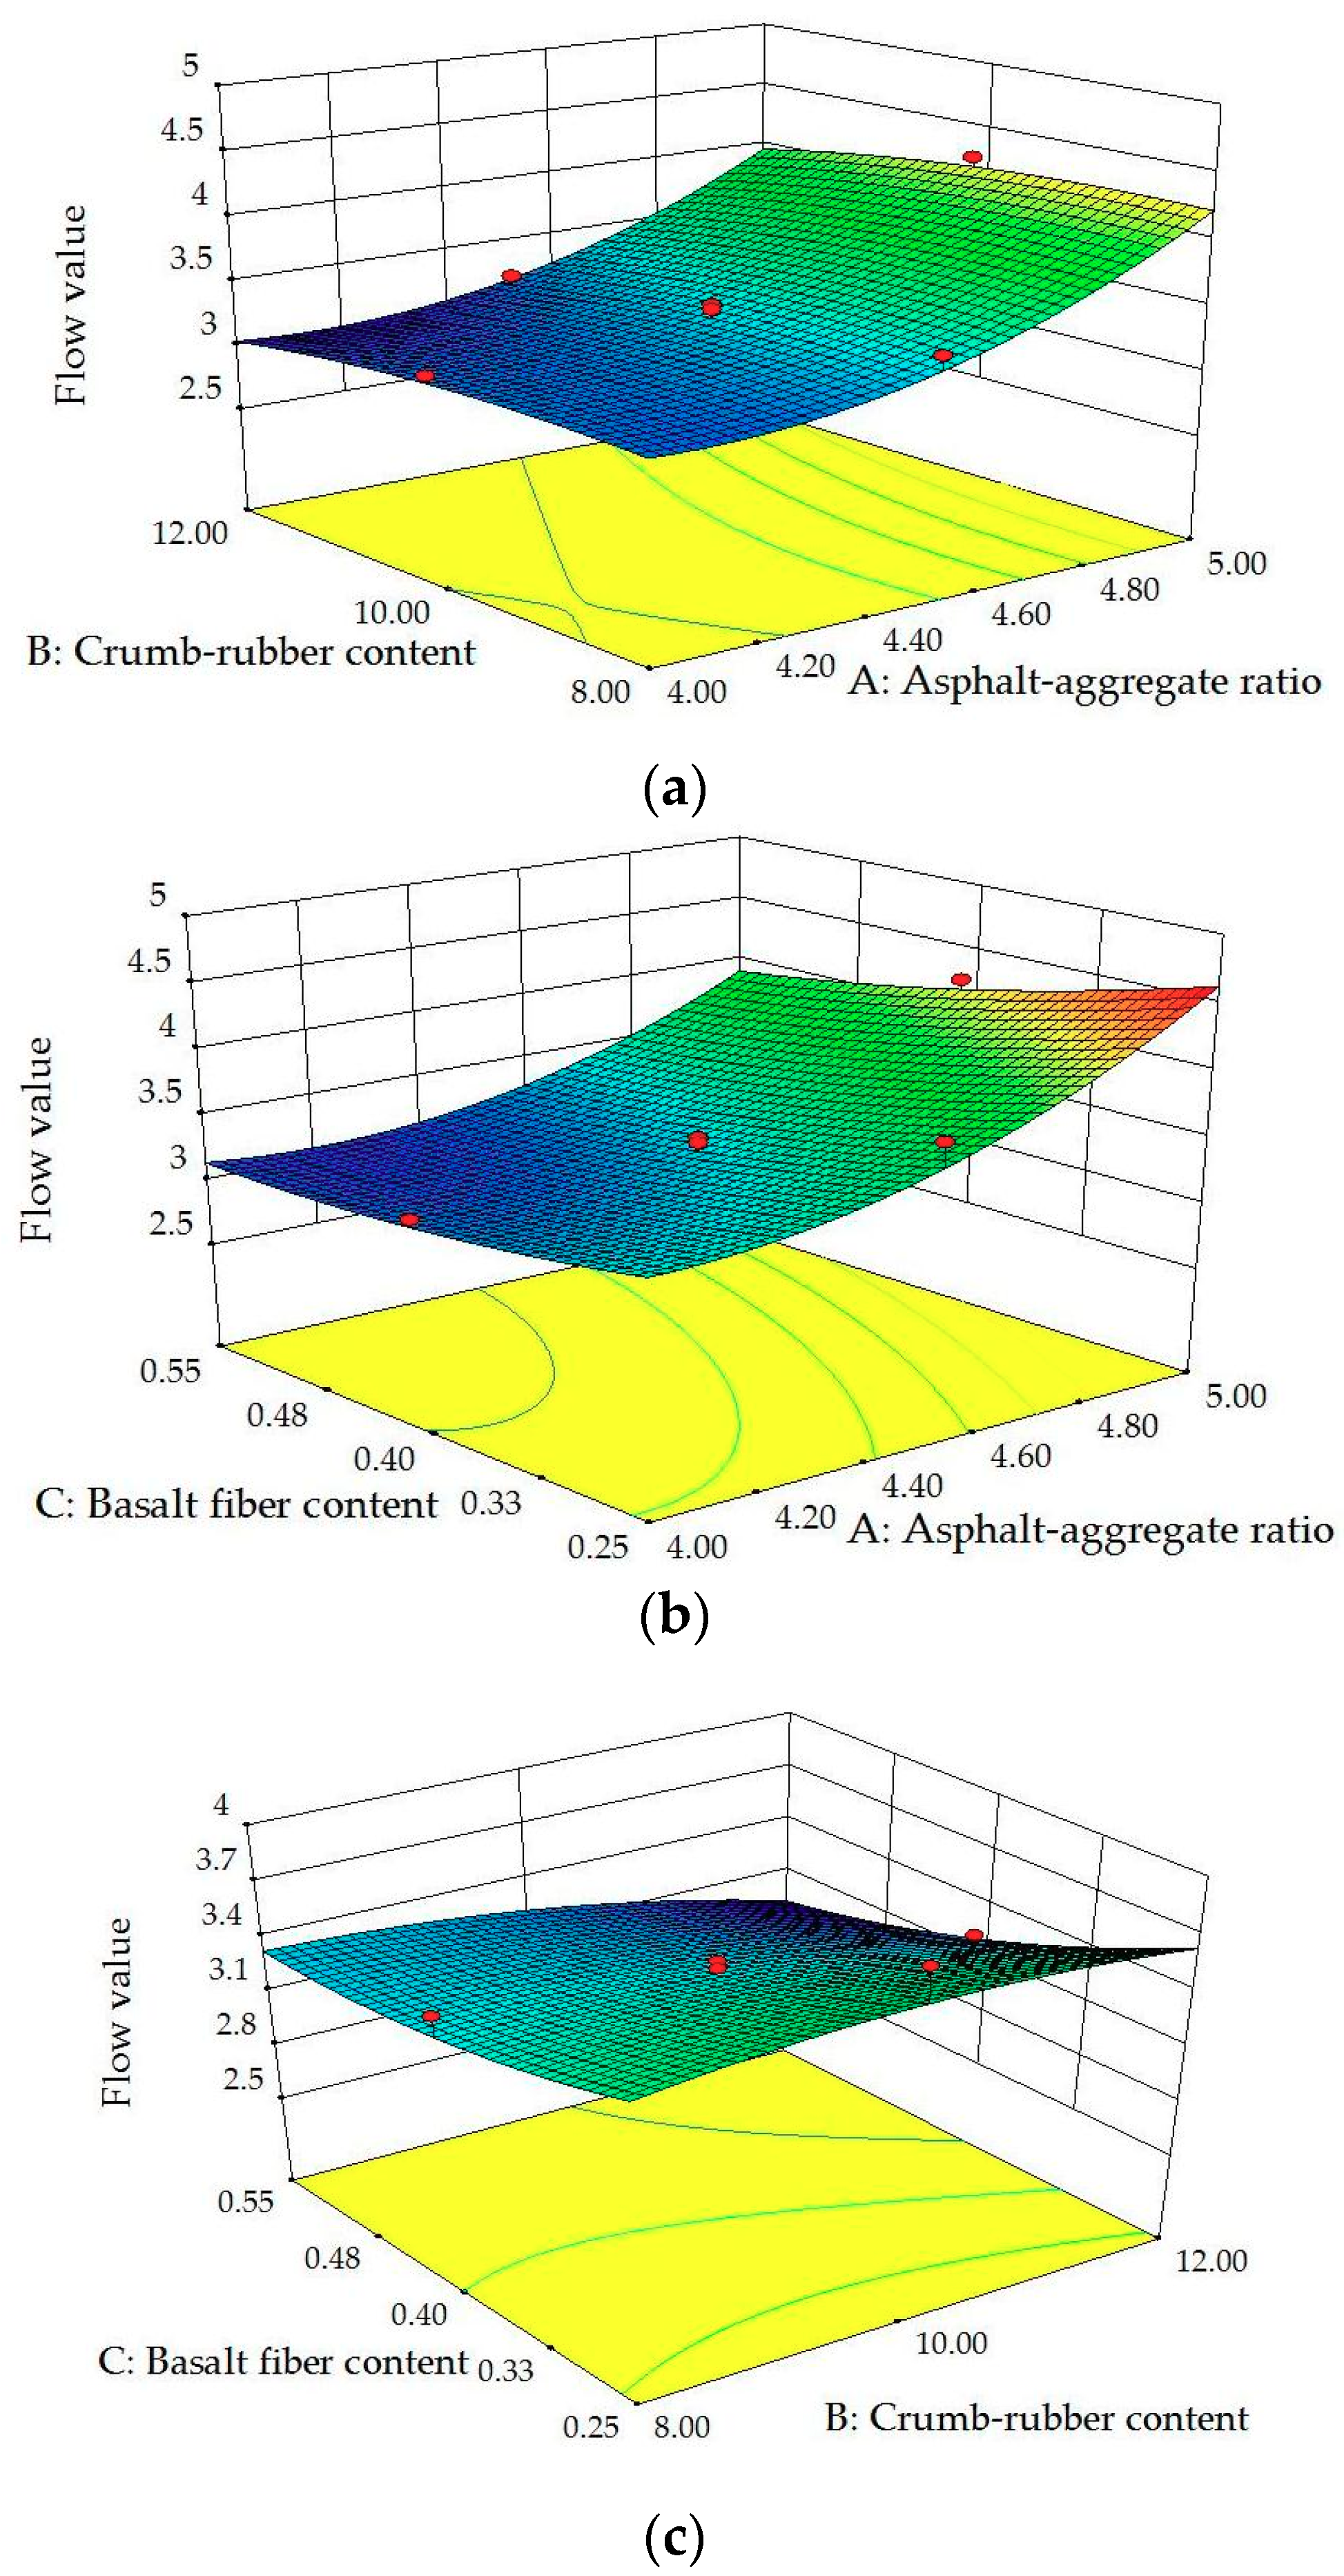
Figure 9 shows the residual normal distribution diagram of FV and Figure 10 shows the distribution of forecast and actual values of FV. these data basically fall into a straight line, which shows that the model has favorable accuracy and can be used to describe the relationship between FV and three factors well. Figure 11 is a 3D model diagram of FV with respect to the three independent variables, revealing the relationship between the flow values and the independent variables and the interaction between various factors.
As can be seen from Figure 11b, the flow value gradually increases as the asphalt to aggregate ratio increases and the amount of basalt fiber decreases. As the amount of asphalt increases, the viscoelasticity of the PAM will change, that is, the mixture exhibits more viscosity and will produce greater deformation under load at high temperature. In addition, the network structure formed by basalt fiber is more conducive to the transfer of load, and the reinforcement of the fiber forms a constraint in the mixture. On the other hand, as the amount of fiber increases, more free asphalt is adsorbed, resulting in a smaller flow value. In comparison, the amount of crumb rubber has little effect on the flow value.

3.2.4. Analysis of Marshall Quotient (MQ)

The ANOVA results of MQ model and the ANOVA results of the independent variables are shown in Table 12 and Table 13, respectively.
It can be seen from Table 12 that the quadratic model has a good fitting effect based on the experimental data. In the model, R2 was 0.9594 and Adj. R2 was 0.9189. In Table 13, the p values of A, C, A2, and C2 are less than 0.05, which are important influencing factors in the MQ model. According to the principle of least squares, the fitted quadratic model expression can be obtained by using Design Expert 8.0 software, as shown in Equation (6):
Y 4 = 13.35 + 7.42 A 0.16 B + 4.40 C + 0.01 AB + 0.31 AC + 0.19 BC 0.92 ( A ) 2 + 0.03 ( B ) 2 8.22 ( C ) 2
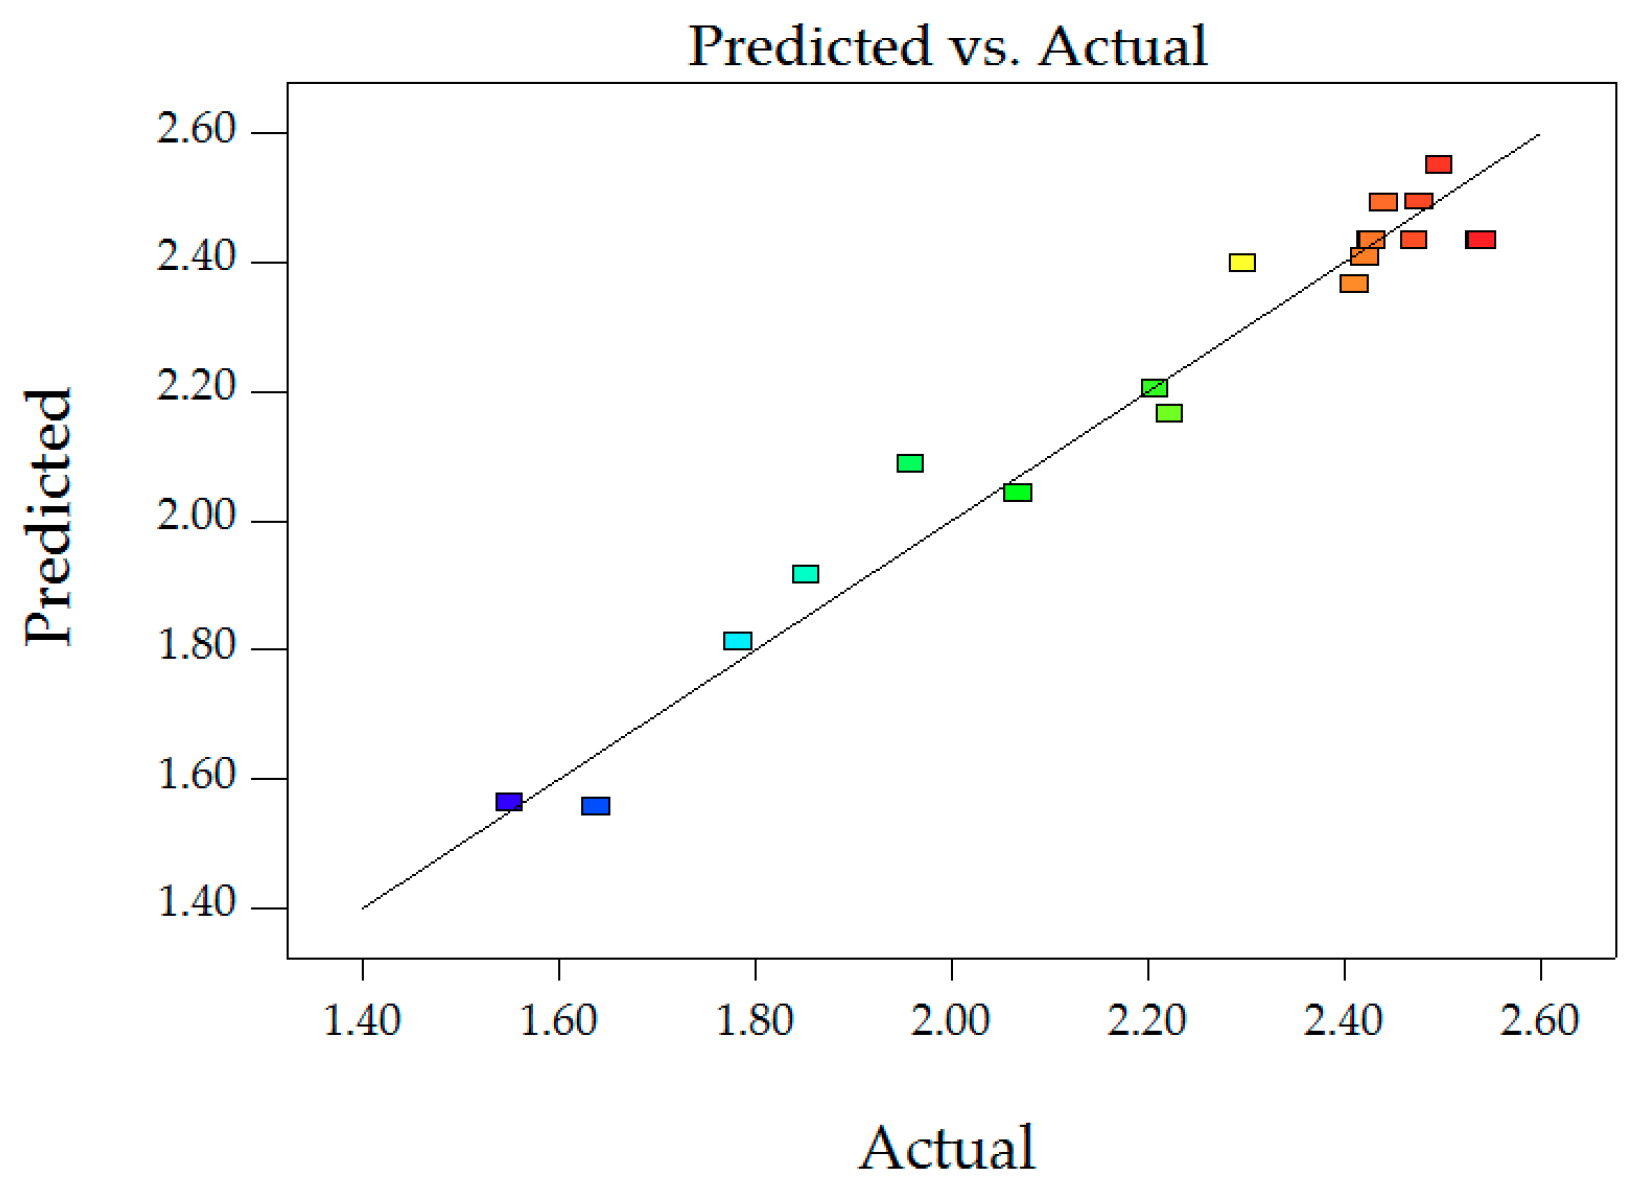
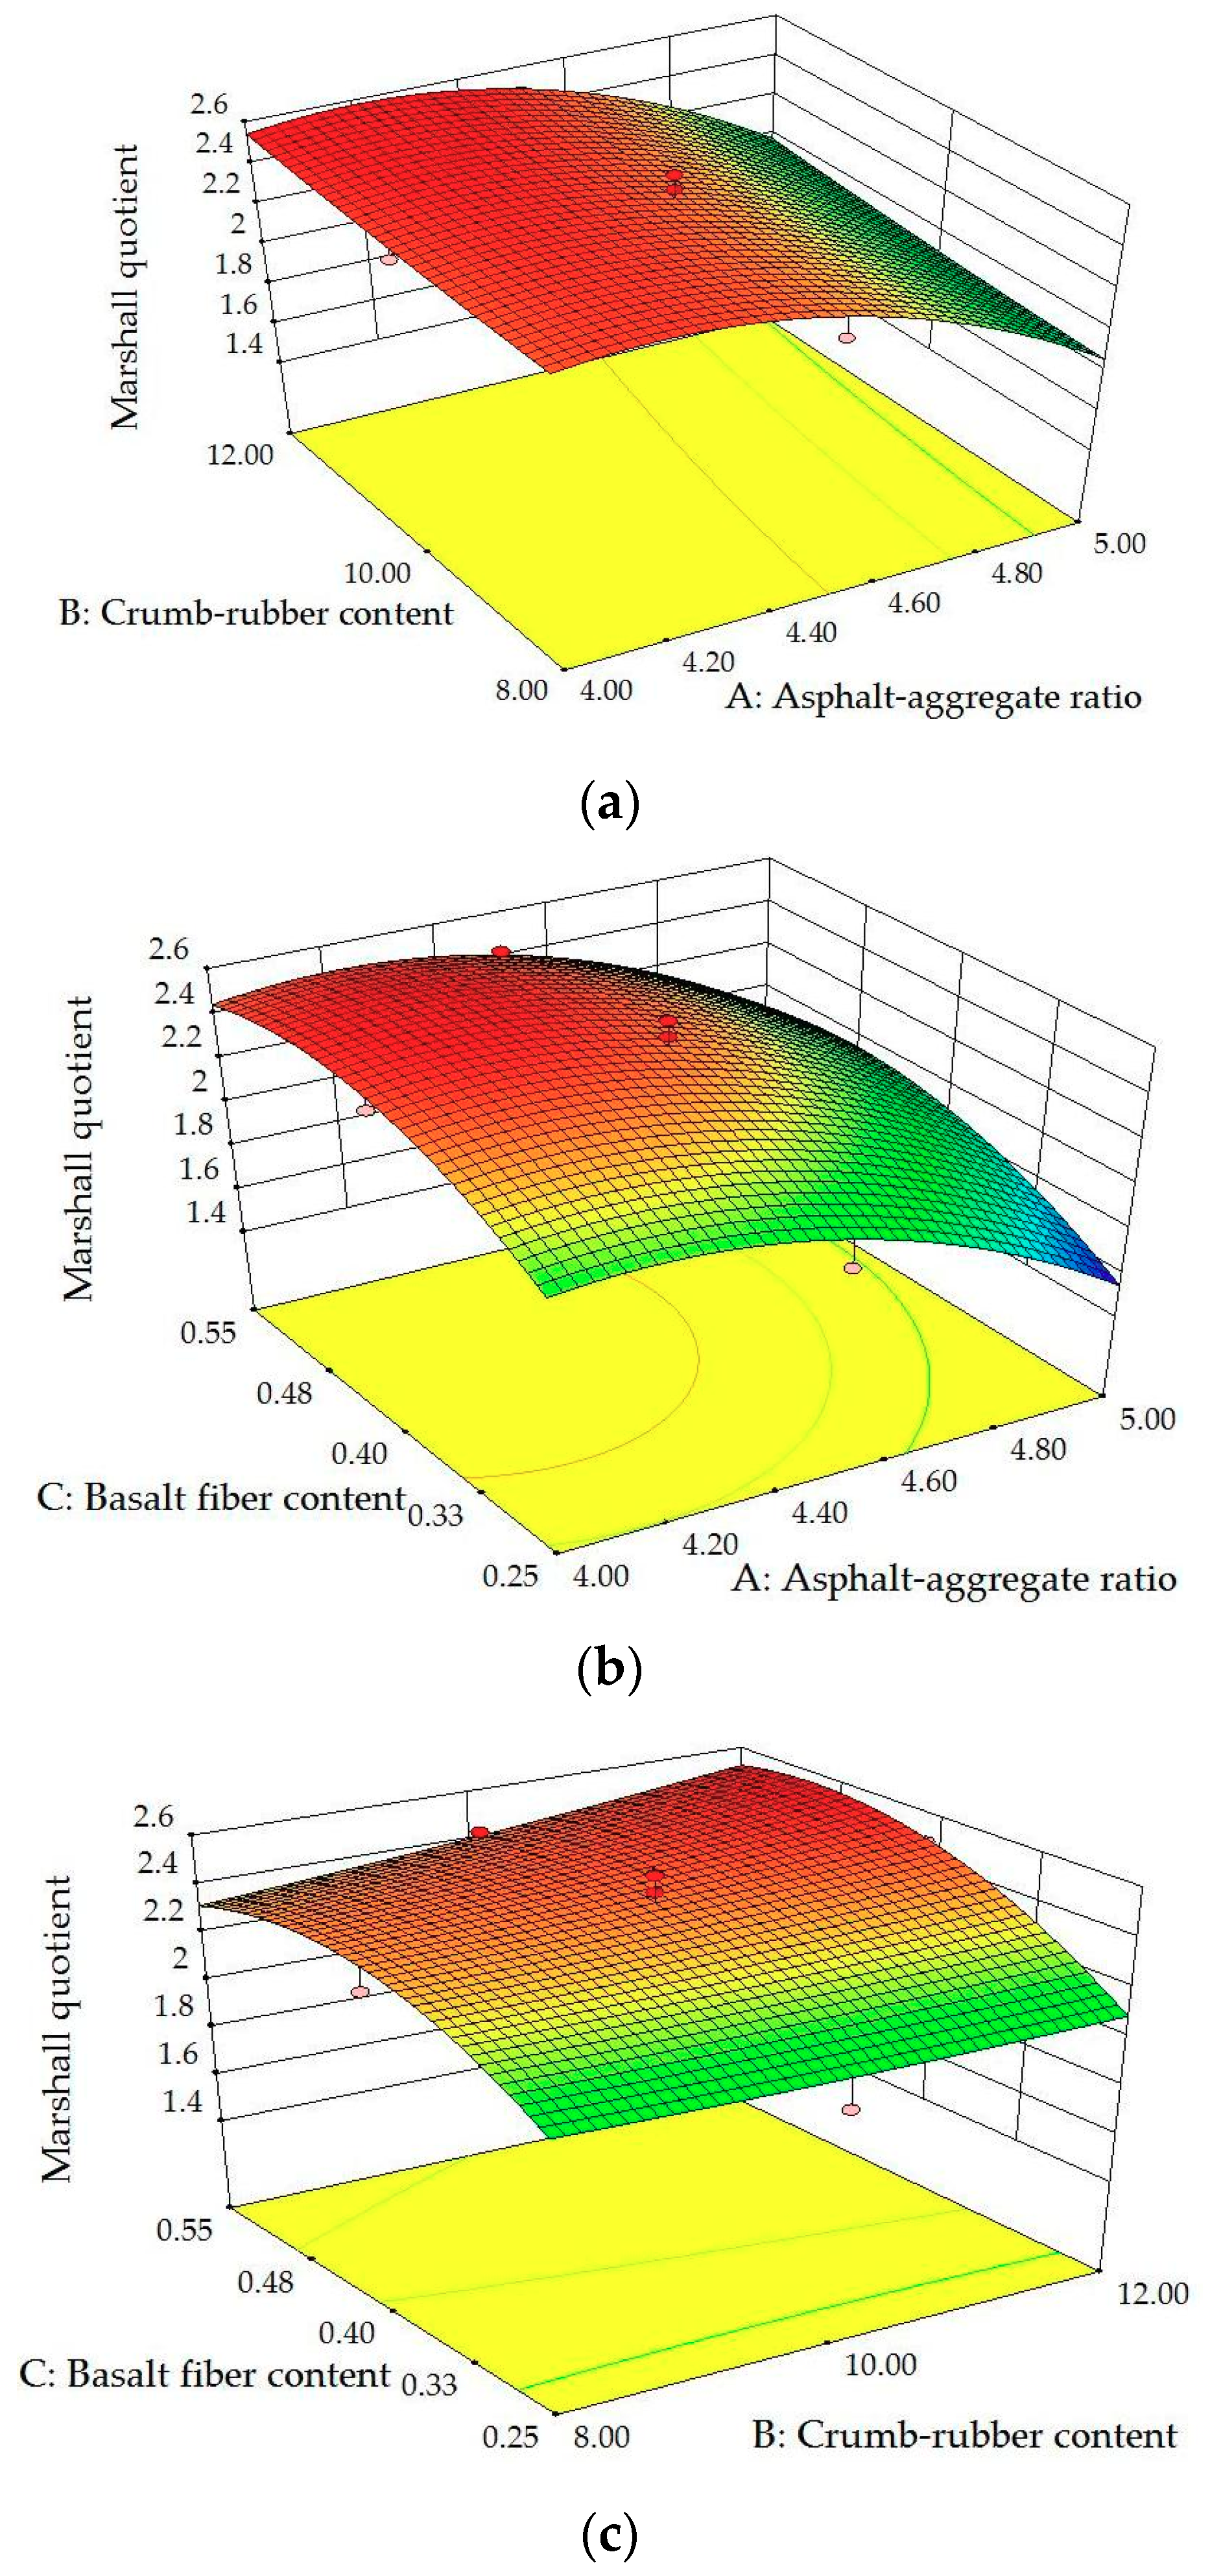
Figure 12 shows the residual normal distribution diagram of MQ and Figure 13 shows the distribution of forecast and actual values of MQ, these data basically fall into a straight line, which shows that the model has sufficient accuracy and can be used to describe the relationship between MQ and the three factors well. Figure 14 is a 3D model diagram of MQ with respect to the three independent variables, revealing the relationship between MQ and the independent variables and the interaction between various factors.
As can be seen from Figure 14a,b, when the asphalt to aggregate ratio is increased from 4.0% to 4.5%, the MQ is not significantly changed. However, when the asphalt to aggregate ratio is increased from 4.5% to 5.0%, the MQ is rapidly reduced due to a rapid increase in the FV. Otherwise, as can be seen from Figure 14b,c, the amount of basalt fiber has a significant influence on MQ. When the amount of basalt fiber is increased from 0.25% to 0.40%, the MQ increases significantly. This is because the flow value is significantly reduced at this time. As fiber usage continues to increase, the change in MQ is no longer obvious.

3.2.5. Analysis of Cantabro Particle Loss (CPL)

The ANOVA results of CPL model and the ANOVA results of the independent variables are shown in Table 14 and Table 15, respectively.
It can be seen from Table 14, the quadratic model had a good fitting effect based on the experimental data. In the model, R2 was 0.9556, Adj. R2 was 0.9112, and their values are close to 1, which indicates that the model can reflect the inherent law between independent variables and response values well. In Table 15, the p values of A, C, AC, and A2 are less than 0.05, which are important influencing factors in the model. Based on the least squares method, the reasonable second-order polynomial equation for CPL can be established as:
Y 5 = 10.11 9.77 A + 7.85 B + 81.64 C 0.09 AB 28.10 AC 4.87 BC + 0.84 ( A ) 2 0.30 ( B ) 2 + 133.34 ( C ) 2
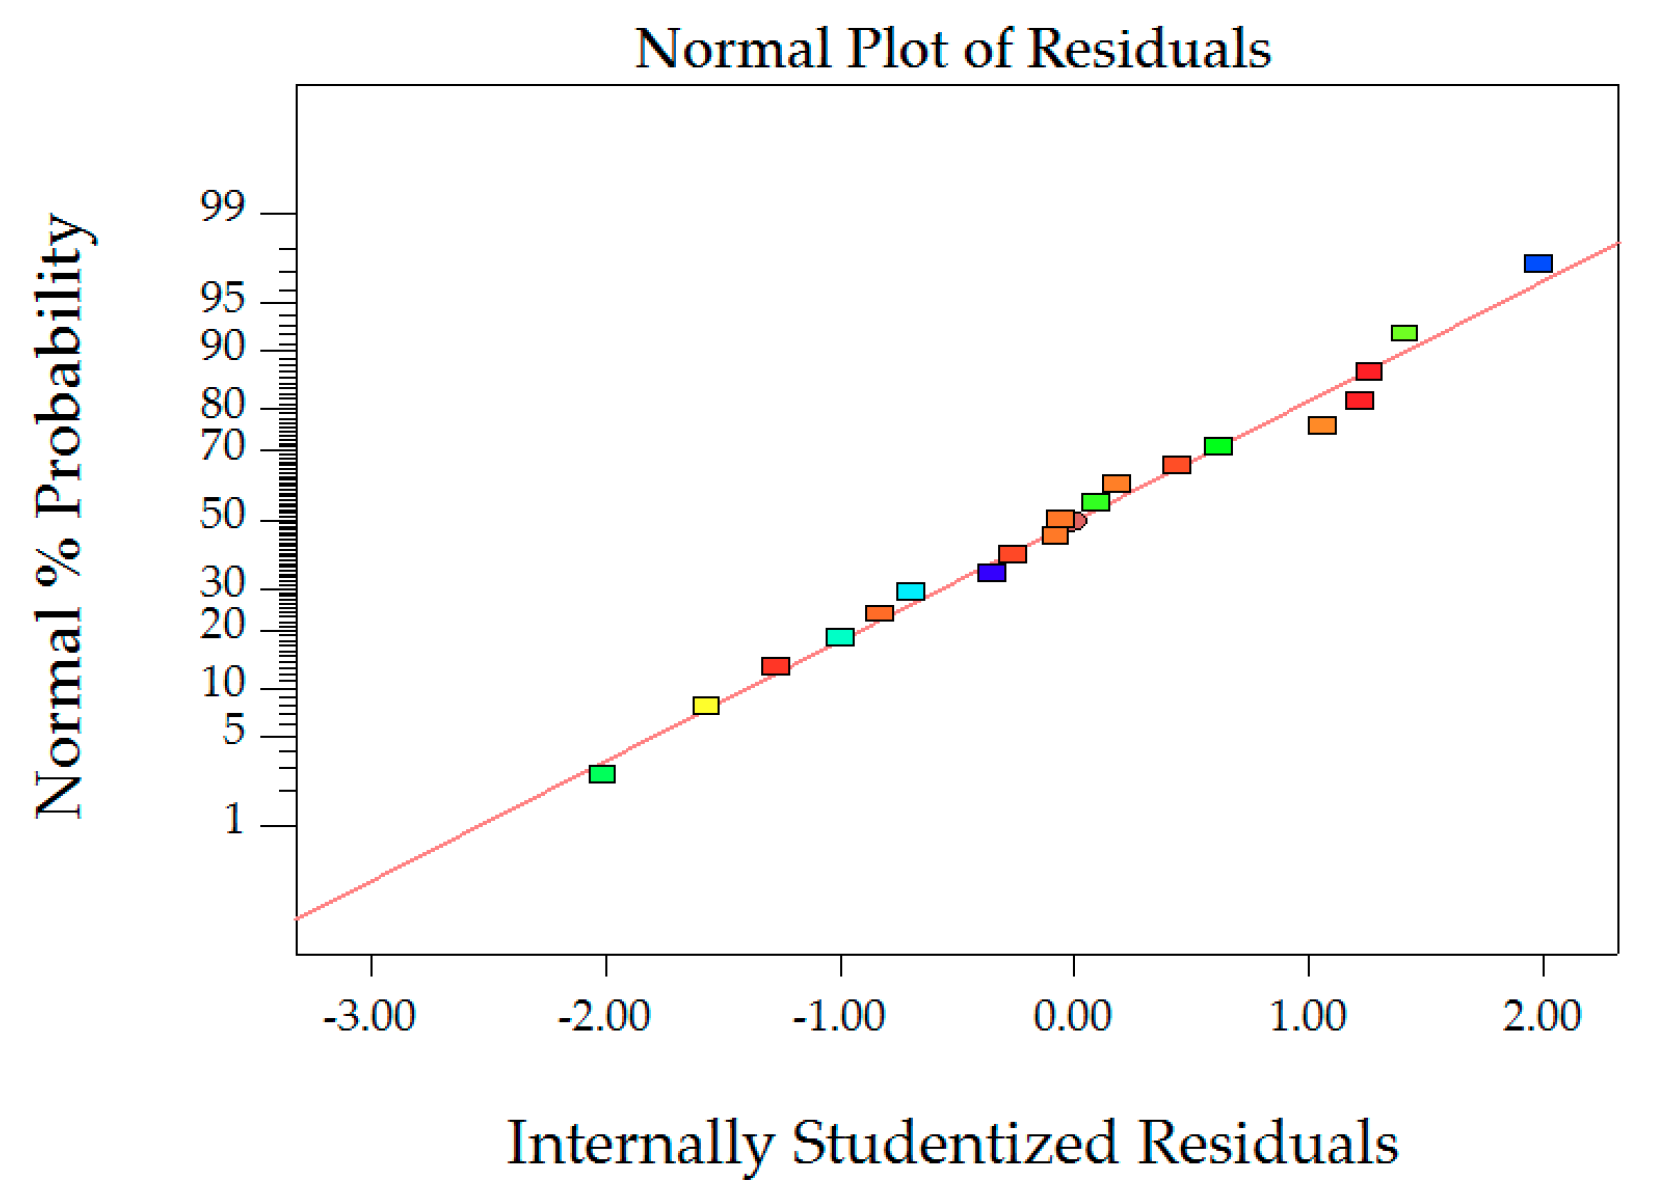
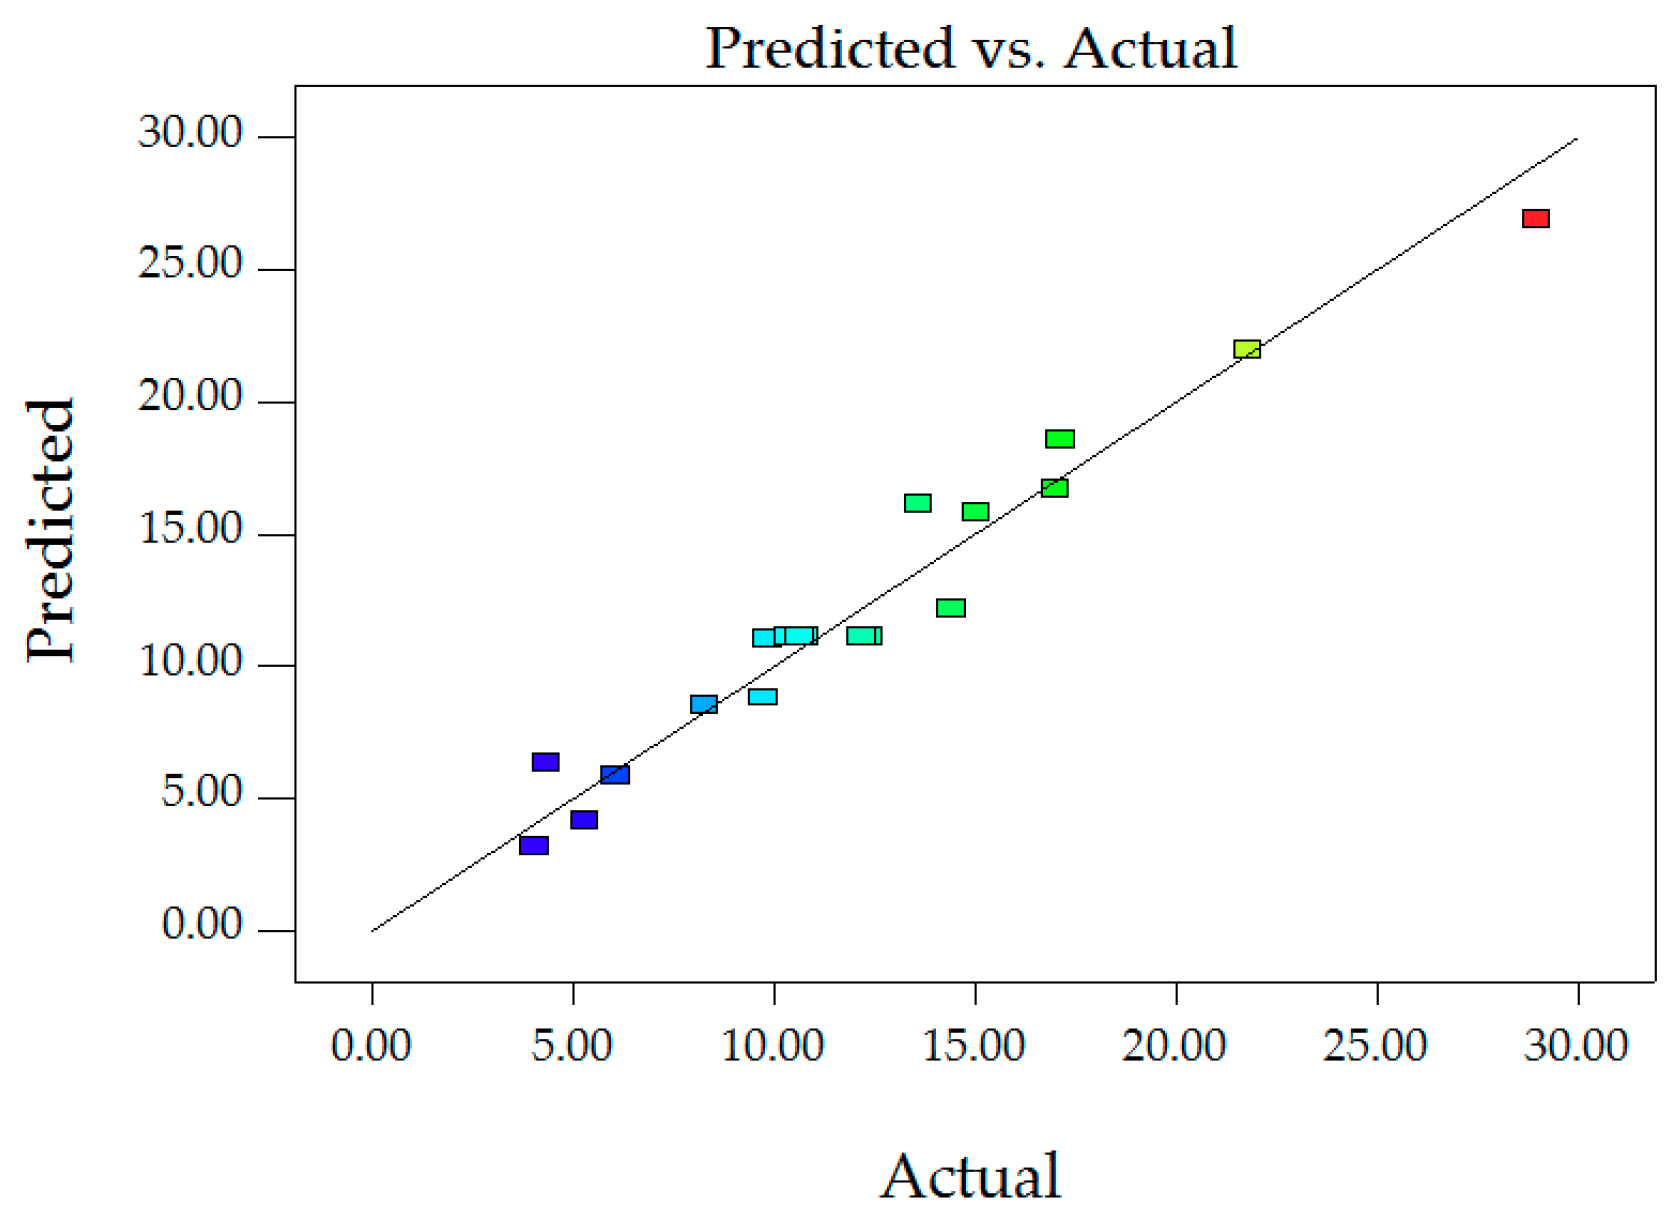
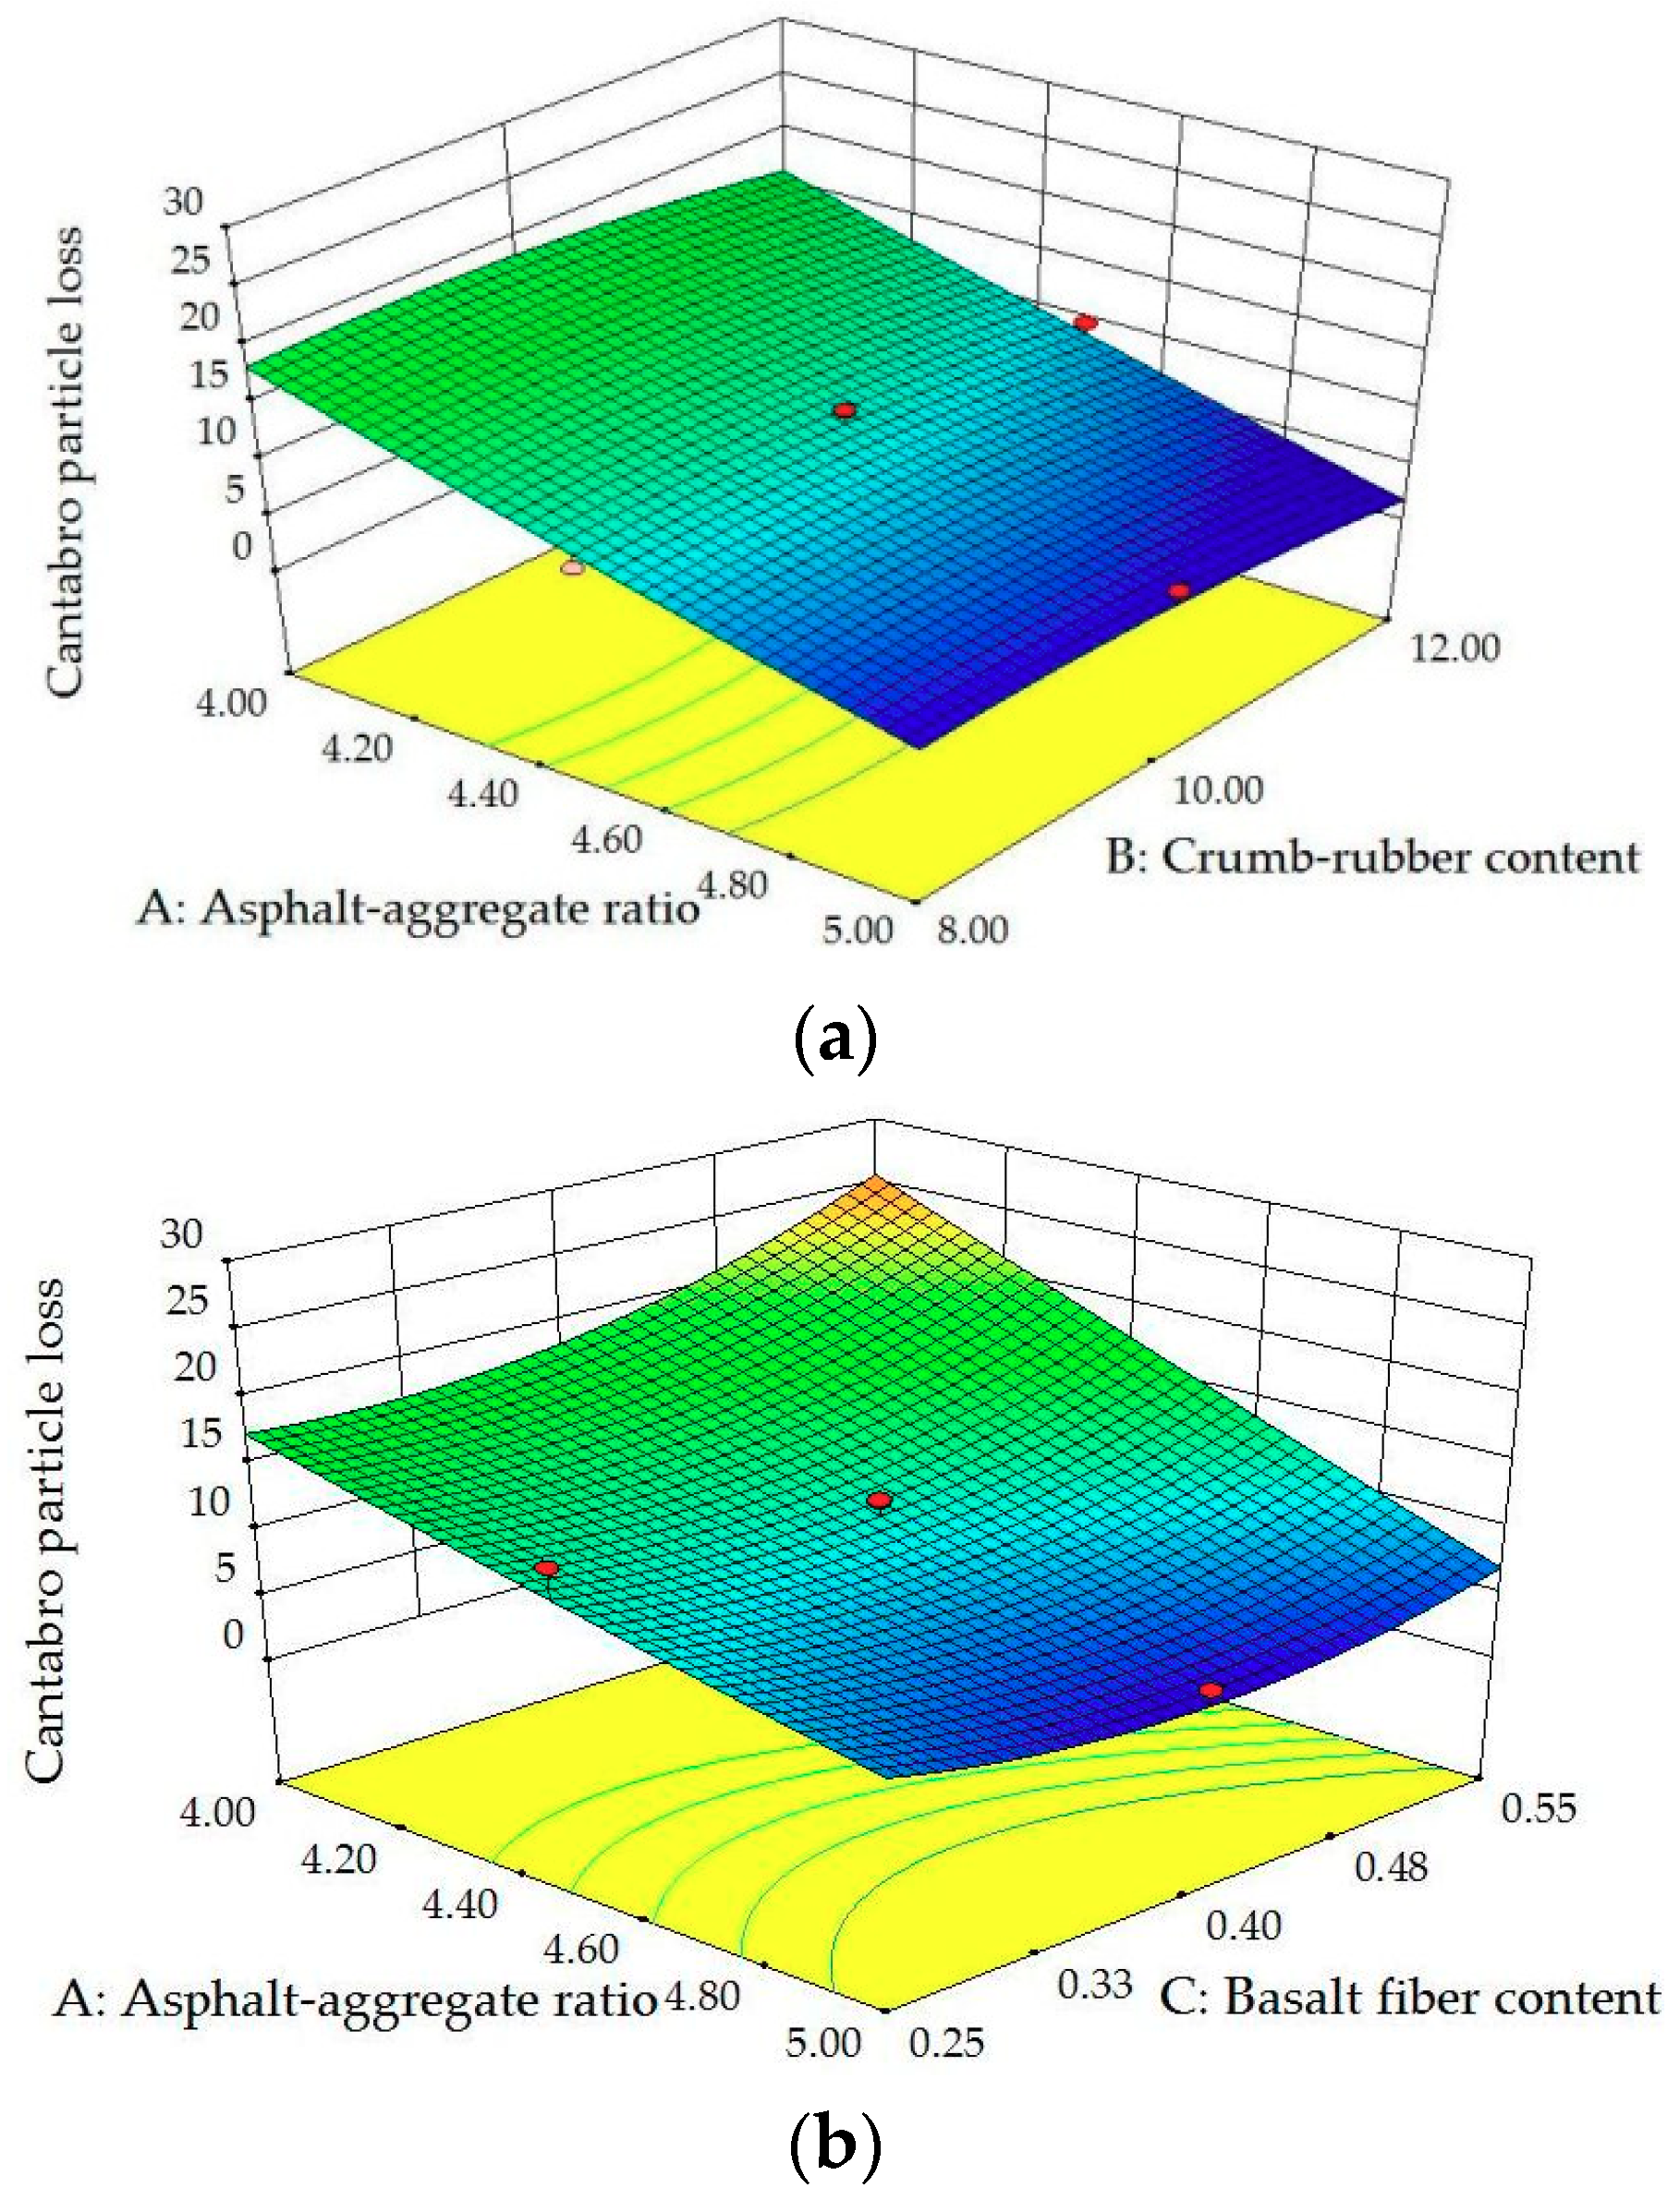
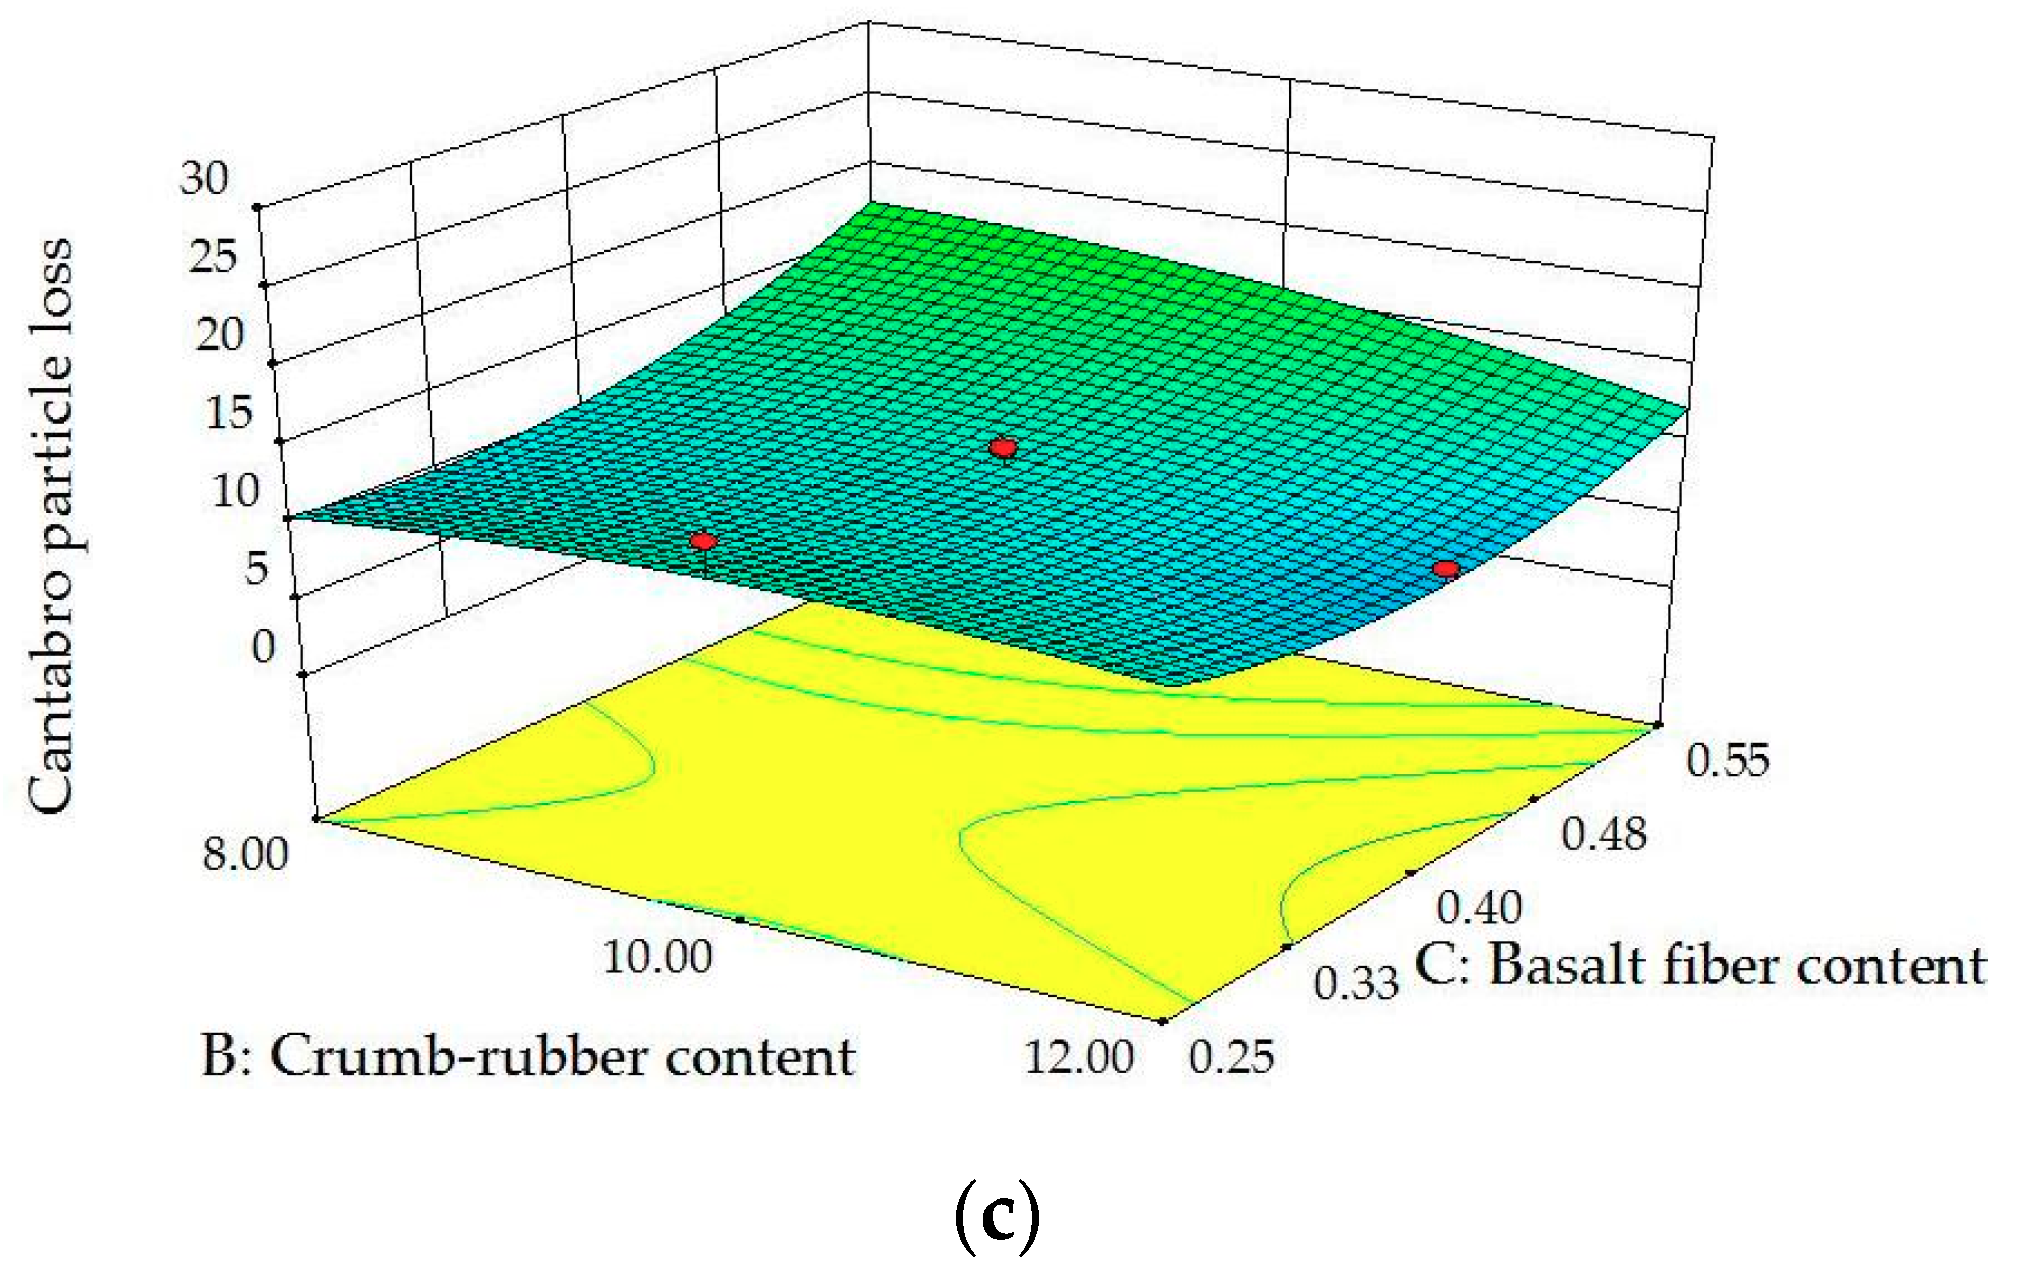
Figure 15 shows the residual normal distribution diagram of CPL and Figure 16 shows the distribution of forecast and actual values of CPL. These data basically fall into a straight line, which shows that the model has sufficient accuracy and can be used to describe the relationship between CPL and the three factors well. Figure 17 is a 3D model diagram of CPL with respect to the three independent variables, revealing the relationship between CPL and the independent variables and the interaction between the various factors.
As can be seen from Figure 17, the asphalt to aggregate ratio has a great influence on CPL. The CPL is greatly reduced as the amount of bitumen increases. Moreover, it can be seen from Figure 17b,c that CPL tends to decrease first and then increase with the increase in the amount of basalt fiber. This is because, first of all, with the increase of the amount of fiber, the specimens have better integrity and more stable internal connections due to the reinforcement of fibers. However, when the amount of fiber continuously increases, excess fiber will absorb more bitumen, which leads to insufficient bonding of aggregate and binder, and is more prone to Cantabro particle loss. Furthermore, as the amount of rubber powder increases, the CPL of the test piece decreases slightly. This is because the rubber powder increases the viscosity of bitumen, which, in turn, makes the aggregate bond more firmly to the binder.

3.2.6. Parameter Optimization and Model Verification

It can be clarified that three variables have different effects on different response values through analysis of above models. First, according to the Technical Specification for Permeable Asphalt Pavement (CJJ/T 190-2012) [34], and through the comprehensive analysis of the five response values, the optimal usage of the three variables and the expected response output values were determined by using the optimization features in Design-Expert 8.0. The target values are presented in Table 16. Then, standard Marshall samples were made with the optimized PAM and the previous experiments were carried out. Finally, the accuracy of models was verified by comparing experimental representative values with the expected response output values. The model prediction results and experimental results are shown in Table 17.
It can be seen from Table 17 that the relative error between predicted values and experimental results is less than 4.5%. This reveals that the models have good prediction accuracy and favorable practical application value. In addition, several response values meet the requirements of Chinese specifications. Marshall stability exceeds the minimum specified by the specification of 61.6%, which indicates that the optimized PAM has good high-temperature stability. The adhesion between the aggregate and binder meets the specification requirements.

3.3. Analysis of Pavement Performance

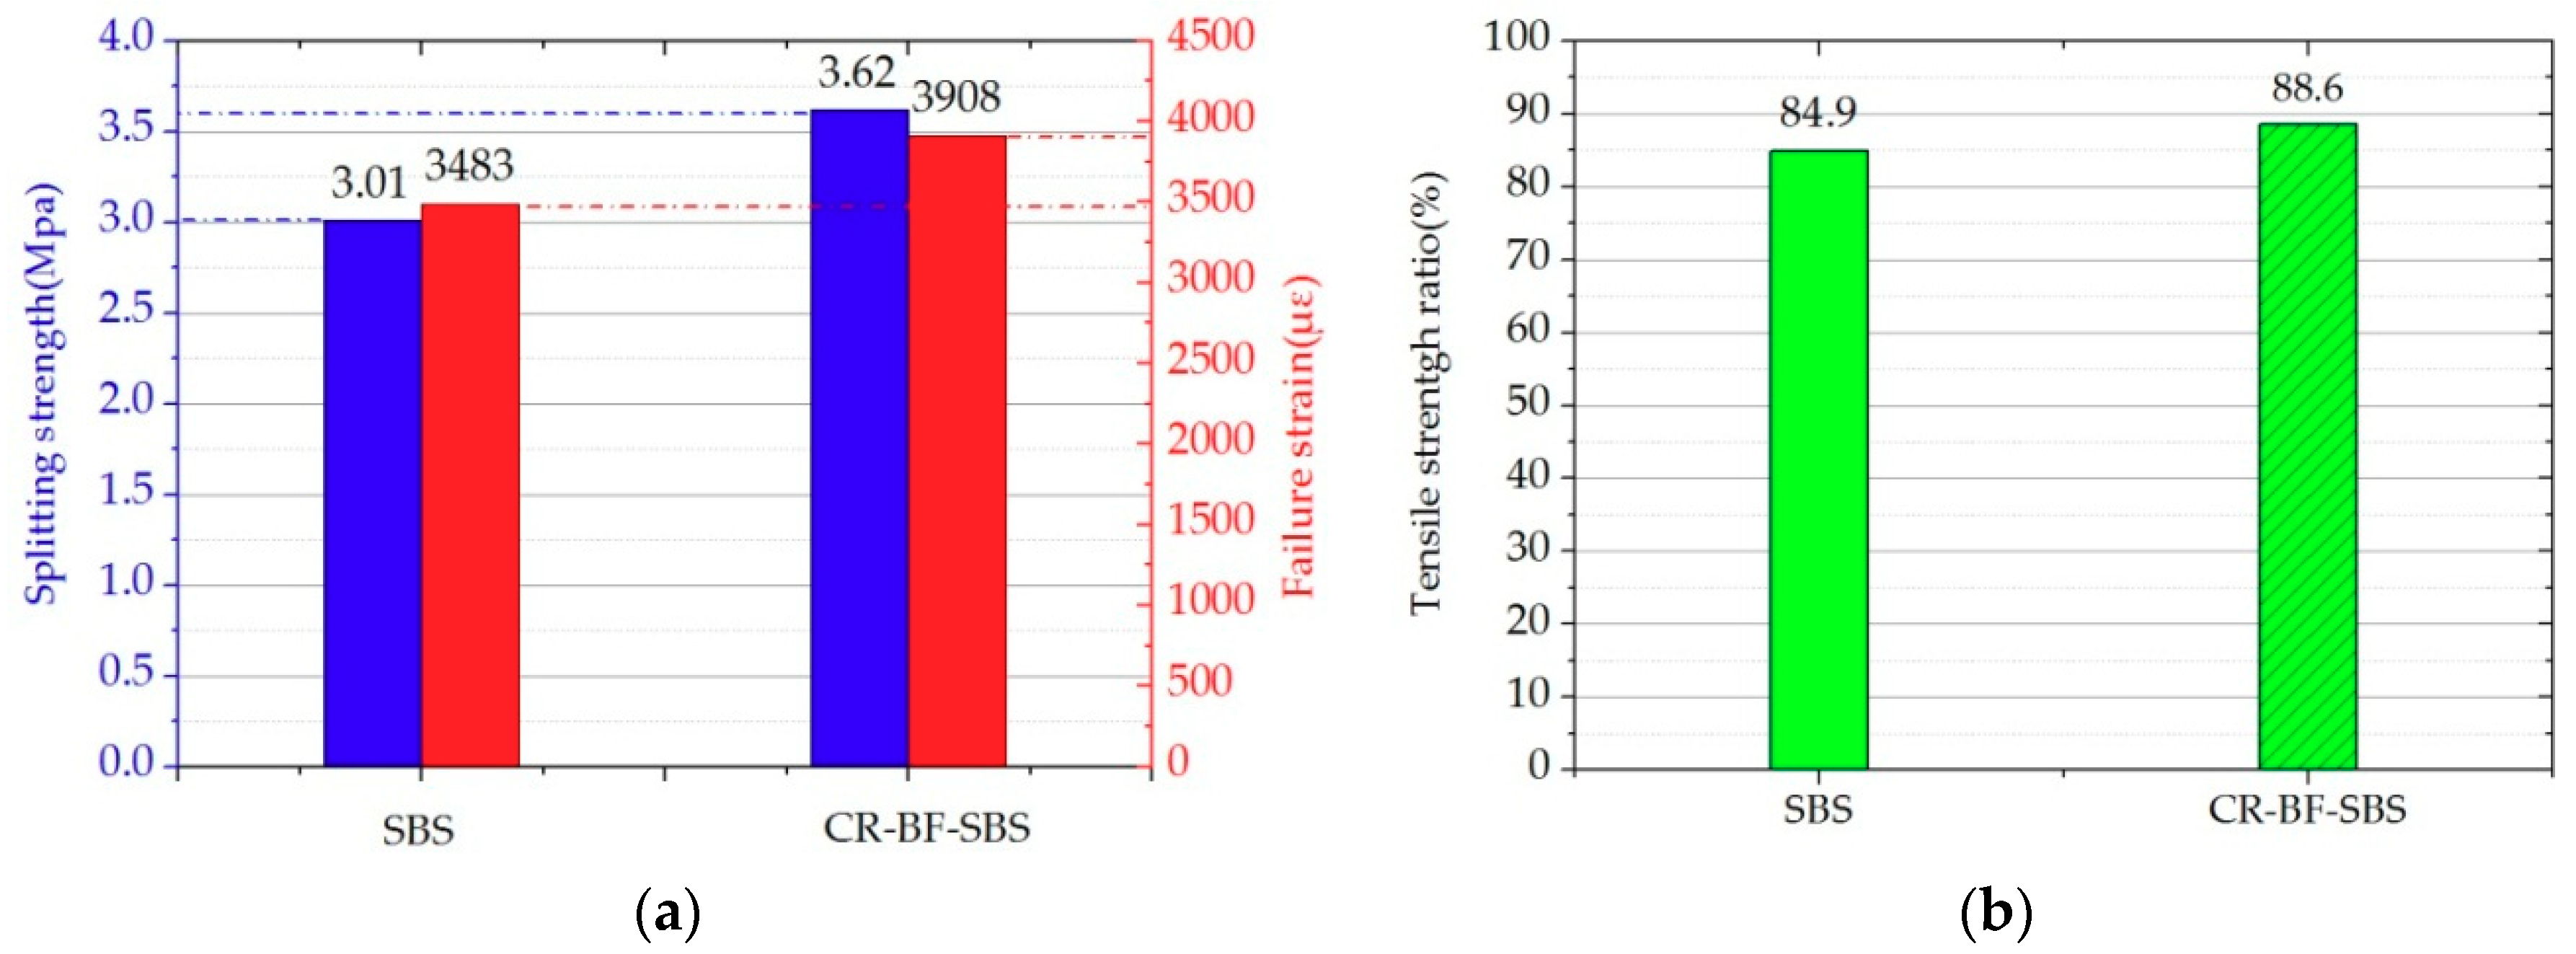
In order to further study the pavement performance of the optimized PAM, a low-temperature splitting test and a freeze-thaw splitting test were carried out. As for the low-temperature splitting test, the experimental temperature is −10 °C, and the load application rate is 1 mm/min. Before the experiment, the specimens were stored for 6 h in a chamber at −10 °C. For freeze-thaw splitting test, the experimental temperature is 25 °C, and the load application rate is 50 mm/min. Specific conditions and processes of the experiments refer to previous research [22]. At the same time, the PAM made of SBS-modified asphalt and the same aggregate grading (without crumb rubber and basalt fiber) was set as the control group, and the same experiments were carried out. The results of experiments are shown in Figure 18.
It can be seen from Figure 18a that, compared with control group, low-temperature splitting strength of optimized PAM is increased by 20.3% and the failure strain increased by 12.2%. This indicates that low-temperature crack resistance of the optimized PAM is significantly enhanced. Furthermore, it can be seen from Figure 18b that the freeze-thaw splitting strength ratio of the optimized PAM is 3.7% higher than that of the control group, which indicates that its water stability is slightly improved.

4. Conclusions

In this study, a new eco-friendly porous permeable asphalt mixture with basalt fiber and crumb rubber was produced. The effect of the asphalt to aggregate ratio, crumb rubber content, and basalt fiber content on the properties of the porous asphalt mixture was studied by using the response surface methodology. After clarifying the influence of three independent variables on the properties of the mixture, the PAM was optimized by a numerical model. The optimal usage of three independent variables was determined and the pavement performance verification was completed. The following conclusions can be drawn:
  • The R2 value of all models in this study is not less than 0.9556, and the prediction error is not more than 4.5%, showing that the response surface method can model the experimental data well and can make accurate performance predictions and optimizations.
  • The asphalt to aggregate ratio has an important effect on all five response values. Excessive use of bitumen leads to a decrease in Marshall stability, a larger flow value, and a lower air void, but at the same time it also improves the adhesion between the aggregate and bitumen, thus reducing the Cantabro particle loss. The optimum asphalt to aggregate ratio for the optimized PAM is 4.51%.
  • The crumb rubber affects the porosity of the porous asphalt mixture by increasing the viscosity of bitumen and filling the structural voids. As the amount of crumb rubber increases, Cantabro particle loss resistance of the mixture is slightly improved, and it has little effect on the Marshall stability and flow value. The optimum crumb rubber content for the optimized PAM is 11.21%.
  • With the increase of the amount of basalt fiber, the Marshall stability first increases and then decreases, the flow value decreases gradually, the Marshall quotient increases first and then stabilizes, and the Cantabro particle loss is first reduced and then increases. The optimum basalt fiber content for the optimized PAM is 0.42%.
  • The optimized porous asphalt mixture has good high-temperature stability, low-temperature crack resistance, and water stability, and its applicability has been improved, which provides a reference for the construction of green ecological pavement.

Author Contributions

Conceptualization, Y.C. (Yongchun Cheng) and C.C.; methodology, C.C. and Y.Z.; validation, Y.C. (Yongchun Cheng); formal analysis, Y.Z.; investigation, C.C. and Y.C. (Yu Chen); writing—original draft preparation, C.C.; writing—review and editing, C.C. and B.Z.; project administration, Y.C. (Yongchun Cheng) and Y.Z.; funding acquisition, Y.C. (Yongchun Cheng).

Funding

This research was funded by the Science Technology Development Program of Jilin Province, grant number 20180201026SF, the National Natural Science Foundation of China, grant number 51678271, and the Transportation Science and Technology Program of Jilin Province, grant number 2018-1-9.

Acknowledgments

The authors would like to thank the anonymous reviewers for their constructive suggestions and comments to improve the quality of the paper. In addition, thanks to the Jilin Dongsheng company for the supply of raw materials.

Conflicts of Interest

The authors declare no conflict of interest.

References

  1. Zhu, X.Y.; Ye, F.Y.; Cai, Y.S.; Birgisson, B.; Lee, K. Self-healing properties of ferrite-filled open-graded friction course (OGFC) asphalt mixture after moisture damage. J. Clean. Prod. 2019, 232, 518–530. [Google Scholar] [CrossRef]
  2. Yang, B.; Li, H.; Zhang, H.J.; Xie, N.; Zhou, H.A. Laboratorial investigation on effects of microscopic void characteristics on properties of porous asphalt mixture. Constr. Build. Mater. 2019, 213, 434–446. [Google Scholar] [CrossRef]
  3. Lastra-Gonzalez, P.; Indacoechea-Vega, I.; Calzada-Perez, M.A.; Castro-Fresno, D.; Vega-Zamanillo, A. Mechanical assessment of the induction heating as a method to accelerate the drying process of cold porous asphalt mixtures. Constr. Build. Mater. 2019, 208, 646–650. [Google Scholar] [CrossRef]
  4. Jiao, Y.B.; Zhang, Y.; Fu, L.X.; Guo, M.; Zhang, L.D. Influence of crumb rubber and tafpack super on performances of SBS modified porous asphalt mixtures. Road Mater. Pavement Des. 2019, 20, S196–S216. [Google Scholar] [CrossRef]
  5. Moretti, L.; Loprencipe, G. Climate Change and Transport Infrastructures: State of the Art. Sustainability 2018, 10, 4098. [Google Scholar] [CrossRef]
  6. You, Q.L.; Zheng, N.X.; Ma, J.L. Study of ravelling failure on dense graded asphalt pavement. Proc. Inst. Civ. Eng. Transp. 2018, 171, 146–155. [Google Scholar] [CrossRef]
  7. Shukry, N.A.M.; Hassan, N.A.; Hainin, M.R.; Abdullah, M.E.; Abdullah, N.A.M.; Mahmud, M.Z.H.; Putrajaya, R.; Mashros, N. Experimental evaluation of anti-stripping additives on porous asphalt mixture. J. Techol. 2016, 78, 113–119. [Google Scholar]
  8. Andres-Valeri, V.C.; Rodriguez-Torres, J.; Calzada-Perez, M.A.; Rodriguez-Hernandez, J. Exploratory study of porous asphalt mixtures with additions of reclaimed tetra pak material. Constr. Build. Mater. 2018, 160, 233–239. [Google Scholar] [CrossRef] [Green Version]
  9. Ma, X.; Li, Q.; Cui, Y.C.; Ni, A.Q. Performance of porous asphalt mixture with various additives. Int. J. Pavement Eng. 2018, 19, 355–361. [Google Scholar] [CrossRef]
  10. Yuniarti, R. Resistance to degradation of porous asphalt mixture using pine resin as asphalt modifier. J. J. Civ. Eng. 2019, 13, 113–123. [Google Scholar]
  11. Qian, Z.; Lu, Q. Design and laboratory evaluation of small particle porous epoxy asphalt surface mixture for roadway pavements. Constr. Build. Mater. 2015, 77, 110–116. [Google Scholar] [CrossRef]
  12. Franesqui, M.A.; Yepes, J.; Garcia-Gonzalez, C.; Gallego, J. Sustainable low-temperature asphalt mixtures with marginal porous volcanic aggregates and crumb rubber modified bitumen. J. Clean. Prod. 2019, 207, 44–56. [Google Scholar] [CrossRef]
  13. Maria Rodriguez-Alloza, A.; Gallego, J. Mechanical performance of asphalt rubber mixtures with warm mix asphalt additives. Mater. Struct. 2017, 50, 147. [Google Scholar] [CrossRef]
  14. Jiao, Y.B.; Liu, S.Q.; Fu, L.X.; Shan, W.C. Fracture monitoring of SBS and crumb rubber modified porous asphalt mixtures under compression and splitting testing using acoustic emission technique. J. Mater. Civ. Eng. 2019, 31, 6. [Google Scholar] [CrossRef]
  15. Xie, Z.X.; Shen, J.N. Performance of porous European mix (PEM) pavements added with crumb rubbers in dry process. Int. J. Pavement Eng. 2016, 17, 637–646. [Google Scholar] [CrossRef]
  16. Sangiorgi, C.; Eskandarsefat, S.; Tataranni, P.; Simone, A.; Vignali, V.; Lantieri, C.; Dondi, G. A complete laboratory assessment of crumb rubber porous asphalt. Constr. Build. Mater. 2017, 132, 500–507. [Google Scholar] [CrossRef]
  17. Tanzadeh, J.; Shahrezagamasaei, R. Laboratory assessment of hybrid fiber and nano-silica on reinforced porous asphalt mixtures. Constr. Build. Mater. 2017, 144, 260–270. [Google Scholar] [CrossRef]
  18. Afonso, M.L.; Dinis-Almeida, M.; Fael, C.S. Study of the porous asphalt performance with cellulosic fibres. Constr. Build. Mater. 2017, 135, 104–111. [Google Scholar] [CrossRef] [Green Version]
  19. Cheng, Y.C.; Li, L.D.; Zhou, P.L.; Zhang, Y.W.; Liu, H.B. Multi-objective optimization design and test of compound diatomite and basalt fiber asphalt mixture. Materials 2019, 12, 1461. [Google Scholar] [CrossRef]
  20. Wang, W.S.; Cheng, Y.C.; Ma, G.R.; Tan, G.J.; Sun, X.; Yang, S.T. Further investigation on damage model of Eco-friendly basalt fiber modified asphalt mixture under freeze-thaw cycles. J. Appl. Sci. 2019, 9, 60. [Google Scholar] [CrossRef]
  21. Wu, J.; Hong, R.; Gu, C. Influence of fiber type on low-temperature fracture performance of presawed asphalt mixture beams. Adv. Mater. Sci. Eng. 2018, 2018, 5087395. [Google Scholar] [CrossRef]
  22. Cheng, Y.C.; Chai, C.; Liang, C.Y.; Chen, Y. Mechanical performance of warm-mixed porous asphalt mixture with steel slag and crumb-rubber-SBS modified bitumen for seasonal frozen regions. Materials 2019, 12, 857. [Google Scholar] [CrossRef] [PubMed]
  23. Montgomery, D.C. Design and Analysis of Experiments, 6th ed.; John Wiley &Sons: New York, NY, USA, 2006. [Google Scholar]
  24. Omranian, S.R.; Hamzah, M.O.; Valentin, J.; Hasan, M.R.M. Determination of optimal mix from the standpoint of short term aging based on asphalt mixture fracture properties using response surface method. Constr. Build. Mater. 2018, 179, 35–48. [Google Scholar] [CrossRef]
  25. Wang, W.S.; Cheng, Y.C.; Tan, G.J. Design optimization of SBS-modified asphalt mixture reinforced with Eco-friendly basalt fiber based on response surface methodology. Materials 2018, 11, 1311. [Google Scholar] [CrossRef]
  26. Hamzah, M.O.; Yee, T.S.; Golchin, B.; Voskuilen, J. Use of imaging technique and direct tensile test to evaluate moisture damage properties of warm mix asphalt using response surface method. Constr. Build. Mater. 2017, 132, 323–334. [Google Scholar] [CrossRef]
  27. Saha, G.; Biligiri, K.P. Cracking performance analysis of asphalt mixtures using response surface methodology: Experimental investigations and statistical optimization. Mater. Struct. 2017, 50, 33. [Google Scholar] [CrossRef]
  28. Fu, L. Study on Road Performance and Acoustic Emission Characteristics of High Viscosity Modified Permeable Asphalt Mixture. Master’s Thesis, Jilin University, Changchun, China, 2018. [Google Scholar]
  29. Ministry of Transport of the People’s Republic of China. Standard Test Methods of Bitumen and Bituminous Mixtures for Highway Engineering; Ministry of Transport of the People’s Republic of China: Beijing, China, 2011. (In Chinese)
  30. Hamzah, M.O.; Golchin, B.; Tye, C.T. Determination of the optimum binder content of warm mix asphalt incorporating Rediset using response surface method. Constr. Build. Mater. 2013, 47, 1328–1336. [Google Scholar] [CrossRef]
  31. Nassar, A.I.; Thom, N.; Parry, T. Optimizing the mix design of cold bitumen emulsion mixtures using response surface methodology. Constr. Build. Mater. 2016, 104, 216–229. [Google Scholar] [CrossRef]
  32. Wang, S.; Kang, A.H.; Xiao, P.; Li, B.; Fu, W.L. Investigating the effects of chopped basalt fiber on the performance of porous asphalt mixture. Adv. Mater. Sci. Eng. 2019, 2019, 12. [Google Scholar] [CrossRef]
  33. Morova, N. Investigation of usability of basalt fibers in hot mix asphalt concrete. Constr. Build. Mater. 2013, 47, 175–180. [Google Scholar] [CrossRef]
  34. Ministry of Housing and Urban-Rural Development of the People’s Republic of China. Technical Specification for Permeable Asphalt Pavement; Ministry of Housing and Urban-Rural Development of the People’s Republic of China: Beijing, China, 2012. (In Chinese)
Figure 1. Appearance of crumb rubber and basalt fiber: (a) crumb rubber; (b) basalt fiber.
Sustainability 11 05754 g001
Figure 2. Aggregate gradation of PAM.
Sustainability 11 05754 g002
Figure 3. Normal probability plot of VA.
Sustainability 11 05754 g003
Figure 4. Predictions and actual values of VA.
Sustainability 11 05754 g004
Figure 5. 3D surface plots between VA and factors: (a) Influence of A, B at C = 0.40; (b) influence of A, C at B = 10.0; (c) influence of B, C at A = 4.5.
Sustainability 11 05754 g005aSustainability 11 05754 g005b
Figure 6. Normal probability plot of MS.
Sustainability 11 05754 g006
Figure 7. Predictions and actual values of MS.
Sustainability 11 05754 g007
Figure 8. 3D surface plots between MS and factors: (a) Influence of A, B at C = 0.40; (b) influence of A, C at B = 10.0; (c) influence of B, C at A = 4.5.
Sustainability 11 05754 g008aSustainability 11 05754 g008b
Figure 9. Normal probability plot of FV.
Sustainability 11 05754 g009
Figure 10. Predictions and actual values FV.
Sustainability 11 05754 g010
Figure 11. 3D surface plots between FV and factors: (a) Influence of A, B at C = 0.40; (b) influence of A, C at B = 10.0; (c) influence of B, C at A = 4.5.
Sustainability 11 05754 g011
Figure 12. Normal probability plot of MQ.
Sustainability 11 05754 g012
Figure 13. Predictions and actual values of MQ.
Sustainability 11 05754 g013
Figure 14. 3D surface plots between MQ and factors: (a) Influence of A, B at C = 0.40; (b) influence of A, C at B = 10.0; (c) influence of B, C at A = 4.5.
Sustainability 11 05754 g014
Figure 15. Normal probability plot of CPL.
Sustainability 11 05754 g015
Figure 16. Predictions and actual values CPL.
Sustainability 11 05754 g016
Figure 17. 3D surface plots between CPL and factors: (a) Influence of A, B at C = 0.40; (b) influence of A, C at B = 10.0; (c) influence of B, C at A = 4.5.
Sustainability 11 05754 g017aSustainability 11 05754 g017b
Figure 18. Pavement performance test results: (a) Low-temperature cracking resistance; (b) moisture stability.
Sustainability 11 05754 g018
Table 1. Properties of SBS-modified bitumen.
PropertiesResultsChinese Standard
Penetration (25 °C, 0.1 mm)65.260–80
Softening point (°C)64.2≥55
Ductility (5 °C, cm)34.5≥30
Flash point (°C)264≥230
Elastic recovery (25 °C, %)91.7≥65
Table 2. Properties of aggregates and filler.
IndexApparent Specific Density (g/cm3)Los Angeles Abrasion (%)Crushed Stone Value (%)
Coarse aggregate3.52712.913.9
Fine aggregate3.389
Filler2.722
Table 3. Physical properties of crumb rubber.
PropertiesResultsTechnical Criterion
Apparent density (g/cm3)1.181.1–1.3
Metal content (%)0.038<0.05
Moisture content (%)0.32<1
Fiber content (%)0.43<1
Ash content (%)4.5≤8
Table 4. Physical properties of basalt fiber.
IndexDiameterLengthSpecific GravityTensile Strength
Unitsμmmmg/cm3MPa
Value1362.632320
Table 5. Experimental results of 19 groups.
Test Serial NumberIndependent VariablesResponses
ABCVAMSFVMQCPL
(%)(%)(%)(%)(kN)(mm)(kN/mm)(%)
14.5100.2520.427.643.901.95914.42
2480.2520.647.353.332.20715.02
34.580.419.878.043.502.2979.85
44.5100.5520.917.653.162.42113.59
5480.5521.687.593.152.41028.97
65120.5518.367.303.532.0684.03
75120.2518.027.074.561.5504.35
84.5100.420.128.283.262.54012.18
94.5100.420.208.213.382.42910.65
104120.2521.107.223.252.22216.99
11580.5519.347.384.141.7838.27
125100.418.787.874.251.8525.29
134.5120.419.577.953.212.4779.74
144.5100.420.298.183.312.47110.36
154.5100.420.458.303.422.42710.78
16580.2520.037.244.421.6386.07
174100.421.737.933.252.44017.14
184.5100.419.958.323.282.53712.35
194120.5521.177.493.002.49721.78
Table 6. The ANOVA results of the VA model.
Quadratic SumDFMean SquareR2Adj. R2F Valuep ValueSignificant
Model17.5391.950.94630.892617.630.0001
Residual error0.9990.11
Lack of fit0.8650.17 4.90.0743×
Pure error0.1440.035
Sum18.5218
Table 7. The ANOVA results of independent variables in VA model.
FactorsSum of SquaresDFMean SquareF Valuep ValueSignificant
A13.90113.9125.78<0.0001****
B1.1211.1210.090.0112*
C0.1610.161.410.2648
AB1.0811.089.780.0122*
AC0.2710.272.410.1549
BC0.0004510.000450.0040.9505
A20.0009610.000960.0080.9275
B20.8410.847.580.0223*
C20.4210.423.780.0836
Note: “****” p < 0.0001; “***” 0.0001 ≤ p < 0.001; “**” 0.001 ≤ p < 0.01; “*” 0.01 ≤ p < 0.05; “-” p ≥ 0.05.
Table 8. The ANOVA results of the MS model.
Quadratic SumDFMean SquareR2Adj. R2F Valuep ValueSignificant
Model3.0190.330.97540.950939.69<0.0001
Residual error0.07690.0084
Lack of fit0.06150.012 3.400.1298×
Pure error0.01440.0036
Sum3.0918
Table 9. The ANOVA results of independent variables in MS model.
FactorsSum of SquaresDFMean SquareF Valuep ValueSignificant
A0.05210.0526.140.0351*
B0.03210.0323.850.0814
C0.07910.0799.390.0135*
AB0.0000510.000050.00590.9403
AC0.002410.00240.290.6031
BC0.001810.00180.210.6552
A20.1610.1619.340.0017**
B20.06110.0617.230.0248*
C20.6810.6880.76<0.0001****
Note: “****” p < 0.0001; “***” 0.0001 ≤ p < 0.001; “**” 0.001 ≤ p < 0.01; “*” 0.01 ≤ p < 0.05; “-” p ≥ 0.05.
Table 10. The ANOVA results of FV model.
Quadratic SumDFMean SquareR2Adj. R2F Valuep ValueSignificant
Model3.8090.420.96040.920924.28<0.0001
Residual error0.1690.017
Lack of fit0.1450.028 6.010.0535×
Pure error0.01840.0046
Sum3.9618
Table 11. The ANOVA results of independent variables in the FV model.
FactorsSum of SquaresDFMean SquareF Valuep ValueSignificant
A2.4212.42139.12<0.0001****
B0.09810.0985.630.0417*
C0.6210.6235.350.0002***
AB0.007210.00720.410.5361
AC0.09710.0975.560.0427*
BC0.08410.0844.830.0555
A20.2610.2614.870.0039**
B20.02110.0211.200.3025
C20.02110.0211.210.3001
Note: “****” p < 0.0001; “***” 0.0001 ≤ p < 0.001; “**” 0.001 ≤ p < 0.01; “*” 0.01 ≤ p < 0.05; “-” p ≥ 0.05.
Table 12. The ANOVA results of MQ model.
Quadratic SumDFMean SquareR2Adj. R2F Valuep ValueSignificant
Model1.7690.200.95940.918923.66<0.0001
Residual error0.07490.0082
Lack of fit0.06250.012 4.020.1013×
Pure error0.01240.003
Sum1.8318
Table 13. The ANOVA results of the independent variables in the MQ model.
FactorsSum of SquaresDFMean SquareF Valuep ValueSignificant
A0.8310.83100.86<0.0001****
B0.02310.0232.780.1298
C0.2610.2631.140.0003***
AB0.001110.00110.140.7201
AC0.004210.00420.520.4898
BC0.02510.0253.000.1173
A20.1410.1417.340.0024**
B20.000410.00040.0490.8300
C20.09310.09311.310.0083**
Note: “****” p < 0.0001; “***”0.0001 ≤ p < 0.001; “**” 0.001 ≤ p < 0.01; “*” 0.01 ≤ p < 0.05; “-” p ≥ 0.05.
Table 14. The ANOVA results of the CPL model.
Quadratic SumDFMean SquareR2Adj. R2F Valuep ValueSignificant
Model653.35972.590.95560.911221.52<0.0001
Residual error30.3793.37
Lack of fit26.9255.38 6.250.0501×
Pure error3.4540.86
Sum683.7118
Table 15. The ANOVA results of the independent variables in the CPL model.
FactorsSum of SquaresDFMean SquareF Valuep ValueSignificant
A516.821516.82153.18<0.0001****
B12.75112.753.780.0838
C39.16139.1611.610.0078**
AB0.06810.0680.0200.8899
AC35.53135.5310.530.0101*
BC17.05117.055.050.0512
A20.1210.120.0360.8543
B24.0014.001.190.3045
C224.59124.597.290.0244*
Note: “****” p < 0.0001; “***” 0.0001 ≤ p < 0.001; “**” 0.001 ≤ p < 0.01; “*” 0.01 ≤ p < 0.05; “-” p ≥ 0.05.
Table 16. Target values of response variables.
ResponseVA (Y1)MS (Y2)FV (Y3)MQ (Y4)CPL (Y5)
Units%kNmmkN/mm%
Target value18–22Maximize2–4MaximizeMinimize
Table 17. Optimal preparation parameters and prediction vs. experiment.
ResponseA (%)B (%)C (%)VA (%)MS (kN)FV (mm)MQ (kN/mm)CPL (%)
Prediction4.5111.210.4219.828.123.262.4810.03
Experiment4.5111.210.4220.167.923.342.3710.38
Chinese Standard18–25≥52–4<15
Relative error (%)1.70−2.46−2.45−4.383.49