1. Introduction
Firms play an important role in a country’s economic development, and are responsible for the extraction and consumption of many of the natural resources. As a result, they have affected our environment, causing a serious impact on human health. In both developed and developing countries, the environmental issue has received an increasing amount of attention. Therefore, new policies to enhance environmental protection and carbon dioxide (CO
) emission savings have been introduced to regulate the behaviour of firms in green energy technology investment as well as building energy consumption. The existence of such policies has posed a challenge for firms’ decarbonisation investment decision-making. In addition, the efficiency of these investment decisions is influenced by firms’ budget that depends on their environmental protection awareness. There is a need to build a support tool for firms in making the optimal investment decisions under the uncertainty such that profit maximisation is achieved and the government’s environmental policies are complied with. This helps firms achieve the maximum profit while the quality of environment is improved. The firms’ synchronised decarbonisation investments promote environmental sustainability, one of the United Nation’s sustainable development goals [
1].
From the literature, works related to decarbonisation investment strategies mostly focus on two major approaches: (i) how the environmental awareness of consumers affects the market share and green degree of products; and (ii) how the government’s environmental policies affect the environmental quality of green products determined by firms.
In the first approach, when the environmental awareness of consumers is increased, they are willing to pay higher prices for green products (a comprehensive review of the term green product can be found in Sdrolia and Zarotiadis [
2]). Then, a firm’s production and operation strategies may be significantly affected to cope with other firm’s competition for occupying market share and maximising profit. Previous works have studied customer’s environmental awareness, based on the willingness to pay, with a certain distribution for characterising consumer heterogeneity. Rhee [
3] investigated the effects of consumer heterogeneity, along with unobservable attributes to firms, on both quality and price equilibrium in a two-stage game framework. The result shows that, when consumers are sufficiently heterogeneous along with the unobservable attributes, firms offer products of identical qualities in equilibrium. Otherwise, quality differentiation is considered as an equilibrium strategy in a variety of uncooperative situations. Amacher et al. [
4] developed a three-stage game model of investment, environmental quality provision, and price competition to study the impact of green technology investment under consumer’s eco-friendly preferences. The model assumes that consumers can observe the investment levels of firms, and firms can observe the preferences of consumers. The result shows that firms’ incentives in green technology investment depend on their relative cost structure. In addition, it has a potentially important implication for a government targeting the eco-labelling behaviour of firms. In particular, eco-labelling might be helpful to achieve both the goals of reducing excessive investments and increasing average environmental quality by changing the firms’ effective investment unit cost. Conrad [
5] used a spatial duopoly model to evaluate how customer’s environmental awareness affects prices, product characteristics and market shares of the competing firms. The model is based on a two-stage game in which each firm chooses the characteristic of its product at the first stage, and its price at the second stage. The author found that the market share of the environmental goods increase in each type with environmental concern and it declines if costs are higher to produce the goods. In addition, the location of the social welfare maximising characteristics is not the same as the one chosen by private firms in the three Nash equilibria. Liu et al. [
6] studied the impact of production competition and consumer environmental awareness on eco-friendly operation improvement and prices in two-stage supply chains. Two-stage Stackelberg game models are used to investigate the dynamics among the supply chain players in three supply chain network structures. The analysis shows that increasing consumers’ environmental awareness brings benefit for retailers and manufacturers with superior eco-friendly operations. If the production competition level is low, the profitability of the inferior eco-friendly firm tends to increase; otherwise, it tends to decrease. Zhang et al. [
7] studied the impact of consumer environmental awareness on the order quantities of environmentally friendly and traditional products, as well as channel coordination within a one-manufacturer and one-retailer supply chain. The authors investigated three decision scenarios, such as the centralised model, the decentralised model, and the decentralised model with the coordination of a return contract, along with a production capacity constraint of the manufacturer in the model. For each scenario, the closed-form expressions of optimal order quantities, wholesale prices and return credits are derived. Xu et al. [
8] investigated the pricing and greenness issues of two competitive firms with and without consumer heterogeneity. The authors derived and compared the optimal solutions and profits employed by firms under different scenarios. In addition, the effects of consumer heterogeneity under different competition intensities are also determined. Zhong and Chen [
9] constructed a behavioural game model to explore how environmental beliefs affect consumer willingness to pay for the greenness premium. They used survey data of consumer choices of low-carbon rice within central Chinese cities to analyse factors influencing consumer willingness to pay for the greenness premium.
In general, the studies of the first research approach find that increasing consumer environmental awareness will bring benefit for firms with eco-friendly operations since customers are willing to pay more for green products. Hence, firms are encouraged to follow the eco-friendly operations to gain competitive advantage. However, there are organisational difficulties and consequences. Bakker et al. [
10] discussed the organisational aspects of product-oriented environmental management (POEM) from an individual firm’s perspective. Two case studies in the chemical industry provided valuable findings on the organisation of POEM. In particular, creating sufficient flexibility, a broad involvement across functions and a managerial ability to build required capabilities are considered as important factors in the process of organising POEM. Matus et al. [
11] examined “green chemistry” innovations in the United States for the determination of conditions under which firms are able to develop and implement innovations with the benefits of sustainable development. Six categories of challenges, commonly confronted by innovators, are identified, including economic and financial, regulatory, technical, organisational, cultural, and definition and metrics. The absence of clear definitions and metrics, and the interdisciplinary demands of these innovations are considered as two major barriers. The authors discussed some successful strategies in overcoming these barriers, and the policy types that could bring positive impacts moving forward. A systematic review of various challenges for implementing green concept in sustainable manufacturing can be found in [
12]. Under the impact of customer environmental awareness, firms could adjust their operation strategies to achieve competition advantage, which is helpful for the environmental issues. However, due to the various challenges of implementing green product, firms are often hesitant to change their operation strategies unless they recognise clear benefits. Therefore, the government intervenes by imposing environmental policies.
The second approach focuses on how policies affect the environmental quality of green products determined by firms. Chen [
13] developed a quality-based model to analyse the strategic and policy issues concerning the development of products with conflicting traditional and environmental attributes. The author studied firm’s strategic decisions, regarding the number of products and their prices and qualities, by jointly considering the interactions among the customers’ preferences, the firm’s product strategies, and the environmental standards imposed by governments. This study reports some findings that can be used to manage and regulate the development of green products. Sheu and Chen [
14] used a three-stage game theoretic model to evaluate the effects of the governmental financial interventions on green supply chain competition. The authors suggested that the government should adopt green taxation and subsidisation policies to ensure that green profit attributed to the production of green products is non-negative. In the green supply chain, low-wholesale-price strategies should be used for recycled-component suppliers under green subsidisation policy in order to stimulate firms’ concern of green products under green taxation policy. The results also show that overall social welfare and chain-based profits are improved when applying the governmental financial intervention. Hafezalkotob [
15] developed a price competition model, based on the game theory, of two green and regular supply chains under the effects of government financial intervention. The author analysed how the government’s tariffs affect the players’ optimal strategies in a green supply chain. The results show that there are specific boundaries for tariffs which guarantee a stable competitive market, and that the environmental protection and social responsibility tendencies of the government have measurable impacts on the government’s revenue as well as the supply chains’ and their members’ profits. Guo et al. [
16] focused on the analysis of supply chain (including supplier, manufacturer and government) under different subsidy policies of the government. The game and optimisation theories are utilised to calculate and compare the optimal decisions and profits of players in two scenarios: (i) the government provides a subsidy rate to the cost of manufacturer’s greenness efforts (namely, the first subsidy policy); and (ii) the government grants a per unit subsidy to the manufacturer for the demand for green product (namely, the second subsidy policy). The study derives the necessary condition for the most effective subsidy policy that maximises expected social welfare and profits. In addition, interesting findings are derived: (i) for a manufacturer with low marginal profit, the government tends to provide high and low subsidy rates under the first and second subsidy policies, respectively; and (iii) the government’s subsidy policy selection depends on the sensitivity of consumers to price. Bi et al. [
17] studied the use of governmental subsidy policy to motivate firms’ adoption of green technology when consumers are environmentally discerning. The study investigates two profit-maximising firms with two products that differ only in the manufacturing costs, the selling prices and the amount of pollutant emissions per unit of product. Each firm needs to determine the selling prices of the products under the impact of green technology on costs and customer demands. The authors considered two scenarios: (i) the government has limited budget and can choose only one firm at most to provide subsidy; and (ii) the government has sufficient budget and can choose both firms to provide subsidy. For each scenario, they derived criteria for choosing firms for the government’s subsidy. In addition, they built criteria for firms’ investment in the green technology. Gao and Zheng [
18] constructed a three-stage Stackelberg game model to analyse the interaction between a profit-maximising firm (namely, Stackelberg leader) facing emission-dependent demand, and the environmental regulator (namely, Stackelberg follower). In the model, the firm is based on its understanding of the regulator’s profit function to make decision on the green technology level. The results show that the regulator’s high environmental concerns do not necessarily lead to the firm’s green technology choice, and firm’s green investment level depends on the combined effects of the market and operational factors for a given level of the regulator’s environmental concerns. In addition, increasing customers’ environmental awareness is an effective way to drive the firm’s green investment. Jin et al. [
19] studied the effect of carbon tax policy on two firms in an industry, who sell ordinary products and green products, respectively. In this study, the government aims to increase its revenue and reduce its expenditure and the carbon emission by imposing a carbon tax policy on the ordinary products to promote the relevant firms. Then, the firms need to explore their pricing strategies under the government’s tax policy. The authors proposed a centralised data envelopment analysis approach to determine the optimal carbon tax rate and to achieve three objectives of the government simultaneously. The results show that the government may set a high tax rate if one firm produces ordinary products and another produces green products. In the case that both firms produce ordinary products, the optimal tax policy for each firm is different and the government may set a higher tax rate for one firm and a lower tax rate for the other firm. Gao et al. [
20] examined the effect of environmental tax deduction (ETD) incentive on emission reduction by Stackelberg game models between an environmental regulator and a profit-maximising monopolistic firm facing emission-dependent demand under various cases, such as with/without the regulator’s environmental concerns. This study shows that if the regulator has a moderate level of environmental concern and emission standard, it can set an ETD incentive to motivate the choice of a higher emission reduction level and simultaneously increase social welfare; otherwise, it can expense social welfare to increase the environmental quality. In addition, when increasing the market’s environmental consciousness, it is easier for the regulator to guide firms to adopt the ETD incentive. In other words, improving consumers’ environmental protection awareness is an effective solution to promote of firm’s green investment. As for the incentives of operations, Yenipazarli [
21] studied the impact of research and development (R&D) on the environmental cost of production processes. The author used a two-stage duopoly model to demonstrate how consumer demands, competitor actions and regulatory requirements can affect firm’s environmental R&D incentives. In the model, firms are regulated by a constant unit emissions cost under an emissions tax. The results show that the external forces can induce firms to exert higher R&D efforts. Zhao and Chen [
22] built the principal-agent models to explore the optimal subsidy mechanism for green products for maximisation of net policy return, which not only encourages the development of green products but also reduces financial burden for the government. The results show that improving investors’ preference and eliminating asymmetric information contribute to subsidy cost savings. In addition, improving consumers’ environmental awareness, promoting the development and application of green technology, and reducing market risk decrease subsidy costs.
A summary of the previous studies on two above-mentioned research approaches, along with constraints at firm level, is provided in
Table 1. From these studies, it can be seen that customers’ environmental awareness, and the government’s environmental concern and policies (e.g., subsidy, tariff and taxation) can affect a firm’s operation strategies in implementing green products. However, the major challenge for implementing green products is on the firm’s uncertain investment budget, which is influenced by the firm’s awareness of environmental protection. If a firm has a higher awareness of environmental protection, it is willing to set a bigger budget for the investment of green products. The previous studies have not paid attention to the impact of a firm’s environmental protection awareness (or a firm’s uncertain investment budget) on the firm’s investment decisions. Furthermore, under the constraint of uncertain budget, the quality and price equilibrium in the two/three-stage game models could be difficult to derive. In addition, to promote the development of green energy technology and emission reduction, the government has imposed an incentive taxation policy where increasing total CO
emission savings can help firm reduce more taxation. On the other hand, improving the environmental quality depends not only on the development of green products, but also on the savings of building energy consumption for firms. The building energy efficiency is often stated as a goal by governments since costs associated with the energy consumption are not always confined to the users. In this paper, we thus propose a mixed-integer non-linear programming (MINLP) model to determine the set of optimal decarbonisation investment decisions, based on green energy technology and building energy consumption efficiency. The objective of this model is to maximise profit under the constraint of uncertain budget (due to the influence of environmental protection awareness) and the government’s taxation policy formulated as a step-wise linear function. With the firms’ synchronised decarbonisation investments, a sustainable environment with low CO
emission can become realistic. In Operational Research, MINLP has proven to be a powerful tool for modelling non-linear practical problems with continuous and integer variables. It has been applied in engineering optimisation, but not in decarbonisation investment problem yet. In addition, a lack of efficient optimisation solvers for MINLP problems limits its applicability (see [
23,
24] for MINLP’s advanced theoretical, algorithmic, and computational development in details). Hence, a linearised model is developed to efficiently solve the non-linear decarbonisation investment problem. A case study for a sector of electronic components manufacturing in Nottingham, the United Kingdom, and several randomly generated instances were used to demonstrate the effectiveness and efficiency of the proposed model.
The remainder of this paper is organised as follows. In
Section 2, we present a MINLP model for the firms’ decarbonisation investment problem and discuss how to use the uncertainty theory of Liu [
25] to formulate the influence of firm’s environmental protection awareness on its investment budget. Then, we describe a linearised model for efficiently solving this non-linear problem in the same section. Numerical experiments and results for demonstrating the efficiency and effectiveness of our model are shown in
Section 3. Finally,
Section 4 provides a summary of the paper’s findings and future research possibilities.
2. A MINLP Model for Firms’ Decarbonisation Investment Problem
In this section, we describe how to formulate the firms’ decarbonisation investment problem under the impact of its environmental protection awareness and the government’s taxation policy as a mixed-integer non-linear programming model. Next, we present how to apply the uncertainty theory for dealing with the uncertain investment budget under the impact of environmental protection awareness. Then, a linearised technique is introduced to solve the non-linear problem.
2.1. A MINLP Model
To formulate a mathematical programming model for firms’ decarbonisation investment problem, some notations of sets and parameters are defined as follows. We denote the overall set of investment categories by , where is the set of single-choice investment categories in which only one investment option can be chosen (e.g., a green energy technology rate) and is the set of multiple-choice investment categories in which more than one investment options can be selected (e.g., repair/change roof, windows, walls, floor and boiler for building energy efficiency improvement). For each investment category , we denote the list of investment options by . For each investment option j in category i, we denote the corresponding investment cost (thousands pound sterling, GBP) and potential CO emission saving (kilogram CO) by and , respectively.
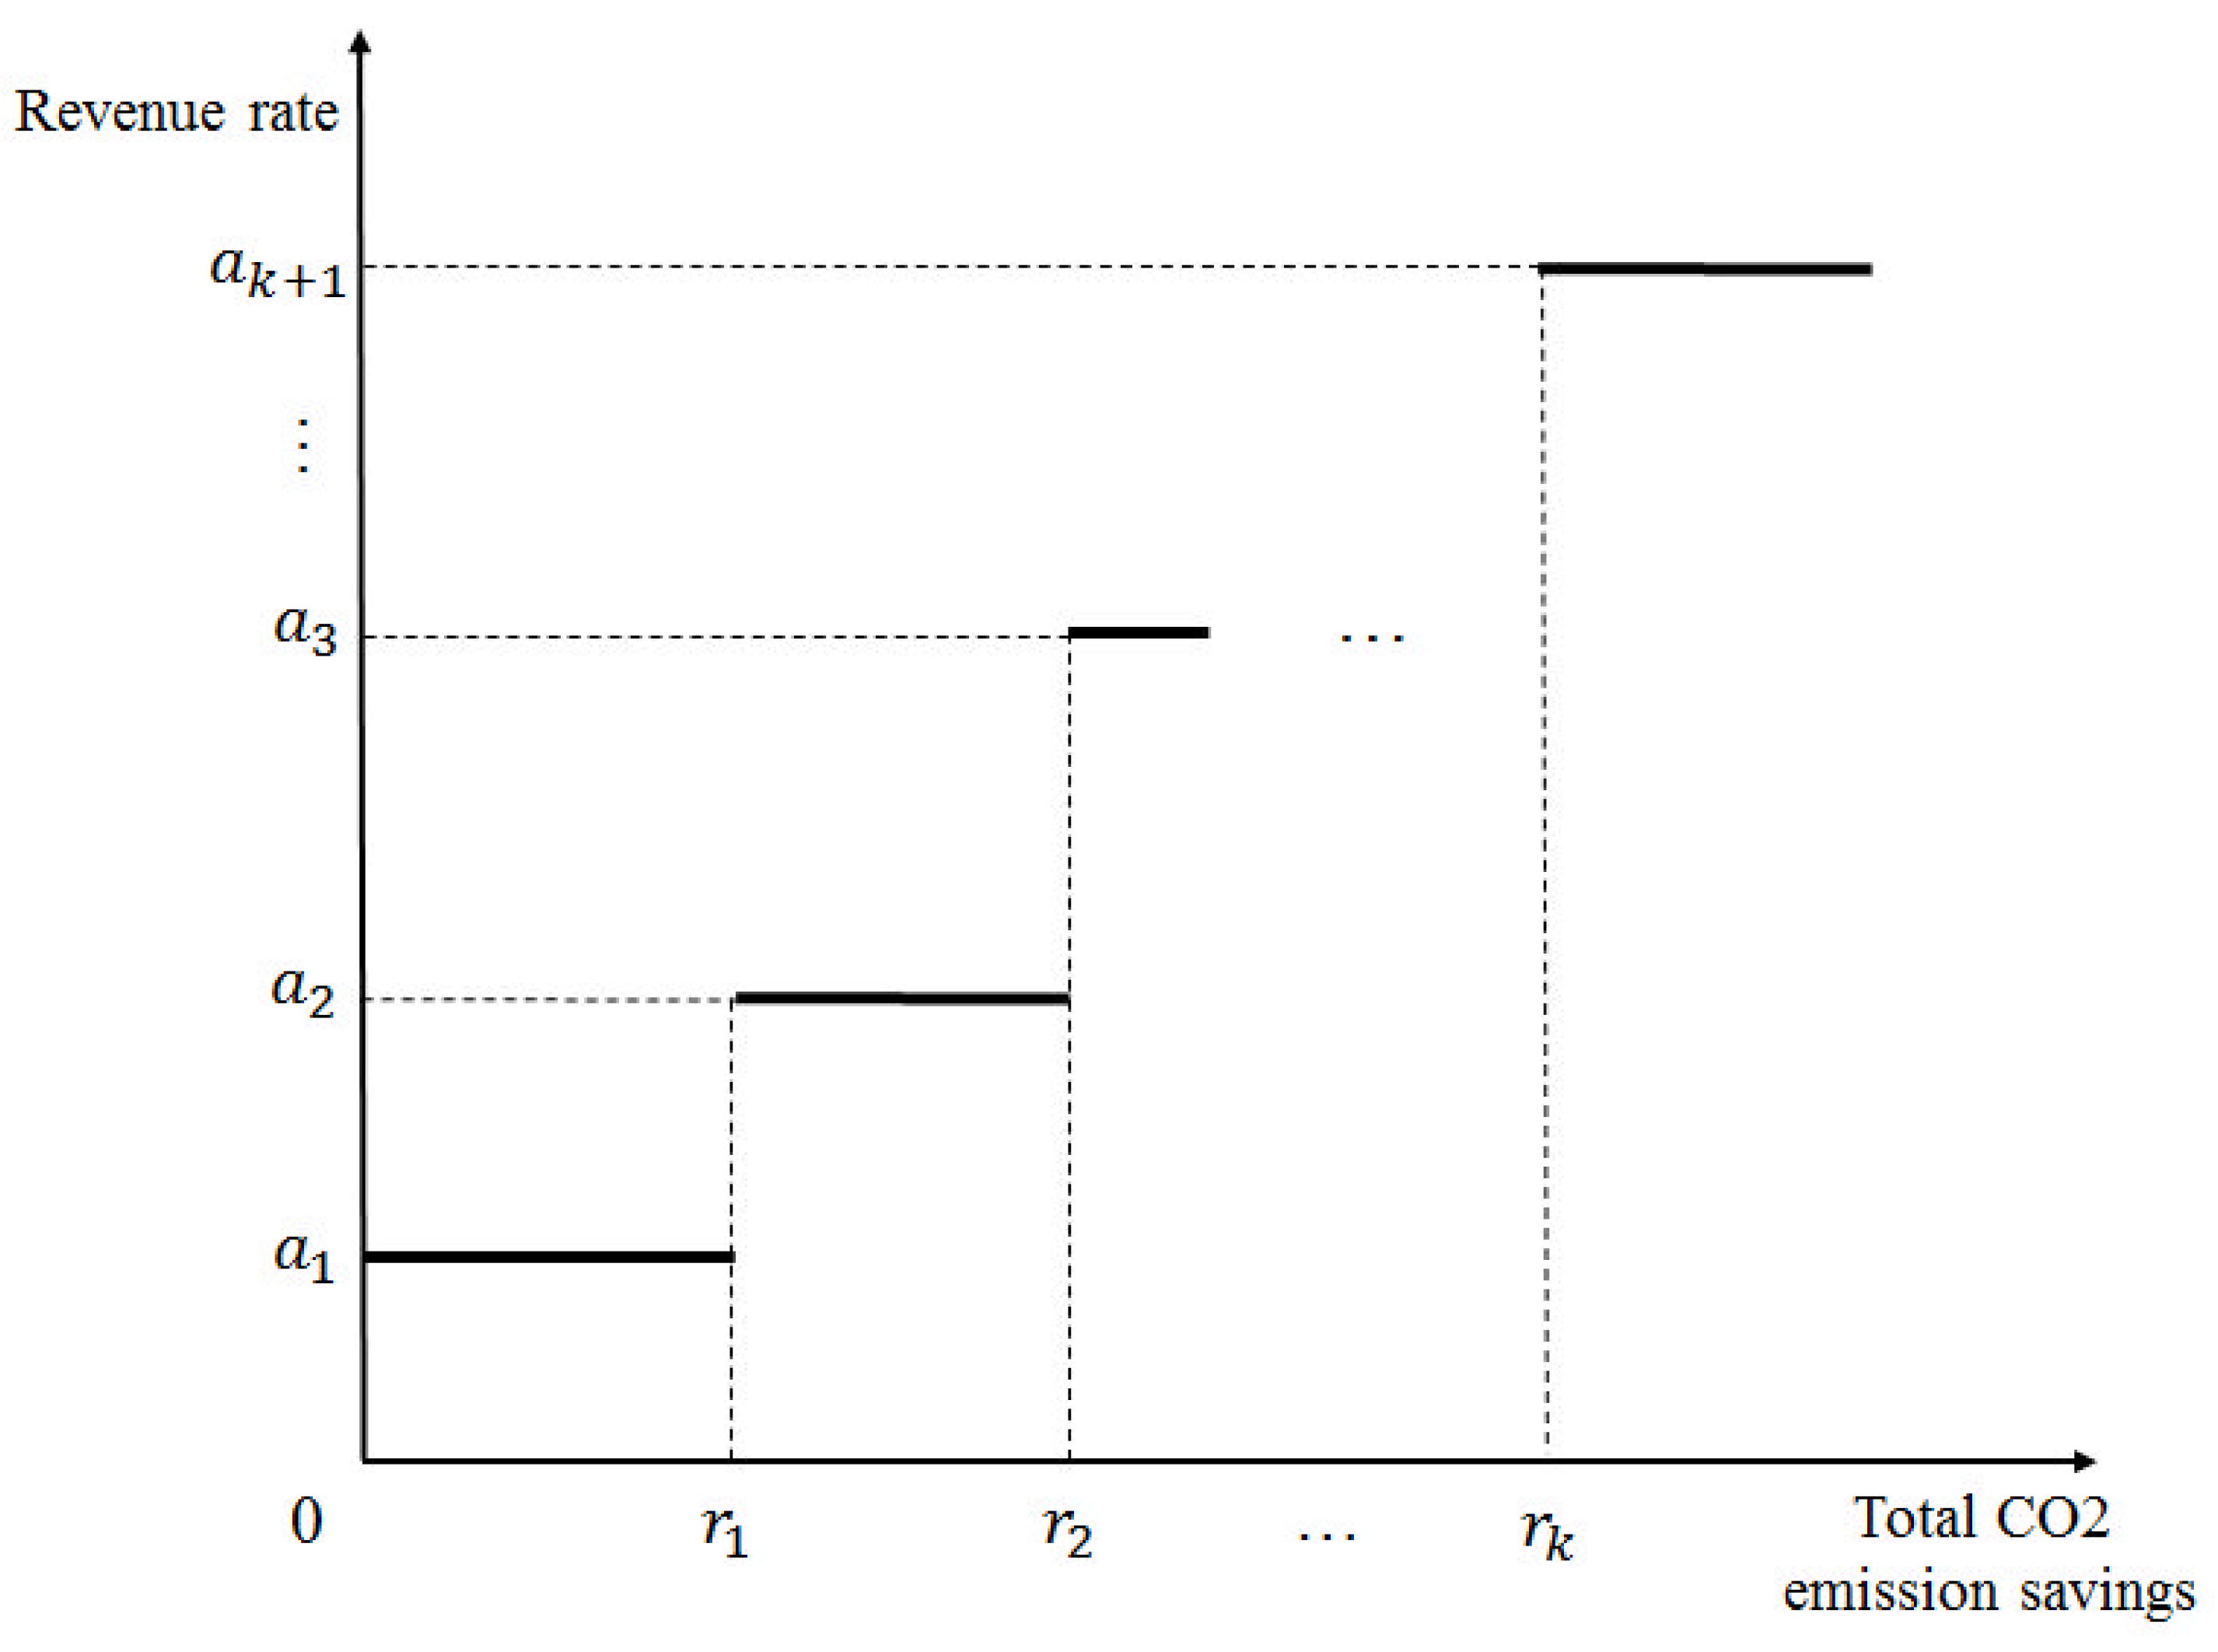
The government’s taxation policy is represented by a step-wise linear function
, where
is total CO
emission savings obtained by firm’s investment decisions, as shown in Equation (
1). This equation demonstrates that a firm can achieve lower taxation rates or higher revenue rates
(thousands GBP / kilogram CO
) where
, at higher total CO
emission savings
where
(see
Figure 1).
Let be investment decision variables, where means that investment option j in category i is not chosen. To support firms in choice of the optimal CO emission saving level, we introduce decision variables (K is the set of taxation levels), where means that CO emission saving level k is not selected to invest.
A summary of the indexes, sets, parameters and decision variables (including the notations in the next sections) is presented in
Table 2.
Next, a MINLP model for the firms’ decarbonisation investment problem is formulated as follows.
In the model, the objective function is to maximise total profit of chosen investment decisions, where profit is determined by subtraction of CO emission saving (converted into monetary) and investment cost. Since there are various revenue rates with respect to total CO emission saving levels in the step-wise linear function of taxation policy, the term of is used in the objective function to take the chosen revenue rate. As a result, it makes non-linear terms in the objective function. The constraints in Equation (3) ensure that only one investment option is allowed to select in the set of single-choice investment categories . The constraint in Equation (4) is the budget constraint of investment decisions where investment budget (thousands GBP) depends on firm’s environmental protection awareness. Since the environmental protection awareness is an uncertainty variable, is an uncertainty investment budget. The constraints in Equations (5) and (6) represent firm’s choice of the most economic CO emission saving level in the government’s taxation policy under the investment budget, where the constraint in Equation (5) ensures that a firm chooses only one saving level and the constraints in Equation (6) determine the most efficient-economic saving level. Finally, the constraints in Equations (7) and (8) are binary variables for firm’s investment option and CO emission saving level choices, respectively.
This is one of the strongly non-deterministic polynomial-time hardness problems in Operational Research. To be able to solve the problem, we need to deal with the uncertainty budget constraint in Equation (4) and linearise the non-linear terms
in the objective function. In the next sections, we present an adaptation of the uncertainty theory of Liu [
25] for the uncertainty budget constraint, and a linearisation technique for the non-linear objective function.
2.2. An Uncertainty Theory for the Budget Constraint
We apply the uncertainty theory of Liu [
25], which has been widely used to handle the constraint of uncertain capacities (for examples, [
26,
27]), for the uncertainty budget constraint as follows. Let
, the constraint in Equation (4) becomes
. In the uncertainty theory,
can be derived into
where
is a function with belief level
. The function might, for instance, be linear, zigzag, normal, or log-normal distribution over random uncertainty variable
.
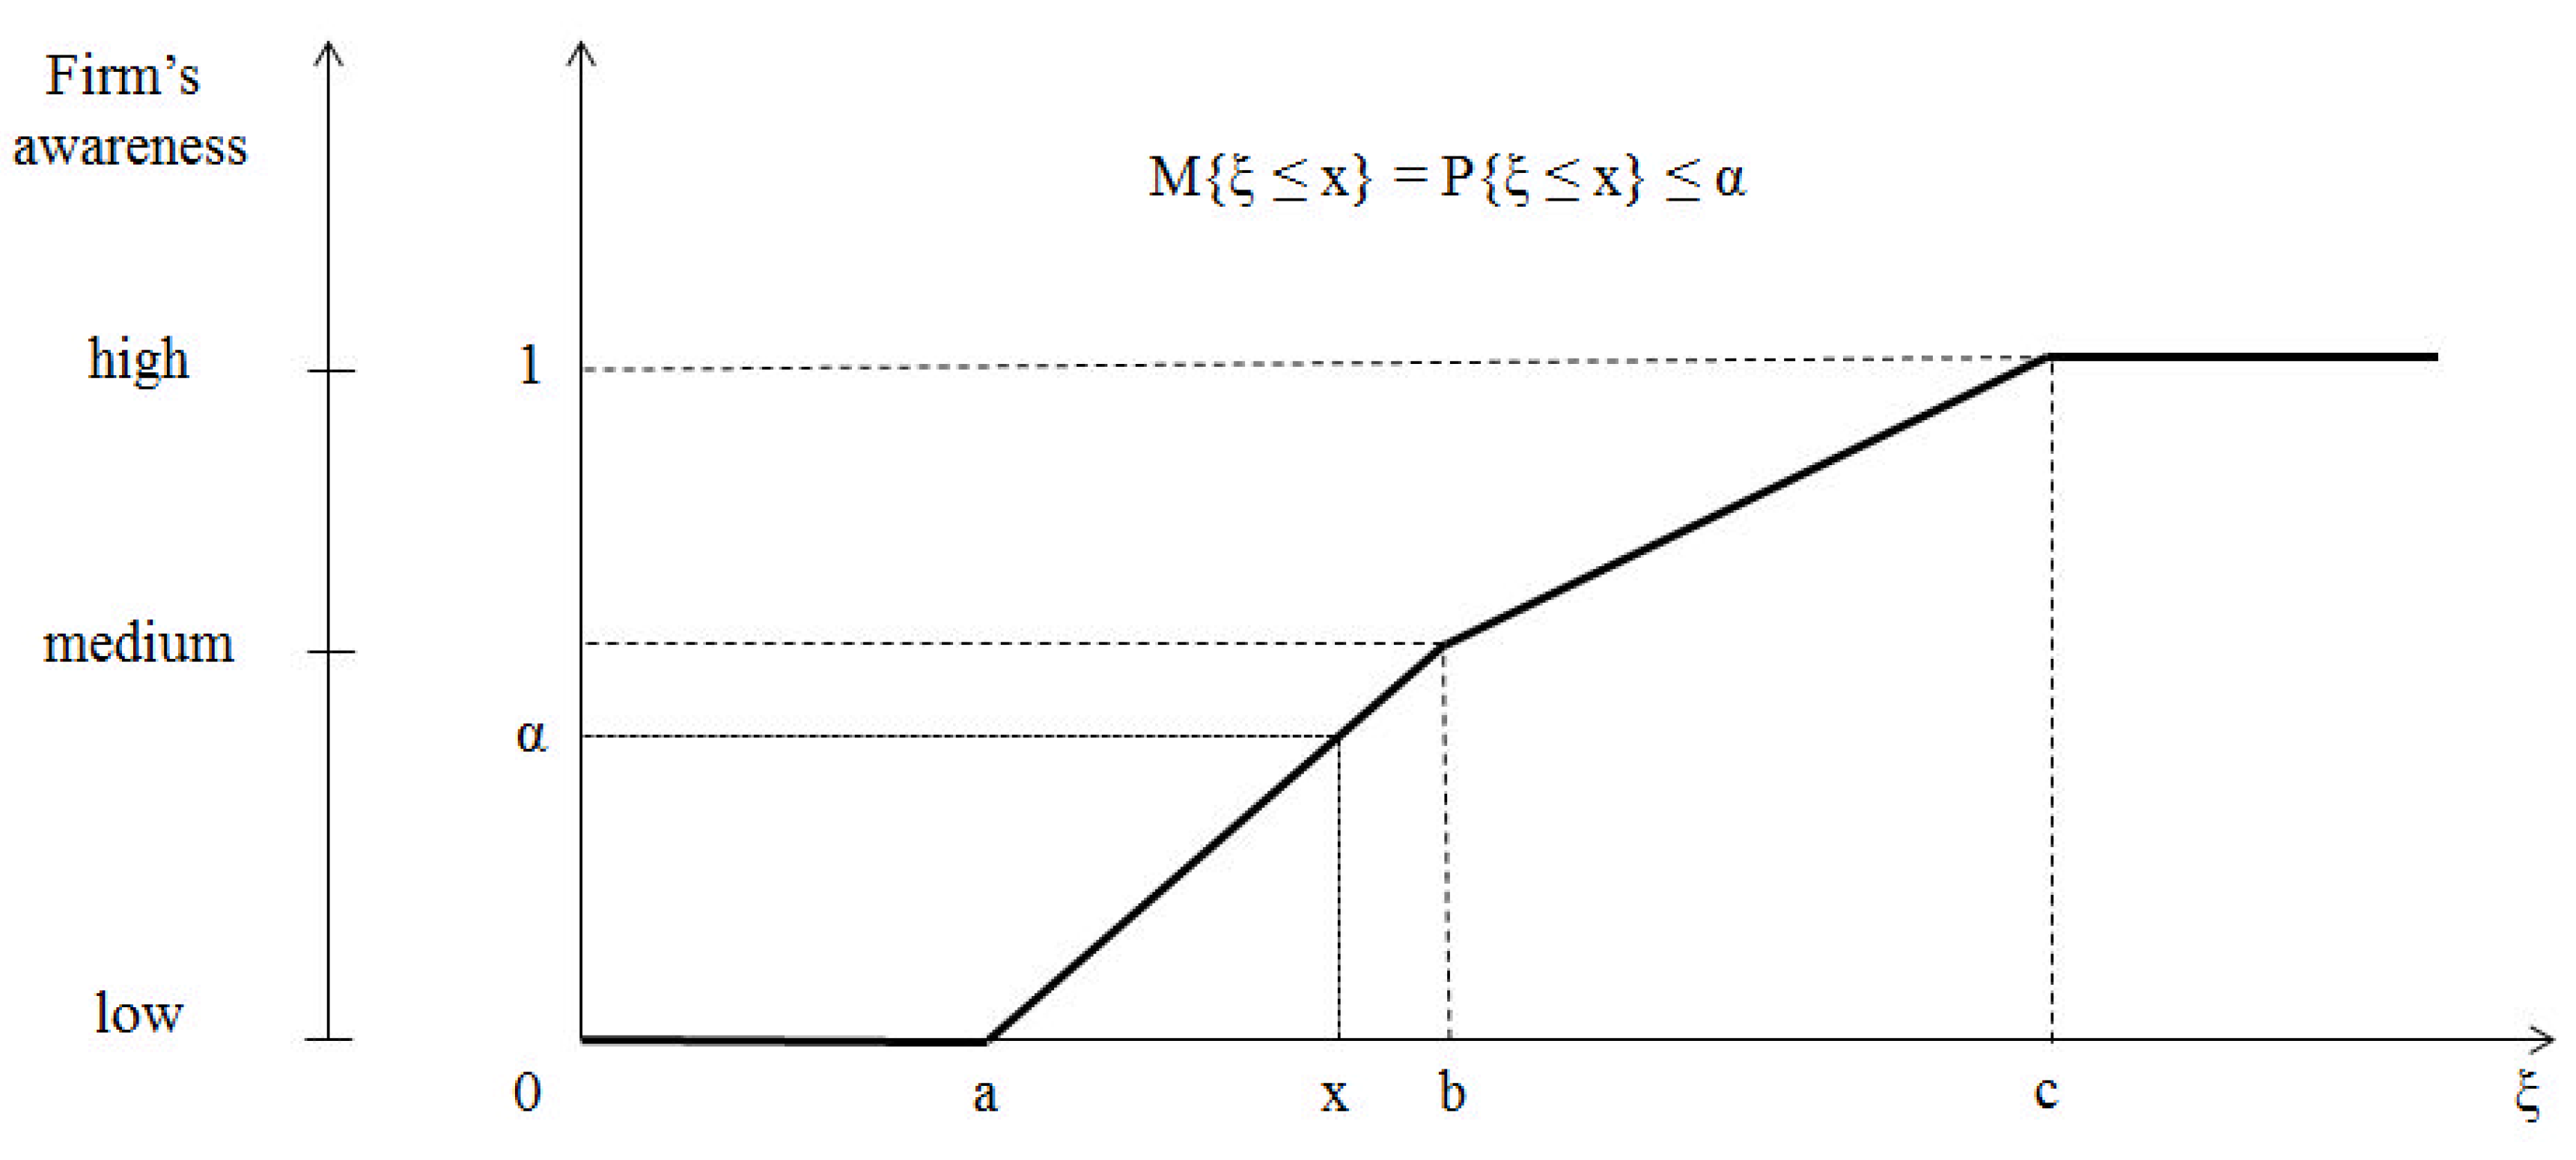
Figure 2 and Equation (
9) show the illustration and mathematical expression of zigzag belief degree function, respectively. For other belief degree functions, readers can refer to the work of Liu [
25].
Then, the constraint in Equation (4) can be written as
This is a linear constraint. Given that a belief degree , we can determine the corresponding investment budget by .
In our model, firm’s environmental protection awareness can be considered as a belief degree of environmental protection, where
represents the firm’s low environmental awareness (i.e., the firm believes that environmental protection is not important and uses the lower bound of investment budget) and
represents the firm’s high environmental awareness (i.e., the firm believes that environmental protection is very important and uses the upper bound of investment budget). Then, we can apply the constraint in Equation (
10) to determine firm’s investment budget with respect to its environmental protection awareness.
2.3. A Linearised Model
In this section, we linearise the non-linear terms in the objective function in order to obtain a linear model for efficiently solving the MINLP. Let
where
due to
and
. Since the new variable is a product of two binary variables, we can obtain the value of this variable by solving the following set of linear constraints:
Next, we explain how we can obtain the correct value of from the given values of and by solving the above-mentioned set of linear constraints. For example, we consider and , then we expect . By replacing and into the set of constraints, we have and . Since , . We obtained the correct value of (as expected).
For another example, we assume and , then we expect . By substituting and into the set of constraints, we have and . Then, we obtain (as expected). A similar explanation can be applied for the other cases (i.e., and or and ).
Finally, we replace the set of constraints in Equations (
11)–(13), along with the constraint in Equation (
10), into the MINLP. The linearised model can then be described by
This is a mixed-integer linear programming (MILP) model with binary variables and constraints, where , and are the number of taxation levels, the number of investment options in category i and the number of single-choice investment categories, respectively. We can use any MILP solvers for firms’ decarbonisation investment problem to find the maximum total profit.
4. Conclusions and Future Work
According to our best knowledge, this is the first time that a MINLP model is proposed to support firms’ decarbonisation investment decision-making under the impact of its awareness of environmental protection and the government’s taxation policy. The model investigates two decarbonisation investment types: single-choice investment (e.g., green energy technology installation) and multiple-choice investment (e.g., building energy efficiency improvement). The influence of firm’s environmental protection awareness on its investment budget is formulated by the uncertainty theory. The taxation policy of government is defined as a step-wise linear function where increasing total CO
emission savings can help a firm achieve a lower taxation rate or a higher revenue rate. This model aims to determine the set of investment options in order to maximise a firm’s profit under the above-mentioned constraints. Due to the non-linear property of this model, we develop a linearised model to solve it efficiently. The linearised model can produce the set of optimal investment options for the problem. The performance of the proposed model was demonstrated by numerical experiments, carried out on the case study for a sector of electronic component manufacturers in Nottingham, the United Kingdom, and the number of large-sized instances that are randomly generated. Analysis results on the experiments show that increasing firm’s environmental protection awareness and changing taxation rates have a certain impact on its investment decisions. If a firm is willing to spare more investment budget, it may obtain a higher profit. This model supports a firm in assessing an additional amount of investment budget for increasing significantly the achieved profit. It can quickly find the optimal solutions for large-sized instances. With this decision-making support model and governments’ appropriate taxation policy, the United Nation’s sustainable environmental development goal [
1] can be achieved by firms’ synchronised decarbonisation investments.
By restricting ourselves to a specific industrial sector, we are able to adopt realistic estimates of investment benefits, as well as appropriate budgets drawn from analysing company accounts. Therefore, we are able to demonstrate robust optimisation of investment decisions. In practice, our model should be seen as a proof-of-concept work, and an individual company should adopt it with their specific data for relevant scenarios. Our proposed model can apply to firms in other sectors with some minor modifications. It can also support policy planners in determination of appropriate taxation rates in order to achieve the target of CO emission reduction. In the future, we may extend this model with the existence of two same-sector firms in a comparative environment. Then, a firm should need to consider other firm’s investment strategy to make appropriate decisions under the impact of public awareness in environmental protection and the government’s policy intervention.
In this study, we assume that the taxation policy of government is formulated as a step-wise linear function. A firm’s profit value is determined by its taxation level and investment decisions. As a result, it leads to a non-linear relationship between a firm’s profits and investment budgets, but it can be linearised into a piece-wise linear relationship to be handled by any commercial solver. In practice, when the non-linear relationships between economic variables and their interactions become complex, we may require multi-scale modelling approaches such as mode decomposition techniques to deal with the problem.


