Article

Application of the Soil Security Concept to Two Contrasting Soil Landscape Systems—Implications for Soil Capability and Sustainable Land Management

1
NSW Office of Environment and Heritage, P.O. Box 445, Cowra, NSW 2794, Australia
2
Soil and Land Conservation Consulting Pty Ltd, P.O. Box 485, Jamison, ACT 2614, Australia
*
Author to whom correspondence should be addressed.
Sustainability 2019, 11(20), 5706; https://doi.org/10.3390/su11205706
Submission received: 17 May 2019 / Revised: 25 September 2019 / Accepted: 2 October 2019 / Published: 16 October 2019

Abstract

:
Soil security identifies global challenges and a series of dimensions that are necessary requirements to meet those global challenges using sustainable land management. The soil security concept is applied to two contrasting soil landscape systems with varying climate, landform and soil types. Previous methodologies for assessing land and soil capability are combined within the soil security conceptual approach. The land and soil capability methodologies are used to assess how the soil condition changes in response to the stresses and forcing associated with land management and land and soil degradation processes. It is the soil capability that defines how the soil condition changes between the reference state of the soil condition, or the genoform, and the soil condition under land use, or the phenoform. The conclusion is that soil capability, which is one of the dimensions used to apply the soil security concept, is a complex dimension and has several aspects or further facets to be considered to achieve sustainable land management. It is apparent that in assessing soil capability, the following facets are relevant. I: The capacity of the soil to provide ecosystem services to meet the global challenges outlined for Soil Security. II: The stability of the soil condition to land degradation processes resulting from the effects of land management practices and the environmental stresses on the soil. III: The capacity to recover following degradation. Facets II and III can be considered the resilience. An important conclusion is that the soil capability cannot be assessed without taking into account features of the landscape including climate and landform. Two examples from south eastern Australia of the application of these facets of soil capability to on-ground situations are presented. The Cowra Trough Red Soils in the Australian wheat belt are a set of soils, primarily contributing to meeting the global challenge of food security. The major degradation processes threatening the stability of these soils are water erosion and soil acidification. The Kosciusko National Park in the Snowy Mountains region is primarily contributing to meeting the challenges of water security for the irrigation industry in the Murray Darling Basins and energy security through the production of hydroelectricity. The set of soil landscapes also contributes to biodiversity protection and human health and well-being. The major degradation processes threatening the stability of these soils and their capacity to meet the global challenges are water and wind erosion. A major limitation is the poor capacity of these soils to recover once degraded. Identifying the main ecosystem services provided by the two examples, together with the major risks of land degradation can clarify extension, economic and policy aspects of sustainable land management for the two sets of soil landscapes. For the Cowra Trough Red Soils, management of water erosion and soil acidification are essential for maintaining the contribution of the area to food security. For the Kosciusko National Park, the control of water and wind erosion are essential to maintain the contribution of the area to water and energy security.

Graphical Abstract

1. Introduction

Soil security [1,2] has been proposed as a useful concept to identify, develop, implement and monitor sustainable land management practices (SLM) to achieve the Sustainable Development Goals (SDG) put forward by the United nations [3,4]. Soil security is concerned with the maintenance and improvement of the world’s soil resource to produce food, fibre and freshwater, contribute to energy and climate sustainability, and maintain the biodiversity and the overall protection of the ecosystem [1].
The soil security approach supersedes the single focus land capability and land suitability approach to land evaluation that concentrates on the biophysical component of land management [5,6,7,8,9,10,11]. Soil security also accounts for the social economic and natural capital components of land management. It also identifies the specific objectives of sustainable land management (SLM) including food security, water security, energy security, biodiversity preservation, climate change mitigation and abatement, and human health and welfare [12] (see Table 1). Soil security can assist in the management of ecosystems and soil landscapes for the overall betterment of society and to meet the SDG’s [13,14].
The framework for soil security to meet the challenges is based on the dimensions of soil capability, soil condition, soil natural capital, connectivity and codification (Table 2). It is the values and effectiveness of the application of these dimensions that determines the ability of ecosystems or soil landscapes to meet the global challenges outlined in Table 1.
The soil security concept is related to the “soil capital” concept [15]. It represents a change from the traditional approach of many soil evaluation systems that emphasised the limitations and negative aspects of soil and land degradation [5,6,8]. However, there still remains the need for clarification about the meaning and definitions of the dimensions used in the concept, particularly the dimensions of soil capability and soil condition. How land degradation processes, threats or “forcings” [16] associated with different land management practices are assessed is not specified. As it is currently proposed, the assessment of the impacts of land management on soil condition and land degradation processes or threats within the concept remains uncertain. In fact, the statement is made within one publication on soil security, “Generally, the forcings are considered under various land degradation processes, such as, water or wind erosion, salinization, contamination, etc. However, strictly theoretically, we do not need to specify these forces of degradation” [16] (p. 5). Yet, unsustainable land management practices are the main drivers of land degradation. Included are impacts such as desertification, deforestation, lower agricultural productivity, loss of soil, changes in natural habitats and ecosystems, reduced ecosystem services and loss of biodiversity [17,18,19,20].
In this paper, the case is made that the inclusion of land capability assessment within the workings of the soil security concept can assist in the practical application and outcomes from the soil security concept. In particular, the addition of land capability assessment can clarify the difference between the dimensions of soil capability and soil condition and provide a means of evaluating land soil degradation risks within the soil security concept. At present, the difference between them remains somewhat confusing and unclear [1,21,22,23,24]. The land capability assessment provides the gears or cogs for the effective application of the soil security concept to on-ground situations. This approach is demonstrated by applying the soil security concept to two tracts of land covered by two contrasting soil landscape systems.
Finally, this paper has the objective to demonstrate that the soil security concept can enhance the understanding of how the ecosystem services can support meeting the global challenges. It applies the soil security concept to two contrasting sets of soil landscape systems. At the same time, it can help identify the land and soil degradation risks associated with the soil landscape systems.

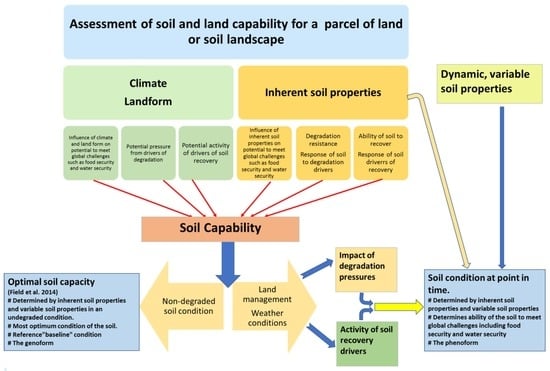
2. Soil Capability and Soil Condition

2.1. Basic Definitions

In the soil security concept, soil capability currently refers to “…the ability of the soil to function, and in particular answers the question ‘what can the soil do?’” [2] (p. 17). McBratney et al. [1] further suggest that soil capability can be thought of “… as a reference state that defines an optimal capacity of the soil to which the current condition of the soil can be compared”. This is the genoform [1]. The difference between the baseline condition of the soil in the reference state and the current soil condition, the phenoform [1] can be used as a quantified measure of the soil capability [1,2,16]. There is a recognition that soil capability has a link to soil management, and that soil should be managed within its capability [1,16,24]. McBratney et al. [1] also recognise that the response of the soil condition to land management is included within the soil capability dimension, “…the management of soil over longer periods of time may result in changes to the soil which needs to be accounted for” [1] (p. 206). In fact, soil capability can define how the soil condition responds to stresses, pressures, influences or forcings imposed on the soil by the environment and land management. One interpretation is that the soil capability defines or predicts what are the mechanisms or “forcings” that change the soil condition from the reference state to the current condition. It predicts the changes in soil condition between the genoform and phenoform. An important implication is that while soil condition indicates the actual state of the soil at the time of measurement, soil capability, while making assessment of the potential capacity of the soil to perform various functions [14,16], it also makes predictions about how soil condition changes with time. Hence, its assessment ideally should include information about land management and how this can change soil properties and about environmental variables such as climate and landform. This was the approach common in land capability schemes such as Klingebiel and Montgomery [26], Emery [27] and Helms [28], or the land and soil capability schemes of the Office of Environment and Heritage (OEH) [5] and Levin et al. [6].
As it is intended to be used, the scale at which soil capability can be applied is specific soil type or to an area defined by a soil mapping unit. Frequently, and possibly mostly in its application, the soil capability of a soil mapping unit, or group of soil mapping units will be the object of assessment. A soil mapping unit represents a parcel or tract of land and this will be characterised by series of land features as well as soil properties (Table in Reference [27]). Both the soil properties and land features can be used to assess the soil and land capability [5,6,8,9,10,11]. Dominati et al. [15] and McBratney et al. [1] acknowledge that soils are part of the landscape and that land features or land qualities have a bearing on land evaluation and soil capability. In the latest use of the term capability for land evaluation, it has been defined as “land and soil” capability [5], in which both land features and specific soil properties are used in the evaluation. In this paper, soil capability is applied to tracts of land that are defined by sets of similar soil mapping units or soil landscapes.
At the field scale, it is possible that assessment of the soil capability can be dominated by soil properties alone because the climate and landform features are approximately constant. However, once the extent of the land to be assessed expands beyond a field, the landform is no longer constant, and at the catchment/regional scales, the climate is no longer constant. A reasonable approach is that at the broader scales, it is not possible to separate the assessment of land and soil capability.
Soil condition refers to the current state of the soil and allows an assessment as to whether the soil is being managed according to its capability and how different the soil may be from a reference state. It allows an assessment of how management may have influenced any changes in the state of the soil [1,2,16,24]. Soil condition is linked to the concepts of soil quality and soil health and may be assessed using similar indicators or soil properties [1,22]. It is assessed by the capacity or performance of the soil in its contemporary state, to support the biophysical functions needed to meet the global challenges. These functions include [15]:
  • Fertility role: soil nutrient cycles ensure fertility renewal and the delivery of nutrients to plants, therefore contributing to plant growth.
  • Filter and reservoir role: soils fix and store solutes passing through and therefore purify water. They also store water for plants to use and take part in flood mitigation.
  • Structural role: soils provide physical support to plants, animals and human infrastructures.
  • Climate regulation role: soils take part in climate regulation through carbon sequestration and greenhouse gases (N2O and CH4) emissions regulation.
  • Biodiversity conservation role: soils are a reservoir of biodiversity. They provide habitat for thousands of species regulating, for instance, pest control or the disposal of wastes.
  • Resource role: soils can be a source of materials like peat and clay.
The condition of the soil can be assessed using a set of physical, chemical and biological soil properties, and a selected set can be used to assess the condition of the soil for capacity of the soil to perform specific functions [1,14,29,30,31]. The assessment of soil condition involves the assessment of both stable or inherent soil properties and variable or dynamic soil properties. Soil condition is sometimes referred to as the soil phenotype [1,32]. In practical terms, it is the condition of the soil after land management has been imposed on the soil.
The soil properties to assess soil capability are intended to be those that are based largely on pedological development and can be considered inherent or relatively invariable with the time scales associated with soil management. Included are soil depth, texture, soil mineralogy, cation exchange capacity, rock outcrop, stoniness, pH buffering capacity, presence of free iron, and other properties that are commonly used in broad soil classification [7,14,29,30,31,33]. The soil properties used to assess soil condition are those that are more variable within the time scale of soil management and include nutrient levels, soil organic matter, pH buffering capacity, and bulk density. A number of soil properties may be inherent or variable depending on the soil type and soil landscape. For example, salinity and sodicity are often inherent soil properties but can often be readily changed by specific management practices. Likewise, the pH profile of the soil can be an inherent soil property that can have a large impact on the capability of the soil, but the pH of the soil, especially the surface soil pH of some soils with weak buffering capacity, can be readily changed by land management practices. Even the so called “inherent” properties such as soil depth and texture can be altered by land degradation processes such as erosion [7,14,33,34].

2.2. Links between Soil Capability, Land Management and Environmental Pressures

Soil condition relates to the biophysical ability of a soil to carry out a function or the performance of the soil [1,2,16,21,24]. However, in the original definitions used in McBratney et al. [1], the performance, functionality or productivity are given by the expression:
Performance = capability x condition
The inclusion of both capability and condition in the expression is in effect confusing, it further causes uncertainty about the links between soil condition, soil capability and land management. An alternative set of expressions is proposed to overcome this uncertainty and can account for land management and the threats of soil or land degradation. The alternative expressions link performance, soil capability, soil condition and land management, based on some original discussion from Murphy [21]:
Performance = soil condition x environment x land management
In turn:
Soil capability = inherent soil properties x climate x landform features
and
Soil condition = soil capability x land management x environment
and
Natural capital value of soils = Performance of soils in providing ecosystems services
Expression 3 accounts for the impact of land management on soil condition and the threats of soil or land degradation. The environmental processes determine the rate or pressure of land degradation processes on the soil condition taking into account the effects such as high-intensity rainfall events, drought or flooding. Expression 4 accounts for land management that can determine the resistance of the land or soil to degradation processes by affecting factors such as vegetative cover, whether soil is in a loosely tilled condition, the soil organic carbon content, soil nutrient stores and degree of nitrate leaching.
This sequence of expressions clearly identifies the role of land management and the land features and environment in determining soil capability and ultimately the soil condition and the ability of a soil to perform a given function or meet a particular global challenge.
The sequence of expressions does raise a number of issues needing clarification. Using soil within its capability ensures that SLM practices are being implemented [35]. If land management practices that exceed the capability are implemented, land or soil degradation occurs, and the soil condition will be deteriorated.
1. A number of land degradation threats to soil security and the delivery of ecosystem services have been identified by McBratney et al. [16], including erosion, soil organic matter decline, contamination, salinization, sealing and compaction. However, there is minimal information on how to assess these risks. Other risks include soil acidification, nutrient decline, surface crusting, wetness, aridity and decline in vegetation cover [5,6,7,8,20,35]. It is the stability of the soil condition to these threats that influences the soil capability. This paper suggests that from a practical approach to developing and implementing SLM practices, it is necessary to assess the degradation risks facing soils and the management practices to counter the risks. Expression 3 can be used to determine the risk of these threats occurring. For example, the risk of water erosion is determined by the rainfall erosivity, the landform features including length and degree of slope, the soil erodibility and the amount of ground cover on the soil which is dependent on land management. The risk of soil acidification can be determined by the natural pH of the soil, the buffering capacity to acidification and the acidification pressure on the soil based on climate and land management [5]. In assessing the land degradation threats, use can be made of land capability assessments such as that developed for New South Wales (NSW) in OEH [5] and Gray et al. [35].
2. The rehabilitation of a degraded soil or the soil that is in a condition less favourable than the reference condition can occur. This is the resilience. Field and Sanderson [25] suggest it is the soil resilience that determines if the soil can be rehabilitated and returned to the soil reference condition by a change in land management. Whether a soil can return to the reference condition depends on the degree of degradation. When the degradation passes beyond a certain threshold, it may not be possible to rehabilitate the soil. There is considerable variation in the understanding of the terms resilience, stability and vulnerability. Urruty et al. [36] provide a review of the use of these terms in the published literature on agricultural systems and define stability as:
“Constancy of agricultural outputs over long periods of time or across various spatial environments”.
[36] (p. 5)
Urruty et al. [36] define resilience as:
“Ability to absorb change and to anticipate future perturbations through adaptive capacity”.
[36] (p. 5)
3. The nexus between land capability and soil capability is in reality blurred by the need to include land features and climate characteristics in firstly assessing the performance of the soil in a given condition, and secondly in the assessment of the degradation risks or threats to determine the soil capability and what the effects of land management might be on the soil condition. It is relevant to realise that the UN utilises the concept of land degradation neutrality [20] when developing SLM practices, not soil degradation neutrality. Commonly used schemes of land assessment also utilise land features and climate characteristics together with the soil properties to identify soil capability and SLM practices [5,6,8,9,10,11]. In practice, there is perhaps little to be gained by separating land capability and soil capability, and the potential to cause a substantial amount of confusion in policy development and extension of messages for the implementation of SLM practices.

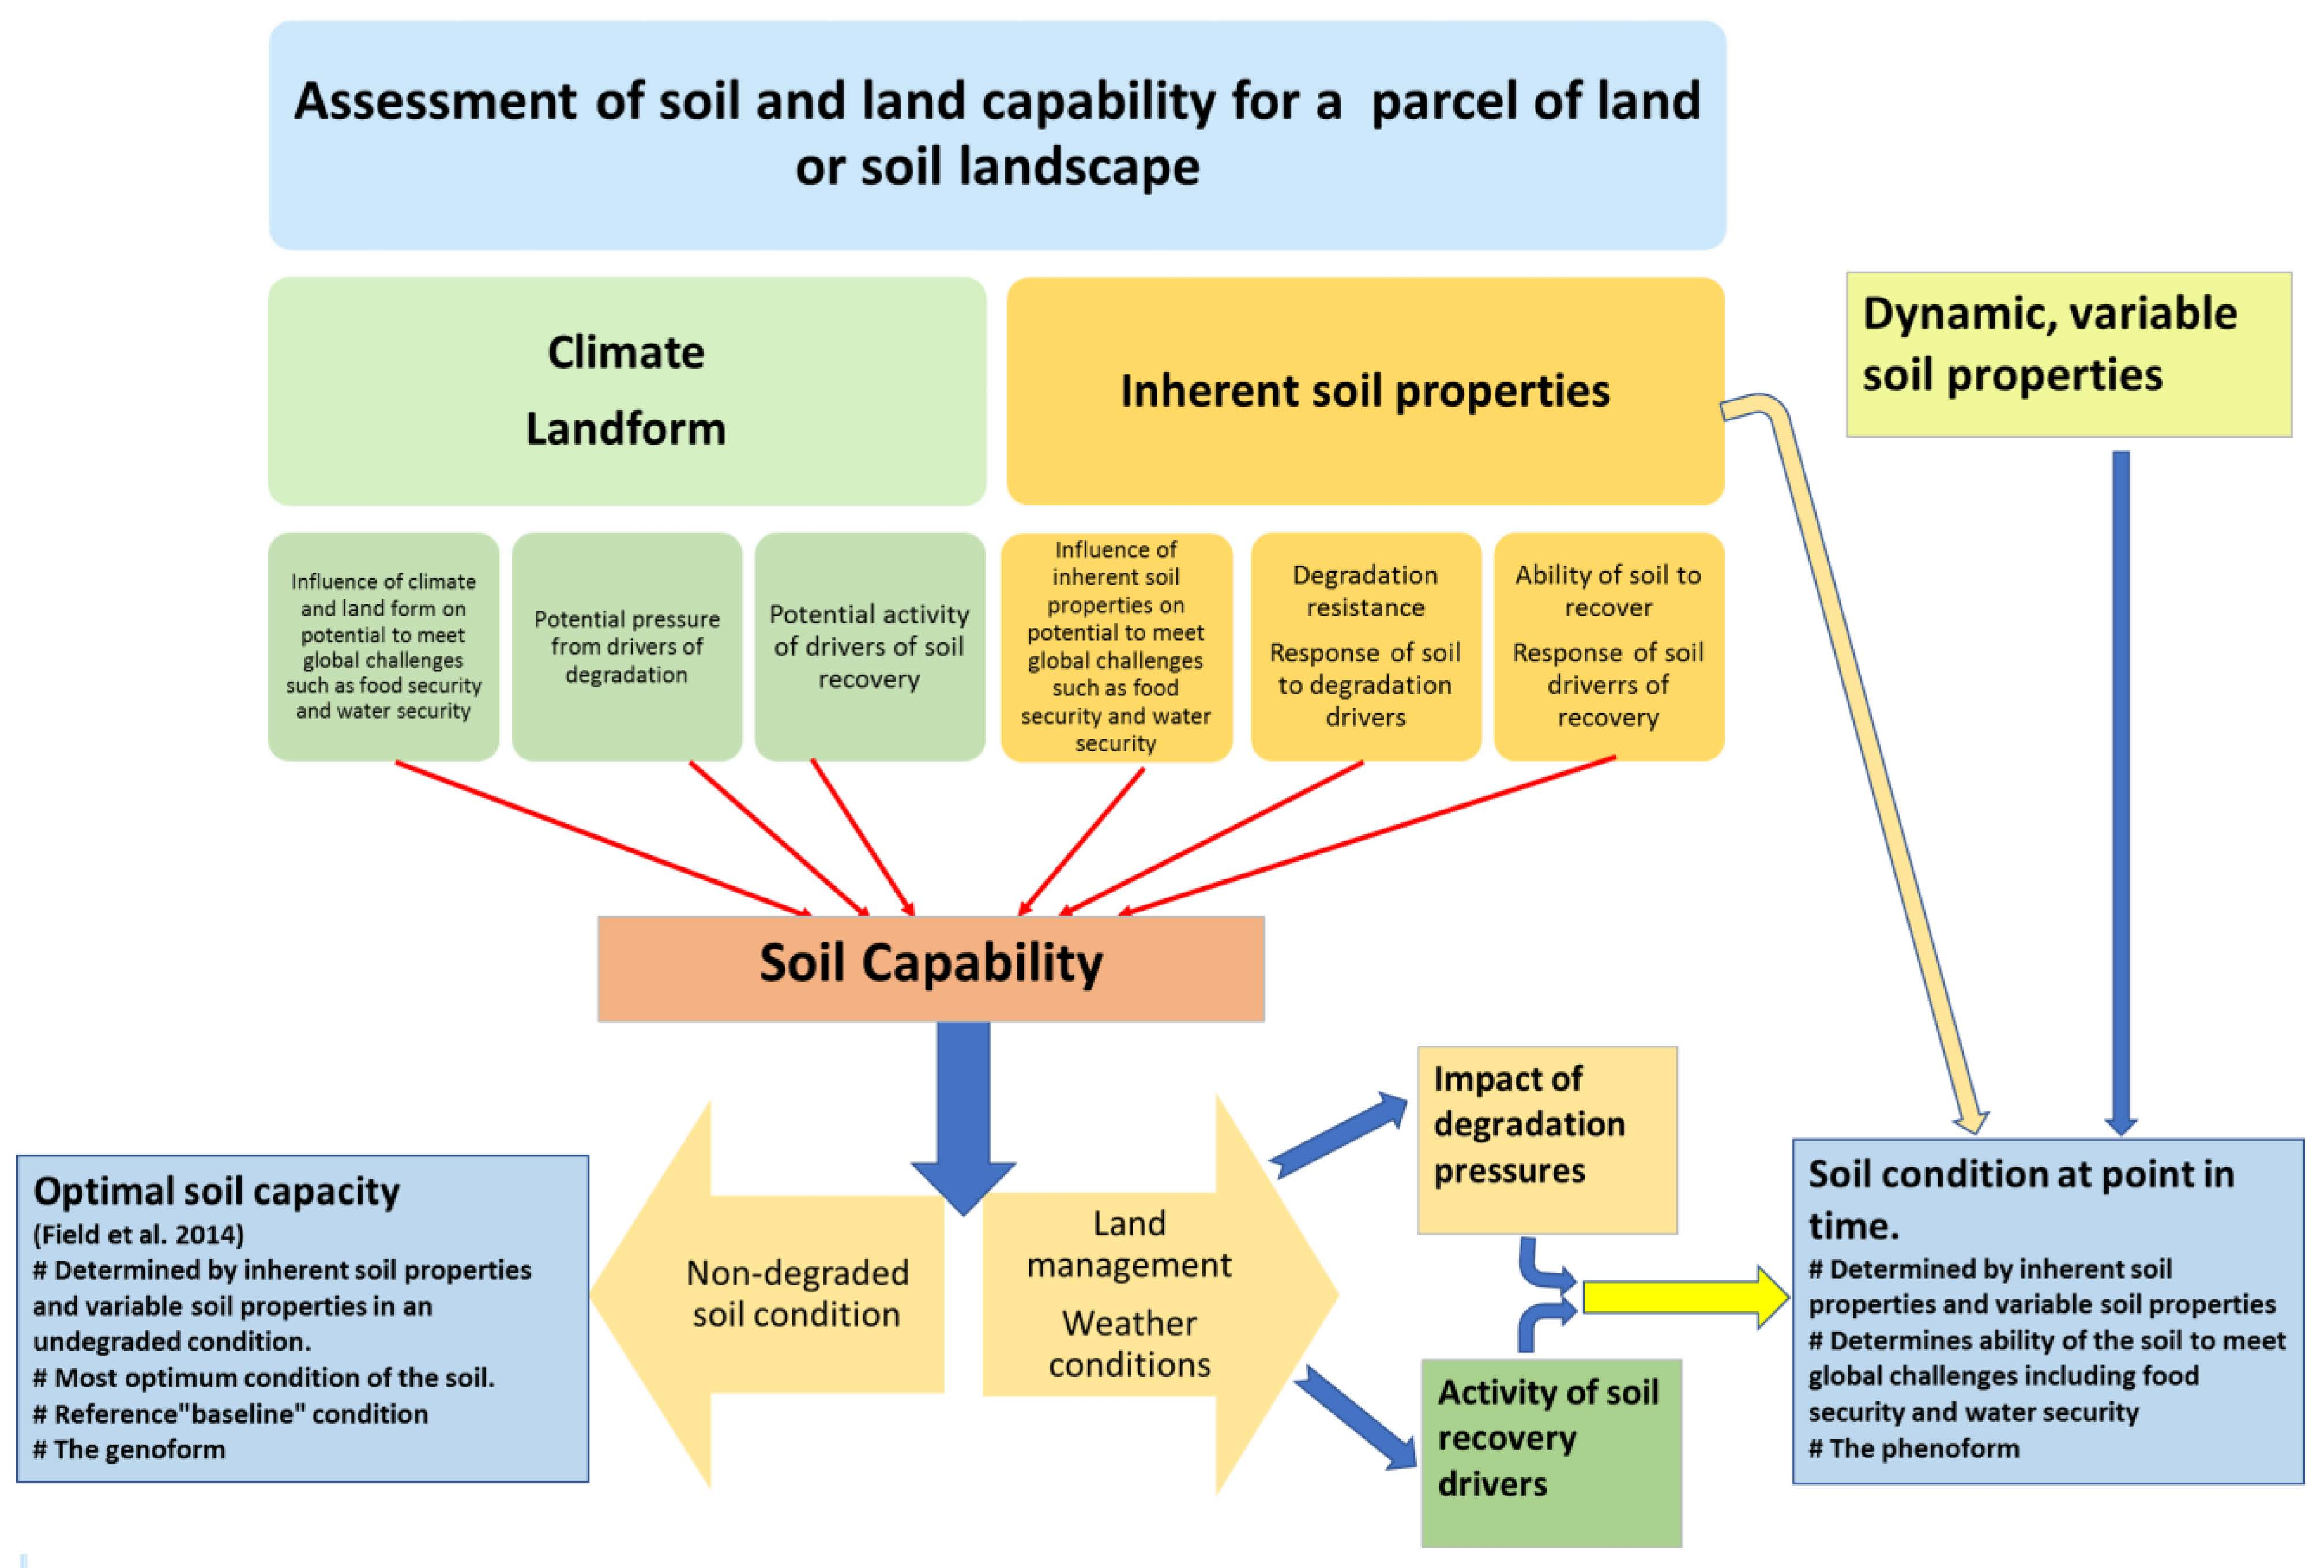
2.3. Facets in Assessing Soil Capability

Based on the description of the elements of land potential given by Herrick et al. [37,38], the facets of soil capability can be described as below (see Figure 1):
Soil Capability Facet I. The capacity of the soil to provide ecosystem services to meet the global challenges outlined for Soil Security. The provisioning of food, water and fibre is a critical one of these—these services need to be evaluated and monitored for each specified land use [5,6,9,15,35]. The major land uses within the two soil landscape systems were identified and this provided an assessment of the ecosystem services provided by the soils. Using available information on crop yields, extent of pastures and value of production, it was possible to estimate the relative support given to each of the global challenges listed in Table 1.
Soil Capability Facet II. The stability of the soil condition to land degradation processes resulting from the effects of land management practices and the environmental stresses on the soil. It is the susceptibility to soil and land degradation [5,6,20,35]. There are two components: IIa: Potential rate or pressure of the land degradation process based on the land features such as climate and landform and the properties that control the rate or degree of the land degradation process. This rate or pressure can be attenuated by implementation of SLM practices. IIb: The robustness is the ability to maintain desired soil condition or soil function despite the occurrence of a degree of soil or land degradation (see Reference [36]). The robustness is influenced by the proximity or scope for change between the current soil condition and threshold values beyond which the soil cannot recover or recovery is difficult and requires a large input of capital and investment.
Using the methodology developed by the Office of Environment and Heritage (OEH) [5], the potential pressure or forcing of land degradation pressures and the robustness of the soil landscape systems were estimated using published information on the climate, landform, soil and potential land management practices associated with each soil landscape system.
Soil Capability Facet III. The capacity to recover following degradation [37]. The assessment of this facet of soil capability is influenced by the capacity of the soil to recover from degradation using largely natural soil processes. It may be possible to divide facet III into IIIa: the activity of the drivers of the soil restoration processes (plant growth, wetting and drying cycles, lime addition, soil fauna activity, salt removal, etc.) and IIIb: response of the soil to that activity (shrink-swell activity of the soil, cation exchange capacity, buffering capacity, salt store and drainage conditions, etc.).
The capacity of the soil to recover was based on published information on climate, landform, soils and land management practices. The specific information used depended on the land degradation processes, soil type and the soil landscape system.
Facets II and III of soil capability are kept separate because the processes and soil properties and processes involved for each are often quite different. This is consistent with Herrick et al [37] who state:
“While some definitions of resilience integrate both degradation resistance and capacity to recover, we distinguish them because different soil, vegetation, and landscape properties and processes affect resistance and resilience to different disturbance types in different ways” [37] (p. 6A).
It is also consistent with the approach used by Kay [39] to describe the dynamics of soil structure.
In keeping with existing terminologies, the combination of facets II and III can be defined as the resilience of the system of the soil unit.
The validity of the approach proposed here is tested by applying it to two contrasting soil landscape systems from south eastern Australia. For each soil landscape system, the main global challenge that management of the soils addresses is presented. This is followed by an assessment of the capability of the soils based on the stability and resilience of the soil landscape systems.

3. Examples of Applying the Facets of Soil Capability

3.1. Steps in Applying the Soil Security Concept to Two Contrasting Soil Landscapes

The two soil landscape systems to which the soil security concept is applied are:
(i)
The Cowra Trough Red Soils, that includes a tract of land dominated by Red Chromosol soils [40,41] or Red Luvisols [33].
(ii)
The Kosciusko National Park, that includes a tract of land with large areas dominated by more alpine soils including Chernic Tenosols (alpine humus soils) and Organosols [42,43,44] or Umbrisols and Histosols [33].
Steps in the application of the soil security concept:
(i)
The physical features including climate, landform and soil type were briefly described for each of these sets of soil mapping units.
(ii)
The contribution of the soils in the tract of land to the global challenges outlined in Table 1 was established.
(iii)
The stability of the soil condition to land degradation processes was established.
(iv)
The capacity of the soil condition to recover once it has been degraded was assessed.
By applying these steps, it was possible to identify which major global challenges were supported by the two contrasting soil landscape systems and the land and soil degradation risks associated with each.

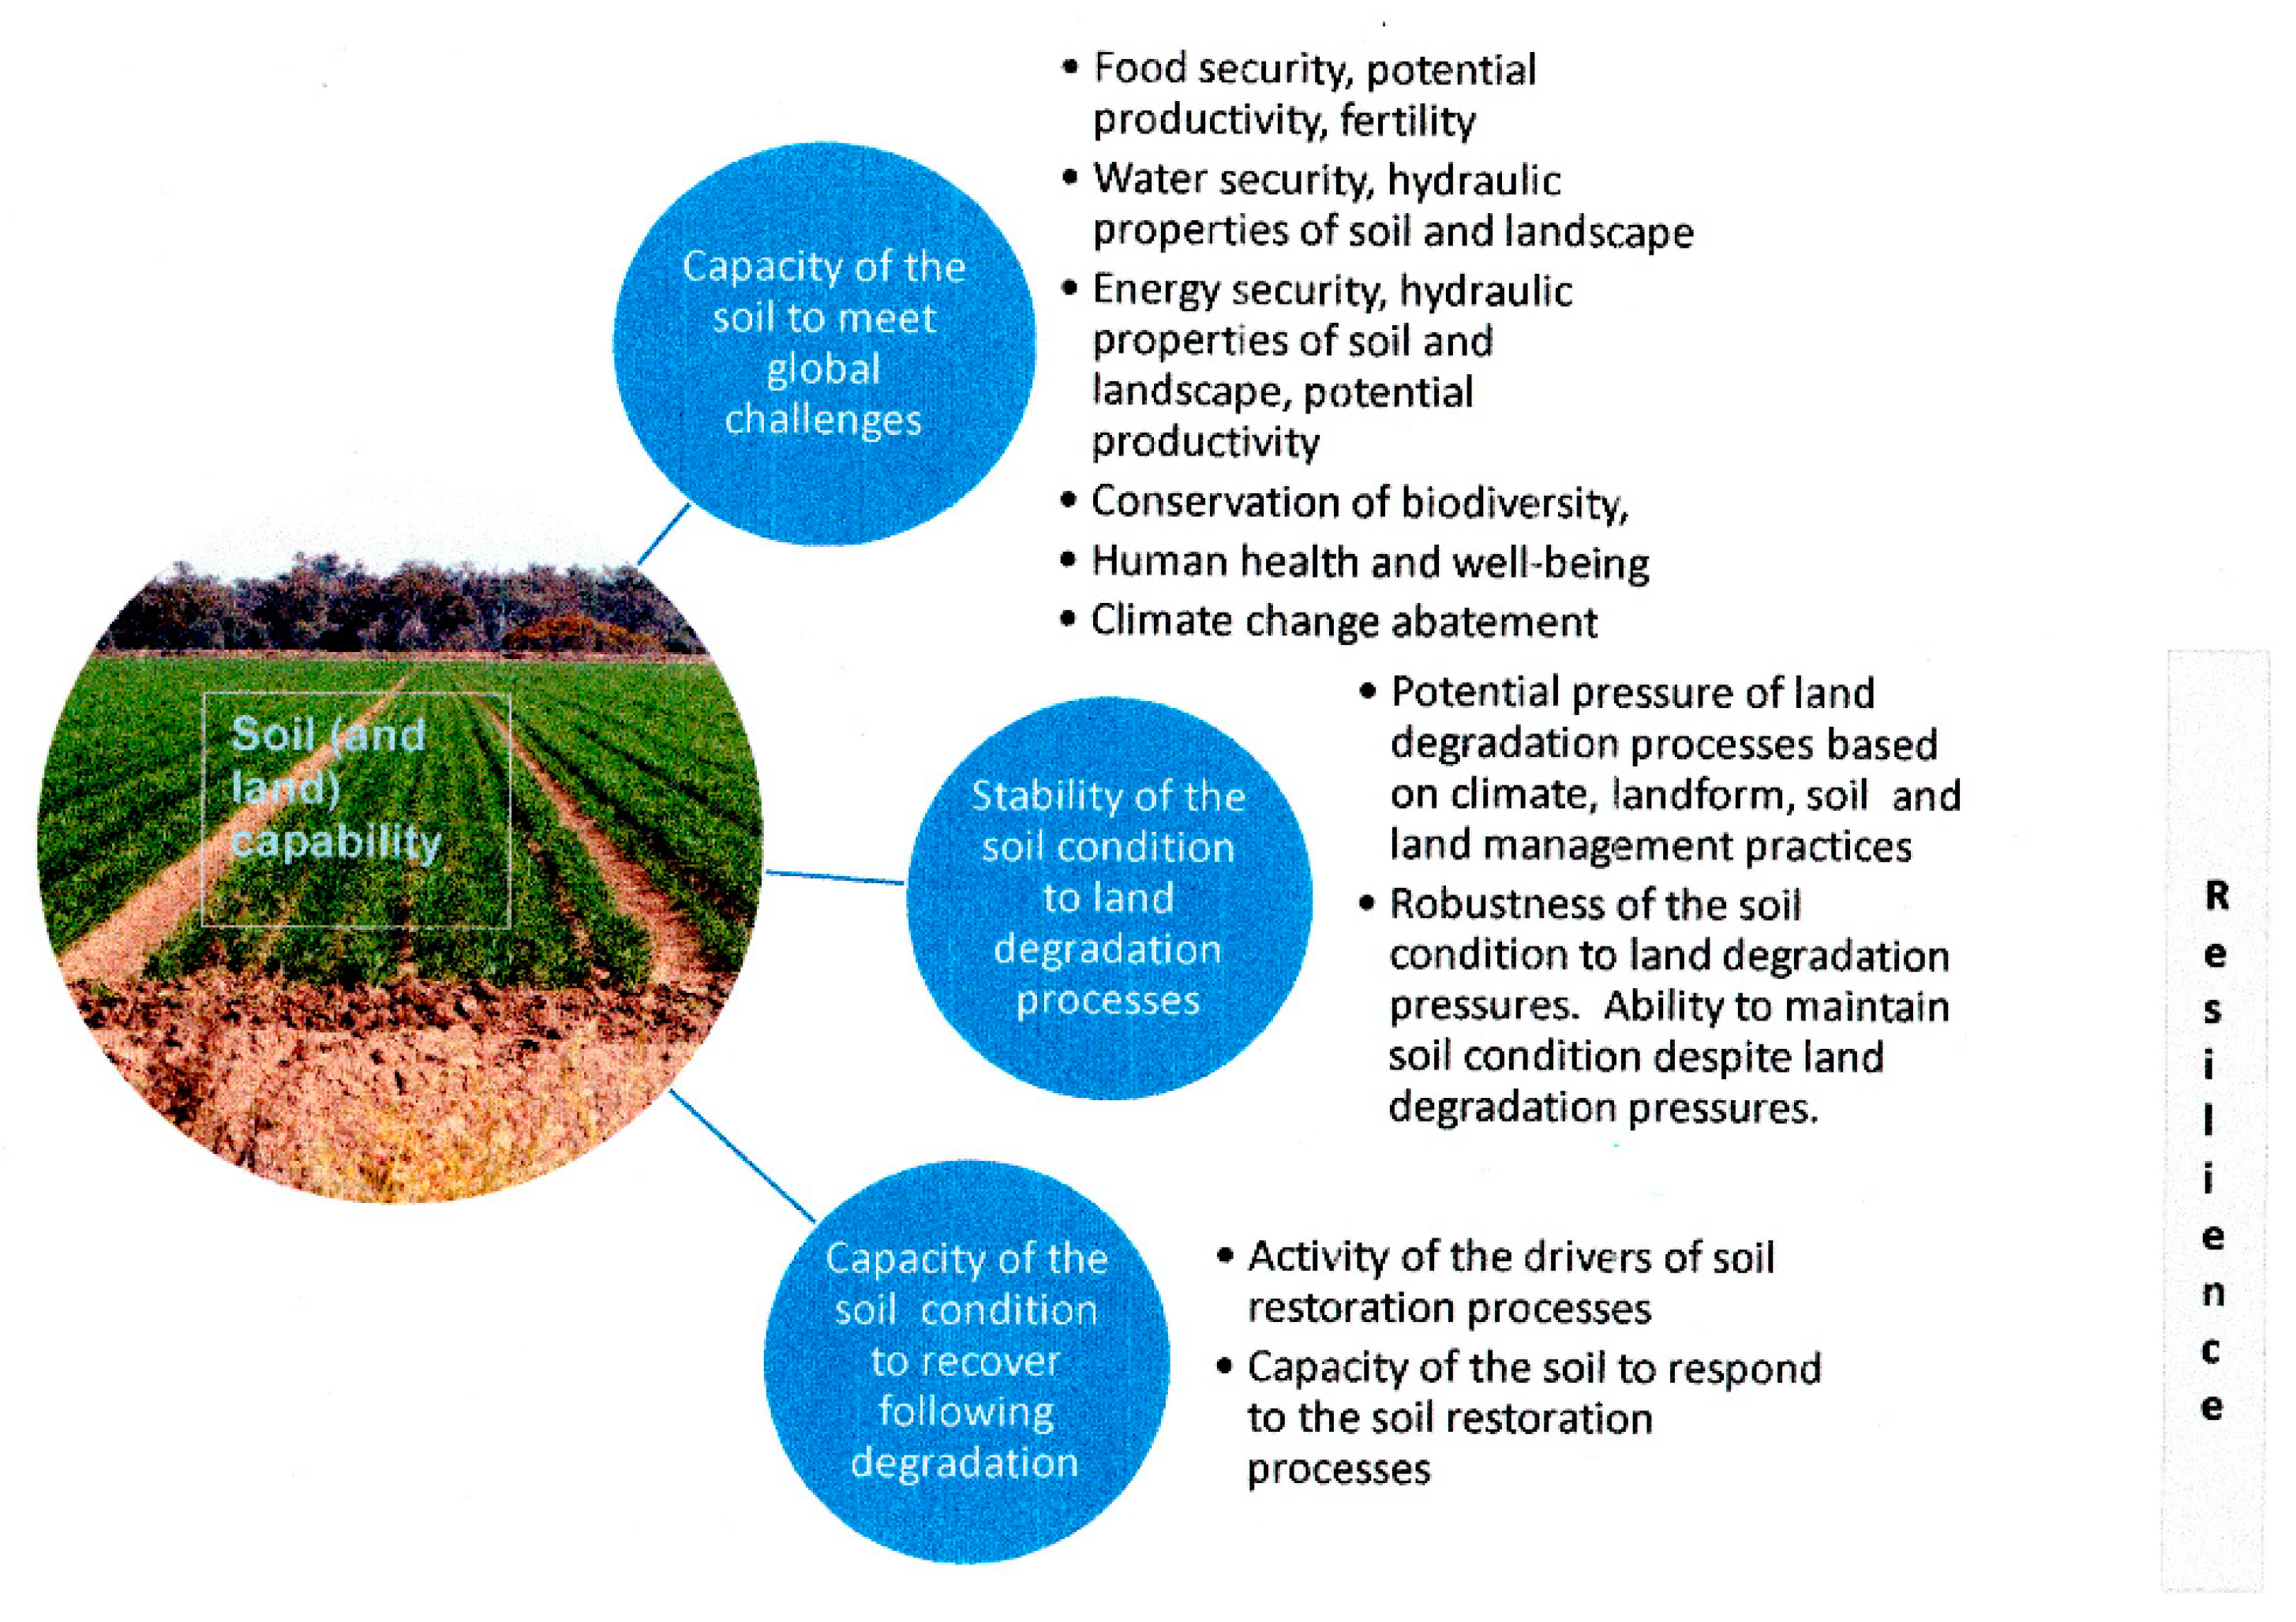
3.2. The Cowra Trough Red Soils in Central West New South Wales

3.2.1. Description

The Cowra Trough Red Soils represent a belt of Red Chromosols on undulating to rolling rises and low hills that are commonly used for cropping and grazing (Table 3, Figure 2). It is composed of the Manildra, Canowindra, Curumbenya, Cowra and Arthurville Soil Landscapes [40,41,44]. It represents an area of approximately 300,000 ha [45]. As a group, these soil landscapes have been identified as a soil monitoring unit [46] but also identified as a stratification unit for the National Soil Carbon Research Program [47,48,49] and for a trial soil carbon trading scheme [45,49]. The parent materials of the soil are intermediate metasediments and volcanics of the early Silurian to the early Devonian age within the Cowra Trough Geological Formation of the Lachlan Foldbelt [40,41,50]. The parent materials have resulted in the formation of moderately fertile soils with good agricultural potential. The surface soils are characterised as lighter textured (sandy loam to loam) soils with fragile structure [51], with reddish brown, non-sodic clayey subsoils. According to the land and soil capability scheme of the Office of Environment and Heritage [5], these are class 3 lands which means the land is capable of a wide variety of land uses (cropping, grazing, horticulture, forestry, nature conservation) but has moderate limitations. Careful management of limitations is required for cropping and intensive grazing to avoid land and environmental degradation. Some of the specific land degradation pressures identified include water erosion, soil acidification, secondary salinization in some parts of the landscape, nutrient decline and loss of soil organic carbon.

3.2.2. The facets of the capability of the soils within the Cowra Trough Red Chromosols

The three facets of soil and land capability are assessed for the Cowra Trough Red Soils (Table 4 and Table 5).
(i) Soil Capability Facet I: Capacity to meet global challenges and provide ecosystem services
The Cowra Trough Red Soils are an important cropping and grazing area for Central West New South Wales and so have a role to support the global challenge of food security (Table 4). They are relatively fertile soils usually more than 100 cm deep and with an average annual rainfall of 600 to 750 mm, which is evenly distributed throughout the year. The land capability is class 2 to 4, mostly class 3 based on OEH [5]. Yields for crops include wheat, which is premium Australian white and some hard wheat, of 2.9 t/ha [52], or can range from 1.5 to 5.5 t/ha with an average of about 3.9 t/ha [53]. Cropping trials [54] suggest an average yield of wheat of 3.75 t/ha and an average of 2.75 to 4.75 t/ha for wheat. Average yields for canola are 1.83 t/ha but can range from 0.47 to 2.98 t/ha [54]. Overall, the area produces at least $83 million of crops (based on 2006 values), which is 1.0% of New South Wales production [55].
The area includes at least 400,000 ha of pastures including 37,000 ha of clovers (white and subclover), 40,000 ha of lucerne, 64,000 ha of improved grass pastures (phalaris, cocksfoot and fescue species) and 100,000 ha of fertilised native pastures [56]. Based on 2006 values, these pastures are used to produce at least $59 million of beef annually, which is 1.7% of the NSW production, $31 million of sheep meat, 3% of NSW production and $45 million of wool, 3% of NSW production [55,57,58,59,60]. The Cowra Trough Red Chromosols clearly make an important contribution to food security.
The Cowra Trough Red Soils can also have a role in Climate Change Abatement through the potential for carbon sequestration. The soils have been under agricultural production for many years, ranging from 50 to 100 years, so there is the potential to increase the amounts of soil organic carbon in the soils through changes in land management. This was recognised in the implementation of a pilot carbon trading scheme in which a number of land holders were offered contracts to sequester carbon into the soils on targeted fields by changing land management practices [45,49]. Eleven contracted farms were chosen, and these were those that submitted the most cost-effective bids, with an average price of $A37 per t CO2-e, mainly due to high predicted sequestration rates driven by low initial SOC levels [45,49,61]. At each site, a minimum of 10 stations were sampled, with eight intact soil cores collected per station and divide into three depths (0–10, 10–20 and 20–30 cm), then, each depth was pooled for each station and analysed for total carbon (LECO) and bulk density calculated. SOC stocks (0–30 cm) were assessed before (2012) and after the pilot (2017), with 60% of sites showing a significant increase in SOC at p < 0.1 and 40% at p < 0.05. The measured increases in SOC ranged from 0.3 to 1.1 t/ha/year. The pilot study showed that it was possible to sequester carbon in these soils by changing land management. Conversion of soils under cropping land use to native vegetation are likely to have a greater potential to sequester carbon into the soil.
The Cowra Trough Red Soils could make a small contribution to Climate Change Abatement.
(ii) Soil Capability Facet IIa and b. Stability to degradation processes
The stability of the soils within the Cowra Trough Red Chromosols is dominated by the capacity of the soils to resist soil and environmental degradation by the processes on water erosion, soil acidification, and secondary salinization (Table 5). The stability to the degradation processes was assessed using the soil and land capability assessment based on the methodology of the OEH [5].

Stability to Water Erosion

The susceptibility of the soils to water erosion is indicated by the degree and length of slopes of the lands within the unit. Having most slopes in the range of 3% to 10%, and where slopes are less than 3%, the slopes are very long (>1000 m), as in the Arthurville soil landscape. Based on Table 3, in the land and soil capability assessment of OEH [5], this gives a Class 3 capability, which means there is a moderate water erosion hazard that requires specific land management options to prevent unacceptable degradation from water erosion. Conservation cropping with no till, minimum tillage and stubble retention are usually recommended.
A number of recorded erosion events and erosion studies confirm that water erosion can be a serious land degradation risk under cropping land use. A study using Cs137 on a 6% slope on the Arthurville soil landscape near Wellington recorded a long-term soil loss of 6.2 t/ha on a cropped midslope with a 6% slope [62]. This is similar to the long-term soil loss measured using runoff and soil loss plots at Cowra [63]. At Cowra on the Cowra soil landscape, a period of 200 mm of low-intensity rainfall in 1990 resulted in a soil loss of 78 t/ha from a 7% slope of 80 m length [64]. The management history of the paddock is continuous wheat since 1980 with frequent stubble burning, usually in February, and one to five cultivations prior to sowing. Many of the cultivations were done with a disc plough while other tillage operations were done with tyned implements or harrows. In 1990, the paddock was cultivated with offset discs in January to incorporate stubble, and then with a tyned implement and harrows in February. A final cultivation with a tyned implement and harrows was carried out on 8 May, just prior to the period of rainfall. The long-term average annual loss predicted using the Unified Soil Loss Equation was 9.2 t/ha/year [64]. A major storm event in February 1992 (estimated to be a 1 in 500-year storm event), caused a major soil loss on a site on the Cowra soil landscape [65]. Soil losses measured were different for the two tillage treatments on the paddock observed. On the loosely tilled traditional tillage treatment, the recorded soil loss was 342 t/ha which was estimated to be equivalent to 26 mm of soil loss. On the direct drill treatment which was not tilled and still retained a cover of 80% lupin stubble, the soil loss was measured as 65 t/ha with an estimated soil depth loss of 5 mm.
The evidence is clear that there is a risk of soil degradation by soil erosion by water unless land management practices are implemented to minimise the risk. The land management practices including pasture rotations and conservation cropping practices are available to minimise the risk of land degradation by water erosion.

Stability to Soil Acidification

The surface soils of the Cowra Trough Red Soils are not naturally acidic and have natural pH levels in the vicinity of 6.0 to 7.0 in water [40,41]. However, under relatively intense agriculture and especially under pasture improvement and a high concentration of clovers with a high level of nitrogen fixation combined with the trend for agriculture to remove produce from the land, the degradation pressures of acidification are substantial within these soils. The general acidification pressures are estimated at 250 to 300 kg lime/ha/year for annual pastures and crop/pasture rotations with a legume component [75]. Given the clay contents (estimated at 15% to 20%, perhaps less for the surface soils of the Cowra soil landscape on the granodiorite), and the soil organic carbon levels, the soils only have a moderate buffering capacity to acidification [5,75,76,82]. In the land and soil capability assessment [5], the Red Chromosols would be non-calcic brown soils and red-brown earths and so would have low to moderate buffering capacity against acidification. A map of acidity-affected surface soils [76] clearly shows the area of acid soils includes a large part of the Cowra Trough Red Soils. The map indicates that the acidity degradation is more severe in the southern half of the area in the vicinity of Canowindra and Cowra and this is confirmed by a Monitoring program [46]. In the southern half of the area the measured pH in 1:5 CaCl2 for the 0–5 cm, 5–10 cm, 10–20 cm and 20–30 cm depths were: 4.61 ± 0.32, 4.37 ± 0.28, 4.63 ± 0.36 and 5.10 ± 0.32. The corresponding values for the northern areas were 5.65 ± 0.42, 5.45 ± 0.45, 5.92 ± 0.39 and 6.27 ± 0.39. The operation of liming is frequently observed on the fields in the vicinity of Cowra and Canowindra in the southern areas.
Acidification is a definite land degradation hazard associated with agricultural production in the Cowra Trough Red Soils.

Stability to Soil Salinity

Soil salinity can have a number of degradation effects: land salinity on-site, effects on water quality of water resources and effects on salt loads to river systems. Given the nature of the soils, geology and groundwater, the Cowra Trough Red Soils do not have a major salinity problem [40,41,77,78]. Mandagery Creek does have a significant salt load, but measurements suggest the major source of the salt contributing to the salt load comes from the tributaries to the north of the Cowra Trough Red Soils that are associated with soil landscapes on the Dulladerry Rhyolite and perhaps some of the granites to the north [77]. The Arthurville does have a number of salt outbreak areas but spatially, these are only small in area. In a hydrogeological study of the area, Tuteja et al. [77] concluded that any salt outbreaks would be spatially small and confined to drainage depressions.
(iii) Soil Capability Facet IIIa and b. Capacity of the Soils to Recover from Degradation
The capacity of the soil to recover from degradation is dependent on at least some of the following features of the land and soils: the potential for plant growth, the depth of soils, especially the surface soils, the landform and potential to concentrate flows and seepage or through flow, and the degree of self-mulching in the surface soils. The potential for plant growth or net primary productivity is substantial for the soils of the Cowra Trough Red Soils. The average yields being about 3 t/ha, with some years up to 5 t/ha, suggest that the potential biomass production is about 6 t/ha to 14 t/ha assuming a harvest index of 0.35 for modern wheat [83], giving a carbon input of approximately 3.5 to 8 tC/ha/year. This approximately agrees with estimated net primary productivity values of 0.8 to 1.6 gC/m2/day [81] or 3 to 6 tC/ha/year. The soils are relatively deep (1.0 m or more) and surface soils are often 20 cm or more. There is some capacity to sustain erosion damage and recover from erosion, but exposure of the more clayey subsoils could be a limiting factor after continuous unmanaged high rates of erosion. Rates of soil formation from bedrock are likely to be very slow (<1 t/ha/year) [79] and much less than the rates of unmanaged water erosion. Rosewell [80] suggest soil formation rates may be 0.4 t/ha/year for drier areas and possibly up to 1 t/ha/year in wetter areas.
Recovery from soil acidification is more difficult and the use of lime appears a major necessity into the future. Minimising nitrate leaching using deeper rooted perennials to reduce the rate of acidification is recommended [75,76]. One of the strong recommendations is the prevention of soil acidification moving too deep into the soil profile and the maintenance of a soil testing programme, soil management regime and liming programme to ensure that any acidification is confined to the surface layers where it can be economically and effectively countered by liming. Once acidification extends into deeper soil layers, recovery from acidification becomes more expensive and difficult to manage [75,76].
Recovery from salinity is required for a few saline outbreaks that do occur in some of the drainage lines in the Cowra Trough Red Soils. Revegetation on the saline site using salt-tolerant species plus revegetation in the catchments suppling groundwater to the saline sites is seen as the means to recover these sites [78]. Recovery from salinization is a slow process of changing the hydrology of hillslopes and catchments and can take a long time [78].

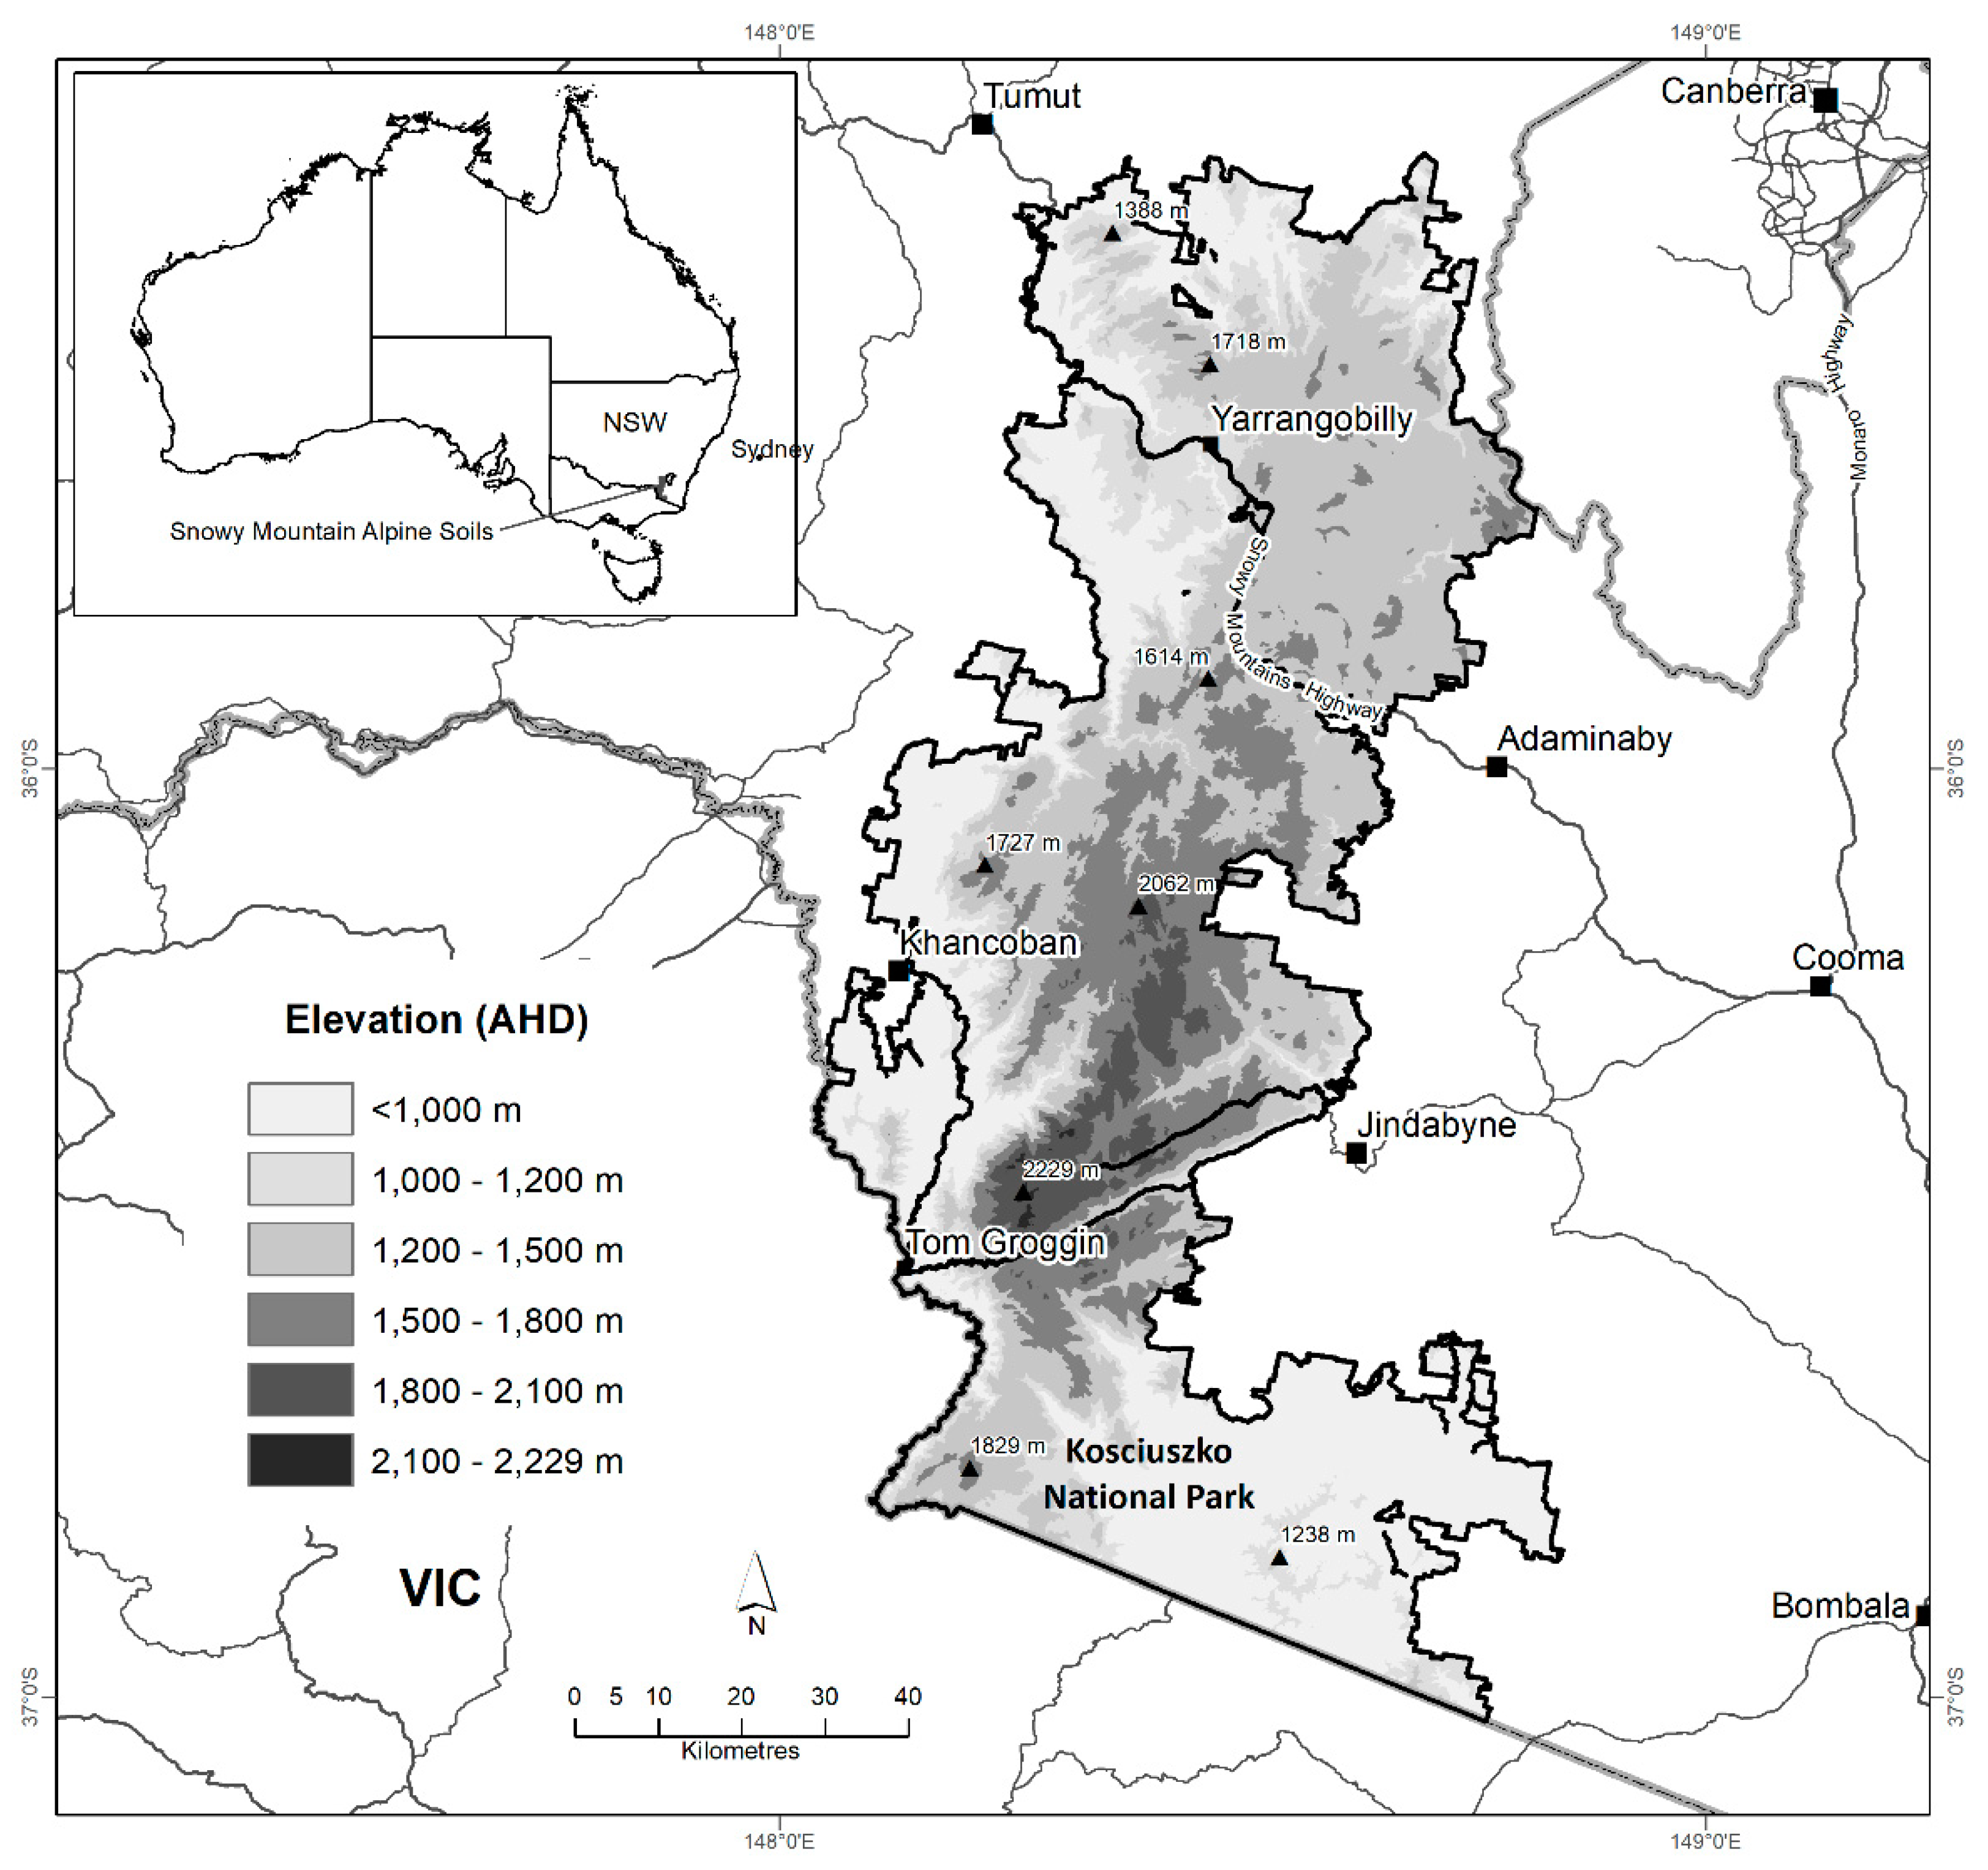
3.3. Snowy Mountains Alpine Soils

3.3.1. Description

The Kosciuszko National Park within the Snowy Mountains of south eastern Australia is an important economic and environmental resource. It is located at 36°04′S and 148°21′E and covers an area of 6900 km2 and extends from west of Canberra to the Victorian New South Wales border, a distance of 150 km [42,84], (Figure 3). The area is mostly alpine and subalpine including large areas above 1000 m in elevation and has significant snowfalls in winter, with snow depths to a metre or more in winter especially in the higher elevations to the south in the vicinity of the main range that includes Mount Kosciuszko which has an elevation of 2228 m. The higher elevations of the main range show signs of glaciation which occurred in the Pleistocene, 20,000 years ago in the last ice age. There are short segments of U-shaped valleys, tarn lakes, moraines and cirques [42,84]. The area includes 2600 km2 of “high mountain country” (>1500 to 1680 m elevation) which receives heavy winter snowfalls and has unique vegetation and soils [42,84]. Much of the Snowy Mountains has plateau-like surfaces, but these have been strongly eroded to form areas of steeply incised valleys and rugged terrain as the plateau falls to the lower elevations of the slopes and plains below [42,84].
The geology of the area is variable and includes a range of lithologies. The main range in the south in the vicinity of Perisher and Mount Kosciuszko is dominated by Silurian/Devonian granite and granodiorite. In the north in the vicinity of Yarrangobilly and towards Tumut, the lithology is dominated by Silurian acid volcanics and smaller areas of limestones (such as at Yarrangobilly Caves) and basic to intermediate volcanics, with areas of Ordovician marine sediments. There are small outcrops of Cainozoic basalt, but these are not extensive [42,50,84,85]. Importantly, the lithology of the parent rocks tends to be largely felsic to intermediate so that variations in soil formation are dominated by the variation in the climate [42,74,86].
The average rainfall varies from 760 to 2000 mm in the subalpine areas and 1800 to 3000 mm in the alpine areas [42]. Much of this precipitation falls as snow in the winter months as the average temperature for the winter in the alpine areas is less than −3.9 °C. In summer, the average temperature is 10 to 15 °C [42,43]. In the subalpine areas, snow settles for at least one month in winter and the average temperature is –1.0 to −4.0 °C [42,43].
The main soils are determined largely by elevation and climate (Table 6). In the lower elevations (less than 1200 m), there are a range of soils including Brown Kandosols (brown soils of light texture), Grey and Brown Chromosols tending to Kurosols in some locations in the north towards Yarrangobilly (grey-brown podzolic soils) [42,74,86]. Between 1200 to 1500 m, the soils become transitional between the Dermosols and Chromosols and the Peaty Tenosols (alpine humus soils) as the colder climate results in accumulations of soil organic matter in the soil. Above 1500 m, the Peaty Tenosols (alpine humus soils) become the dominant soil type [42,43,74,86].
Other important soils that occur throughout the Kosciuszko National Park (KNP) are the Organosols (peats, mires, bogs and fens) [73,84,87,88] (Table 6). The Carex fens are more common at lower altitudes between 1000 to 1600 m, while the peats and bogs are most common above 1600 m. The two major types are the peats, which are Organosols and Carex fens which are more akin to the Peaty Tenosols (alpine humus soils). Together, these strongly organic soils that occur in areas that are seasonally or permanently wet, cover about 6000 ha within Kosciuszko National Park. It may be only about 1% of the land area of the park, but includes many of the important drainage depressions, lower slopes and flow lines of the Park. These soils have the important hydrological function of storing and controlling water flow in the catchments within the KNP to control water security. The Organosols include fibric, hermic and sapric types of organic layers and acid peats are common [42,73,84,87,88]. The fibric types are more common in the Carex fens in lower altitudes, while the hermic and sapric peats are more common in the peats and bogs at high altitudes. However, both peat types are often present in the same soil profile [73].
The other important soil type that occurs across all altitudes is the Lithic and Paralithic, Leptic Rudosols (lithosols), that are common on hillcrests and steep slopes [42,86].
The high mountain flora and fauna of Australia differ greatly from those of the rest of the continent as they have to have physiological resistance to fluctuating high and freezing temperatures, intense insolation, fierce winds, periodic moisture stress, and burial by snow. Their soils and vegetation provide a series of unique biodiversity in its ecological communities that are becoming recognised as of vital importance to the nation and its inhabitants. Included are the alpine Sphagnum Bogs and associated Fens [42,43,73,87] and the subalpine woodlands of Eucalyptus pauciflora and Eucalyptus niphophila (snow gums) [42,43]. These not only provide habitat for unique fauna but are important in influencing hydrological processes throughout the catchments in the alpine areas.
The ecological significance of alpine areas is mirrored in their hydrological significance as a reliable source of large volumes of high-quality water for both irrigate agriculture and power generation.

3.3.2. The Facets of the Capability of the Soils within the Kosciuszko National Park in the Snowy Mountains of New South Wales.

The land degradation facets of soil capability are assessed for the soils of the Kosciuszko National Park in the Snowy Mountains of NSW (Table 7).
(i) Soil Capability Facet I. Capacity to Meet Global Challenges and Provide Ecosystem Services
The soils of the Kosciuszko National Park make an important contribution to the water supply for irrigation that is out of all proportion to its value for mountain grazing. These mountains are the major source of irrigation water in southern Australia, for which there are no other alternatives (Table 4). The Kosciuszko soil landscape system supports the global challenge of water security. As well, the Kosciuszko soil landscape system supports energy security through the production of hydroelectricity and human health and biodiversity preservation by its use as a recreation area and conservation area.
The soil landscape system is of great importance to the national economy on account of the large and reliable rivers of NSW which have their headwaters there, including the Upper Murrumbidgee, Upper Murray and Snowy-Eucumbene systems and the Goodradigbee in NSW, and the Cotter River in the Australian Capital Territory [42,43,84].
The importance of the Snowy Mountains to supply water and water security for the western flowing rivers of the Murrumbidgee and the Murray was greatly enhanced with the completion of the Snowy Mountains Scheme in 1974. The Scheme diverts water from the eastern flowing rivers (the Snowy River) especially to the western flowing rivers and includes 80 km of aqueduct pipelines, 13 major tunnels measuring over 145 kme, seven power stations (two deep underground), eight switching stations and control centres, and 16 large dams. The scheme also provides over 2300 GL of water annually for irrigation for large parts of inland New South Wales and Victoria to the west of the Great Dividing Range [66,67,69,70]. This has the capacity to irrigate 1 million ha on the plains of the Murray and Murrumbidgee Rivers and produce $3 billion of agricultural produce [66,67,68,69,70].
While the diversion of water for irrigation is a key purpose of the scheme, electricity generation is a core by-product. By directing the water through a series of power stations as it plunges 800 m down the western escarpment, the Scheme can generate large amounts of peak-load renewable electricity to meet fluctuating demands across eastern Australia. The scheme has a generating capacity of approximately 4100 MW and provides nearly a third of all renewable energy fed into the eastern mainland grid, powering major cities like Sydney, Melbourne and Canberra [66,67]. It has the capacity to produce 4500 GWh of electricity every year, which in 2018, had an estimated market value of $1.4 to 1.8 billion assuming a cost of $0.30 to $0.40 per kWh [67,71]. In 2018, it provided 15% of Victoria’s power needs and 18% of the power needs of NSW [71]. A proposal is under consideration (Snowy 2.0) to expand the renewable energy generation from the Snowy Scheme into the future [67]. The flexibility of the generating capacity is constrained by the need to maintain flows in the western flowing rivers for irrigation demands as well as the potential for seasonal fluctuations in rainfall/precipitation and storage capacity [99]. The value of the Snowy Mountains for water security is demonstrated by the statement from Morland [100]:
The high country of the snow belt is our most valuable and productive water resource, an area unique for its high precipitation including heavy winter snowfalls, high water retention capacity and very-high water yields”.
[100] (p. 220)
The relative values of the Snowy Mountain soils for water and energy security is confirmed by the estimated returns for the alternative land uses. Good [101] identified that studies had shown that the economic value of the catchments for water yield far outweighed their value for grazing. This was not surprising given the low temperatures and short growing season of the pastures in the alpine areas. The net primary productivity of the landscape being about 1400 kg/ha/year [81]. The value of water for irrigation, hydroelectricity, tourism, carbon storage and biodiversity conservation can be estimated to be substantially more than any returns from grazing [102,103] Table 4. The value of water was estimated at around 120 times that of grazing, AUD $700 per hectare for hydroelectricity compared. to AUD $6 per hectare for grazing [101]. The costs of pasture establishment and management of pasture would, however, be very high compared to the returns, estimated at 0.20 to 0.80 of the costs [43]. The estimated returns to the economy if the alpine area was used for grazing is estimated at 0.1% of the value of production in sheep and cattle for New south Wales and Victoria [43]. The potential for land use on the soils in the alpine or high mountain areas to contribute to food security are limited. Their value is much greater to contribute to water and energy security, tourism and biodiversity conservation.
The importance of the Organosols (peats, mires, bogs and fens) in the wet areas of the Kosciuszko National Park to catchment hydrology of the Australian Alps has long been recognised and studies continue to investigate the importance of peat in influencing hydrological processes [42,43,101,102,103]. The bogs and fens slow the flow of water, holding it in the landscape and minimising high peak flows. Sphagnum vegetation and the underlying peat Organosols have significant water-holding capacity, which can modulate water flow and maintain the hydrology of surrounding environments [73,87,92,102]. The manner in which bog and fen communities gradually release water from the spring snow melt is critical to the survival of numerous other ecological communities [101]. These Organosol areas can also be a natural filter for nutrients, pathogens and sediments maintaining water quality throughout catchments [84,87].
The Snowy Mountains soils is to contribute to biodiversity and human health. The high mountain flora and fauna of Australia differ greatly from those of the rest of the continent and the unique alpine Sphagnum Bogs and associated Fens [42,43,73,84,87], and the subalpine woodlands of Eucalyptus pauciflora and Eucalyptus niphophila (snow gums) [42,43] have limited occurrences anywhere else. The ecological communities of the high mountains of Australia are known to provide significant habitat for a number of endemic and threatened flora and fauna species. The persistence of this ecological community is likely to be critical to the survival of a number of these species [87].
The Snowy Mountains provide areas for unique recreation and tourism especially for activities such as skiing, bushwalking and sightseeing. In 2015, there were 1.247 million visitors to the Snowy Mountains, requiring 2.826 million nights of accommodation and spending $481 million [72]. The recreation component can be considered a valuable contribution to the global challenge of human health and well-being.
While there are substantial stores of soil carbon, the potential capacity for the Snowy Mountains soils to have a role in Climate Change Abatement is probably limited to maintain soil carbon levels at the current levels and preventing damage to the important areas of Organosols in wet areas (peats, mires, bogs and fens) [73], which could result in substantial losses of soil organic carbon. The average carbon store in Sphagnum bogs in the subalpine and alpine areas is 200 t C/ha. For montane and subalpine Carex fen, it is about 750 t C/ha. Individual swamps or mires may preserve much higher carbon stores and one swamp with 4 m of peat is estimated to contain 2600 t C/ha. Some peatlands approach the 2844 t C/ha store held in Eucalyptus regnans forests, which is thought to be the most carbon-dense ecosystem in the world [95].
(ii) Soil Capability Facet IIa and b. Stability to Degradation Processes
The stability of the soils within the Kosciuszko National Park is dominated by the low capacity of the soils to resist soil and environmental degradation by the processes of water erosion and to a lesser extent, wind erosion (Table 7). Soil acidification affects some areas in the north of the Park. Nutrient decline is a problem that is associated with erosion and loss of plant and soil materials (Table 7). The stability to the degradation processes was assessed using the soil and land capability assessment based on the methodology of the OEH [5].

Stability to Water Erosion

Water and wind erosion are major soil and land degradation pressures on the soils of the Kosciuszko National Park. They are also a threat to safeguarding the water sources for irrigation and domestic use in the western flowing rivers of the interior as well the energy production of the hydroelectricity infrastructure of the Snowy Mountains Scheme [42,43,84,94,99,100,103,104]. The water erosion hazard for the Snowy Mountains is very high based on Australian standards, with the rainfall erosivity being 1500 to 2000 MJ.mm/(ha.h.a) [80,89,90]. The length and degree of slope factor (LS Factor) is also frequently high for this soil landscape system, commonly being >3.0 [91]. While in their natural state, the soils are very stable due to the very high infiltration capacity and very low rates of surface runoff. This changes with loss of the protective organic rich upper soil layer. The exposed mineral soil is prone to erosion by rain splash and runoff, to frost heave and to wind erosion. Johnston [93] measured water erosion rates of zero for undisturbed sites with complete groundcover, increasing to between 4 and 18 t/ha, dependent on the degree of groundcover loss. Grazing and disturbance can rapidly reduce ground cover levels.
Historically, the alpine, subalpine and montane ecosystems of the KNP have been regularly grazed and burnt. Grazing commenced about 1839 and expanded to a regular basis with the establishment of Snow Leases in 1889 for drought relief and summer grazing [100]. Burning of the snow gum woodlands and snowgrass grasslands was carried out on a regular basis in early summer to remove dry biomass and provide green shoots for stock. Together with the impact of selective grazing of more palatable herbs and forbs, large areas of bare ground or reduced cover were created, exposing the soils to water and wind erosion [42,43,94,100,103,104]. Burning, grazing and accelerated runoff flows also resulted in the draining and drying out of many mires, bogs and peat swamps [43,73,84,103]. The damage to the mires, bogs and peat swamps has the potential to alter the hydrology of the catchments as swamps and bogs are replaced by channelized flow.
Codification dimension of soil security has had an impact on land management in the KNP. The winding back of the impacts of grazing and burning land management practices in the alpine areas commenced in 1943 when burning on the Snow Leases was prohibited and stocking rates were limited to one sheep per acre. In 1944, the KNP was formed and by 1958, all land above 4500 ft (1370 m) was withdrawn from Snow Leases and grazing was prohibited [94,103,105]. More recently, there has been a push to allow the expansion of grazing by wild horses or brumbies, which have the potential to redo some of the damage of the past [104].
The action of frost can exacerbate the susceptibility of the soils to wind erosion if ground cover is removed. The area is subjected to high wind velocities [42,43,103]. The frost action results in thin ice needles effectively mulching the soil into fine aggregates that are readily detached by the action of wind and water. The main protection of these fine aggregates from movement by the action of wind or water movement is vegetation cover.
The relative rates of erosion are estimated by Costin et al. [102]. In the alpine and subalpine areas, the sod tussock grasslands have the following relative erosion rates: continuous sward −0, short grazed, continuous sward −1, damaged sward, bare spaces between tussocks −110. In the subalpine woodlands the relative erosion rates are: dense cover of snowgrass sward −0, bare ground ×1300. The estimated relative runoff rates are: the alpine and subalpine areas the sod tussock grasslands: continuous sward −3, short grazed, continuous sward −22, damaged sward, bare spaces between tussocks −42. In the subalpine woodlands, corresponding values are: dense cover of snowgrass sward −2, bare ground 56. The importance of ground cover in controlling erosion and runoff is evident from these values.
Costin et al. [102] measured relative erosion rates of nil for a climax community of snow grass with herbaceous component to 22.8 t/ha for a snow grass cover with bare areas. Costin et al [102] estimated that 60% cover was required to minimise the impacts of erosion.
(iii) Soil Capability Facet IIIa and b. Capacity of the Soils to Recover from Degradation
The recovery of the soil from water and wind erosion is very dependent on the rate of plant growth. The rate of plant growth in the alpine areas is quite low and the net primary productivity for the alpine areas is estimated at 1.4 t/ha/year [81]. Rainfall is plentiful but the temperatures are very low for much of the year, limiting plant growth [42,106,107,108]. This means any recovery from erosion damage is likely to be very slow. Short growing seasons and low nutrient supply mean that subalpine and especially alpine vegetation is very slow to recover once damaged. Bryant [106,108] showed that the rate of recovery of the vegetation cover and the recovery of the soil from erosion is very dependent on the amount of cover remaining after grazing is removed. If the ground cover remaining is in the range of 0% to 20% after grazing, it is estimated that it would take 60–80 years from the vegetation cover and soil to recover to pre-grazing levels. Results indicated that in some bare ground plots, there was no recovery of any vegetation cover 11 years after grazing was removed. On the basis of results presented, Bryant [106,108] concluded that summer grazing and periodic burning were not sustainable practices in the grasslands and woodlands of the Snowy Mountains between 1220 and 1800 m where the primary objective is the provision of water and energy security.
The recovery of mires, bogs and peats is a very slow process of accumulation of undecomposed biomass and peat. It may even require a restoration of the hydrology to pre-grazing conditions [73,88,107]. Given that the average carbon store in the mires, peats and bogs is 200 to 750 t/ha and that the estimated rates of accumulation of carbon in the mires, peats and bogs are 0.09 to 0.21 t/ha/year, it is clear it will take some time for many of the damaged or destroyed areas of mires to recover by natural processes [73,88].
Over the past 150 years, most mountain peatlands in the Snowy Mountains region have been significantly affected by cattle grazing and fire [42,73,84,88,108,109,110]. For example, trampling has caused destruction and there has been increased drainage accompanied by seasonal burning. Many fibric peats have been converted to mineralised humic peats [111,112] and many other peatland areas have been converted to tussock grassland. Some recovery of peatland vegetation has occurred within protected areas since cattle were removed after 1940 [101,109].
Because natural recovery is slow and for hydrological reasons there is a need for rapid recovery, it has been seen as necessary to introduce investment and artificial land management practices to enhance recovery rates. Good [107] presents a range of practices designed to accelerate recovery of eroded and degraded sites including the mires, bogs and swamps. It includes the use of mulches, fertiliser planting of native seeds. Some of earlier restoration work by the Soil Conservation Service [97,98,99] needs to be redone after several years using methodologies based on species and nutrient regimes more compatible with the local ecology [88,107,108,109,110].
The restoration of the soils and the mires, bogs and peats has a small capacity to sequester carbon, especially as some of the peats in the natural, undegraded condition approach the 2844 C t/ha store held in Eucalyptus regnans forests [73], claimed to be the most carbon-dense ecosystem in the world [96]. Based on the accumulation of peat, the sequestration rate of carbon for the whole peatland estate of the Snowy Mountains has an annual mean carbon sequestration rate of only 5000 ± 2400 t/year [89]. The depth of peat is estimated to accumulate at rates of 0.1 to 0.9 mm/year [89]. The peat growth figures show that deep peats take thousands of years to accumulate and cannot be replaced within human life-times once lost or mineralised [73].

4. Conclusions

Soil capability can be seen to be made up of several different facets that can assist in its assessment. The first facet is the capacity of the soil to undertake a range of functions to meet one or more of the global challenges of food security, water security, energy security, climate change abatement, the preservation of biodiversity and the maintenance and improvement of human health and welfare. The second is the stability of the soil condition to the pressures or forcings of soil and land degradation processes imposed the environment and land management practices. This stability can be assessed using the land capability assessments widely used over a number of years and more recently updated as a land and soil capability system [5]. The third is the capacity of the soil condition to recover after the land degradation pressures or forcings are removed. A resilient soil with high stability and a strong capacity to recover, has the capacity to sustain the land management practices necessary to meet the global challenges over an extended period of time without significant soil, land or environmental degradation. Significant degradation is degradation that would impact on the long-term capacity of the soil to sustain land management practices that meet the global challenges.
The advantages of this approach to soil capability are:
  • It identifies the importance of the capacity of the soil to meet global challenges.
  • It identifies the role of land management in meeting global challenges.
  • It links the land and soil degradation processes to the soil security concept.
  • It provides a link between sustainable land management and soil security.
The two examples are useful to show how one set of soils has food security as its primary global challenge, the Cowra Trough Red soils, while the other soil landscape, the Snowy alpine soils, has water security and energy security as its primary global challenge. The main land degradation pressures impacting on the Cowra Trough Red soils are water erosion and soil acidification, with some impacts of salinization. However, the soils and landscape are relatively robust, and the land degradation pressures can be managed by the adoption of a range of well-established land management practices including conservation tillage, stubble retention and pasture rotations. The alpine soils of the Kosciusko National Park have low stability and resilience. To maintain their important functions outlined above, it is necessary to restrict the impact of land management practices, especially over grazing and the removal of groundcover. This has been largely achieved by codification and the establishment of a national conservation park. Land management is controlled to maintain groundcover and minimise the impact it has on the soils and landscape.

Author Contributions

For research articles with several authors, a short paragraph specifying their individual contributions must be provided. The following statements should be used “conceptualization, B.M.; methodology, B.M. and P.F.; validation, B.M. and P.F.; investigation, B.M. and P.F.; writing—original draft preparation, B.M.; writing—review and editing, B.M. and P.F.; project administration, B.M.

Funding

This research received no external funding.

Acknowledgments

The authors wish to acknowledge the valuable discussion and input from a number of reviewers.

Conflicts of Interest

The authors declare no conflict of interest.

References

  1. McBratney, A.; Field, D.J.; Koch, A. Field, and Andrea Koch. The dimensions of soil security. Geoderma 2014, 213, 203–213. [Google Scholar] [CrossRef]
  2. McBratney, A.B.; Field, D.J.; Morgan, C.L.S.; Jarrett, L.E. Soil Security: A rationale. Chapter 1. In Global Soil Security Symposium; Progress in Soil Science Series; Field, D., Morgan, C.L., McBratney, A.B., Eds.; Springer: Cham, Switzerland, 2017. [Google Scholar]
  3. UNDESA. The Sustainable Development Goals Report 2018; United Nations: New York, NY, USA, 2018. [Google Scholar]
  4. Bouma, J. How to communicate soil expertise more effectively in the information age when aiming at the UN Sustainable Development Goals. Soil Use Manag. 2019, 35, 32–38. [Google Scholar] [CrossRef] [Green Version]
  5. OEH. The Land and Soil Capability Assessment Scheme: Second Approximation. A General Rural Land Evaluation System for New South Wales, Sydney. New South Wales Office of Environment and Heritage: Sydney, Australia, 2012. Available online: www.environment.nsw.gov.au (accessed on 6 October 2019).
  6. Levin, M.J.; Dobos, R.; Peaslee, S.; Smith, D.W.; Seybold, C. Soil capability for the USA now and into the future. In Global Soil Security Symposium; Progress in Soil Science Series; Field, D.M., Cristine, L., McBratney, A.B., Eds.; Springer Publishers: Cham, Switzerland, 2017; Chapter 6. [Google Scholar]
  7. Henry, B.; Murphy, B.; Cowie, A. Sustainable Land Management for Environmental Benefits and Food Security; A Synthesis Report for the GEF. Global Environmental Facility: Washington, DC, USA, 2018. Available online: http://stapgef.org/sites/default/files/publications/SLM-Henry_Murphy_Cowie.pdf (accessed on 6 October 2019).
  8. USDA. National Soil Survey Handbook- Part 622. Interpretive Groups. Technical Handbook 430; United States Department of Agriculture: Washington, DC, USA, 2015.
  9. FAO. A Framework for Land Evaluation. FAO Soils Bulletin, No. 32; Food and Agriculture Organization of the United Nations: Rome, Italy, 1976. [Google Scholar]
  10. FAO. Land Evaluation: Towards a Revised Framework. Land and Water Discussion Paper No 6; Food and Agriculture Organization of the United Nations: Rome, Italy, 2007. [Google Scholar]
  11. Dent, D.; Young, A. Soil Survey and Land Evaluation; George Allen and Unwin: London, UK, 1981. [Google Scholar]
  12. World Bank. Sustainable Land Management Sourcebook; World Bank: Washington, DC, USA, 2008. [Google Scholar]
  13. Global Soil Partnership. Plan of Action for Pillar One of the Global Soil Partnership. Pillar One—Promote Sustainable Management of Soil Resources for Soil Protection, Conservation and Sustainable Productivity. Global Soil Partnership, Food and Agriculture Organization of the United Nations: Rome, Italy, 2014. Available online: www.fao.org/fileadmin/user_upload/GSP/docs/ITPS_Pillars/annexII_pillar1.pdf (accessed on 6 October 2019).
  14. Bennett, J.M.; McBratney, A.; Field, D.; Kidd, D.; Stockmann, U.; Liddicoat, C.; Grover, S. Soil Security for Australia. Sustainability 2019, 11, 3416. [Google Scholar] [CrossRef]
  15. Dominati, E.; Patterson, M.; MacKay, A. A framework for classifying and quantifying the natural capital and ecosystem services of soils. Ecol. Econ. 2010, 69, 1858–1868. [Google Scholar] [CrossRef]
  16. McBratney, A.B.; Field, D.; Morgan, C.L.S.; Huang, J. On Soil Capability, Capacity, and Condition. Sustainability 2019, 11, 3350. [Google Scholar] [CrossRef]
  17. FAO. Land Quality Indicators and Their Use in Sustainable Agriculture and Rural Development. FAO Land and Water Bulletin No 5; United Nations Food and Agriculture Organisation: Rome, Italy, 1997. [Google Scholar]
  18. MA. Millennium Ecosystem Assessment: Ecosystems and Human Well-being—A Framework for Assessment; World Resources Institute: Washington, DC, USA, 2005. [Google Scholar]
  19. UNEP. Assessing Global Land Use: Balancing Consumption with Sustainable Supply; A Report of the Working Group on Land and Soils of the International Resource Panel; United Nations Environment Program; Bringezu, S., Schütz, H., Pengue, W., O’Brien, M., Garcia, F., Sims, R., Howarth, R., Kauppi, L., Swilling, M., Herrick, J., Eds.; United Nations Environment Program: Nairobi, Kenya, 2014. [Google Scholar]
  20. Cowie, A.L.; Orr, B.J.; Castillo Sanchez, V.M.; Chasek, P.; Crossman, N.D.; Erlewein, A.; Louwagie, G.; Maron, M.; Metternicht, G.; Minelli, S.; et al. Land in balance: The scientific conceptual framework for Land Degradation Neutrality. Environ. Sci. Policy 2018, 79, 25–35. [Google Scholar] [CrossRef]
  21. Murphy, B. Testing the Links between Soil Security, Sustainable Land Management Practices and Land Evaluation. In Global Soil Security Symposium. Progress in Soil Science Series; Field, D., Morgan, C.L., McBratney, A.B., Eds.; Springer Publishers: Cham, Switzerland, 2017; Chapter 10. [Google Scholar]
  22. Field, D.J. Soil security: Dimensions. In Global Soil Security Symposium. Progress in Soil Science Series; Field, D., Morgan, C.L., McBratney, A.B., Eds.; Springer Publishers: Cham, Switzerland, 2017; Chapter 2. [Google Scholar]
  23. Singh, K.; Todd Sanderson, T.; Damien Field, D.; Chris Fidelis, C.; Yinil, D. Soil security for developing and sustaining cocoa production in Papua New Guinea. Geoderma Reg. 2019, 17, e00212. [Google Scholar] [CrossRef]
  24. Field, D.J.; Sanderson, T. Distinguishing between capability and condition. In Global Soil Security Symposium. Progress in Soil Science Series; Field, D., Morgan, C.L., McBratney, A.B., Eds.; Springer Publishers: Cham, Switzerland, 2017; Chapter 4. [Google Scholar]
  25. Smil, V. Global population and the nitrogen cycle. Sci. Am. 1997, 277, 76–81. [Google Scholar] [CrossRef]
  26. Klingebiel, A.A.; Montgomery, P.H. Land Capability Classification. Agriculture Handbook No. 210; Soil Conservation Service, Department of Agriculture: Washington, DC, USA, 1961. [Google Scholar]
  27. Emery, K.A. Rural Land Capability Mapping; Soil Conservation Service of NSW: Sydney, Australia, 1986. [Google Scholar]
  28. Helms, D. The Development of Land Capability Classification; Readings in the history of the Soil Conservation Service; Soil Conservation Service, United States Department of Agriculture: Washington, DC, USA, 1992; pp. 60–73.
  29. Doran, J.W.; Zeiss, M.R. Soil health and sustainability: Managing the biotic component of soil quality. Appl. Soil Ecol. 2000, 15, 3–11. [Google Scholar] [CrossRef]
  30. Carter, M. Quality (soil), critical limits and standardization. In Encyclopedia of Soil Science; Lal, R., Ed.; Marcel Dekker: New York, NY, USA, 2002. [Google Scholar]
  31. Palm, C.; Sanchez, P.; Sonya Ahamed, S.; Awiti, A. Soils: A contemporary perspective. Annu. Rev. Environ. Resour. 2007, 32, 99–129. [Google Scholar] [CrossRef]
  32. Huang, J.; McBratney, A.B.; Malone, B.P.; Field, D.J. Mapping the transition from pre-European settlement to contemporary soil conditions in the Lower Hunter Valley, Australia. Geoderma 2018, 329, 27–42. [Google Scholar] [CrossRef]
  33. IUSS. World Reference Base for Soil Resources 2014, update 2015. In International Soil Classification System for Naming Soils and Creating Legends for Soil Maps; International Union of Soil Science Working Group WRB. World Soil Resources Reports No. 106; FAO: Rome, Italy, 2015. [Google Scholar]
  34. Edwards, K.; Zierholz, C. Soil Formation and erosion rates. In Soils-Their Properties and Management, 3rd ed.; Charman, P.E.V., Murphy, B.W., Eds.; Oxford University Press: Melbourne, Australia, 2007. [Google Scholar]
  35. Gray, J.; Chapman, G.; Murphy, B. Land management within capability: A new scheme to guide sustainable land management within NSW, Australia. Soil Res. 2015, 53, 683–694. [Google Scholar]
  36. Urruty, N.; Tailliez-Lefebvre, D.; Huyghe, C. Stability, robustness, vulnerability and resilience of agricultural systems. A review. Agron. Sustain. Dev. 2016, 36, 15. [Google Scholar] [CrossRef]
  37. Herrick, J.E.; Urama, K.C.; Karl, J.W.; Boos, J.; Johnson, M.-V.V.; Shepherd, K.D.; Hemple, J.; Bestelmeyer, B.T.; Davies, J.; Guerra, J.L.; et al. The global Land-Potential Knowledge System (LandPKS): supporting evidence-based, site-specific land use and management through cloud computing, mobile applications, and crowdsourcing. J. Soil Water Conserv. 2013, 68, 5A–12A. [Google Scholar] [CrossRef]
  38. Herrick, J.E.; Beh, A.; Barrios, E.; Bouvier, I.; Coetzee, M.; Dent, D.; Elias, E.; Hengl, T.; Karl, J.W.; Liniger, H.; et al. The Land-Potential Knowledge System (LandPKS): Mobile apps and collaboration for optimizing climate change investments. Ecosyst. Health Sustain. 2016, 2, e01209. [Google Scholar] [CrossRef]
  39. Kay, B.D. Rates of change of soil structure under different cropping systems. Adv. Soil Sci. 1990, 12, 1–52. [Google Scholar]
  40. Kovac, M.; Murphy, B.W.; Lawrie, J.W. Soil Landscapes of the Bathurst 1:250 000 Sheet. Soil Conservation Service of NSW. Available online: https://catalogue.nla.gov.au/Record/2101230 (accessed on 6 October 2019).
  41. Murphy, B.W.; Lawrie, J.W. Soil Landscapes of the Dubbo 1:250 000 Sheet Report; Department of Land and Water Conservation: Sydney, Australia, 1998; ISBN 0 7313 0369.
  42. Costin, A.B. A Study of the Ecosystems of the Monaro Region of New South Wales; Govt. Printer: Sydney, Australia, 1954. [Google Scholar]
  43. Costin, A.B. Vegetation of high mountains in Australia in relation to land use. Biogeography and Ecology in Australia. Monogr. Biol. 1959, VIII, 427–451. [Google Scholar]
  44. OEH. eSpade: Land and Soil Information Database; NSW Office of Environment and Heritage: Parramatta, NSW, Australia, 2019.
  45. Lorimer-Ward, K.; Badgery, W.; Crean, J.; Murphy, B.; Rawson, A.; Pearson, L.; Simmons, A.; Andersson, K.; Warden, E.; Packer, I.; et al. Bridging the gap between science, economics and policy to develop and implement a pilot Market Based Instrument for soil carbon. In Proceedings of the 22nd International Grassland Congress. Revitalising Grasslands to Sustain our Communities, Sydney, Australia, 15–19 September 2013; Michalk, D.L., Millar, G.D., Badgery, W.B., Broadfoot, K.M., Eds.; NSW Department of Primary Industries and NSW Grassland Society: Sydney, Australia, 2013. [Google Scholar]
  46. Chapman, G.; Gray, J.; Murphy, B.; Atkinson, G.; Leys, J.; Muller, R.; Peasley, B.; Wilson, B.; Bowman, G.; McInnes-Clarke, S.; et al. Assessing the Condition of Soils in NSW, Monitoring, Evaluation and Reporting Program: Soil Condition Central West Region. Soil Condition Lachlan Region; Report for Technical Report Series. State of Catchment Reports. Soil Condition for Central West Region and Lachlan Region; Office of Environment and Heritage: Sydney, Australia, 2011. Available online: https://www.environment.nsw.gov.au/-/media/OEH/Corporate-Site/Documents/Land-and-soil/assessing-condition-soils-nsw.pdf (accessed on 6 October 2019).
  47. Badgery, W.B.; Simmons, A.T.; Murphy, B.W.; Rawson, A.; Andersson, K.; Lonergen, V.E.; van der Ren, R. Relationship between environmental and land use variables on soil C levels at the regional scale in Central NSW, Australia. Soil Res. 2013, 51, 645–656. [Google Scholar] [CrossRef]
  48. Badgery, W.B.; Simmons, A.T.; Murphy, B.W.; Rawson, A.; Andersson, K.O.; Lonergan, V.E. The influence of land use and management on soil carbon levels for crop-pasture systems in Central New South Wales, Australia. Agric. Ecosyst. Environ. 2014, 196, 147–157. [Google Scholar] [CrossRef]
  49. Murphy, B.; Rawson, A.; Badgery, W.; Crean, J.; Pearson, L.; Simmons, A.; Andersson, K.; Warden, E.; Lorimer-Ward, K. Soil carbon science to support a scheme for the payment of changes in soil carbon—lessons and experiences from the CAMBI pilot scheme. In Proceedings of the 5th Joint Australia and New Zealand Soil Science Conference; Burkitt, L., Sparrow, L., Eds.; Australian Society of Soil Science Incorporated: Hobart, Tasmania, 2012; pp. 255–258. [Google Scholar]
  50. Scheibner, E.; Basden, H. Geology of New South Wales–Synthesis–Volume 2. Geological Evolution; Geological Survey of NSW, Geology Memoir; NSW Department of Mineral Resources: Sydney, Australia, 1998; Volume 13. [Google Scholar]
  51. Murphy, B.W.; Crawford, M.H.; Duncan, D.A.; McKenzie, D.C.; Koen, T.B. The use of visual soil assessment schemes to evaluate surface structure in a soil monitoring program. Soil Tillage Res. 2013, 127, 3–12. [Google Scholar] [CrossRef]
  52. Brennan, J.P.; Bialowas, A. Changes in Characteristics of NSW Wheat Varieties, 1965–1997; Economic Research Report No. 8; NSW Agriculture: Wagga, Australia, 2001.
  53. Harris, F.; Matthews, P.; Burch, D. Optimising grain yield of wheat in southern NSW. West Wyalong GRDC Grains Research Update; Convened by ORM Pty Ltd. July 2018; Australian Grains Research and Development Corporation (GRDC): Canberra, Australia, 2018. [Google Scholar]
  54. GRDC. National Variety Trials on line. Grains Research and Development Corporation: Canberra, Australia, 2018. Available online: https://app.nvtonline.com.au (accessed on 6 October 2019).
  55. DPI. Central West Region Pilot Area. Cropping Profile. Fact Sheet No3. September 2012. New South Wales Department of Primary Industries; PUB12/43; The Department of Primary Industries: Orange, Australia, 2012.
  56. Donald, G. Analysis of Feed-base Audit. Meat & Livestock Australia Limited. Locked Bag 991. North Sydney NSW 2059; Meat and Livestock Australia: Orange, Australia, 2012. [Google Scholar]
  57. DPI. Central West Region Pilot Area. Agriculture Profile. Fact Sheet No1. September 2012. New South Wales Department of Primary Industries; PUB12/19; The Department of Primary Industries: Orange, Australia, 2012.
  58. DPI. Central West Region Pilot Area. Beef Profile. Fact Sheet No2. September 2012. New South Wales Department of Primary Industries; PUB12/24; Department of Primary Industries: Orange, Australia, 2012.
  59. DPI. Central West Region Pilot Area. Sheep meat Profile. Fact Sheet No4. September 2012. New South Wales Department of Primary Industries; PUB12/37; The Department of Primary Industries: Orange, Australia, 2012.
  60. DPI. Central West Region Pilot Area. Wool Profile. Fact Sheet No5. September 2012. New South Wales Department of Primary Industries; PUB12/39; The Department of Primary Industries: Orange, Australia, 2012.
  61. Badgery, W.; Crean, J.; Murphy, B.; Rawson, A.; Simmons, A.; Trengrove, D.; Lorimar-Ward, K. Soil carbon market-based instrument pilot demonstrates higher than expected soil carbon sequestration. In Proceedings of the National Conference, Canberra, Australia, November 2018; Hulugalle, N., Biswas, T., Greene, R., Bacon, P., Eds.; Soil Science Australia: Bridgewater, SA, Australia, 2018. [Google Scholar]
  62. Elliott, G.L.; Loughran, R.J.; Packer, I.; Maliszewski, L.T.; Curtis, S.J.; Saynar, M.J.; Morris, C.D.; Epis, R.B. A National Reconnaissance Survey of Soil Erosion of Australia. New South Wales; Soil Conservation Service of New South Wales: Sydney, Australia, 1997; ISBN 07259 0082 X. [Google Scholar]
  63. Edwards, K. Runoff and soil loss studies in New South Wales. National Soil Conservation Program; Technical Handbook No 10; Soil Conservation Service of New South Wales: Sydney, Australia, 1987. [Google Scholar]
  64. Murphy, B.W.; Flewin, T. Measured rates of erosion after a period of rainfall on a structurally degraded, sandy loam surface soil. Aust. J. Soil Res. 1993, 31, 419–436. [Google Scholar] [CrossRef]
  65. Hairsine, P.; Murphy, B.; Packer, I.; Rosewell, C. Profile of erosion from a major storm in the south east cropping zone. Aust. J. Soil Water Conserv. 1993, 6, 50–55. [Google Scholar]
  66. MI. The Snowy Mountains Scheme and the Murrumbidgee Irrigation Area. Murrumbidgee Irrigation, Griffith, NSW, Australia. 2016. Available online: www.mirrigation.com.au (accessed on 6 October 2019).
  67. Snowyhydro. The Scheme. Snowy Hydro Limited—Main Office Monaro Highway Cooma NSW, Australia 2630. 2018. Available online: https://www.snowyhydro.com.au/contact-us/ (accessed on 6 October 2019).
  68. Domicelj, S. The Australian Snowy Mountains Scheme—National Growth and Regional Development. Habitat Int. 1980, 5, 601–616. [Google Scholar] [CrossRef]
  69. Meyer, W.S. The Irrigation Industry in the Murray and Murrumbidgee Basins; CRC for Irrigation Futures Technical Report No. 03/05; CSIRO: Canberra, Australia, 2005. [Google Scholar]
  70. Kirby, M. Irrigation. In Water: Science and Solutions for Australia; Prosser, I.P., Ed.; CSIRO Publishing: Collingwood, Victoria, Australia, 2011; Chapter 8. [Google Scholar]
  71. AER. State of the Energy Market 2018; Australian Energy Regulator: Melbourne, VIC, Australia, 2018. [Google Scholar]
  72. TRA. Regional Profiles. Snowy Mountains. Tourism Research Australia. Austrade, Australian Government. 2018. Available online: https://www.tra.gov.au/Regional/tourism-regional-profiles (accessed on 6 October 2019).
  73. Hope, G.; Nanson, R.; Jones, P. Peat-Forming Bogs and Fens of the Snowy Mountains of New South Wales; Technical Report; New South Wales Office of Environment and Heritage: Sydney, Australia, 2012. [Google Scholar]
  74. Costin, A.B.; Hallsworth, E.G.; Woof, M. Studies in Pedogenesis in New South Wales. III. The Alpine Humus Soils. J. Soil Sci. 1952, 3, 190. [Google Scholar] [CrossRef]
  75. Fenton, G.; Helyar, K. Soil acidification. In Soils Their Properties and Management, 3rd ed.; Charman, P.E.V., Murphy, B.W., Eds.; Oxford University Press: Victoria, Australia, 2007. [Google Scholar]
  76. Upjohn, B.; Fenton, G.; Conyers, M. Soil Acidity and LIMINg. Agfact AC.19, 3rd ed.; New South Wales Department of Primary Industries: Orange, Australia, 2005. [Google Scholar]
  77. Tuteja, N.K.; Beale, G.; Dawes, W.; Vaze, J.; Murphy, B.; Barnett, P.; Rancic, A.; Evans, R.; Geeves, G.; Rassam, D.W.; et al. Predicting the effects of landuse change on water and salt balance—A case study of a catchment affected by dryland salinity in NSW, Australia. J. Hydrol. 2003, 283, 67–90. [Google Scholar] [CrossRef]
  78. Moore, C.L.; Jenkins, B.R.; Cowood, A.L.; Nicholson, A.; Muller, R.; Wooldridge, A.; Cook, W.; Wilford, J.R.; Littleboy, M.; Winkler, M.; et al. Hydrogeological Landscapes framework: a biophysical approach to landscape characterisation and salinity hazard assessment. Soil Res. 2018, 56, 1–18. [Google Scholar] [CrossRef]
  79. Stockmann, U.; Minasny, B.; McBratney, A.B. How fast does soil grow? Geoderma 2014, 216, 48–61. [Google Scholar] [CrossRef]
  80. Rosewell, C.J. SOILOSS. A Program to Assist in the Selection of Management Practices to Reduce Erosion, 2nd ed.; Technical Handbook No11; Department of Conservation and Land Management: Sydney, Australia, 1993.
  81. Stiling, P. Ecology: Theories and Applications; Prentice Hall: Upper Saddle Rive, NJ, USA, 1996. [Google Scholar]
  82. Murphy, B.W. Impact of soil organic matter on soil properties—A review with emphasis on Australian soils. Soil Res. 2015, 53, 605–635. [Google Scholar] [CrossRef]
  83. Unkovitch, M.; Baldock, J.; Forbes, M. Variability in Harvest Index of grain crops and potential significance for carbon accounting: Examples from Australian Agriculture. Adv. Agron. 2010, 105, 173–219. [Google Scholar]
  84. Worboys, G.L.; Good, R.B.; Spate, A. Caring for Our Australian Alps Catchments: A Climate Change Action Strategy for the Australian Alps to Conserve the Natural Condition of The Catchments and To Help Minimise Threats to High Quality Water Yields; Australian Alps Liaison Committee, Department of Climate Change and Energy Efficiency: Canberra, Australia, 2011.
  85. Morand, V. Geology of the Australian Alps. Australian Alps National Parks. Education Resource, Geology. 2011. Available online: https://theaustralianalps.wordpress.com/the-alps-partnership/education/geology/ (accessed on 6 October 2019).
  86. Mason, R. Soils of the Australian Alps. Australian Alps National Parks. Education Resource. 2013. Available online: https://theaustralianalps.files.wordpress.com/2013/11/soils.pdf (accessed on 6 October 2019).
  87. DOE. National Recovery Plan for the Alpine Sphagnum Bogs and Associated Fens Ecological Community; Department of the Environment: Canberra, Australia, 2015.
  88. Hope, G.S.; Nanson, R.A. Peatland carbon stores and fluxes in the Snowy Mountains, New South Wales, Australia. Mires Peat 2015, 15, 11. Available online: http://www.mires-and-peat.net/ (accessed on 6 October 2019).
  89. Yang, X.; Yu, B. Modelling and mapping rainfall erosivity in New South Wales, Australia. Soil Res. 2015, 53, 178–189. [Google Scholar] [CrossRef]
  90. Zhu, Q.; Yang, X.; Fei, J.; Liu, D.L.; Yu, Q. Extreme rainfall, rainfall erosivity and hillslope erosion in Australian Alpine region and their future changes. Int. J. Climatol. 2019, 2371–4626. [Google Scholar] [CrossRef]
  91. Yang, X. Digital mapping of RUSLE slope length and steepness factor across New South Wales, Australia. Soil Res. 2015, 53, 216–225. [Google Scholar] [CrossRef]
  92. Costin, A.B.; Wimbush, D.J.; Kerr, D.; Gay, L.W. Studies in Catchment Hydrology in the Australian Alps I. Trends in Soils and Vegetation; Division of Plant Industry Technical Paper No. 13; CSIRO: Melbourne, Australia, 1959. [Google Scholar]
  93. Johnston, S. Function and Sustainability of Australian Alpine Ecosystems: Studies in the Tall Alpine Herbfield, Kosciuszko National Park. Ph.D. Thesis, The Australian National University, Canberra, Australia, 2007, unpublished. [Google Scholar]
  94. Durham, L.J. Indicators of land deterioration in Snowy Mountains Catchments. J. Soil Conserv. Serv. New South Wales 1959, 15, 251–276. [Google Scholar]
  95. Keith, H.; Mackey, B.G.; Lindenmayer, D.B. Re-evaluation of forest biomass carbon stocks and lessons from the world’s most carbon-dense forests. Proc. Natl. Acad. Sci. USA 2009, 106, 11635–11640. [Google Scholar] [CrossRef] [PubMed]
  96. Wild, A.E.R. The helicopter and soil conservation in the alpine areas of the Snowy Mountains. J. Soil Conserv. Serv. New South Wales 1980, 36, 72–76. [Google Scholar]
  97. Clothier, D.P.; Condon, R.W. Soil conservation in alpine catchments. J. Soil Conserv. Serv. New South Wales 1968, 24, 96–113. [Google Scholar]
  98. Bryant, W.G. Problems of pant introduction for alpine and sub-alpine revegetation, Snowy Mountains. J. Soil Conserv. Service New South Wales 1971, 27, 209–226. [Google Scholar]
  99. Snowyhydro. Water report for 2014–2015. Snowy Hydro Limited—Main Office Monaro Highway Cooma NSW, Australia 2630. 2015. Available online: https://www.snowyhydro.com.au/our-energy/water/water-reports (accessed on 6 October 2019).
  100. Morland, R.T. Erosion survey of the Hume Catchment Area. J. Soil Conserv. Serv. NSW 1959, 15, 208–226. [Google Scholar]
  101. Good, R.B. Kosciusko Heritage—The Conservation Significance of Kosciusko National Park; National Parks and Wildlife Service and Surrey Beatty & Sons: Sydney, Australia, 1992; 194p. [Google Scholar]
  102. Costin, A.B.; Wimbush, D.J.; Kerr, D. Studies in catchment hydrology in the Australian Alps. II. Surface run-off and soil loss. Technical Paper Division of Plant Industry CSIRO Australia No. 14. 1960. [Google Scholar]
  103. Durham, L.J. Soil erosion problems in the Snowy Mountains Area. J. Soil Conserv. Serv. New South Wales 1956, 12, 121–131. [Google Scholar]
  104. Robertson, G.; Wright, J.; Brown, D.; Yuen, K.; Tongway, D. An Assessment of Feral Horse Impacts on Treeless Drainage Lines in the Australian Alps; The Australian Alps National Parks Co-operative Management Program; New South Wales Office of Environment and Heritage: Sydney, Australia, 2015. [Google Scholar]
  105. Crabb, P. Managing the Australian Alps: A History of Cooperative Management of the Australian Alps National Parks; Australian Alps Liaison Committee and Australian National University: Canberra, Australia, 2003.
  106. Bryant, W.G. The effect of grazing and burning on a mountain grassland, Snowy Mountains, New South Wales. J. Soil Conserv. Serv. N.S.W. 1973, 29, 1. [Google Scholar]
  107. Good, R. Australian Alps Rehabilitation Manual—A Guide to Ecological Rehabilitation in the Australian alps; Australian Alps Liaison Committee: Australian Alps Natural Heritage Working Group; Australian Alps National Parks; New South Wales Office of Environment and Heritage: Sydney, Australia, 2006. [Google Scholar]
  108. Bryant, W.G. Vegetation and ground cover trends--following the exclusion of stock at three sites in the Snowy Mountains. J. Soil Conserv. Serv. N.S.W. 1969, 25, 183–198. [Google Scholar]
  109. Clarke, P.J.; Keith, D.A.; Vincent, B.E.; Letten, A.D. Post-grazing and post-fire vegetation dynamics: Long-term changes in mountain bogs reveal community resilience. J. Veg. Sci. 2015, 26, 278–290. [Google Scholar] [CrossRef]
  110. Good, R.; Johnson, S. Rehabilitation and revegetation of the Kosciuszko summit area, following the removal of grazing—An historic review. Ecol. Manag. Restor. 2019, 13–20. [Google Scholar] [CrossRef]
  111. Grover, S.P.P.; Baldock, J.A.; Jacobsen, G.E. Accumulation and attrition of peat soils in the Australian Alps: Isotopic dating evidence. Austral Ecol. 2012, 37, 510–517. [Google Scholar] [CrossRef]
  112. Grover, S.P.P.; McKenzie, B.M.; Baldock, J.A.; Papst, W.A. Chemical characterisation of bog peat and dried peat of the Australian Alps. Aust. J. Soil Res. 2005, 43, 963–971. [Google Scholar] [CrossRef]
Figure 1. Facets of soil and land capability.
Sustainability 11 05706 g001
Figure 2. The Cowra Trough Red Soils in Central West New South Wales. Source: Mark Young, Environment Protection Science, New South Wales Office of Environment and Heritage.
Sustainability 11 05706 g002
Figure 3. Snowy Mountains Alpine Soils. Source: Mark Young, Environment Protection Science, New South Wales Office of Environment and Heritage.
Sustainability 11 05706 g003
Table 1. Global challenges and soil security [1,2,16].
Food securitySituation when all people at all times have access to sufficient safe, nutritious food to maintain a healthy and active life [2]
Water securityThe capacity of a population to safeguard access to adequate quantities of acceptable quality water for sustaining livelihoods, human well-being and socio-economic development [2].
Energy securityThe continuous availability of energy in various forms in sufficient quantities at reasonable prices.
Climate change abatement and mitigationSoil acts as a pool of carbon and changes in the soil carbon, especially the soil organic carbon can affect greenhouse gas emissions and sequestration. It is also a pool of active nitrogen (nitrates, ammonia, nitrous oxide) and soil management can affect the emission of greenhouse gases associated with active nitrogen [25].
BiodiversitySoil has a large biodiversity pool itself and soil is also a critical component in the broader natural ecosystems, such as plant communities.
Human healthImprove life expectancy, quality of life and human well-being—nutrition, prevent exposure to toxic compounds, disease prevention, cultural activities.
Table 2. The dimensions of soil security adapted from References [1,2,16,22].
Soil capabilityAbility of a soil to function “What can a soil do?” Requires a reference state that defines the optimum ability of the soil to function (genoform). It also depends on how the soil condition changes with the pressures imposed on the soil by land management.
Soil conditionCurrent state of the soil and the ability of the soil to function in that state. The soil condition, and hence its ability to function, will change with pressures imposed by land management (phenoform).
Soil natural capitalMonetary value of the soil asset, assessed by the capacity of the soil to provide goods and services that satisfy human needs, directly or indirectly.
ConnectivityKnowledge and capacity networks about implementing land management practices and soil security—development pathways, technology transfer, extension networks, public awareness.
CodificationGovernment policy and regulation that influences land management options and soil security—land tenure, subsidies, tariffs/import duties and regulation, programs such as the Global Soil Partnership, national parks, etc.
Table 3. Soil landscapes that comprise the Cowra Trough Red Soils in Central West New South Wales.
Soil LandscapeMajor Soils *Geology/Parent MaterialsLandform/SlopeLand UseTopsoilSubsoilReference
CurumbenyaRed ChromosolsCanowindra PorphyryRolling low hills Mean of 9% slope 200–700 m long.Cropping and grazingFSL to SCL
pHwater 6.5–7.0
15 cm deep
CL to LC
pHwater 6.0–6.5
[40,41,44]
ArthurvilleRed ChromosolsPalaeozoic sediments of the Cowra TroughUndulating rises and low hills
2–6% slopes,
1500–3000 m long
Cropping and grazingFSL
pHwater 7.0
30 cm deep
MC
pHwater 8.0
[41,44]
CanowindraRed ChromosolsPalaeozoic sediments of the Cowra TroughUndulating rises and low hills
2–8% slopes,
360–570 m long
Cropping and grazingSL—FSL
pHwater 6.0–8.0
20 cm deep
SCL—LMC
pHwater 6.5–7.5
[40,44]
ManildraRed ChromosolsPalaeozoic sediments of the Cowra TroughUndulating low hills
6–10% slopes,
300–600 m long
Cropping and grazingSL—LFS
pHwater 6.0–7.5
45 cm deep
CL—MC
pHwater 6.5–8.0
[40,41,44]
Cowra Red ChromosolsCowra Granite (granodiorite)Undulating to rolling low hills
8–20%
340–600 m long
Cropping and grazingSL
pHwater 6.0
30 cm deep
SCL—MC
pHwater 6.5–8.0
[40,44]
* Isbell, RF. (2016). The Australian Soil Classification. Second Edition. (CSIRO Publishing, Melbourne).
Table 4. Soil Capability Facet I. Capacity to provide ecosystems services to meet global challenges for the Cowra Trough Red Soils from Central West New South Wales and the Kosciusko National Park of the Snowy Mountains of south eastern Australia.
Global Challenges
Food SecurityWater SecurityEnergy SecurityHuman Health/WelfareClimate Change AbatementBiodiversity
Cowra Trough Red SoilsHigh
Cropping often in rotation with pastures [40,41]
Yield-average [52,53,54]
Wheat 3.9 t/ha
Canola 1.83 t/ha
Value of production (2012)
Crops $83 million/year
Beef $59 million/year
Sheep meat $31 million/year
Wool $45 million/year
[55,57,58,59,60]
Low
Tributary to Lachlan River
MinimalLowLow to moderate
Potential to sequester organic carbon:
0.37 to 1.10 t/ha/year with changes in agricultural practices.
[45,46,47,48,49,61]
Low
Snowy Mountains Alpine SoilsMinimal
Note the value of agricultural production from irrigation water delivered from Snowy is estimated at $ 3 billion/year.
[66,67,68,69,70]
Very high
Capacity to deliver 2300 GL of water annually to plains of the Murray and Murrumbidgee Rivers [67,68,70,71]
Value of agricultural production (2018).
$3 billion/year
[66,67,68,69,70]
High
Generating capacity from hydroelectric power is 4500 MWh electricity per year (2018)
[67,68,71]
High
1.25 million visitors to Kosciusko National Park in 2015.
Value estimated at $481 million.
[72]
Low to moderate
Peat bogs and Sphagnum bogs store organic carbon
(≈ 200 tC/ha)
[42,73,74]
Moderate to high
Many unique species of plants and fauna.
[42,43]
Table 5. Facets of soil capability for the Cowra Trough Red Soils from Central West New South Wales, south eastern Australia. Response to land degradation processes.
Response to Land Degradation Processes
Water ErosionWind ErosionSoil AcidificationSoil Organic Carbon DeclineSalinizationNutrient Decline
Facet IIA
Land degradation pressure
Moderate to high risk
USLE predicts long term average soil loss under conventional tillage ≈ 9.2 t/ha/year
≈ 0.5 mm/year [64]
Specific events resulted in soil loss of 342 t/ha and 78 t/ha [64,65]
Low to minimal risk.Moderate to high risk
Predicted acidification pressure based on crop/legume pasture rotation ≈
250 to 300 kg/ha/year.
[75,76]
Moderate risk
Loss of soil organic carbon (SOC) from native vegetation to cropping/pasture rotation ≈40% to 50%
[47,48,61]
Low to moderate risk
Conversion of native vegetation to cropping/pasture can change hydrology of catchments resulting in rising water tables and activating salt stores.
[77,78]
High-risk
Natural levels of nutrients, especially N and P low and rapidly diminished under agriculture. Agricultural products can remove nutrients from landscape.
Facet IIB
Robustness of the soil condition to resist land degradation pressure
Moderate
Deep surface soil (20 to 30 cm) and deep soil profile (>100 cm).
[40,41]
Moderate
Deep surface soil and deep soil profile
Moderate to low buffering capacity in surface soil.
Natural surface pHCaCl about 5.5 to 6.5. Textures loam to sandy loam.
Moderate
Soil organic carbon can decline rapidly under exploitive land management practices.
Textures loam to sandy loam. Conservation agriculture practices required to maintain SOC levels.
[45,46,47,48,49,61]
Low to moderate salt stores and changes in hydrology do not result in large amounts of mobilisation of salt in the landscape. Minor, localised areas of salinity in some depressions. Does not add high salt loads to streams.
[77,78]
Moderate
Standard additions of nutrients under agricultural production using legume rotations and additions of industrial fertiliser to restore nutrient levels. Some use of organic amendments as fertiliser.
Facet III
Capacity to recover after degradation
New soil formation is slow [79,80].
Surface soil erosion can expose subsoils that can regenerate slowly to give surface soil.
Plant growth can rehabilitate soils.
See water erosionNatural recovery from acidification very slow but can be enhanced by additions of lime.
[75,76]
Moderate rate of recovery by plant growth.
Relatively high net primary productivity (NPP)
≈3 to 6 tC/ha/year [81]
Altering catchment hydrology to reverse saline outbreaks slow
[77,78]
Nutrient decline can be rapidly recovered by fertilising programs and introduction of legumes into rotations.
Table 6. Soil landscapes and soils that comprise the Kosciusko National Park of south eastern Australia.
LandscapeMajor Soils *Geology/Parent MaterialsType AreaDominant Land UseTopsoilSubsoilReference
Tablelands
600 to 1000 m
Grey and Brown Chromosols.
Small areas of Organosols (mires, peats and bogs) on lower slopes and flow lines.
Paralithic Leptic Rudosols (lithosols) on steep slopes and crests.
Granites and granodiorites
Palaeozoic sediments
Jindabyne
Adaminaby
Grazing, minor croppingSL to SCL
Dark greyish brown to yellowish brown
pH 6.0 to 6.5
15 to 20 cm deep
SC to LC
Greyish brown to yellowish brown
pH 6.0—6.5
50 to 90 cm deep over saprolite
[42,43,86]
Montane
1000 to 1500 m
Yellow Kandosols and Kurosols
Organosols (mires, peats and bogs) on lower slopes and flow lines.
Paralithic Leptic Rudosols (lithosols) on steep slopes and crests.
Granites and granodiorites
Palaeozoic sediments
YarrangobillyGrazingSCL to CL
Greyish yellow brown to brown, some darker colours when higher organic matter
pH 5.0 to 5.5
10 to 20 cm deep
CL to SC to LMC
Yellowish brown to Greyish brown, some reddish brown.
pH 5.0 to 5.5
40 to 100 cm deep
[42,43,86]
Subalpine
1500 to 1800 m
Chernic Tenosols (alpine humus soils and transitional alpine humus soils).
Organosols (mires, peats and bogs) on lower slopes and flow lines. Areas where free water accumulates
Paralithic Leptic Rudosols (lithosols) on steep slopes and crests.
Granites and granodiorites
Palaeozoic sediments
Mount Kosciusko,
Perisher Valley,
Kiandra
National ParkPeaty loam
Black
pH 5.0 to 5.5
20 to 60 cm deep
Loam
Dark greyish brown
pH 5.5—6.0
70 to 90 cm deep over saprolite.
Shallower on steep slopes
[42,43,86]
Alpine
>1800 m
Chernic Tenosols (alpine humus soils and transitional alpine humus soils).
Organosols (mires, peats and bogs) on lower slopes and flow lines. Areas where free water accumulates
Granites and granodiorites
Palaeozoic sediments
Mount Kosciusko, Perisher Valley, Kiandra
Yarrangobilly
National Park
Some grazing
Fibric peat 10 to 70 cm
Hemic and sapric peat 70 to occasionally to 300 cm
pH 4.0 to 5.5
Sandy or clayey peats at 70 to 150 cm common.
pH 5.0 to 6.5
[42,43,86]
* Isbell, RF. (2016). The Australian Soil Classification. Second Edition. (CSIRO Publishing, Melbourne).
Table 7. Facets of soil capability for the soils from the Kosciusko National Park of the Snowy Mountains of south eastern Australia. Response to land degradation processes.
Response Land Degradation Processes
Water ErosionWind ErosionSoil AcidificationSoil Organic Carbon DeclineSalinizationNutrient Decline
Facet IIA
Land degradation pressure
Very high risk
High rainfall and high rainfall erosivity 1500 to 2000 rainfall erosivity units [80,89,90,91].
USLE predicts >20 t/ha from bare soil/low ground cover. [81]
Measured erosion ≈4 to 23 t/ha/year [92,93]
High risk.
Frequent high velocity winds
Frost heave produces loose aggregates susceptible to wind erosion
[42,43,94]
Low to minimal riskVery high risk
Compounded by:
Water and wind erosion riskHigh SOC levels in Organosols (alpine humus soils)
Potential degradation of peat and sphagnum bogs (200 t/ha/100 cm, but up to 2800 tC/ha to 400 cm)
[73,84,88,95]
Very low riskVery high risk
Nutrients associated with vegetation and loss of vegetation mass results in loss of nutrients.
Erosion removes nutrients.
[96,97,98]
Facet IIB
Robustness of the soil condition to resist land degradation pressure
Very low
Shallow soils
Low capacity to replace vegetative growth.
[43,44]
Low NPP:
≈0.9 to 1.4 tC/ha/year [81]
Very low
Shallow soils
Low capacity to replace vegetative growth
Low NPP
≈0.9 to 1.4 tC/ha/year [81]
Not applicableLow
Low capacity for vegetative growth.
Disturbance results in rapid loss of SOM: erosion
Not applicableLow
Nutrients associated with vegetation
Nutrient lost with erosion and destruction of vegetative cover
Facet III
Capacity to recover after degradation
New soil formation is very slow (<1 t/ha/year). Soils shallow over bedrock.
Slow plant growth limits rehabilitation capacity.
Organic soils in swamps and depressions can regenerate slowly.
Low NPP
New soil formation is very slow. Soils shallow over bedrock.
Organic soils in swamps and depressions can regenerate slowly.
Low NPP
Not applicableSlow rate of recovery because of low NPP.
Mires, bogs and peats slow process of recovery
Not applicableNutrients associated with vegetation and recovery of nutrients is very slow.
Low productivity limits available funds under agriculture. Low capacity to apply standard agricultural practices to add nutrients.
[96,97,98]

