Nonuniform Woven Solar Shading Screens: Shading, Mechanical, and Daylighting Performance


Abstract
:1. Introduction
2. Methods
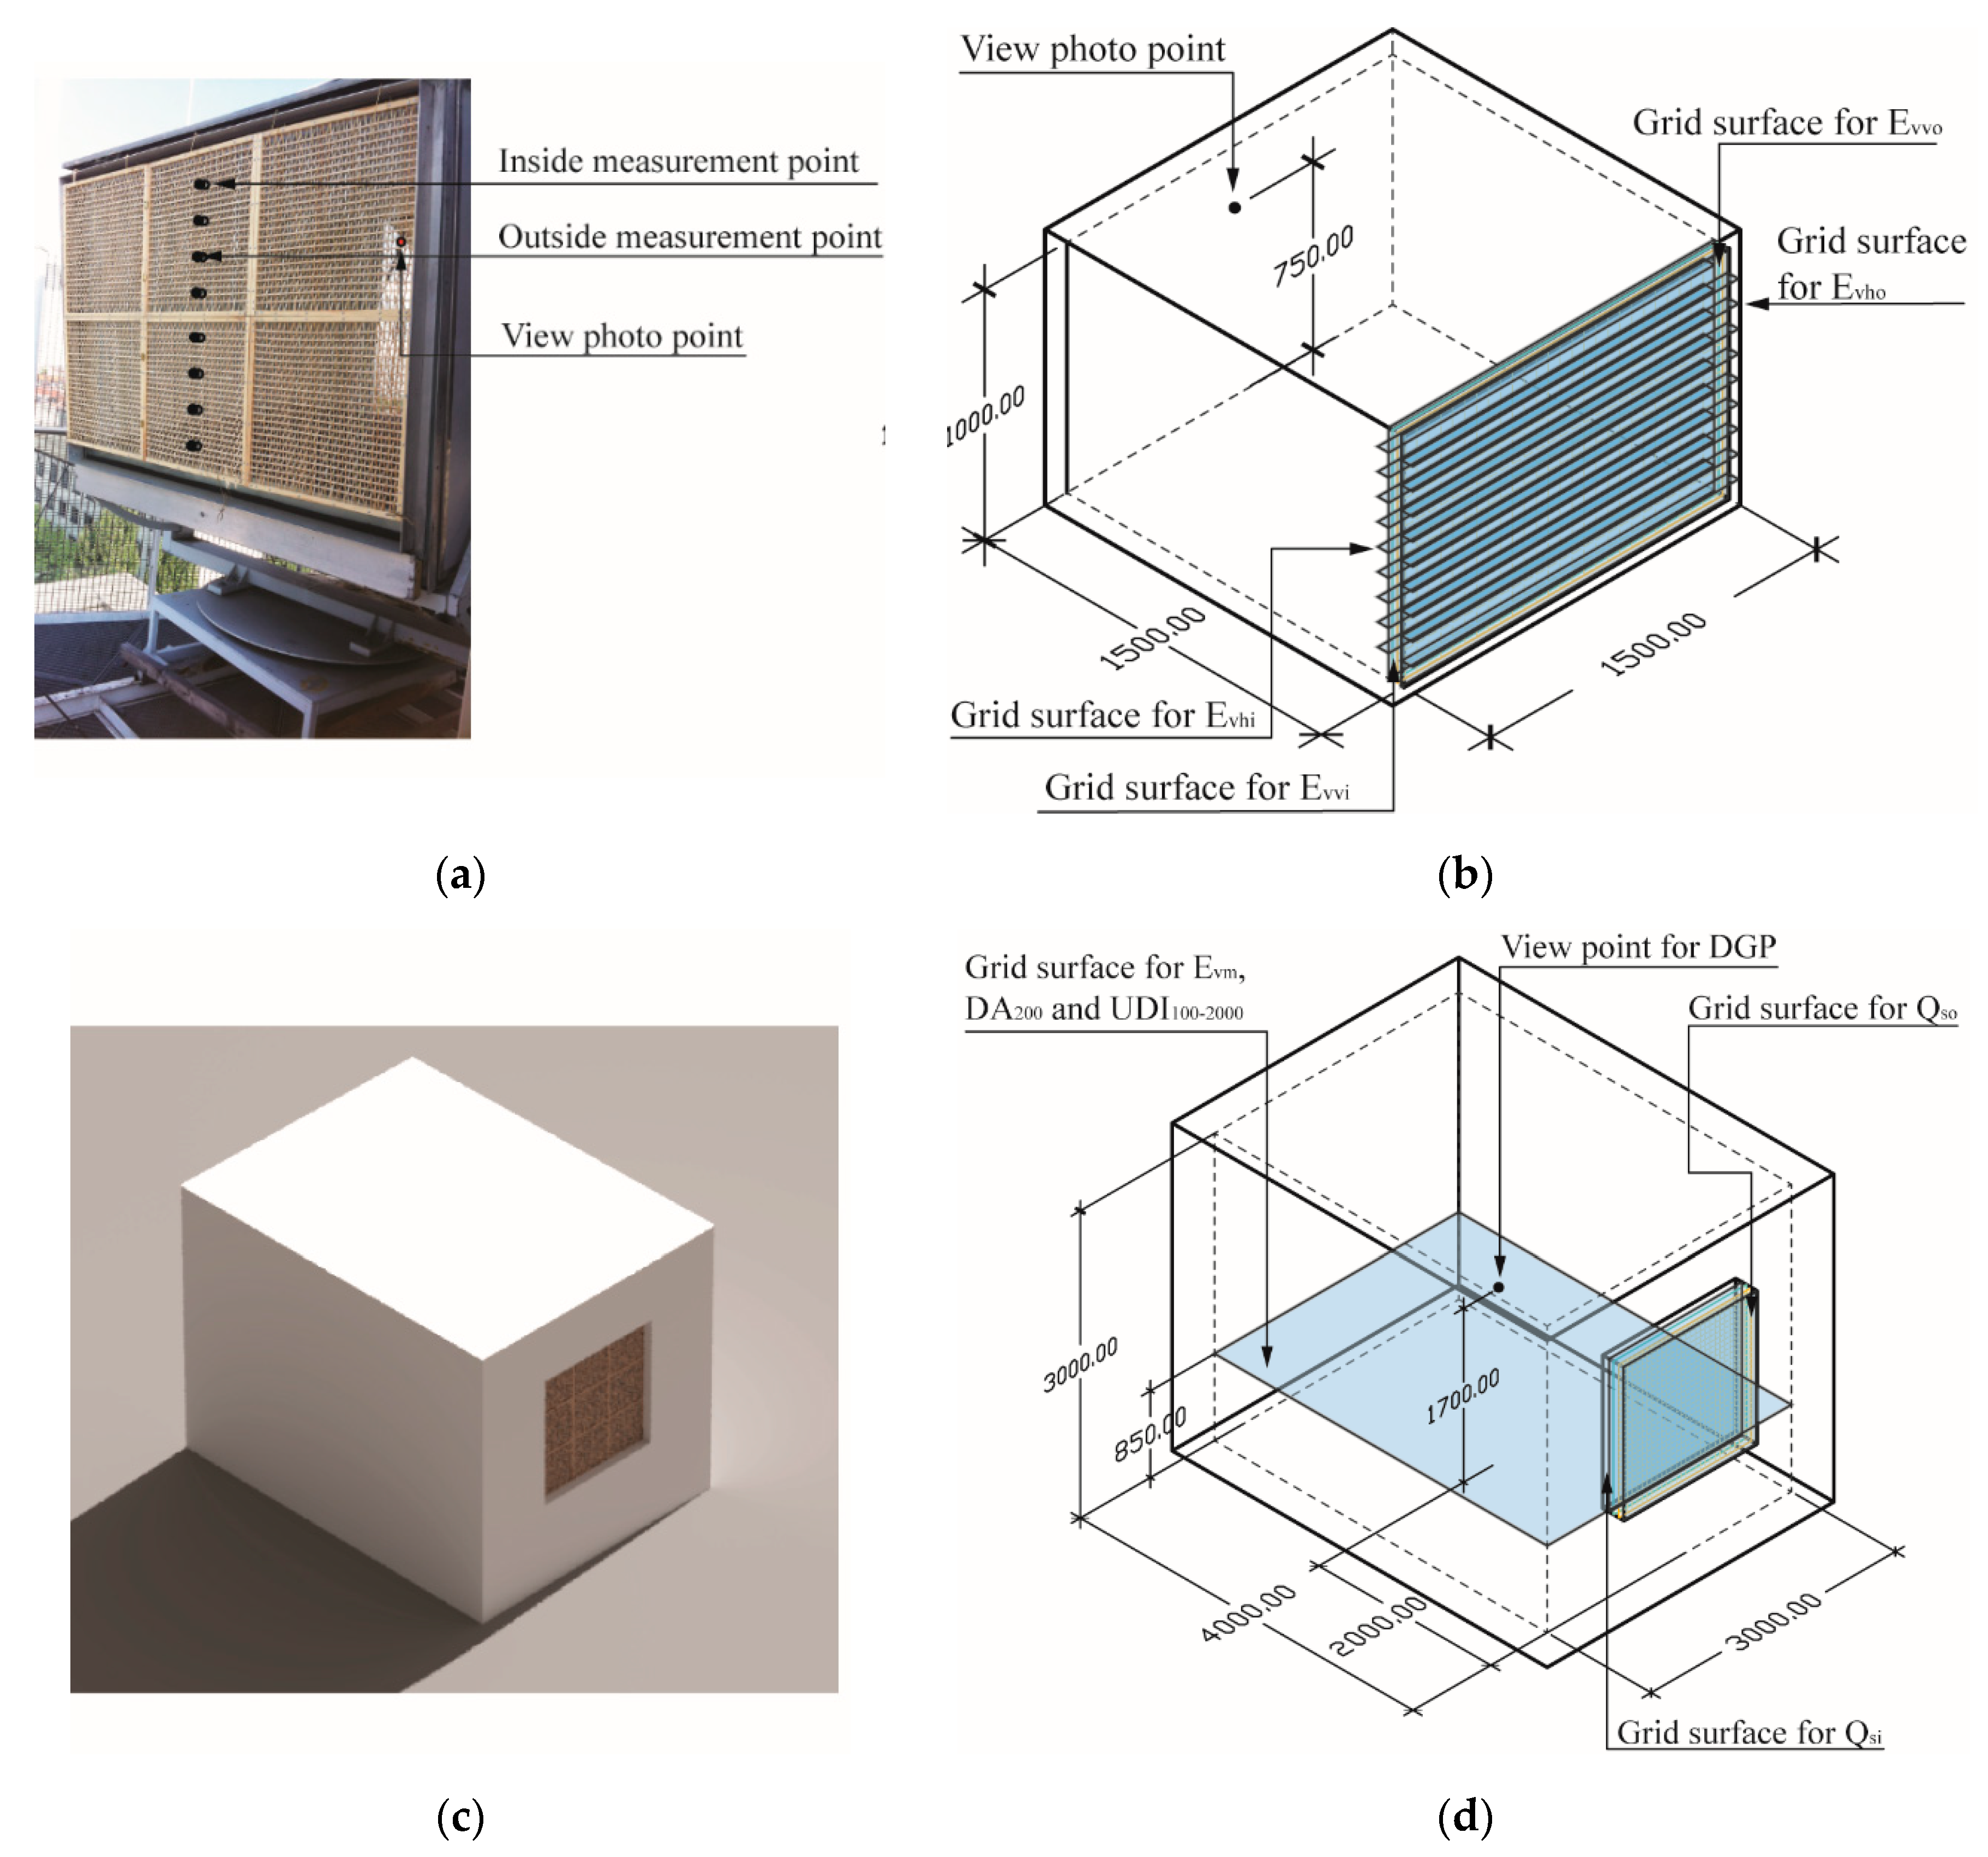
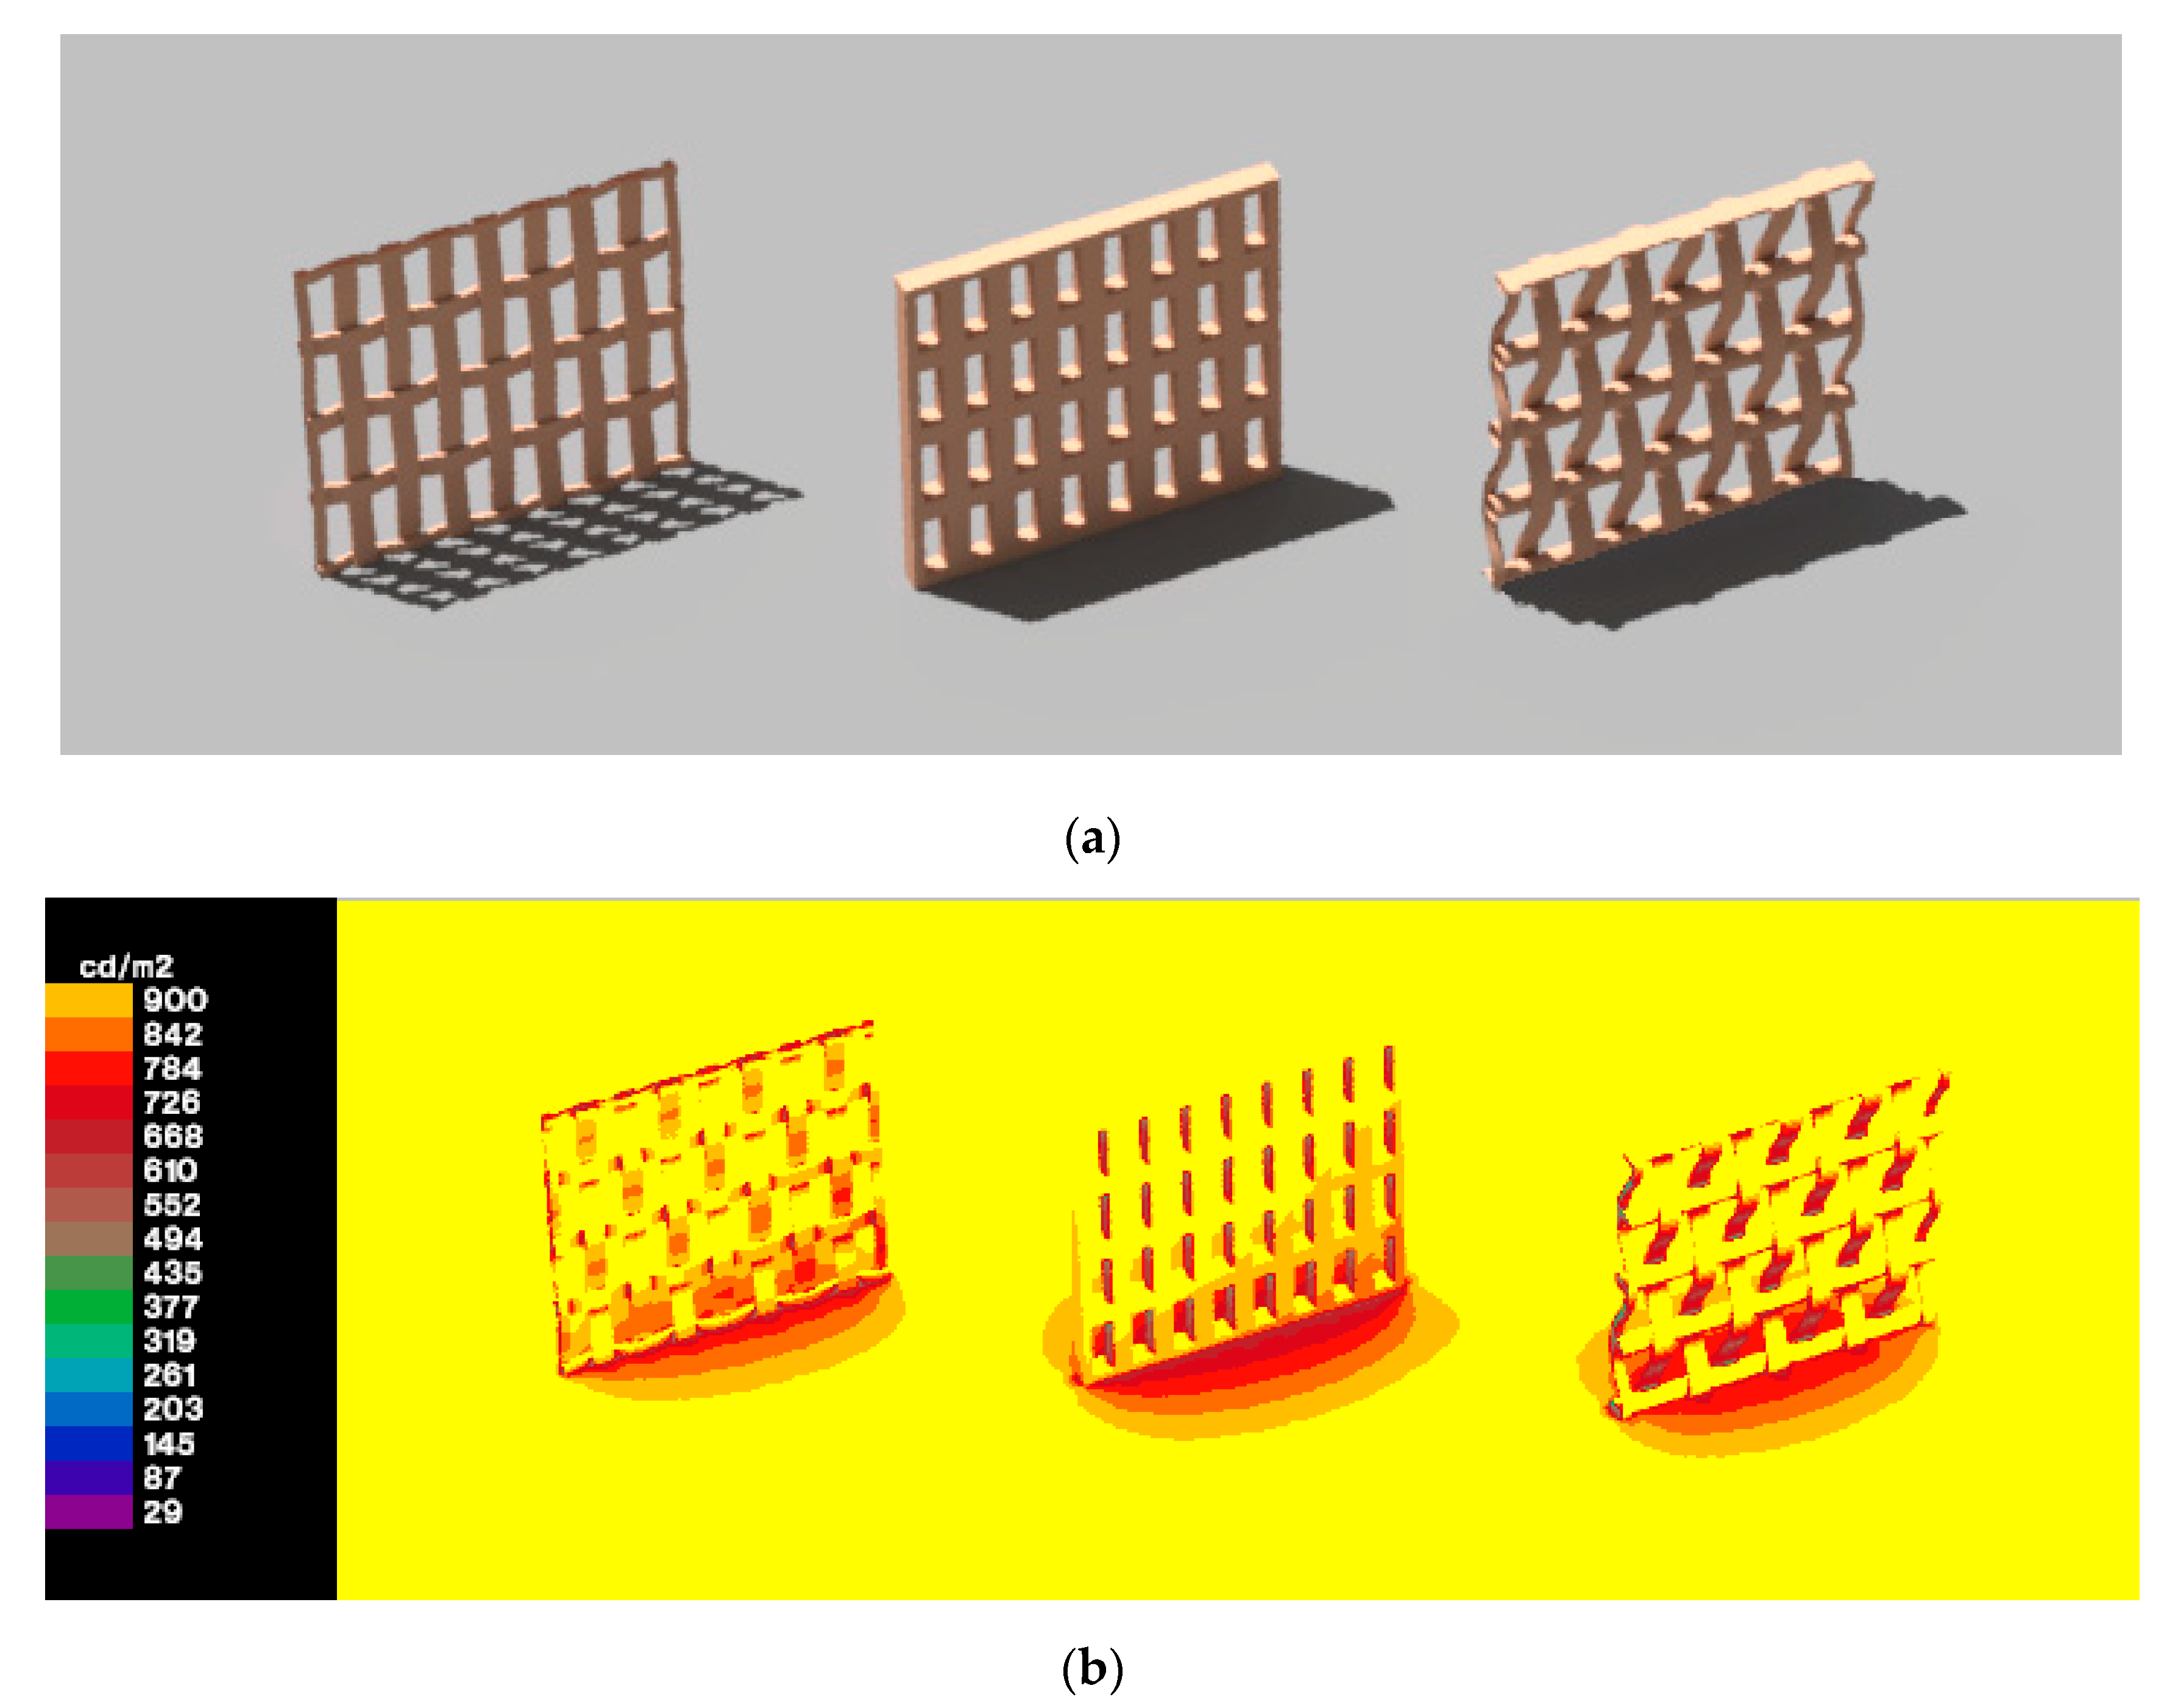
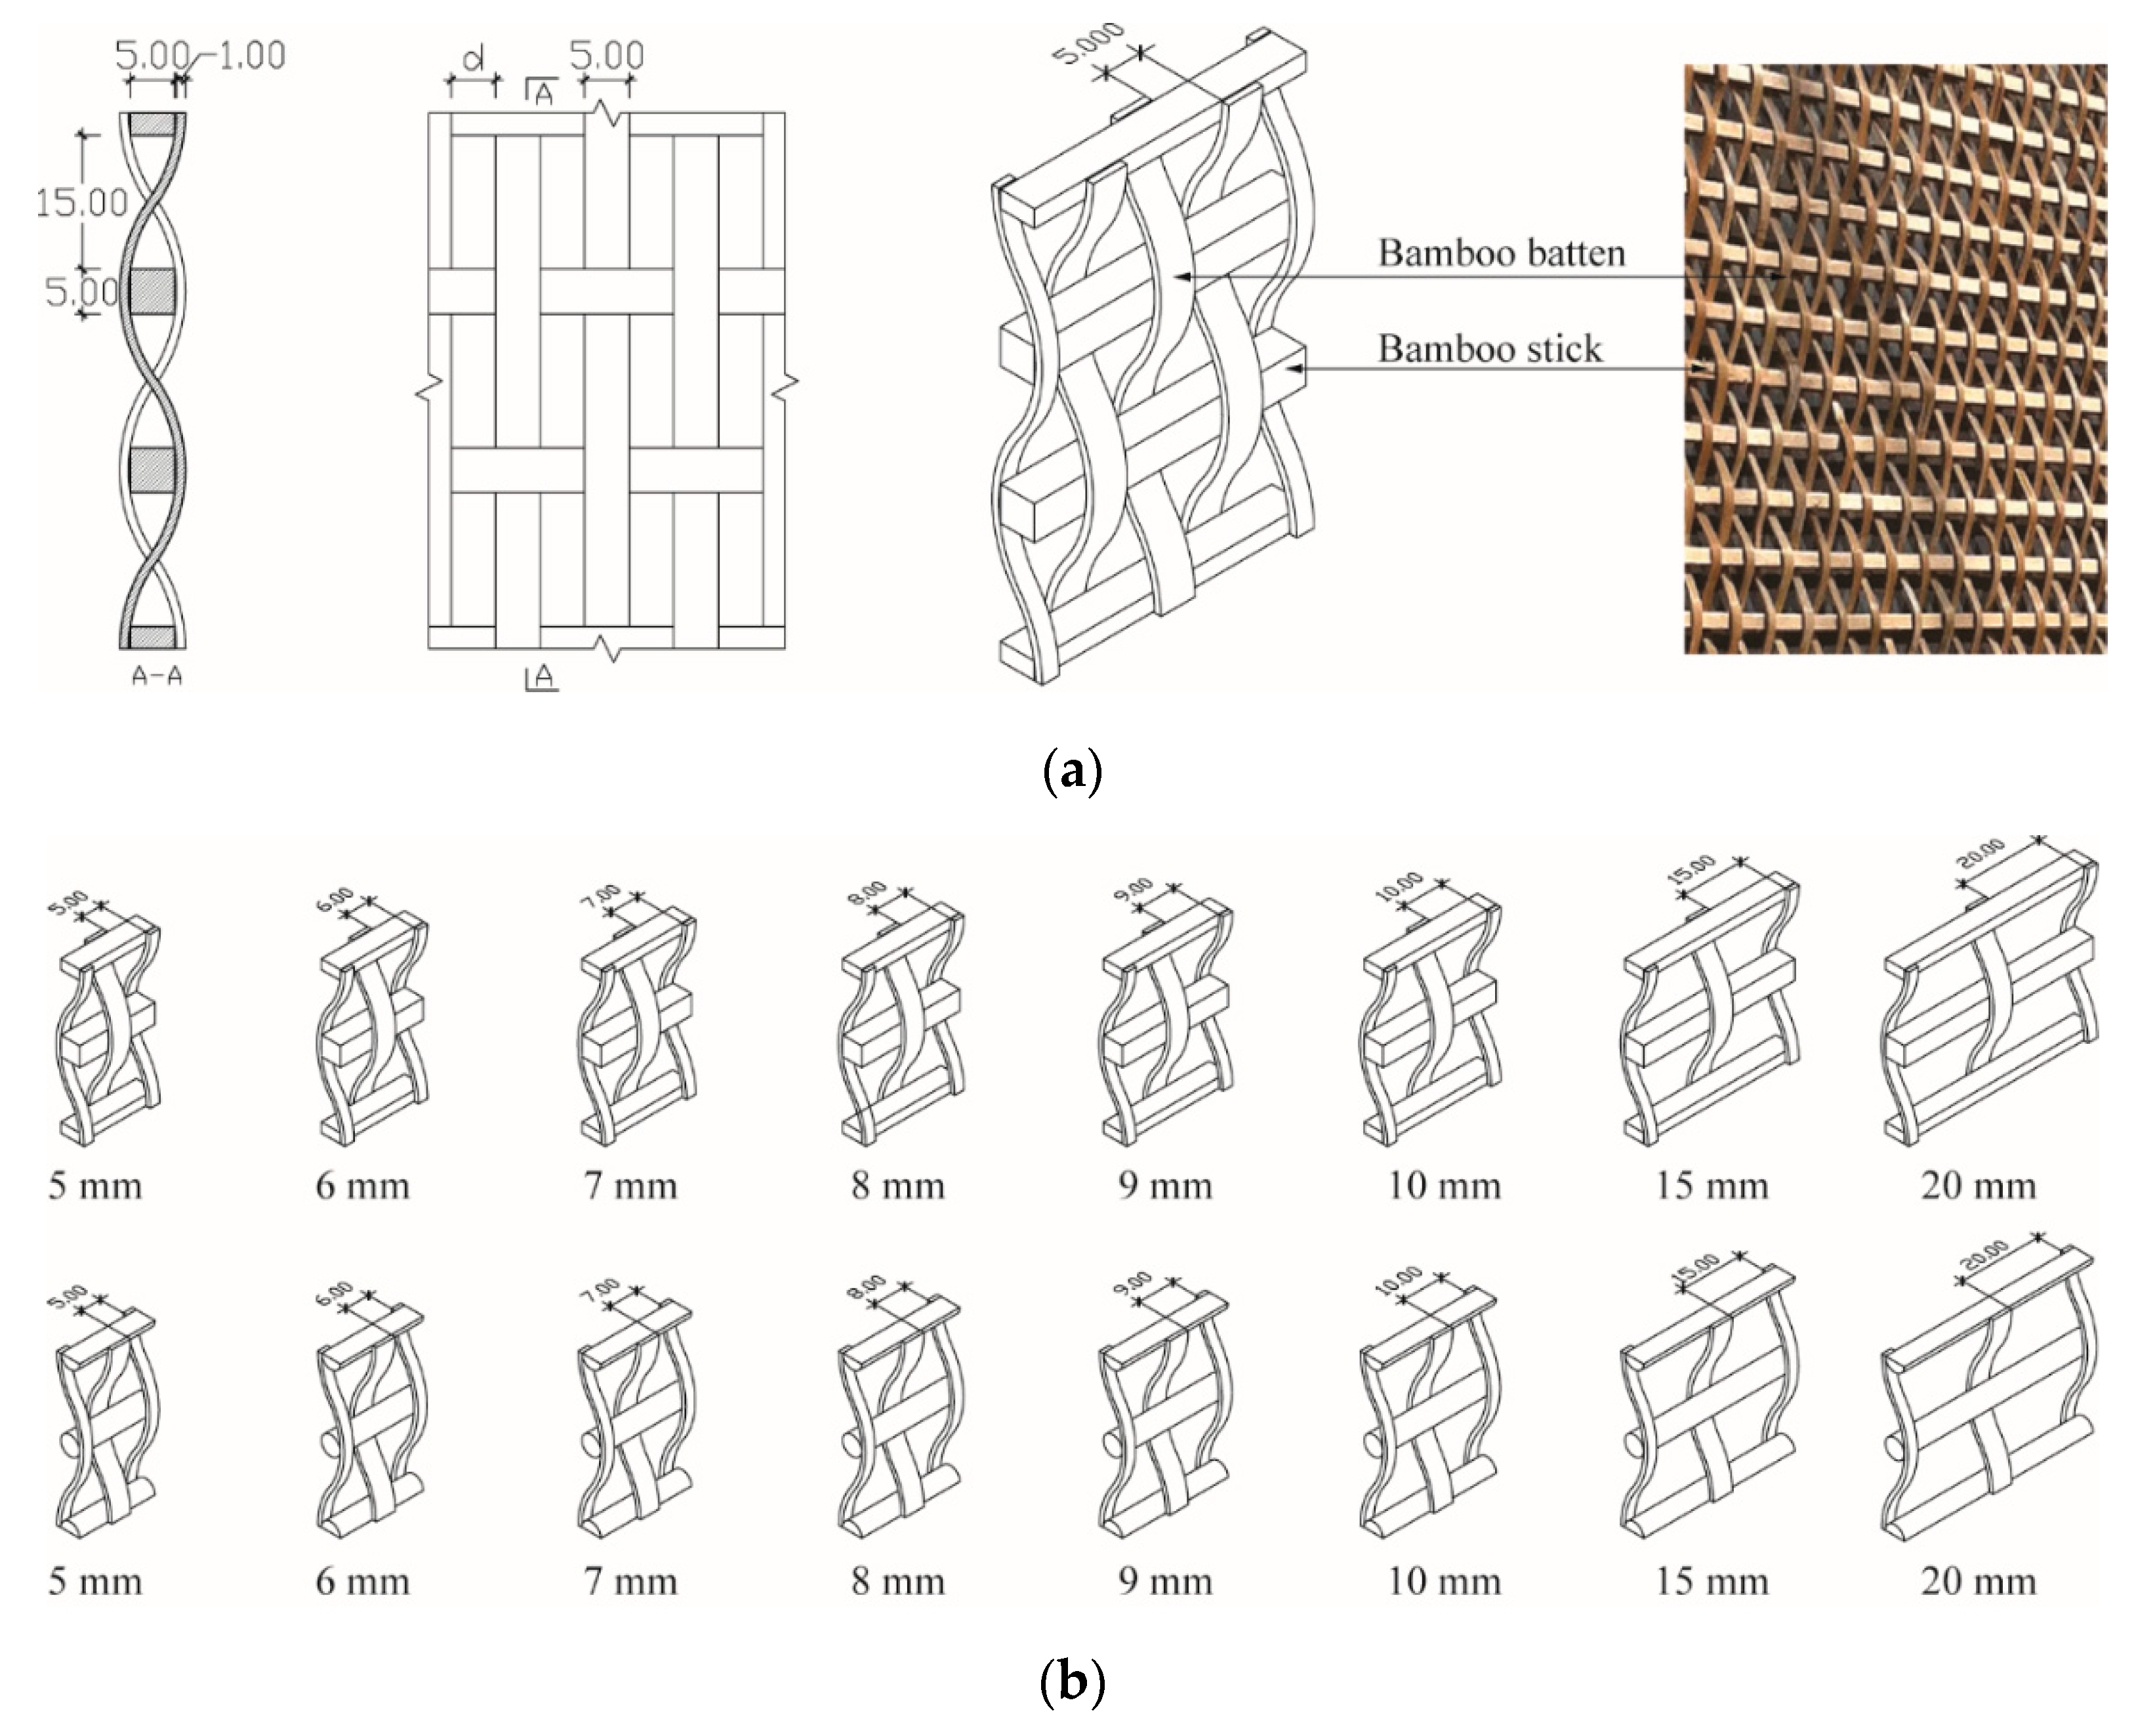
2.1. Study Object
- Step 1: The panel was formed by the battens and square sticks, and the distance between each batten (d) was 5 mm. The raw material of the panel was Phyllostachys pubescens, and its modulus of elasticity, Poisson’s ratio, and density were 9.4432 × 10⁹ Pa, 0.36, and 542 kg/m3, respectively. The maximum tensile strength and compressive strength (σp) along the grain were 1655.2 kg/cm2 and 445.7 kg/cm2, respectively. The safety coefficient (n) was 1.5. Thus, the allowable stress of the panel in this study was σa = σp/n = 297.1 kg/cm2 = 29.71 MPa.
- Step 2: As shown in Figure 2b, panels for the optimization were divided into two groups: panels with square sticks (thickness = 5 mm) and panels with round sticks (diameter = 5 mm). Each group had nine varieties with different d values, which were 5 mm, 6 mm, 7 mm, 8 mm, 9 mm, 10 mm, 11 mm, 15 mm, and 20 mm.
2.2. Evaluation Indicators
- Step 1: Horizontal and vertical visible daylight transmittances (τvh and τvv) in each daylighting hour on 21 June were used to evaluate the daylight access ability. The direct solar radiation transmittance (τsdir) and diffuse solar radiation transmittance (τsdif) were treated separately to assess the solar radiation control property. The indoor daylighting performance was evaluated on the basis of the hourly mean horizontal illuminance (Evm) on 21 June. The indicators used to evaluate glare were the daylight glare probability (DGP) and glare level (GL) at 9:00 and 12:00 on 21 June and 21 September. Four glare levels were classified: imperceptible (DGP < 35%), perceptible (40% > DGP ≥ 35%), disturbing (45% > DGP ≥ 40%), and intolerable (DGP ≥ 45%). A view photograph was used to evaluate the view quality. The evaluation indicators for the mechanical performance were the plane normal deformation and the axial bending stress (σb) of the panel structure under wind loads.
- Step 2: The evaluation indicators for the daylighting performance included the daylight factor (DF) and useful daylight illuminance (UDI100–2000). On the basis of the daylighting standard for residential buildings in China [40], the minimum required DF is 2%; thus, in this study, 2% was selected as the baseline for the daylighting level. The indicator for visual comfort was the annual daylight glare probability (aDGP). The evaluation indicators for solar shading performance were the monthly solar radiation transmittance (τsmon) and the monthly total solar insolation (Qs).
2.3. Study Tools and Simulation Setup
2.3.1. On-Site Experiment in a Test Box in Step 1
2.3.2. Simulations for the Solar Optical Properties of the Solar Screen in Step 1
2.3.3. Simulations for the Daylight and Shading Performance in a Room in Steps 1 and 2
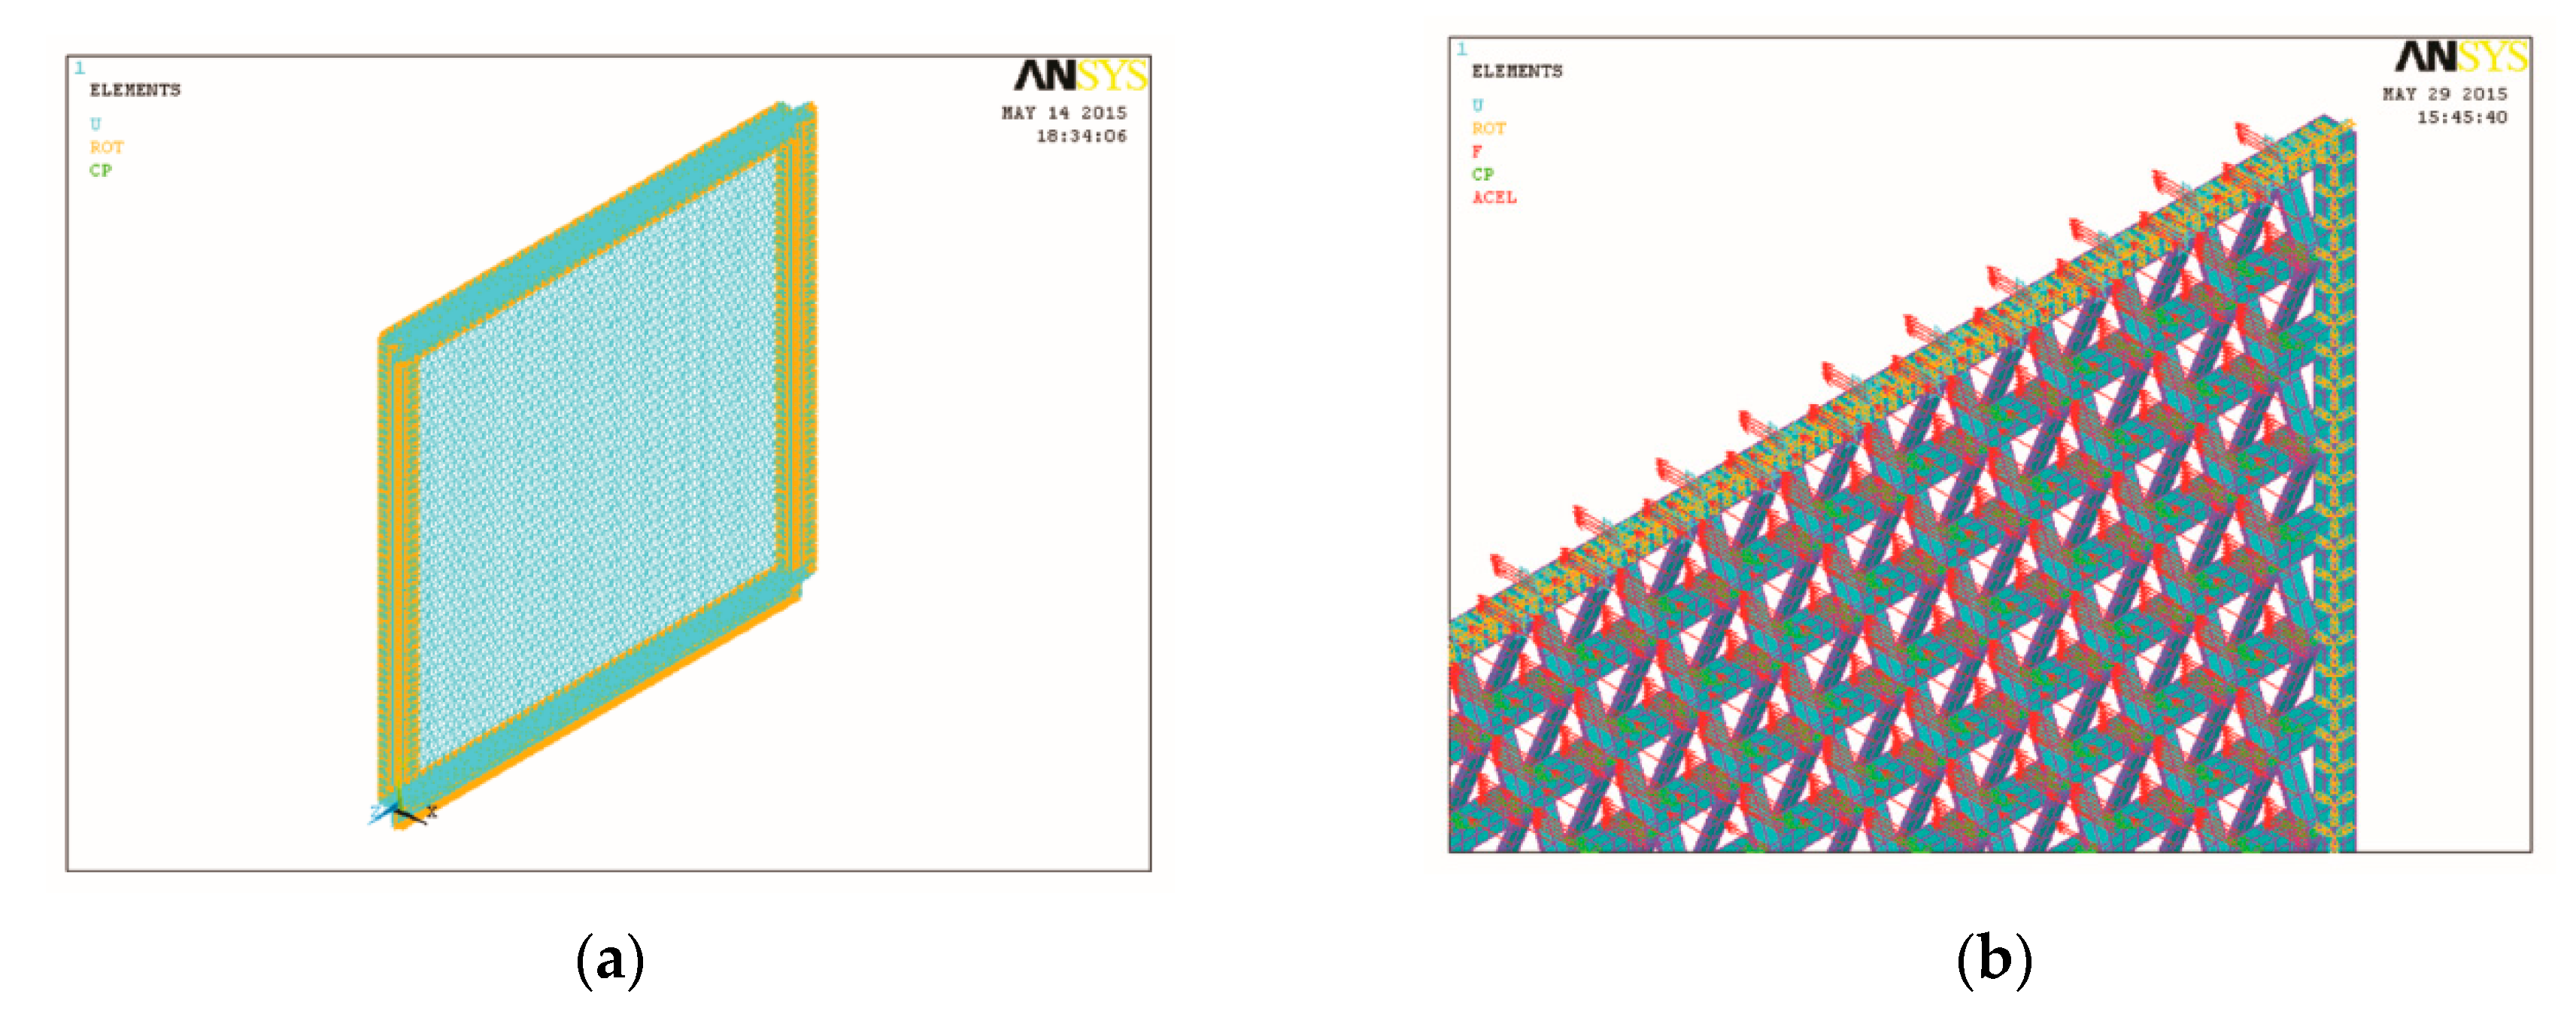
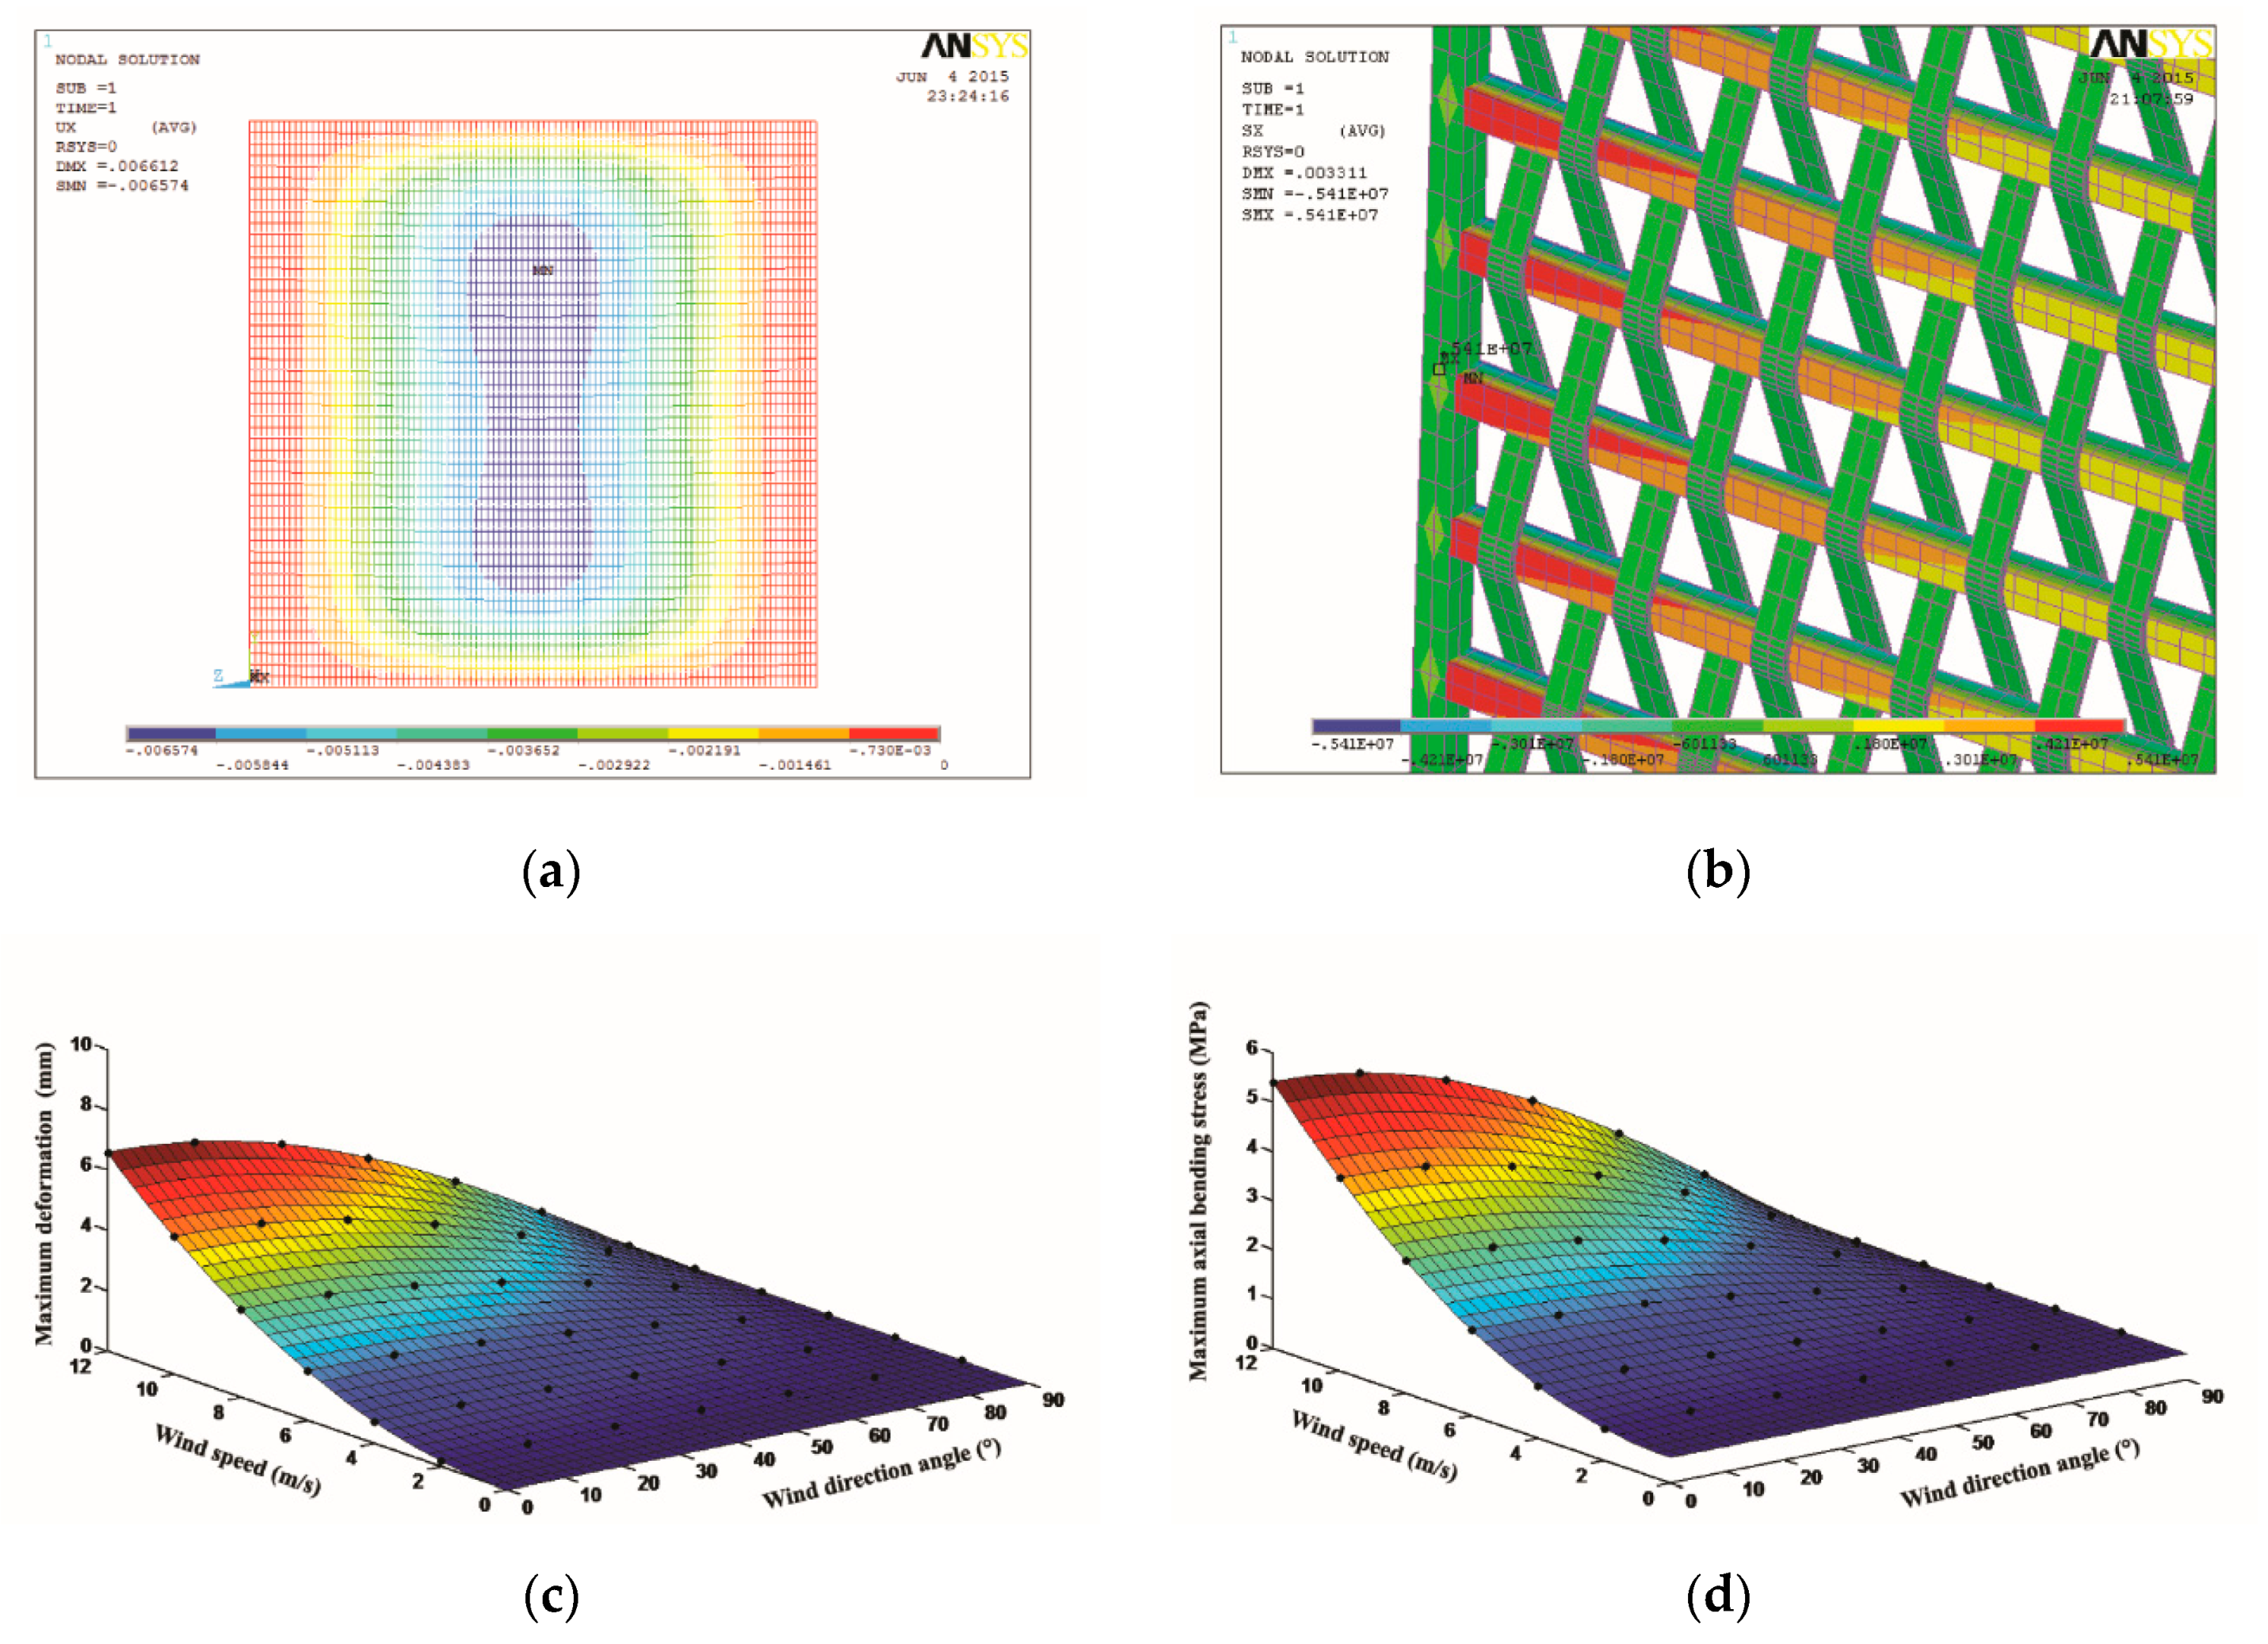
2.3.4. Simulation for Mechanical Performance in Step 1
3. Results Part 1—The Basic Performance of a Nonuniform Woven Bamboo Panel
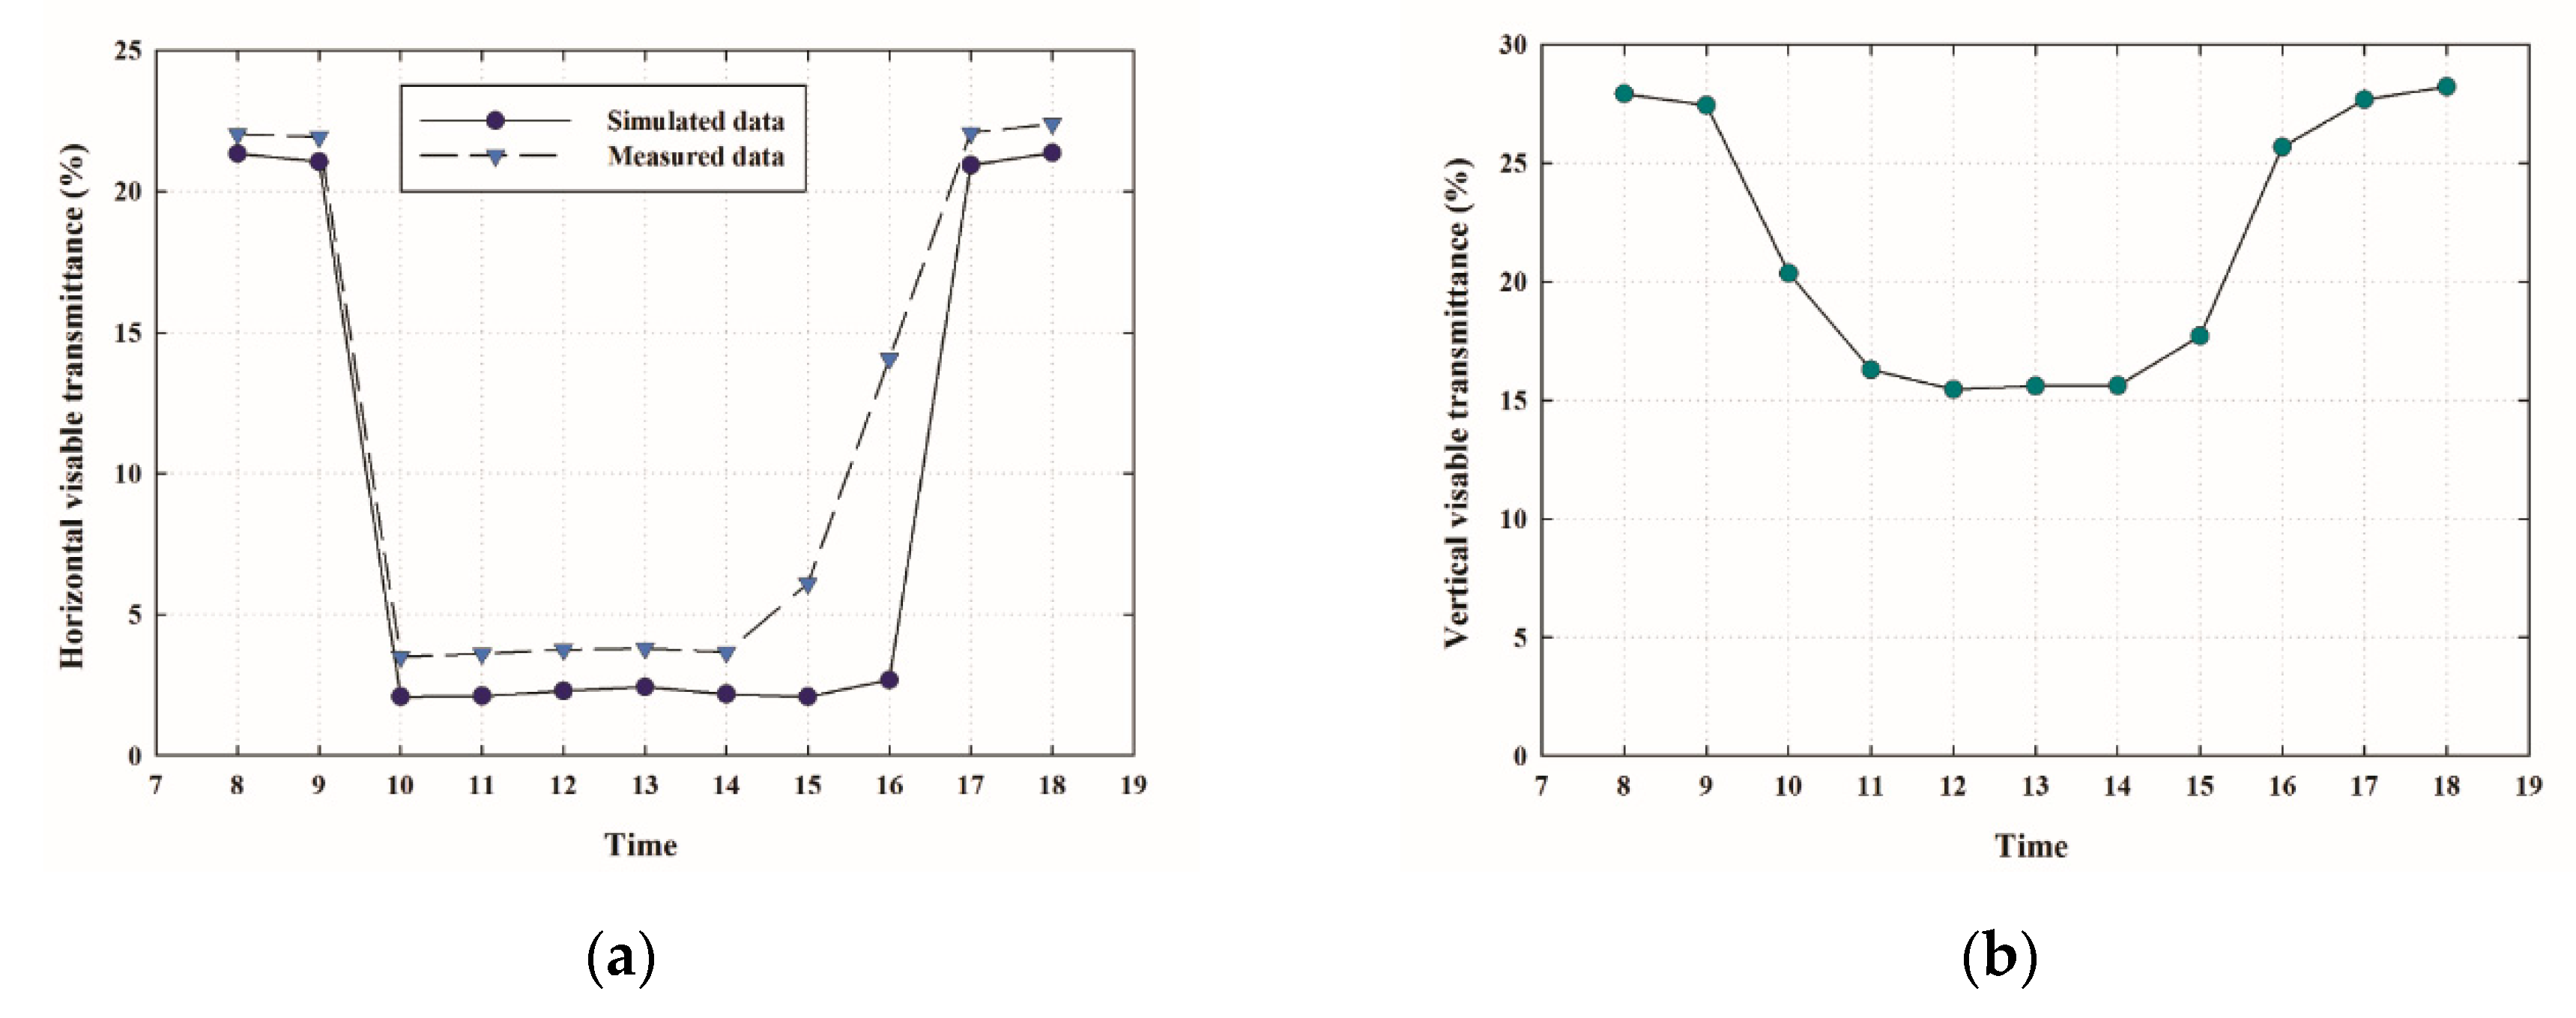
3.1. Visible Daylight Transmittance
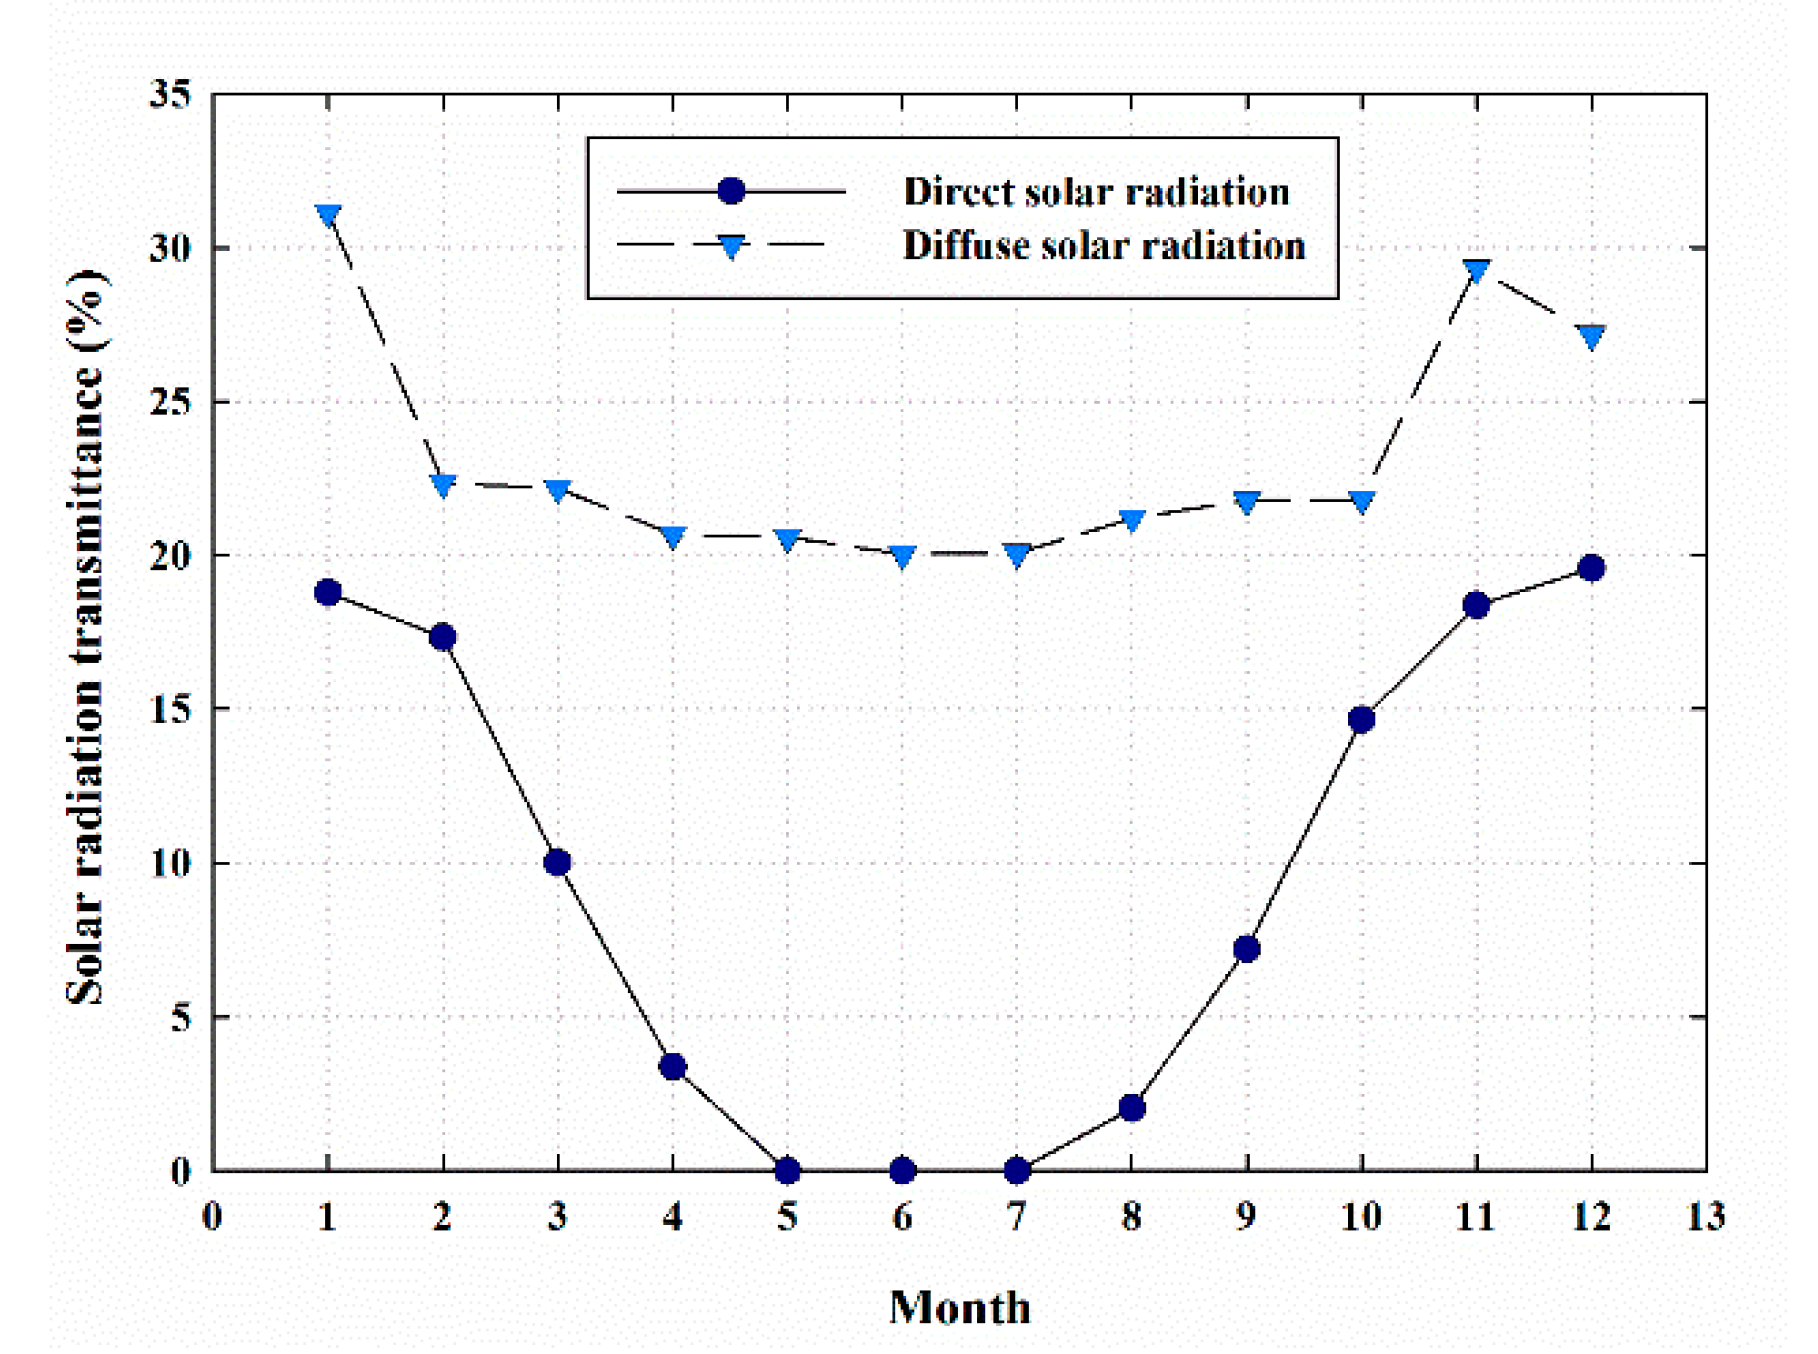
3.2. Solar Radiation Transmittance
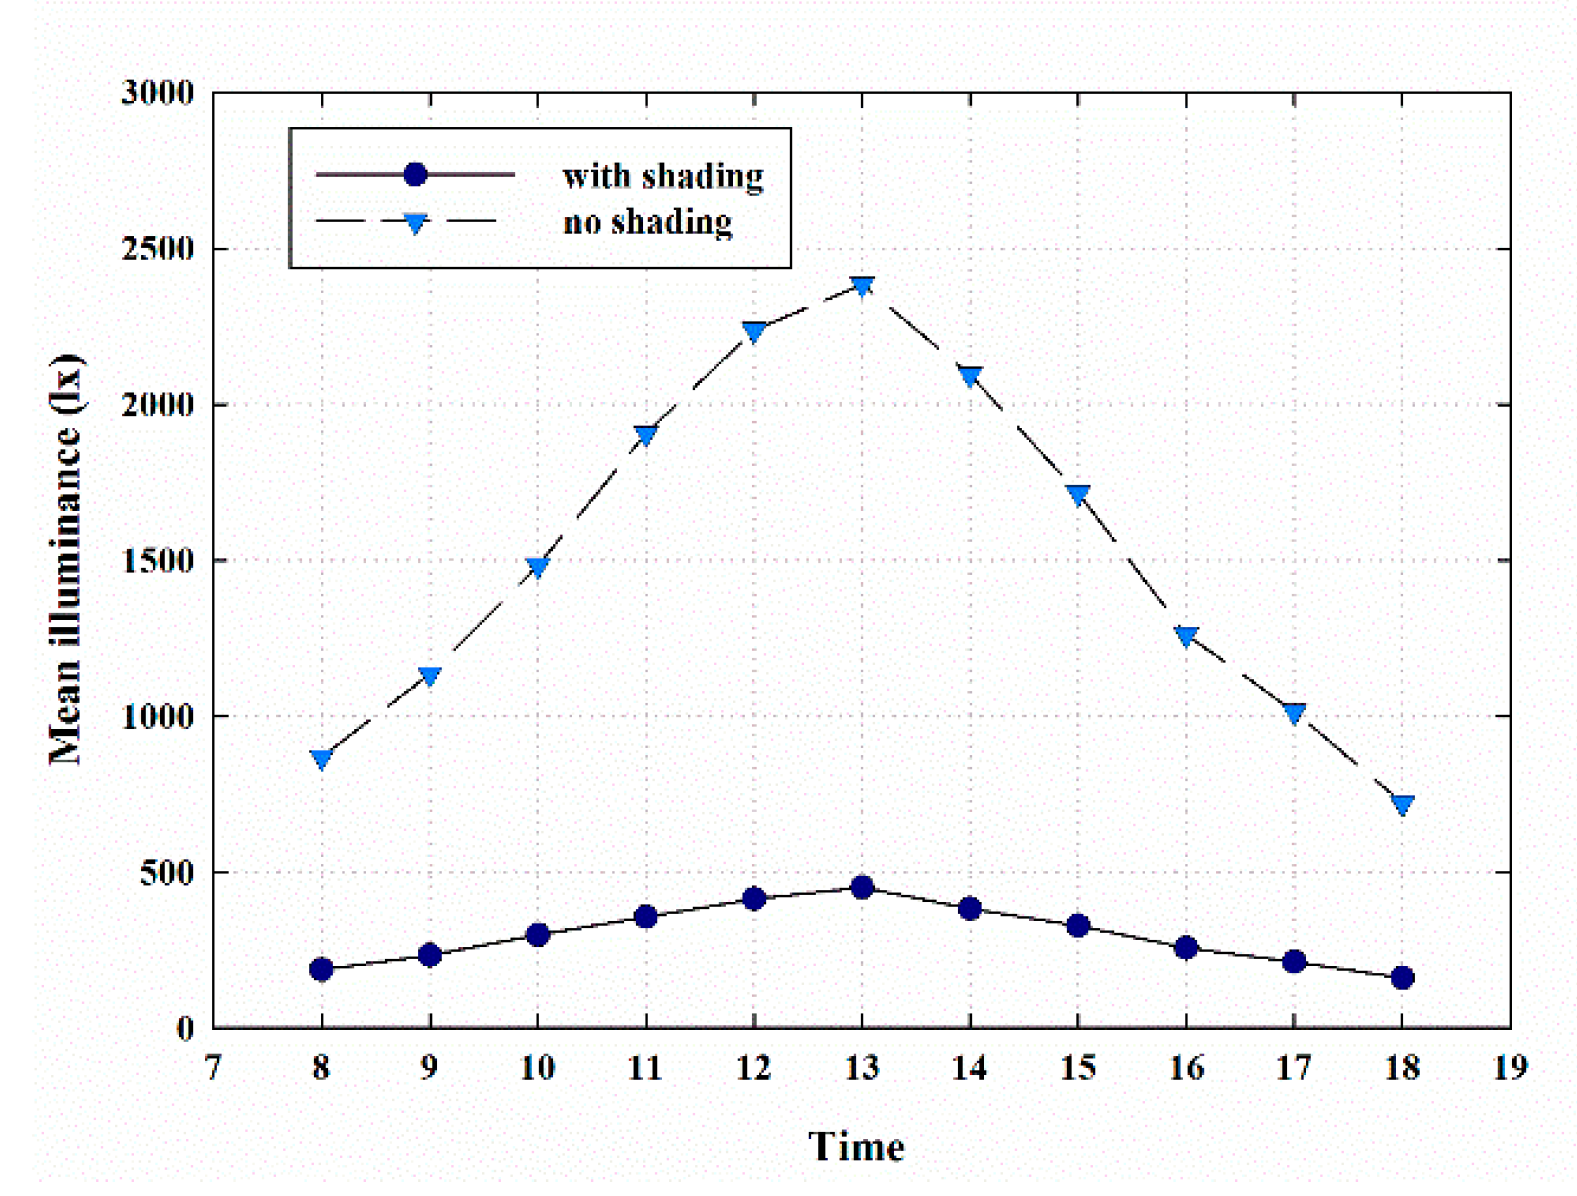
3.3. Mean Illuminance and Daylight Factor
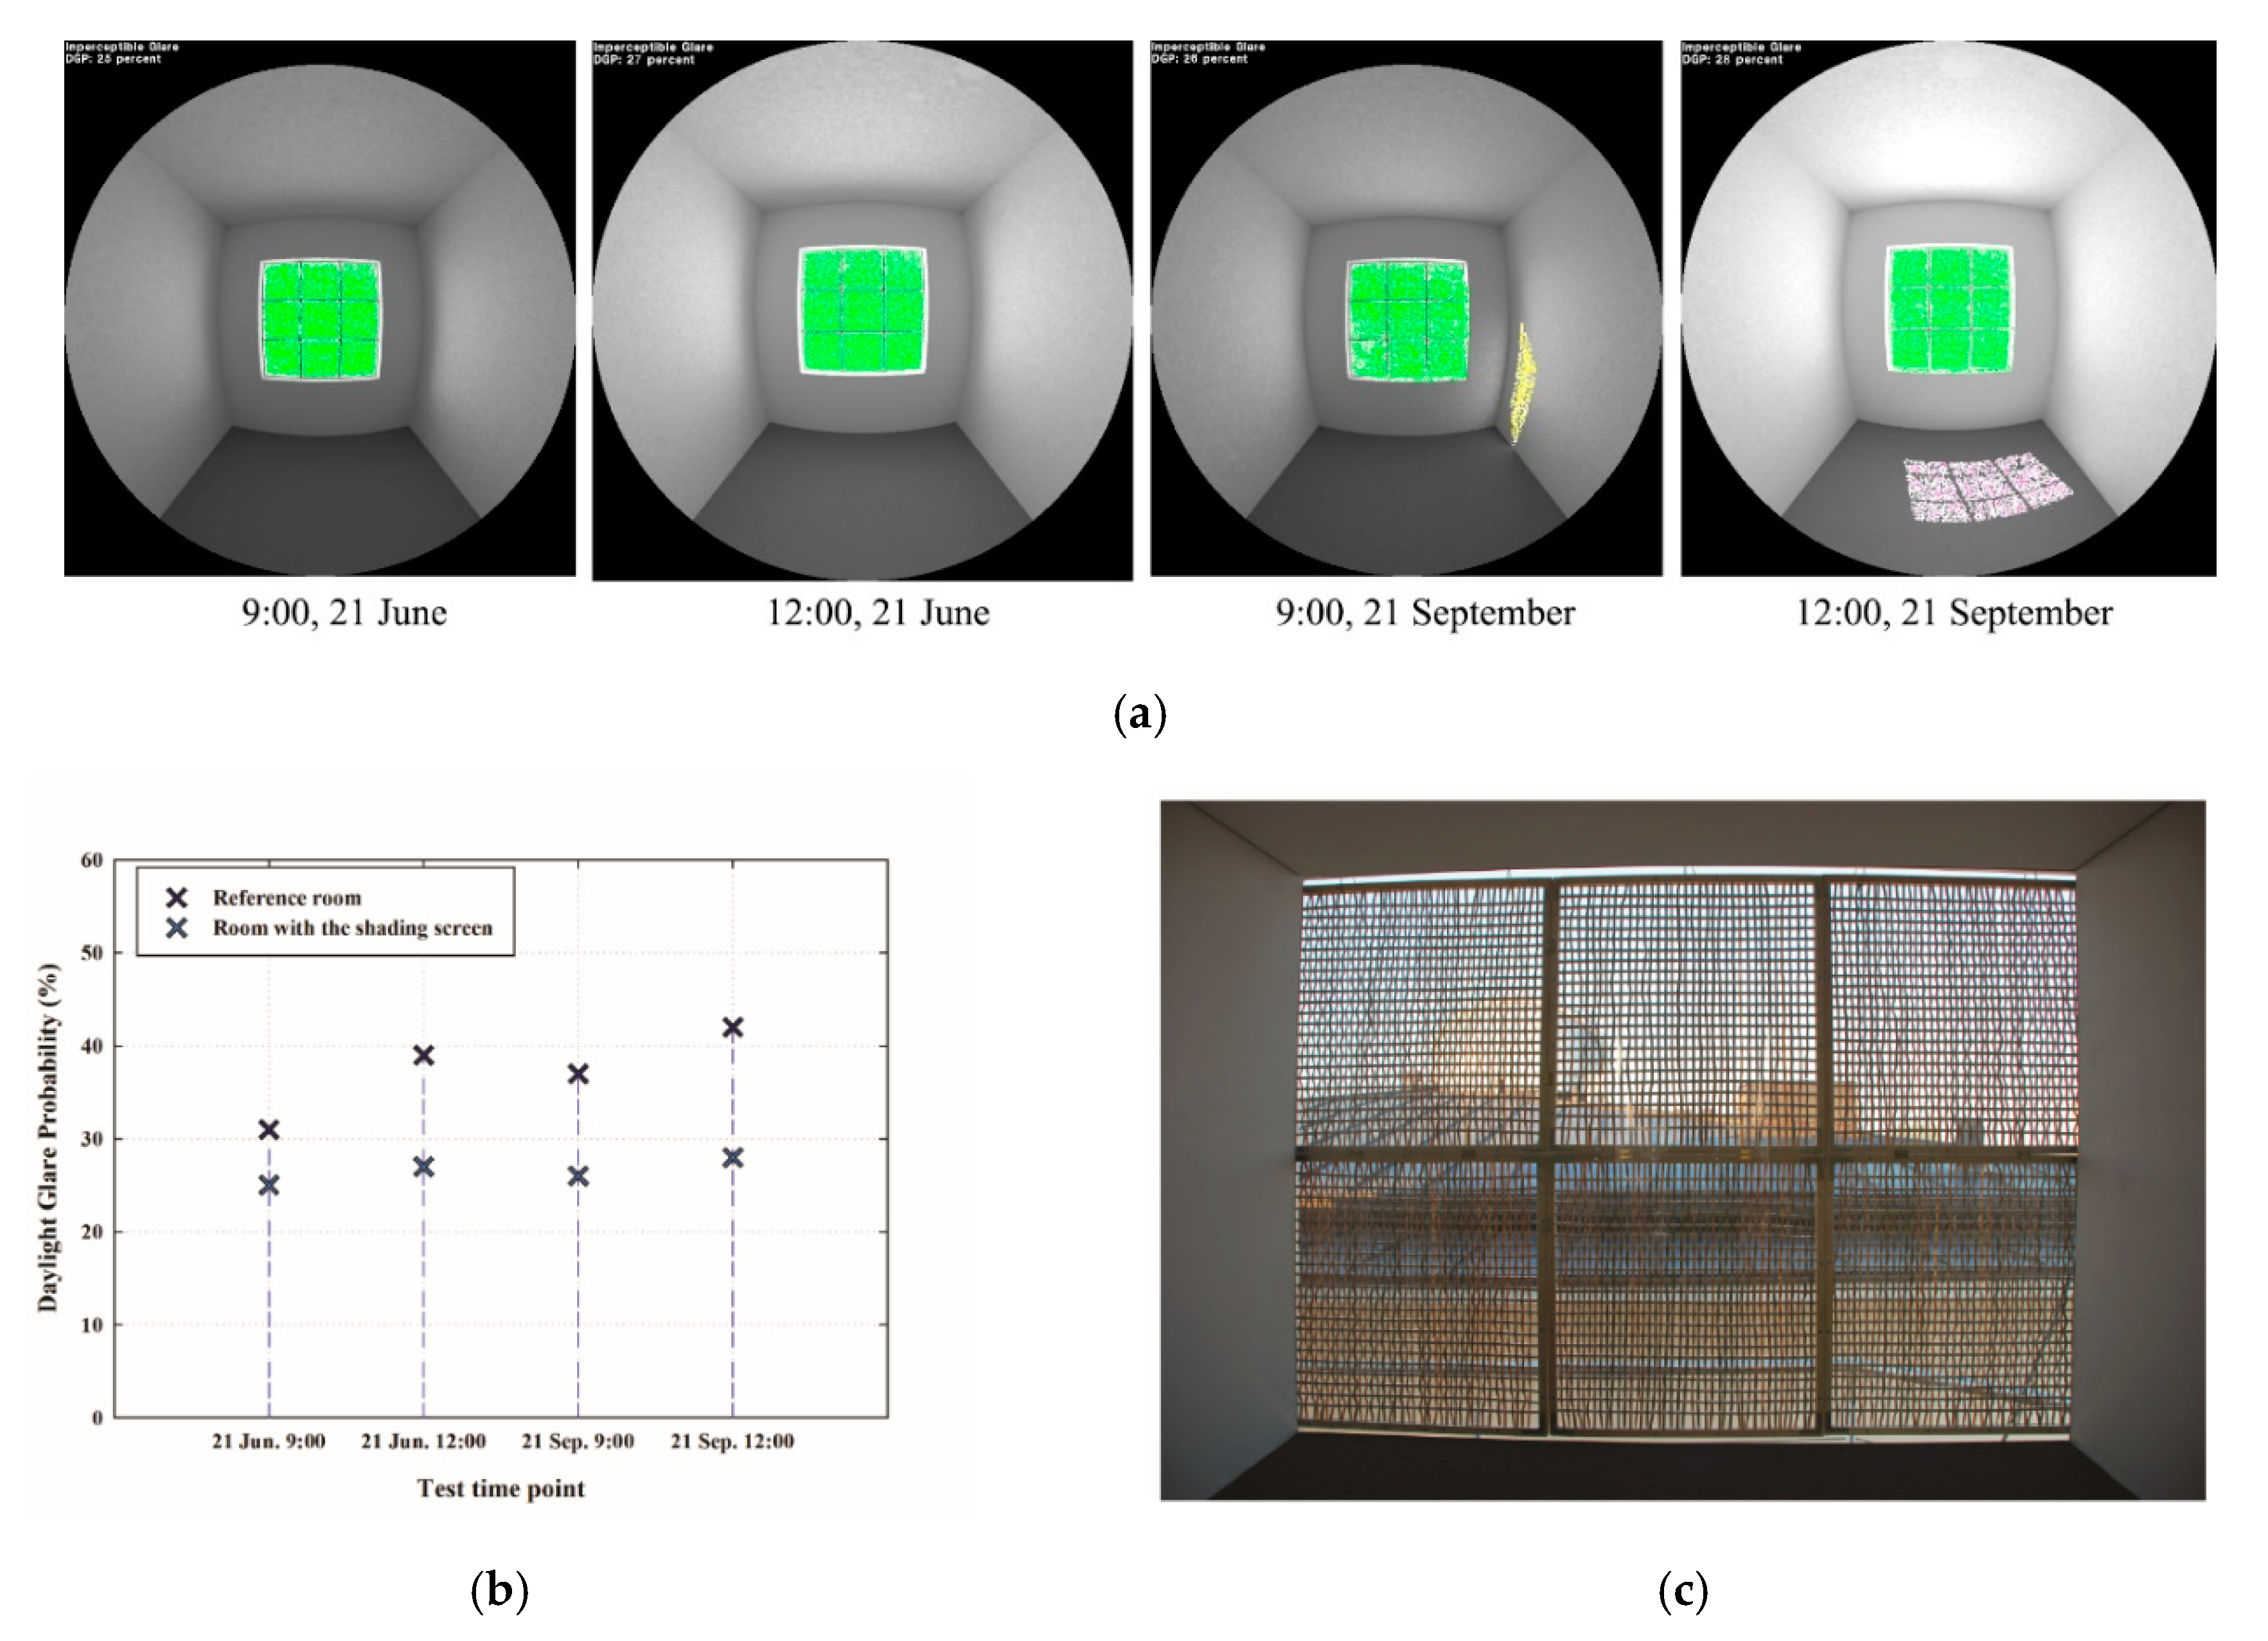
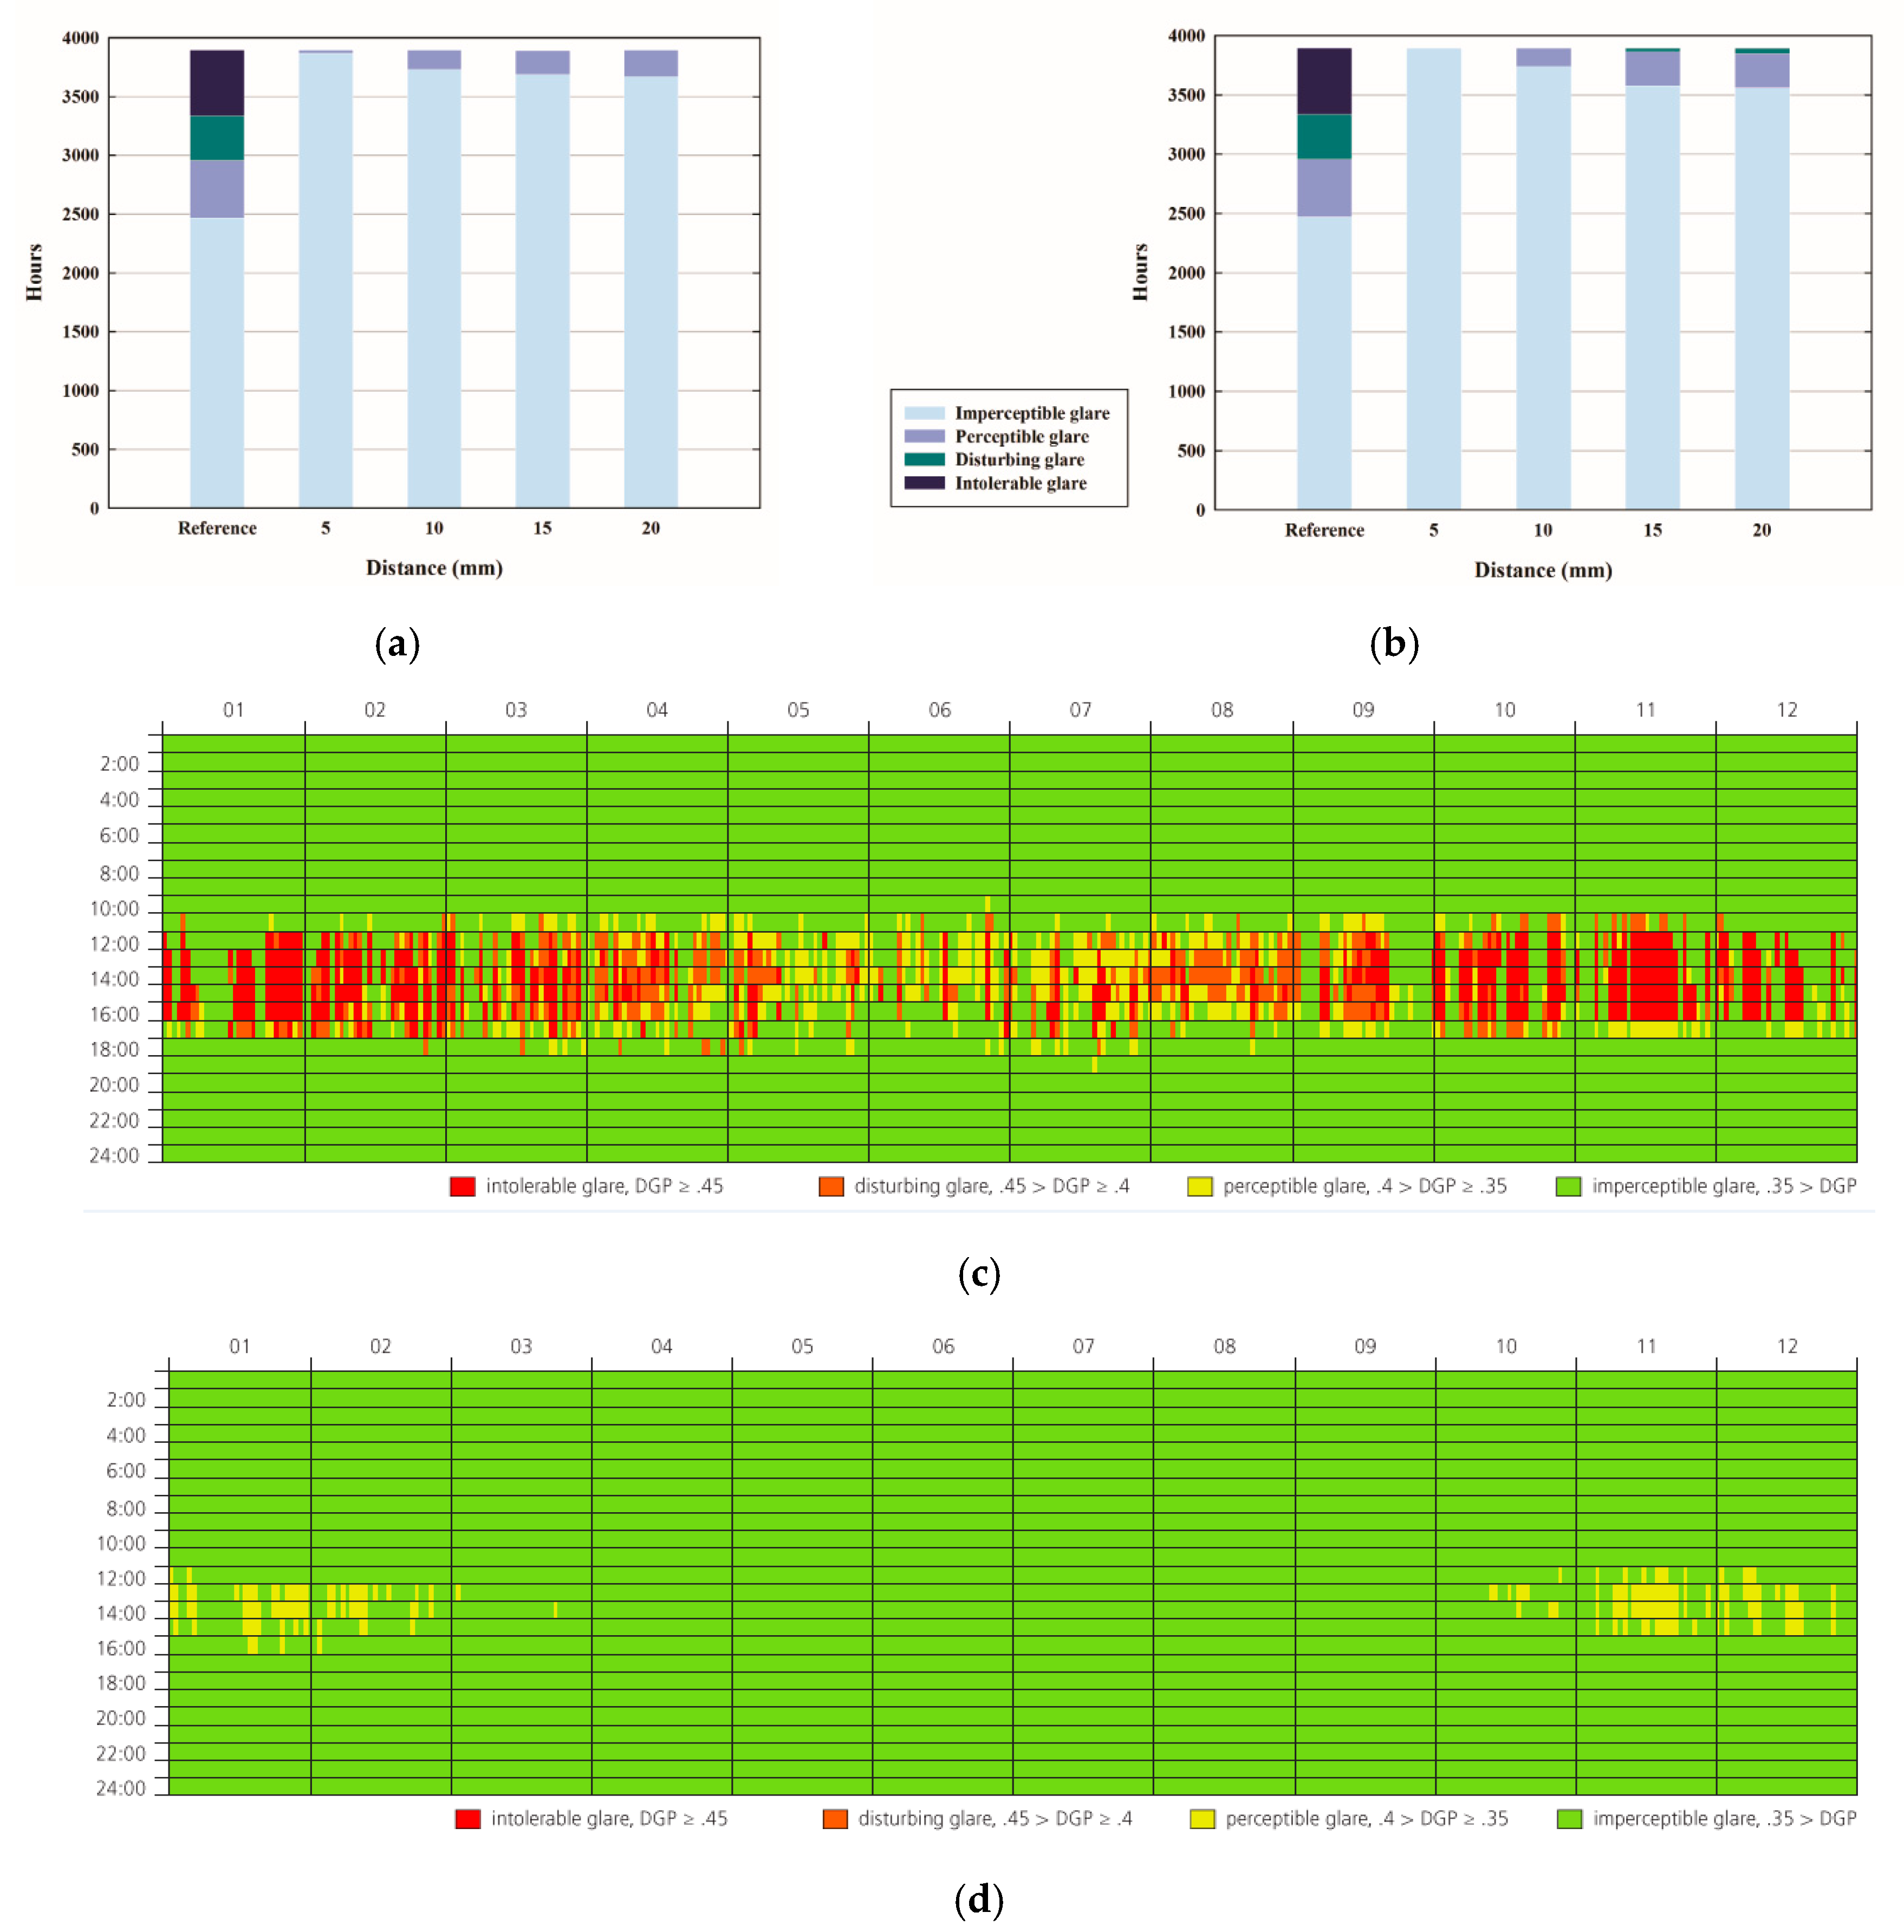
3.4. Glare and View
3.5. Mechanical Performance
4. Results Part 2—Configuration Optimization for the Nonuniform Woven Shading Screen
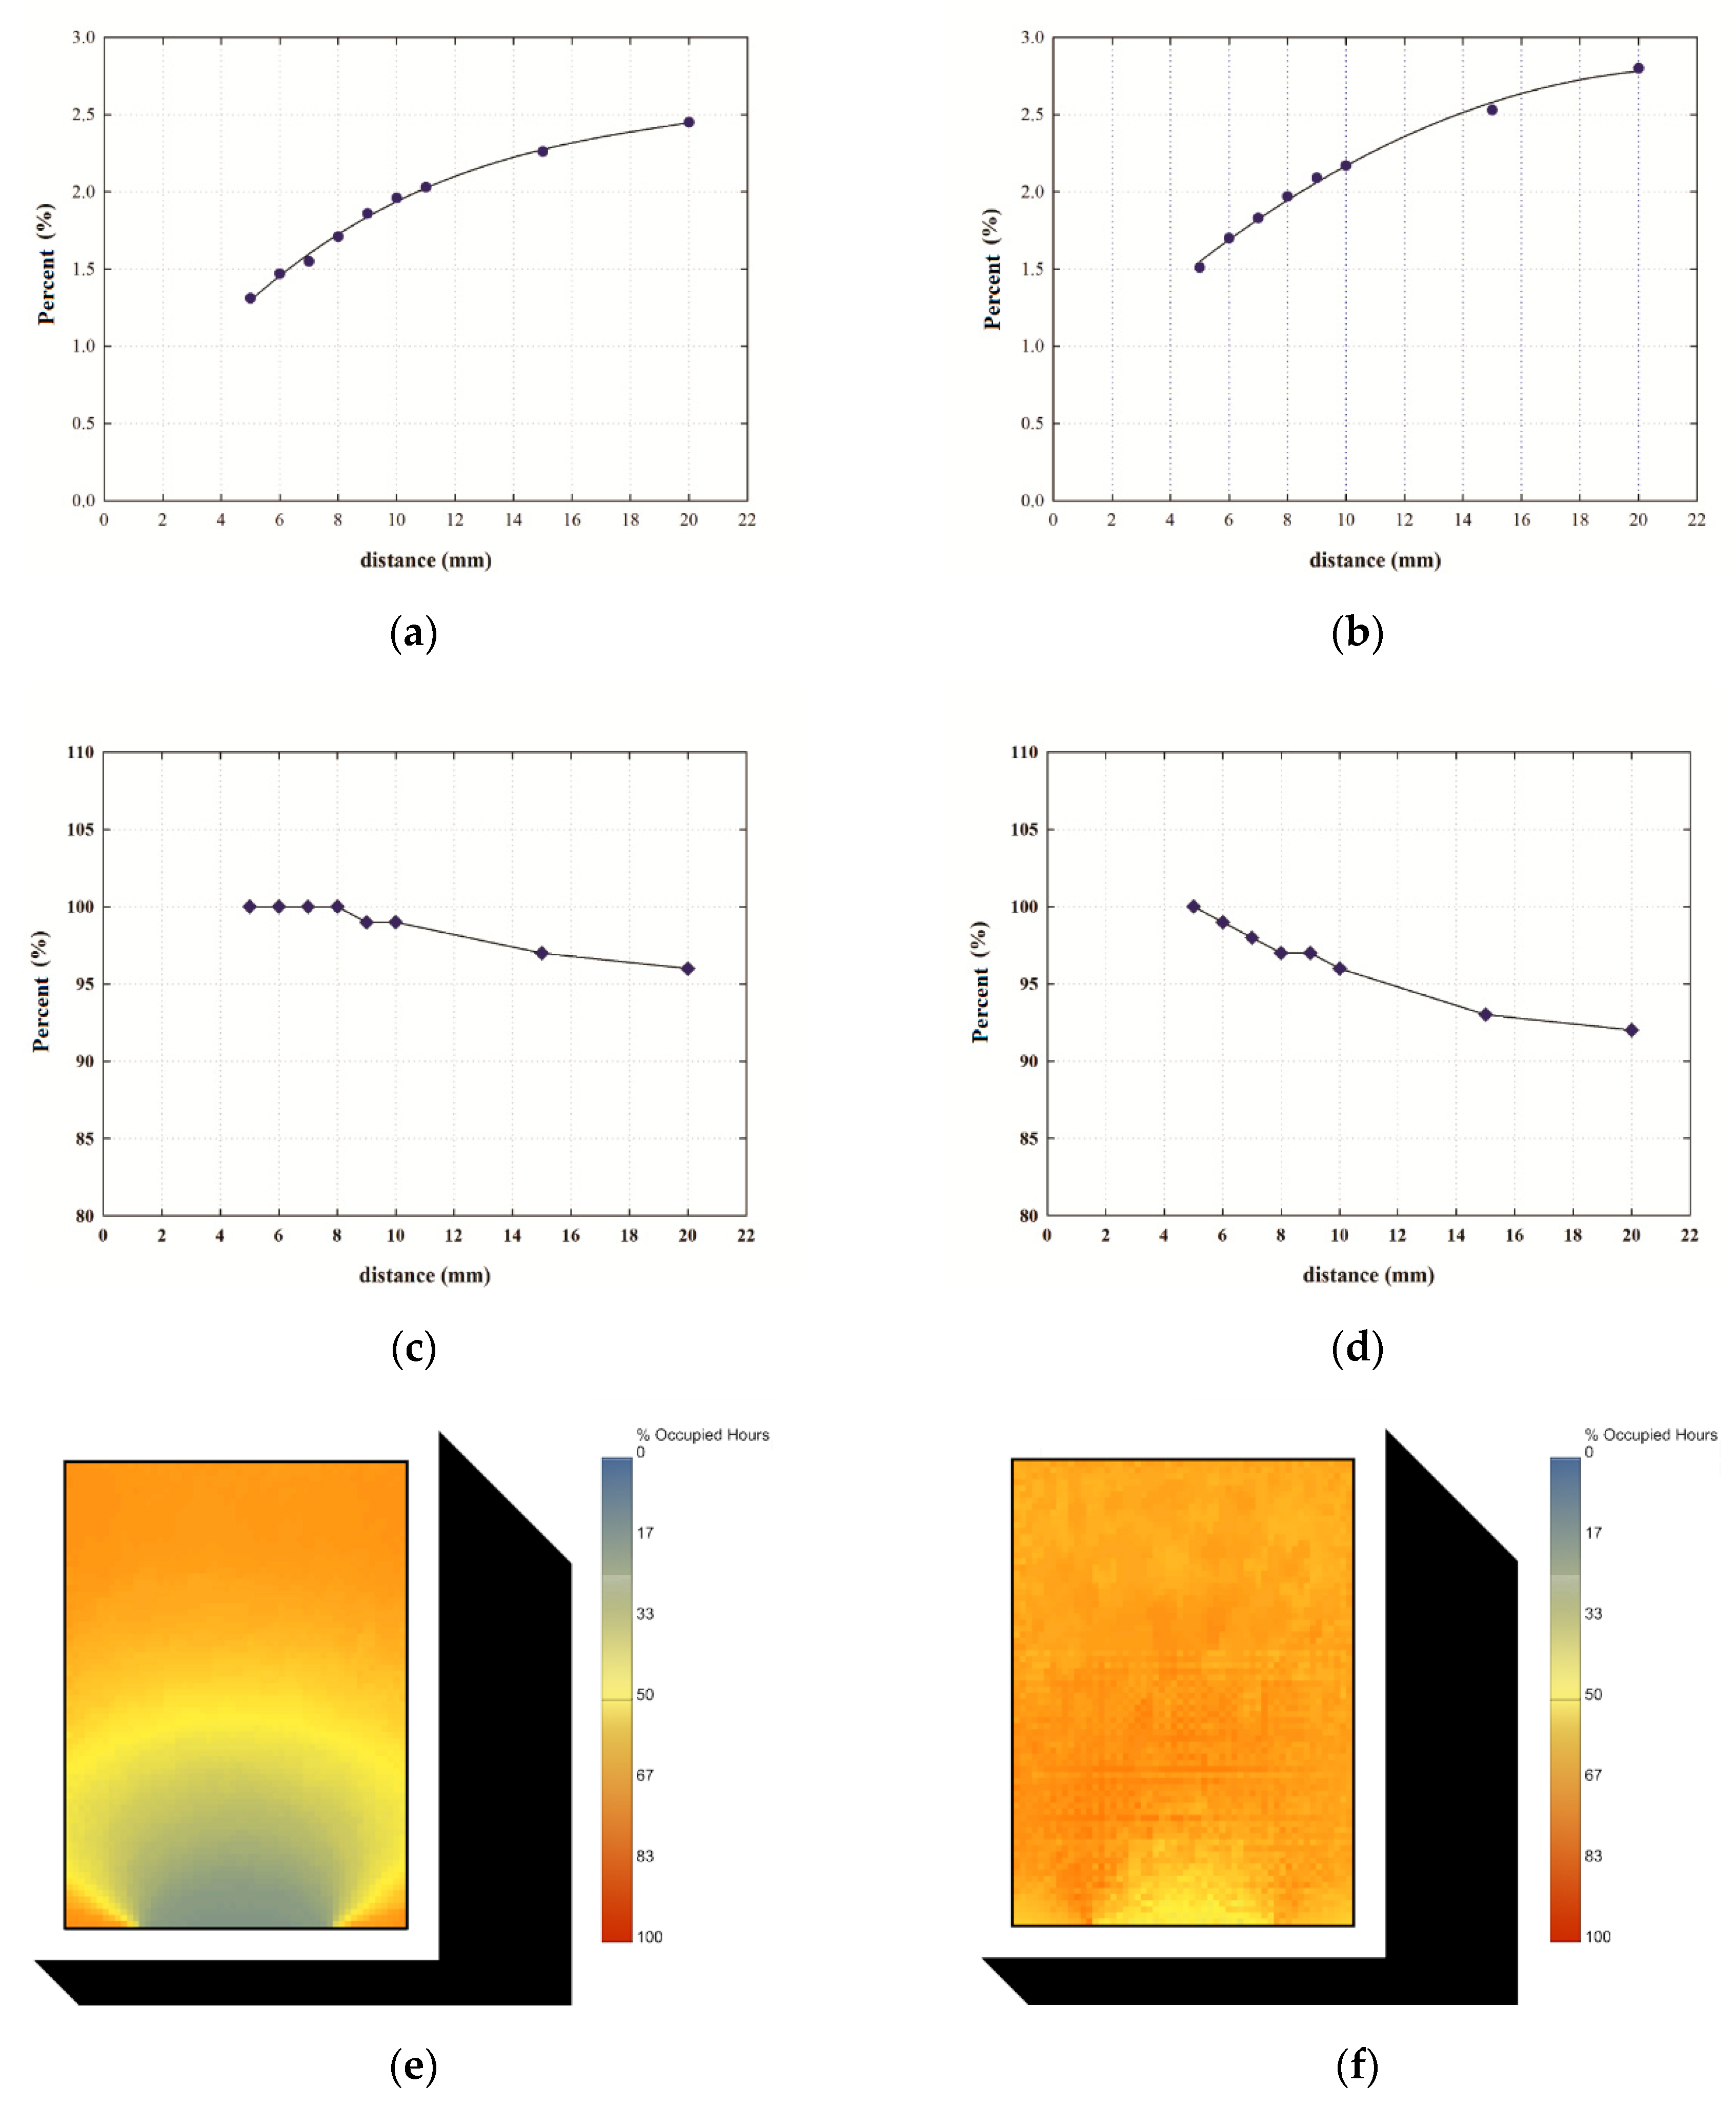
4.1. Annual Daylighting Performance
4.2. Annual Glare
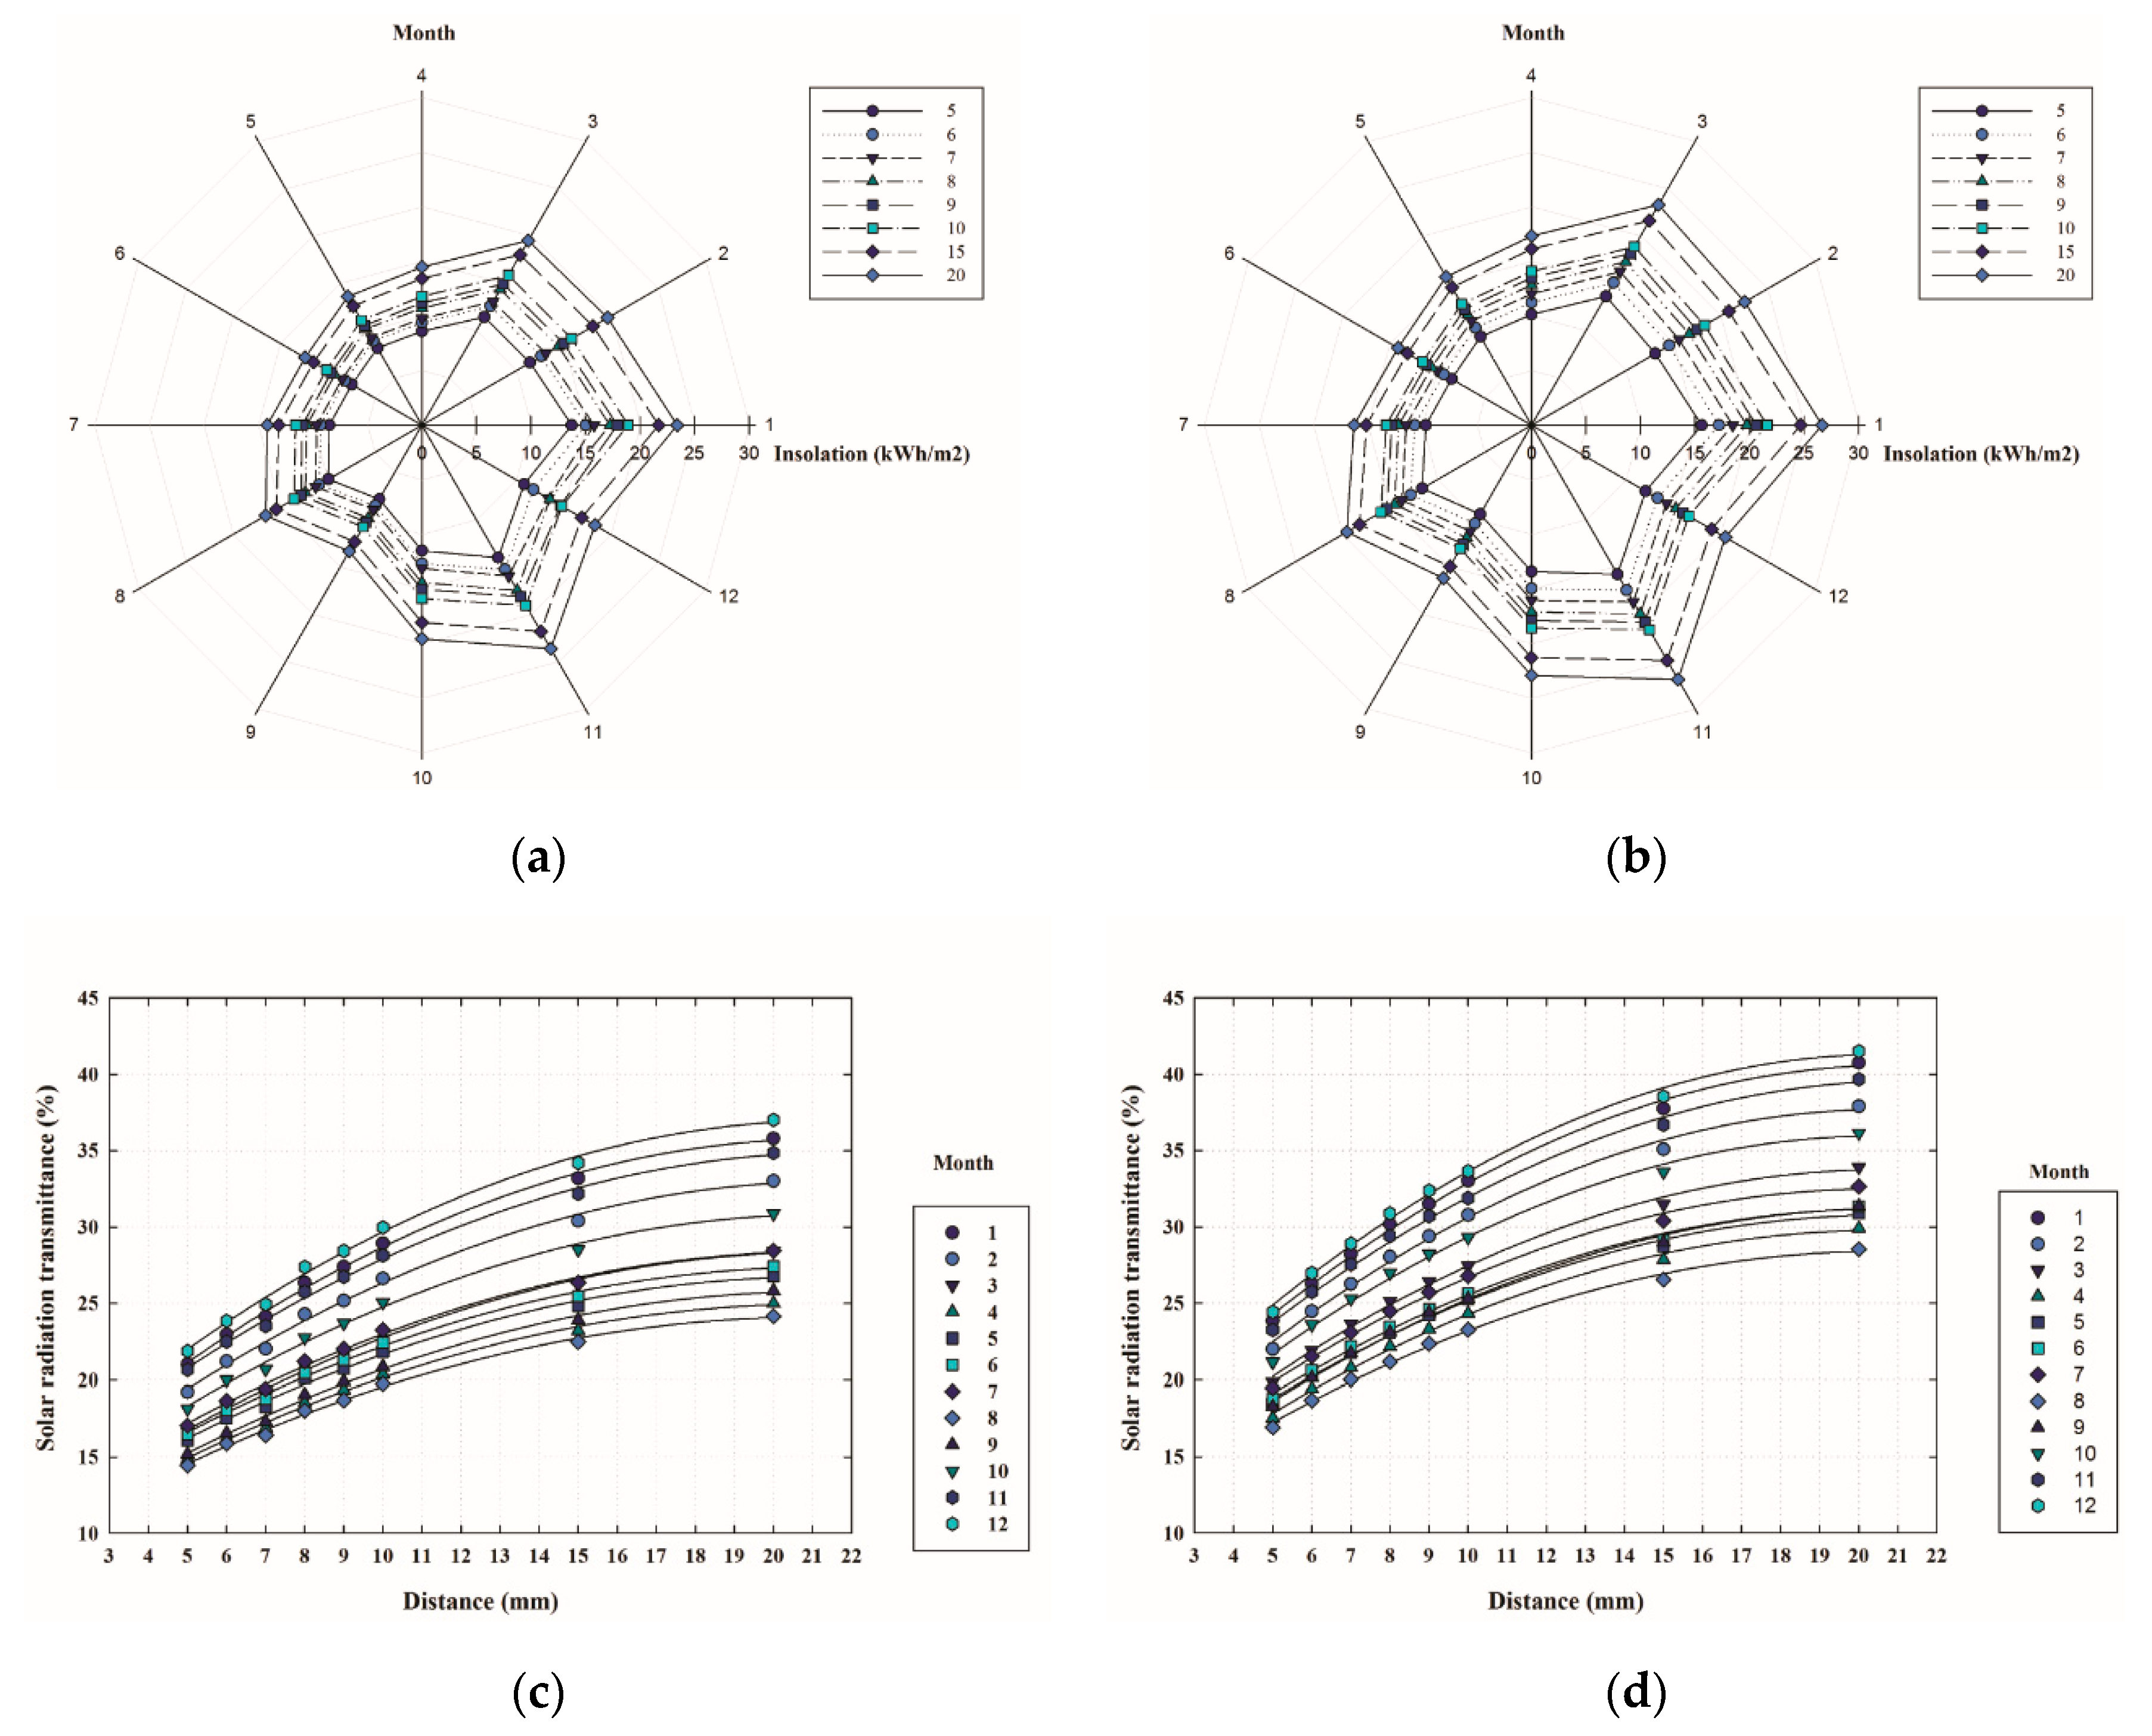
4.3. Solar Radiation Transfer
5. Conclusions
Author Contributions
Funding
Acknowledgments
Conflicts of Interest
Abbreviations
| Nomenclature | |
| d | distance between each thin batten (mm) |
| n | safety coefficient |
| σa | allowable stress (kg/cm2) |
| σb | axial bending stress (kg/cm2) |
| σp | maximum compressive stress (kg/cm2) |
| qw | wind pressure (kN/m2) |
| ρa | air density (kg/m3) |
| vw | wind velocity (m/s) |
| Wa | air gravity (kN/m) |
| g | gravitational acceleration (m/s2) |
| τvh | horizontal visible daylight transmittances (%) |
| τvv | vertical visible daylight transmittances (%) |
| Ev | outdoor horizontal illuminances (lx) |
| τs | solar radiation transmittance (%) |
| Qs | monthly total solar insolation (kWh/m2) |
| DGP | daylight glare probability (%) |
| DF | daylight factor (%) |
| UDI100–2000 | useful daylight illuminance with a daylight threshold of 100 to 2000 lx |
| GL | glare level |
| CSWD | Chinese standard weather data |
| Subscript | |
| h | horizontal |
| v | vertical |
| o | outdoor |
| i | indoor |
| m | mean |
| dir | direct |
| dif | diffuse |
| mon | monthly |
References
- Chiesa, G.; Acquaviva, A.; Grosso, M.; Bottaccioli, L.; Floridia, M.; Pristeri, E.; Sanna, E.M. Parametric Optimization of Window-to-Wall Ratio for Passive Buildings Adopting A Scripting Methodology to Dynamic-Energy Simulation. Sustainability 2019, 11, 3078. [Google Scholar] [CrossRef]
- Knaack, U.; Klein, T.; Bilow, M.; Auer, T. Façades: Principles of Construction; Birkhäuser: Basel, Switzerland, 2014. [Google Scholar]
- Bellia, L.; Marino, C.; Minichiello, F.; Pedace, A. An overview on solar shading systems for buildings. Energy Procedia 2014, 62, 309–317. [Google Scholar] [CrossRef]
- Hachem, C.; Elsayed, M. Patterns of façade system design for enhanced energy performance of multistory buildings. Energy Build. 2016, 130, 366–377. [Google Scholar] [CrossRef]
- Shen, H.; Tzempelikos, A. Daylighting and energy analysis of private offices with automated interior roller shades. Sol. Energy 2012, 86, 681–704. [Google Scholar] [CrossRef]
- Lu, Y.; Liu, S.W.; Hong, Y.D.; Xiao, Y.Q. Multivariable Optimization of Dynamic Translucent Solar Screen on West-Facing Offices. In Proceedings of the IOP Conference Series: Earth and Environmental Science, Hong Kong, China, 3–5 December 2018; p. 238. [Google Scholar]
- Grynning, S.; Lolli, N.; Wågø, S.I.; Risholt, B.D. Solar shading in low energy office buildings-design strategy and user perception. J. Daylighting 2017, 4, 1–14. [Google Scholar] [CrossRef]
- Gratia, E.; De Herde, A. The most efficient position of shading devices in a double-skin facade. Energy Build. 2007, 39, 364–373. [Google Scholar] [CrossRef]
- Atzeri, A.; Cappelletti, F.; Gasparella, A. Internal versus external shading devices performance in office buildings. Energy Procedia 2014, 45, 463–472. [Google Scholar] [CrossRef]
- Dolmans, D.; Hall, A.; Dutoo, G.; Seppänen, O. Solar Shading: How to Integrate Solar Shading in Sustainable Buildings; Rehva: Brussels, Belgium, 2010; p. 76. [Google Scholar]
- Carletti, C.; Sciurpi, F.; Pierangioli, L. The energy upgrading of existing buildings: Window and shading device typologies for energy efficiency refurbishment. Sustainability 2014, 6, 5354–5377. [Google Scholar] [CrossRef]
- Schittich, C.; Lang, W.; Krippner, R. Building Skins; Walter de Gruyter: Berlin, Germany, 2006. [Google Scholar]
- Omidfar, A. A methodology for designing contemporary high performance shading screen-the integration of ‘form’ and the DIVA simulation tool. In Proceedings of the 12th Conference of International Building Performance Simulation Association, Sydney, Australia, 14–16 November 2011. [Google Scholar]
- Sherif, A.; El-Zafarany, A.; Arafa, R. External perforated window Solar Screens: The effect of screen depth and perforation ratio on energy performance in extreme desert environments. Energy Build. 2012, 52, 1–10. [Google Scholar] [CrossRef]
- Chi, D.A.; Moreno, D.; Navarro, J. Design optimisation of perforated solar façades in order to balance daylighting with thermal performance. Build. Environ. 2017, 125, 383–400. [Google Scholar] [CrossRef]
- Sabry, H.; Sherif, A.; Gadelhak, M.; Aly, M. Balancing the daylighting and energy performance of solar screens in residential desert buildings: Examination of screen axial rotation and opening aspect ratio. Sol. Energy 2014, 103, 364–377. [Google Scholar] [CrossRef]
- Leung, T.C.Y.; Rajagopalan, P.; Fuller, R. Performance of a daylight guiding system in an office building. Sol. Energy 2013, 94, 253–265. [Google Scholar] [CrossRef]
- Ruck, N.; Aschehoug, O.; Aydinli, S.; Hristoffersen, J.; Courret, G.; Edmonds, I.; Michel, L. Daylight in Buildings—A Source Book on Daylighting Systems and Components; Lawrence Berkeley National Laboratory: Berkeley, CA, USA, 2000. [Google Scholar]
- Kirimtat, A.; Koyunbaba, B.K.; Chatzikonstantinou, I.; Sariyildiz, S. Review of simulation modeling for shading devices in buildings. Renew. Sustain. Energy Rev. 2016, 53, 23–49. [Google Scholar] [CrossRef]
- Brotas, L.; Rusovan, D. Parametric daylight envelope. In Proceedings of the 29th Conference, Sustainable Architecture for a Renewable Future, Munich, Germany, 10–12 September 2013. [Google Scholar]
- Day, J.K.; Futrell, B.; Cox, R.; Ruiy, S.N. Blinded by the light: Occupant perceptions and visual comfort assessments of three dynamic daylight control systems and shading strategies. Build. Environ. 2019, 154, 107–121. [Google Scholar] [CrossRef]
- Lee, B. Heating, Cooling, and Lighting Energy Demand Simulation Analysis of Kinetic Shading Devices with Automatic Dimming Control for Asian Countries. Sustainability 2019, 11, 1253. [Google Scholar] [CrossRef]
- Hensen, J.L.; Lamberts, R. (Eds.) Building Performance Simulation for Design and Operation; Routledge: New York, NY, USA, 2012. [Google Scholar]
- Nielsen, M.V.; Svendsen, S.; Jensen, L.B. Quantifying the potential of automated dynamic solar shading in office buildings through integrated simulations of energy and daylight. Sol. Energy 2011, 85, 757–768. [Google Scholar] [CrossRef]
- Brownell, B. Transmaterial 3: A Catalog of Materials That Redefine Our Physical Environment; Princeton Architectural Press: New York, NY, USA, 2010. [Google Scholar]
- Deneyer, A.; Deroisy, B.; Lethé, G.; Flamant, G. Bi-Directional Scattering Distribution Data of Solar Shading: Characterization and Performances. In Proceedings of the CIE Centenary Conference Toward a New Century of Light, Paris, France, 15–16 April 2013. [Google Scholar]
- Aljofi, E. The potentiality of reflected sunlight through Rawshan screens. In Proceedings of the International Conference Passive and Low Energy Cooling for the Built Environment, Santorini, Greece, 19–21 May 2005. [Google Scholar]
- Iarkus, T.A. The function of windows—A reappraisal. Build. Sci. 1967, 2, 97–121. [Google Scholar]
- Lo, T.Y.; Cui, H.Z.; Tang, P.W.C.; Leung, H.C. Strength analysis of bamboo by microscopic investigation of bamboo fibre. Constr. Build. Mater. 2008, 22, 1532–1535. [Google Scholar] [CrossRef]
- Van der Lugt, P. Design Interventions for Stimulating Bamboo Commercialization-Dutch Design Meets Bamboo as a Replicable Model; Delft University of Technology: Delft, The Netherlands, 2008. [Google Scholar]
- Dunkelberg, K. IL-31 Bambus Bambus als Baustoff; Karl Krämer Verlag: Stuttgart, Germany, 1985. [Google Scholar]
- Chang, F.C.; Chen, K.S.; Yang, P.Y.; Ko, C.H. Environmental benefit of utilizing bamboo material based on life cycle assessment. J. Clean. Prod. 2018, 204, 60–69. [Google Scholar] [CrossRef]
- Zea Escamilla, E.; Habert, G.; Correal Daza, J.; Archilla, H.; Echeverry Fernández, J.; Trujillo, D. Industrial or traditional bamboo construction? Comparative Life Cycle Assessment (LCA) of bamboo-based buildings. Sustainability 2018, 10, 3096. [Google Scholar] [CrossRef]
- Liu, W.; Hui, C.; Wang, F.; Liu, G. Review of the Resources and Utilization of Bamboo in China. In Bamboo–Current and Future Prospects; Books on Demand: Norderstedt, Germany, 2018; pp. 174–198. [Google Scholar]
- Amada, S.; Ichikawa, Y.; Munekata, T.; Nagase, Y.; Shimizu, H. Fiber texture and mechanical graded structure of bamboo. Compos. Part B Eng. 1997, 28, 13–20. [Google Scholar] [CrossRef]
- Lewis, D.; Miles, C.A. Farming Bamboo; Lulu: Morrisville, NC, USA, 2007. [Google Scholar]
- Vogtländer, J.; van der Lugt, P.; Brezet, H. The sustainability of bamboo products for local and Western European applications. LCAs and land-use. J. Clean. Prod. 2010, 18, 1260–1269. [Google Scholar] [CrossRef]
- Janssen, J.J.A. Designing and building with bamboo. In China: International Network for Bamboo and Rattan; Technical University of Eindhoven: Eindhoven, The Netherlands, 2000. [Google Scholar]
- Chele, E.S.; Ricardo, M.C.; Ana, P.M.; Teresa, M.R. Bamboo, from traditional crafts to contemporary design and architecture. Proced. Soc. Behav. Sci. 2012, 51, 777–781. [Google Scholar] [CrossRef]
- The Standardization Administration of the People’s Republic of China. GB50033; The People’s Republic of China National Standard GB50033—2013: Standard for Daylighting Design of Buildings; China Standard Press: Beijing, China, 2013. (In Chinese)


| Surface | Vertical Surfaces of the Test Box/Room Walls | Lower Horizontal Surface of the Test Box/Room Floor | Upper Horizontal Surface of the Test Box/Room Ceiling | Window | Solar Shading Screen |
|---|---|---|---|---|---|
| Material | White plaster | Fine concrete | White plaster | Single glazing | Bamboo |
| Reflectance | 50% | 20% | 70% | - | 0.5, 0.3, 0.2 (red, green, blue) |
| Transmittance | 0 | 0 | 0 | 90% | 0 |
© 2019 by the authors. Licensee MDPI, Basel, Switzerland. This article is an open access article distributed under the terms and conditions of the Creative Commons Attribution (CC BY) license (http://creativecommons.org/licenses/by/4.0/).
Share and Cite
Lu, Y.; Lin, H.; Liu, S.; Xiao, Y. Nonuniform Woven Solar Shading Screens: Shading, Mechanical, and Daylighting Performance. Sustainability 2019, 11, 5652. https://doi.org/10.3390/su11205652
Lu Y, Lin H, Liu S, Xiao Y. Nonuniform Woven Solar Shading Screens: Shading, Mechanical, and Daylighting Performance. Sustainability. 2019; 11(20):5652. https://doi.org/10.3390/su11205652
Chicago/Turabian StyleLu, Yao, Hankun Lin, Siwei Liu, and Yiqiang Xiao. 2019. "Nonuniform Woven Solar Shading Screens: Shading, Mechanical, and Daylighting Performance" Sustainability 11, no. 20: 5652. https://doi.org/10.3390/su11205652
APA StyleLu, Y., Lin, H., Liu, S., & Xiao, Y. (2019). Nonuniform Woven Solar Shading Screens: Shading, Mechanical, and Daylighting Performance. Sustainability, 11(20), 5652. https://doi.org/10.3390/su11205652