Analysing Drivers and Barriers of Accommodation Sharing in Dubai Using the Grey-DEMATEL Approach


Abstract
1. Introduction
2. Background, Drivers, and Barriers
2.1. Background of Accommodation Sharing
2.2. Drivers and Barriers of Accommodation Sharing
2.2.1. Drivers of Accommodation Sharing
2.2.2. Barriers to Accommodation Sharing
2.3. Gap Analysis and Research Highlights
- Highlighting and developing drivers and barriers for accommodation sharing based on the existing literature and the feedback of experienced professionals.
- Examining and determining the crucial drivers and barriers for accommodation sharing with the insight of five expert hosts.
- Comparing the results of this study to the existing accommodation sharing research and validating them with feedback from practitioners.
3. Methodology
3.1. Grey-Based Decision-Making Trial and Evaluation Laboratory Approach
3.2. Data Acquisition
4. Results and Discussion
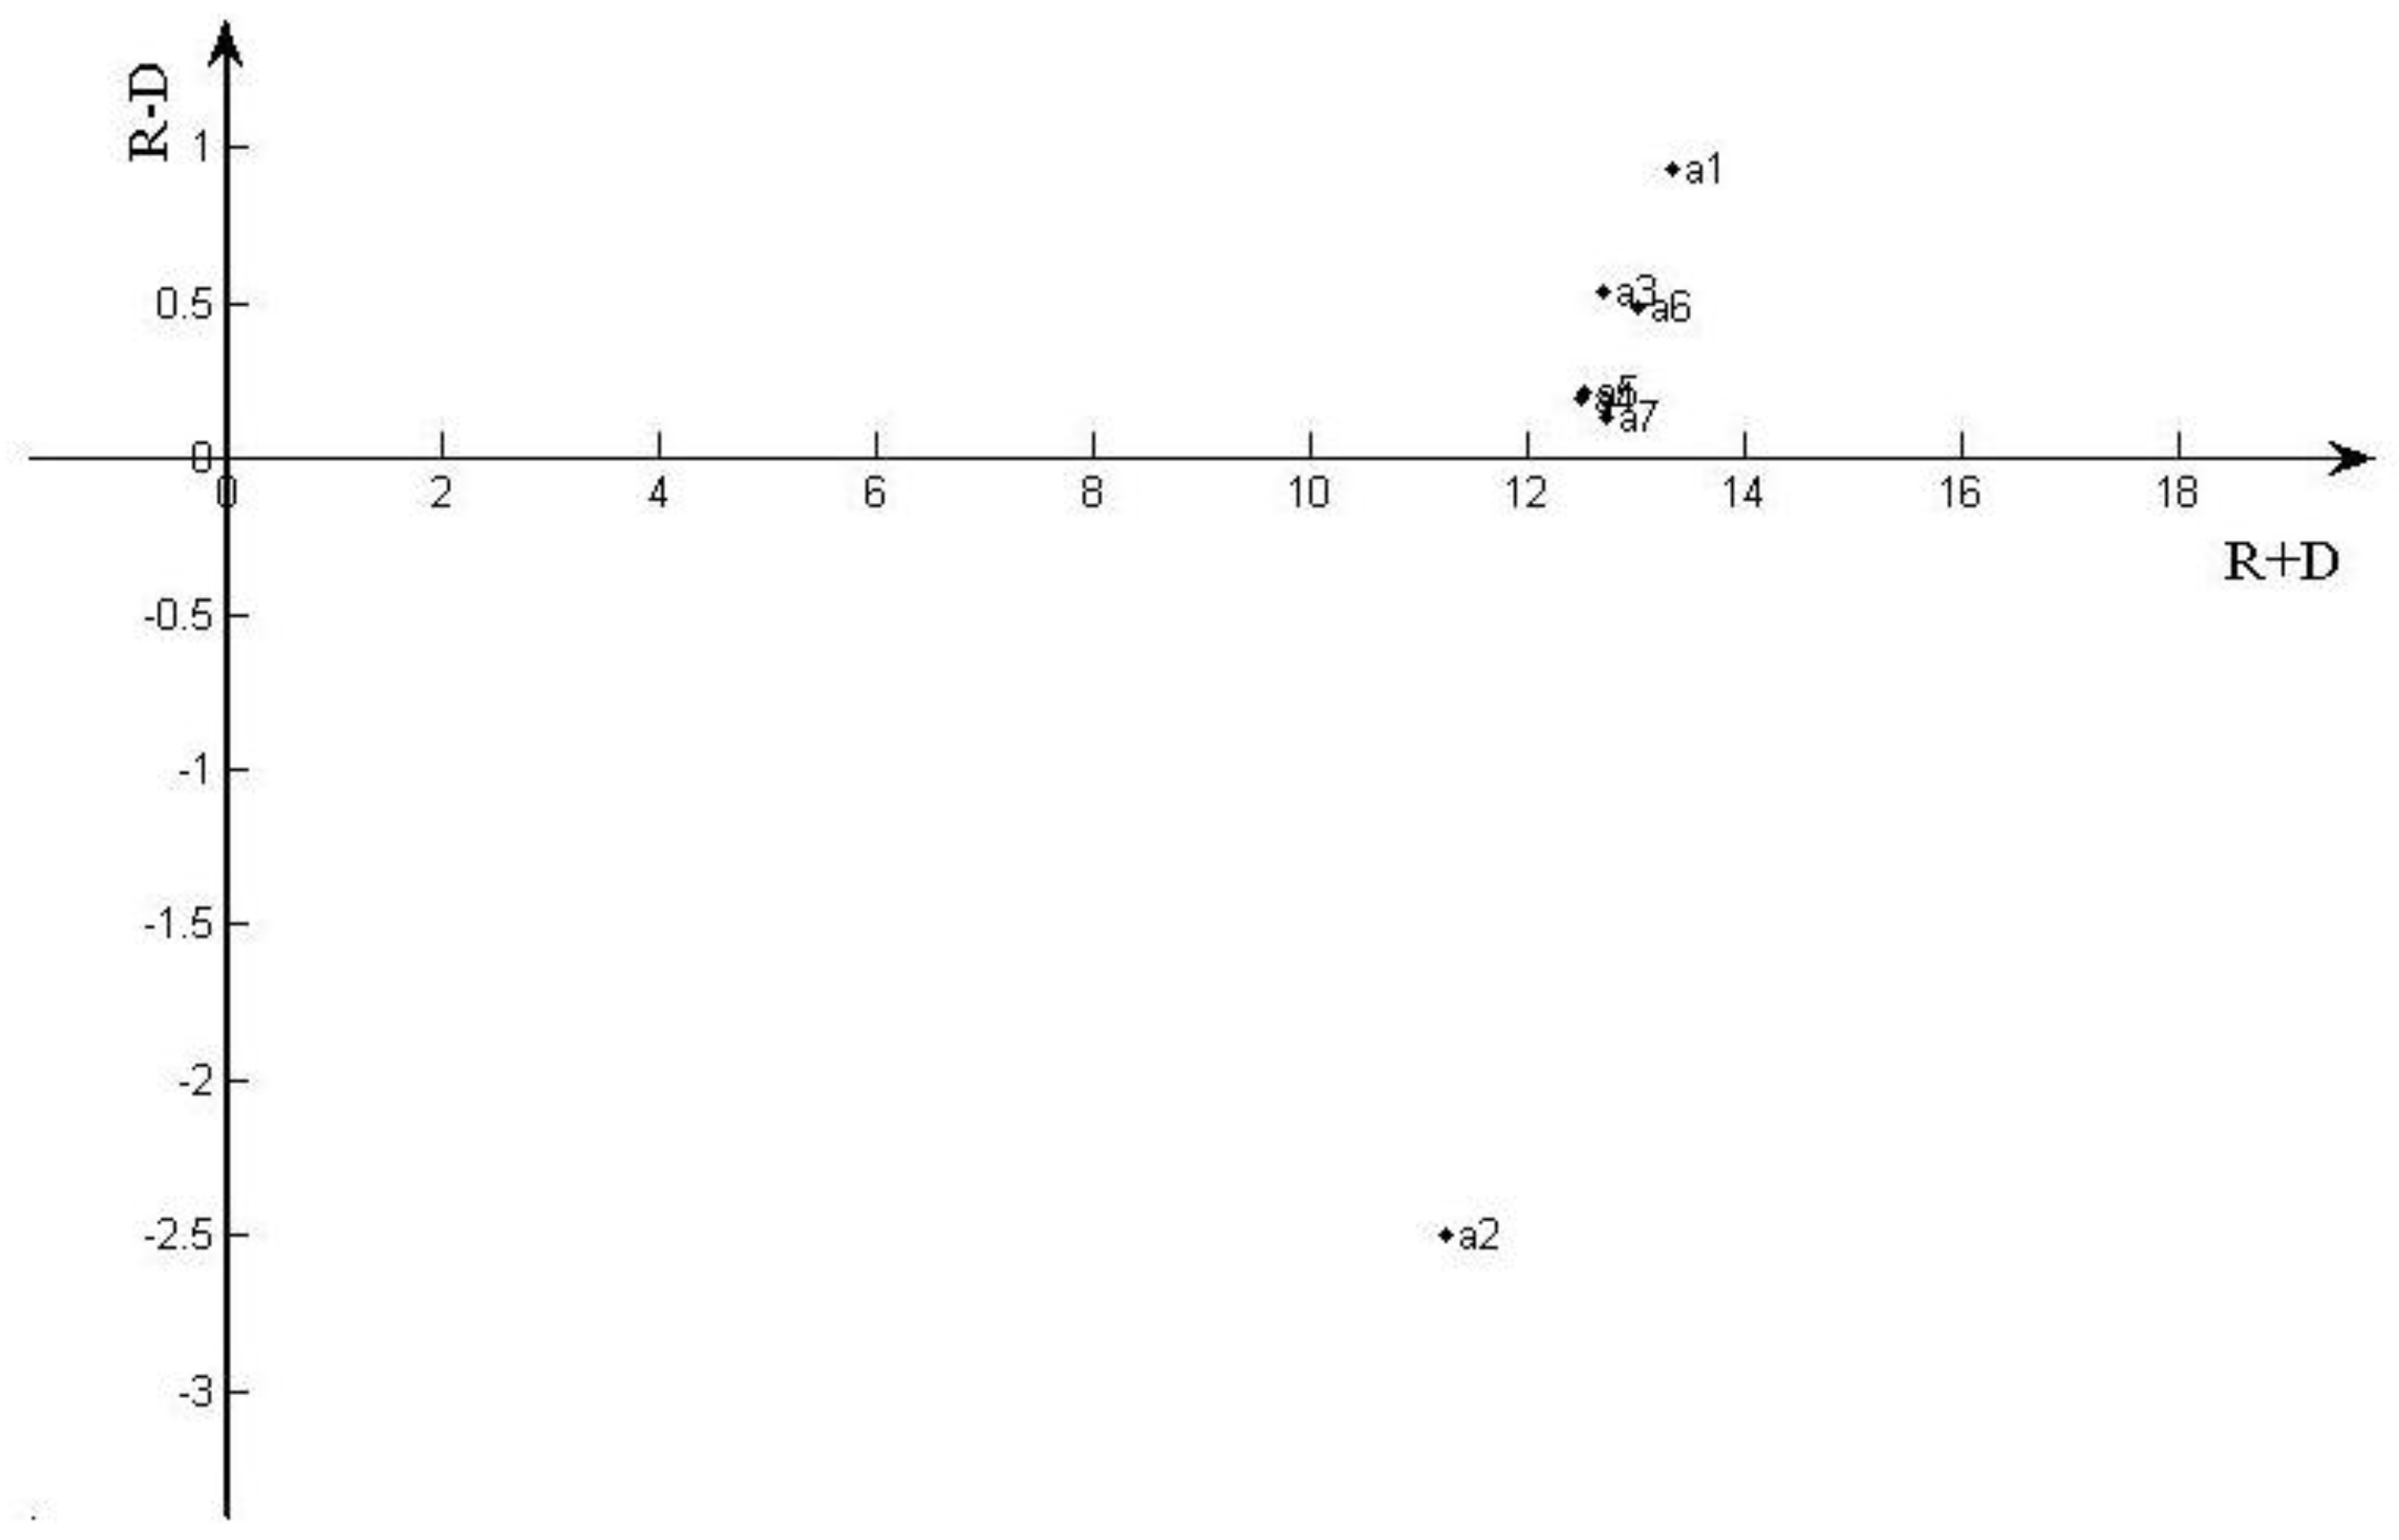
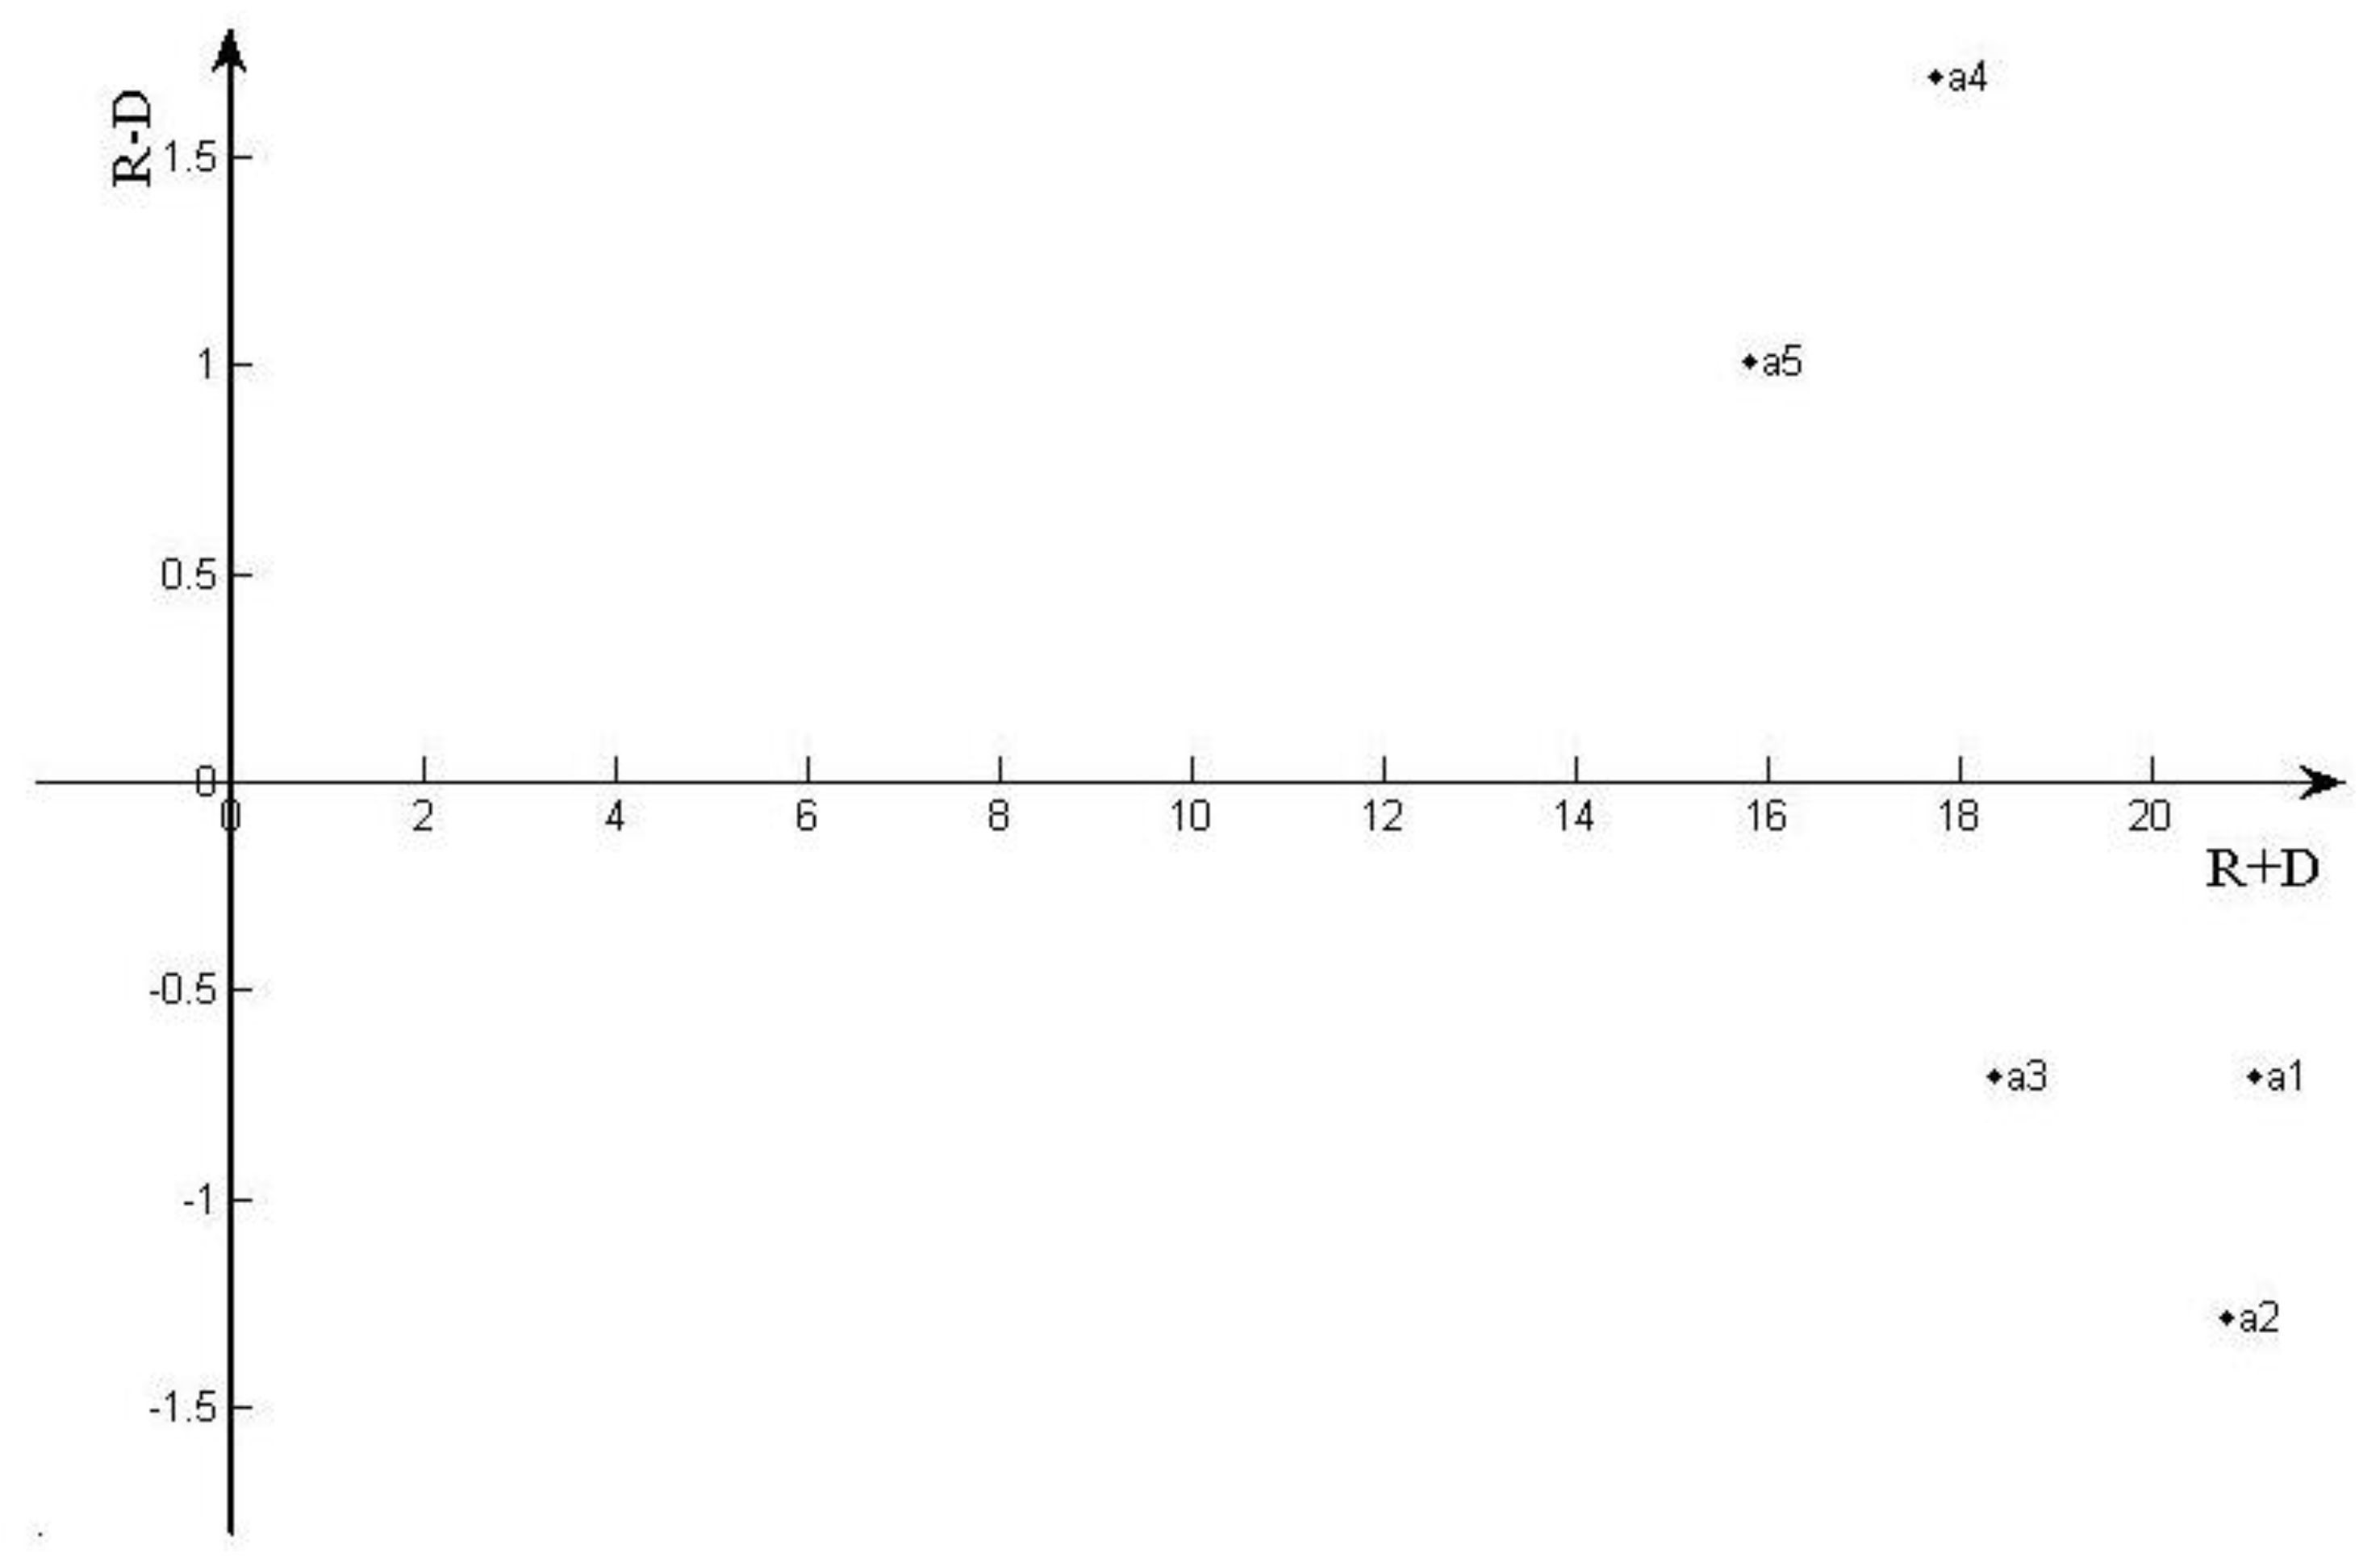
4.1. Results
4.2. Discussion of Results
4.2.1. Discussion of Results for Accommodation Sharing Drivers
4.2.2. Discussion of Results for Accommodation Sharing Barriers
5. Conclusions
Author Contributions
Funding
Conflicts of Interest
Appendix A

| Driver | D1 | D2 | D3 | D4 | D5 | D6 | D7 |
|---|---|---|---|---|---|---|---|
| D1 | 0 | 3 | 3 | 3 | 3 | 4 | 4 |
| D2 | 4 | 0 | 2 | 2 | 2 | 2 | 3 |
| D3 | 3 | 3 | 0 | 4 | 4 | 3 | 3 |
| D4 | 3 | 3 | 3 | 0 | 4 | 4 | 3 |
| D5 | 4 | 4 | 4 | 4 | 0 | 4 | 3 |
| D6 | 3 | 4 | 4 | 4 | 4 | 0 | 4 |
| D7 | 3 | 4 | 3 | 4 | 4 | 4 | 0 |
| Driver | D1 | D2 | D3 | D4 | D5 | D6 | D7 |
|---|---|---|---|---|---|---|---|
| D1 | 0 | 4 | 4 | 4 | 4 | 4 | 3 |
| D2 | 4 | 0 | 2 | 1 | 1 | 2 | 4 |
| D3 | 3 | 4 | 0 | 4 | 3 | 3 | 4 |
| D4 | 3 | 4 | 3 | 0 | 4 | 4 | 2 |
| D5 | 3 | 3 | 3 | 3 | 0 | 3 | 3 |
| D6 | 3 | 3 | 3 | 3 | 3 | 0 | 4 |
| D7 | 3 | 4 | 3 | 3 | 3 | 4 | 0 |
| Driver | D1 | D2 | D3 | D4 | D5 | D6 | D7 |
|---|---|---|---|---|---|---|---|
| D1 | 0 | 4 | 4 | 4 | 4 | 4 | 3 |
| D2 | 3 | 0 | 1 | 1 | 2 | 2 | 2 |
| D3 | 3 | 4 | 0 | 3 | 3 | 3 | 2 |
| D4 | 3 | 3 | 3 | 0 | 3 | 3 | 3 |
| D5 | 3 | 4 | 4 | 3 | 0 | 3 | 3 |
| D6 | 3 | 4 | 4 | 4 | 4 | 0 | 4 |
| D7 | 3 | 4 | 3 | 3 | 3 | 3 | 0 |
| Driver | D1 | D2 | D3 | D4 | D5 | D6 | D7 |
|---|---|---|---|---|---|---|---|
| D1 | 0 | 4 | 4 | 4 | 4 | 3 | 2 |
| D2 | 3 | 0 | 1 | 1 | 1 | 1 | 2 |
| D3 | 3 | 4 | 0 | 4 | 4 | 4 | 4 |
| D4 | 3 | 3 | 3 | 0 | 4 | 4 | 3 |
| D5 | 3 | 3 | 3 | 3 | 0 | 3 | 4 |
| D6 | 4 | 2 | 3 | 3 | 3 | 0 | 4 |
| D7 | 3 | 4 | 3 | 4 | 4 | 4 | 0 |
| Driver | D1 | D2 | D3 | D4 | D5 | D6 | D7 |
|---|---|---|---|---|---|---|---|
| D1 | 0 | 4 | 4 | 4 | 3 | 4 | 4 |
| D2 | 4 | 0 | 3 | 1 | 1 | 1 | 2 |
| D3 | 3 | 4 | 0 | 4 | 3 | 3 | 3 |
| D4 | 3 | 2 | 4 | 0 | 4 | 2 | 3 |
| D5 | 3 | 3 | 3 | 4 | 0 | 4 | 3 |
| D6 | 3 | 4 | 4 | 4 | 4 | 0 | 4 |
| D7 | 2 | 2 | 3 | 3 | 3 | 3 | 0 |
| Driver | D1 | D2 | D3 | D4 | D5 | D6 | D7 |
|---|---|---|---|---|---|---|---|
| D1 | 0.0000 | 3.8000 | 3.8000 | 3.8000 | 3.6000 | 3.8000 | 3.2000 |
| D2 | 3.6000 | 0.0000 | 1.8000 | 1.2000 | 1.4000 | 1.6000 | 2.6000 |
| D3 | 3.0000 | 3.8000 | 0.0000 | 3.8000 | 3.4000 | 3.2000 | 3.2000 |
| D4 | 3.0000 | 3.0000 | 3.2000 | 0.0000 | 3.8000 | 3.4000 | 2.8000 |
| D5 | 3.2000 | 3.4000 | 3.4000 | 3.4000 | 0.0000 | 3.4000 | 3.2000 |
| D6 | 3.2000 | 3.4000 | 3.6000 | 3.6000 | 3.6000 | 0.0000 | 4.0000 |
| D7 | 2.8000 | 3.6000 | 3.0000 | 3.4000 | 3.4000 | 3.6000 | 0.0000 |
| Driver | D1 | D2 | D3 | D4 | D5 | D6 | D7 |
|---|---|---|---|---|---|---|---|
| D1 | 0.0000 | 0.1727 | 0.1727 | 0.1727 | 0.1636 | 0.1727 | 0.1455 |
| D2 | 0.1636 | 0.0000 | 0.0818 | 0.0545 | 0.0636 | 0.0727 | 0.1182 |
| D3 | 0.1364 | 0.1727 | 0.0000 | 0.1727 | 0.1545 | 0.1455 | 0.1455 |
| D4 | 0.1364 | 0.1364 | 0.1455 | 0.0000 | 0.1727 | 0.1545 | 0.1273 |
| D5 | 0.1455 | 0.1545 | 0.1545 | 0.1545 | 0.0000 | 0.1545 | 0.1455 |
| D6 | 0.1455 | 0.1545 | 0.1636 | 0.1636 | 0.1636 | 0.0000 | 0.1818 |
| D7 | 0.1273 | 0.1636 | 0.1364 | 0.1545 | 0.1545 | 0.1636 | 0.0000 |


Appendix B
| Barrier | B1 | B2 | B3 | B4 | B5 |
|---|---|---|---|---|---|
| B1 | 0 | 4 | 3 | 3 | 4 |
| B2 | 4 | 0 | 4 | 3 | 2 |
| B3 | 4 | 4 | 0 | 2 | 2 |
| B4 | 4 | 4 | 4 | 0 | 2 |
| B5 | 4 | 4 | 2 | 2 | 0 |
| Barrier | B1 | B2 | B3 | B4 | B5 |
|---|---|---|---|---|---|
| B1 | 0 | 3 | 3 | 4 | 4 |
| B2 | 4 | 0 | 4 | 3 | 1 |
| B3 | 4 | 4 | 0 | 1 | 1 |
| B4 | 3 | 3 | 4 | 0 | 1 |
| B5 | 4 | 4 | 1 | 1 | 0 |
| Barrier | B1 | B2 | B3 | B4 | B5 |
|---|---|---|---|---|---|
| B1 | 0 | 4 | 4 | 2 | 2 |
| B2 | 3 | 0 | 3 | 4 | 1 |
| B3 | 3 | 3 | 0 | 1 | 1 |
| B4 | 3 | 3 | 3 | 0 | 1 |
| B5 | 3 | 3 | 1 | 1 | 0 |
| Barrier | B1 | B2 | B3 | B4 | B5 |
|---|---|---|---|---|---|
| B1 | 0 | 4 | 3 | 3 | 4 |
| B2 | 4 | 0 | 3 | 3 | 2 |
| B3 | 4 | 4 | 0 | 2 | 2 |
| B4 | 3 | 4 | 3 | 0 | 1 |
| B5 | 4 | 4 | 2 | 2 | 0 |
| Barrier | B1 | B2 | B3 | B4 | B5 |
|---|---|---|---|---|---|
| B1 | 0 | 3 | 2 | 4 | 3 |
| B2 | 4 | 0 | 4 | 3 | 3 |
| B3 | 3 | 4 | 0 | 2 | 3 |
| B4 | 3 | 4 | 4 | 0 | 3 |
| B5 | 2 | 2 | 2 | 2 | 0 |
| Barrier | B1 | B2 | B3 | B4 | B5 |
|---|---|---|---|---|---|
| B1 | 0.0000 | 3.6000 | 3.0000 | 3.2000 | 3.4000 |
| B2 | 3.8000 | 0.0000 | 3.6000 | 3.2000 | 1.8000 |
| B3 | 3.6000 | 3.8000 | 0.0000 | 1.6000 | 1.8000 |
| B4 | 3.2000 | 3.6000 | 3.6000 | 0.0000 | 1.6000 |
| B5 | 3.4000 | 3.4000 | 1.6000 | 1.6000 | 0.0000 |
| Barrier | B1 | B2 | B3 | B4 | B5 |
|---|---|---|---|---|---|
| B1 | 0.0000 | 0.2727 | 0.2273 | 0.2424 | 0.2576 |
| B2 | 0.2879 | 0.0000 | 0.2727 | 0.2424 | 0.1364 |
| B3 | 0.2727 | 0.2879 | 0.0000 | 0.1212 | 0.1364 |
| B4 | 0.2424 | 0.2727 | 0.2727 | 0.0000 | 0.1212 |
| B5 | 0.2576 | 0.2576 | 0.1212 | 0.1212 | 0.0000 |


References
- Mastercard. The Sharing Economy: Understanding the Opportunities for Growth. Available online: https://newsroom.mastercard.com/eu/files/2017/06/Mastercard_Sharing-Economy_v7.compressed2.pdf (accessed on 10 April 2019).
- World Economic Forum. Digital Transformation Initiative: Aviation, Travel and Tourism Industry. Available online: http://reports.weforum.org/digital-transformation/wp-content/blogs.dir/94/mp/files/pages/files/wef-dti-aviation-travel-and-tourism-white-paper.pdf (accessed on 11 April 2019).
- European Parliament. Tourism and the Sharing Economy. Available online: http://www.europarl.europa.eu/RegData/etudes/BRIE/2017/595897/EPRS_BRI (accessed on 20 March 2019).
- Goudin, P. The Cost of Non-Europe in the Sharing Economy: Economic, Social and Legal Challenges and Opportunities; European Parliament: Brussels, Belgium, 2016. [Google Scholar]
- Flash Eurobarometer 438. The Use of Collaborative Platforms; European Commission: Brussels, Belgium, 2016. [Google Scholar]
- Department of Tourism and Commerce Marketing. Holiday Home Services. Available online: https://www.visitdubai.com/en/department-of-tourism/our-services/holiday-homes-services (accessed on 20 April 2019).
- Arabian Business. Revealed: Where to Find Airbnb’s best Performing Dubai Property. Available online: https://www.arabianbusiness.com/travel-hospitality/413199-revealed-where-to-find-airbnbs-best-performing-dubai-property (accessed on 19 April 2019).
- Hotelier Middle East. Report Reveals that Dubai’s Airbnb Market Is Worth Over US$101m. Available online: https://www.hoteliermiddleeast.com/35042-report-reveals-that-dubais-airbnb-market-is-worth-over-us101m (accessed on 19 April 2019).
- Gulf News. Dubai’s Landlords Find the Airbnb Option Is Paying Off. Available online: https://gulfnews.com/business/property/dubais-landlords-find-the-airbnb-option-is-paying-off-1.61983642 (accessed on 12 May 2019).
- Sung, E.; Kim, H.; Lee, D. Why Do People Consume and Provide Sharing Economy Accommodation?—A Sustainability Perspective. Sustainability 2018, 10, 2072. [Google Scholar] [CrossRef]
- Prayag, G.; Ozanne, L.K. A systematic review of peer-to-peer (P2P) accommodation sharing research from 2010 to 2016: progress and prospects from the multi-level perspective. J. Hosp. Market. Manag. 2018, 27, 649–678. [Google Scholar] [CrossRef]
- Dredge, D.; Gyimóthy, S.; Birkbak, A.; Elgaard Jensen, T.; Madsen, A. The Impact of Regulatory Approaches Targeting Collaborative Economy in the Tourism Accommodation Sector: Barcelona, Berlin, Amsterdam and Paris. Impulse Pap. 2016, 1, 1–52. [Google Scholar]
- Fang, B.; Ye, Q.; Law, R. Effect of Sharing Economy on Tourism Industry Employment. Ann. Tour. Res. 2016, 57, 264–267. [Google Scholar] [CrossRef]
- Zhang, T.C.; Gu, H.; Jahromi, M.F. What Makes the Sharing Economy Successful? An Empirical Examination of Competitive Customer Value Propositions. Comput. Hum. Behav. 2019, 95, 275–283. [Google Scholar] [CrossRef]
- Tussyadiah, I.P.; Pesonen, J. Drivers and Barriers of Peer-to-Peer Accommodation Stay–an Exploratory Study with American and Finnish Travellers. Curr. Issues Tour. 2018, 21, 703–720. [Google Scholar] [CrossRef]
- Wu, X.; Shen, J. A Study on Airbnb’s Trust Mechanism and the Effects of Cultural Values—Based on a Survey of Chinese Consumers. Sustainability 2018, 10, 3041. [Google Scholar] [CrossRef]
- Hamari, J.; Sjöklint, M.; Ukkonen, A. The Sharing Economy: Why People Participate in Collaborative Consumption. J. Assoc. Inf. Sci. Technol. 2016, 67, 2047–2059. [Google Scholar] [CrossRef]
- Böcker, L.; Meelen, T. Sharing for People, Planet or Profit? Analyzing Motivations for Intended Sharing Economy Participation. Environ. Innov. Soc. Transit. 2017, 23, 28–39. [Google Scholar] [CrossRef]
- PwC. Sharing or Paring? Growth of the Sharing Economy. Available online: https://www.pwc.com/hu/en/kiadvanyok/assets/pdf/sharing-economy-en.pdf (accessed on 12 April 2019).
- Cohen, B.; Munoz, P. Sharing Cities and Sustainable Consumption and Production: Towards an Integrated Framework. J. Clean. Prod. 2016, 134, 87–97. [Google Scholar] [CrossRef]
- Demailly, D.; Novel, A.-S. The Sharing Economy: Make It Sustainable. Studies 2014, 3, 14–30. [Google Scholar]
- Botsman, R.; Rogers, R. What’s Mine Is Yours: How Collaborative Consumption Is Changing the Way We Live; Collins: London, UK, 2011; Volume 5. [Google Scholar]
- Belk, R. You Are What You Can Access: Sharing and Collaborative Consumption Online. J. Bus. Res. 2014, 67, 1595–1600. [Google Scholar] [CrossRef]
- Bardhi, F.; Eckhardt, G.M. Access-Based Consumption: The Case of Car Sharing. J. Consum. Res. 2012, 39, 881–898. [Google Scholar] [CrossRef]
- Owyang, J. The Collaborative Economy. Altimeter 2013, 1, 28. [Google Scholar]
- Haley, R.I. Benefit Segmentation: A Decision-Oriented Research Tool. Mark. Manag. 1995, 4, 59. [Google Scholar]
- Pesonen, J.A. Segmentation of Rural Tourists: Combining Push and Pull Motivations. Tour. Hosp. Manag. 2012, 18, 69–82. [Google Scholar]
- Frenken, K.; Schor, J. Putting the Sharing Economy into Perspective. Environ. Innov. Soc. Transit. 2017, 23, 3–10. [Google Scholar] [CrossRef]
- Frenken, K.; Meelen, T.; Arets, M.; Van de Glind, P. Smarter Regulation for the Sharing Economy. Available online: https://www.theguardian.com/science/political-science/2015/may/20/smarter-regulation-for-the-sharing-economy (accessed on 12 April 2019).
- Ertz, M.; Durif, F.; Arcand, M. Collaborative Consumption: Conceptual Snapshot at a Buzzword. J. Entrep. Educ. 2016, 19, 1–23. [Google Scholar] [CrossRef]
- Ertz, M.; Durif, F.; Lecompte, A.; Boivin, C. Does “Sharing” Mean “Socially Responsible Consuming”? Exploration of the Relationship Between Collaborative Consumption and Socially Responsible Consumption. J. Consum. Mark. 2018, 35, 392–402. [Google Scholar] [CrossRef]
- Munoz, P.; Cohen, B. Mapping out the Sharing Economy: A Configurational Approach to Sharing Business Modeling. Technol. Forecast. Soc. Chang. 2017, 125, 21–37. [Google Scholar] [CrossRef]
- Acquier, A.; Daudigeos, T.; Pinkse, J. Promises and Paradoxes of the Sharing Economy: An Organizing Framework. Technol. Forecast. Soc. Chang. 2017, 125, 1–10. [Google Scholar] [CrossRef]
- Alrawadieh, Z.; Alrawadieh, Z. Exploring Entrepreneurship in the Sharing Accommodation Sector: Empirical Evidence from a Developing Country. Tour. Manag. Perspect. 2018, 28, 179–188. [Google Scholar] [CrossRef]
- Tussyadiah, I.P.; Pesonen, J. Impacts of Peer-To-Peer Accommodation Use on Travel Patterns. J. Travel Res. 2016, 55, 1022–1040. [Google Scholar] [CrossRef]
- Kim, D.; Perdue, R.R. The Effects of Cognitive, Affective, and Sensory Attributes on Hotel Choice. Int. J. Hosp. Manag. 2013, 35, 246–257. [Google Scholar] [CrossRef]
- Sohrabi, B.; Vanani, I.R.; Tahmasebipur, K.; Fazli, S. An Exploratory Analysis of Hotel Selection Factors: A Comprehensive Survey of Tehran Hotels. Int. J. Hosp. Manag. 2012, 31, 96–106. [Google Scholar] [CrossRef]
- Wong, K.K.; Chi-Yung, L. Predicting Hotel Choice Decisions and Segmenting Hotel Consumers: A Comparative Assessment of a Recent Consumer Based Approach. J. Travel Tour. Mark. 2002, 11, 17–33. [Google Scholar] [CrossRef]
- Guttentag, D. Airbnb: Disruptive Innovation and the Rise of an Informal Tourism Accommodation Sector. Curr. Issues Tour. 2015, 18, 1192–1217. [Google Scholar] [CrossRef]
- Yang, S.; Song, Y.; Chen, S.; Xia, X. Why Are Customers Loyal in Sharing-Economy Services? A Relational Benefits Perspective. J. Serv. Mark. 2017, 31, 48–62. [Google Scholar] [CrossRef]
- Shuqair, S.; Pinto, D.C.; Mattila, A.S. Benefits of Authenticity: Post-Failure Loyalty in the Sharing Economy. Ann. Tour. Res. 2019, 78, 102741. [Google Scholar] [CrossRef]
- Wang, N. Rethinking Authenticity in Tourism Experience. Ann. Tour. Res. 1999, 26, 349–370. [Google Scholar] [CrossRef]
- Yeoman, I.; Brass, D.; McMahon-Beattie, U. Current Issue in Tourism: The Authentic Tourist. Tour. Manag. 2007, 28, 1128–1138. [Google Scholar] [CrossRef]
- Cohen, S.A. Chasing a Myth? Searching for ‘Self’Through Lifestyle Travel. Tour. Stud. 2010, 10, 117–133. [Google Scholar] [CrossRef]
- Sims, R. Food, Place and Authenticity: Local Food and the Sustainable Tourism Experience. J. Sustain. Tour. 2009, 17, 321–336. [Google Scholar] [CrossRef]
- Tung, V.W.S.; Ritchie, J.B. Exploring the Essence of Memorable Tourism Experiences. Ann. Tour. Res. 2011, 38, 1367–1386. [Google Scholar] [CrossRef]
- Lashley, C.; Lynch, P.; Morrison, A.J. Hospitality: A Social Lens; Elsevier: Amsterdam, The Netherlands, 2007. [Google Scholar]
- Week, L. I Am Not a Tourist: Aims and Implications of “Traveling”. Tour. Stud. 2012, 12, 186–203. [Google Scholar] [CrossRef]
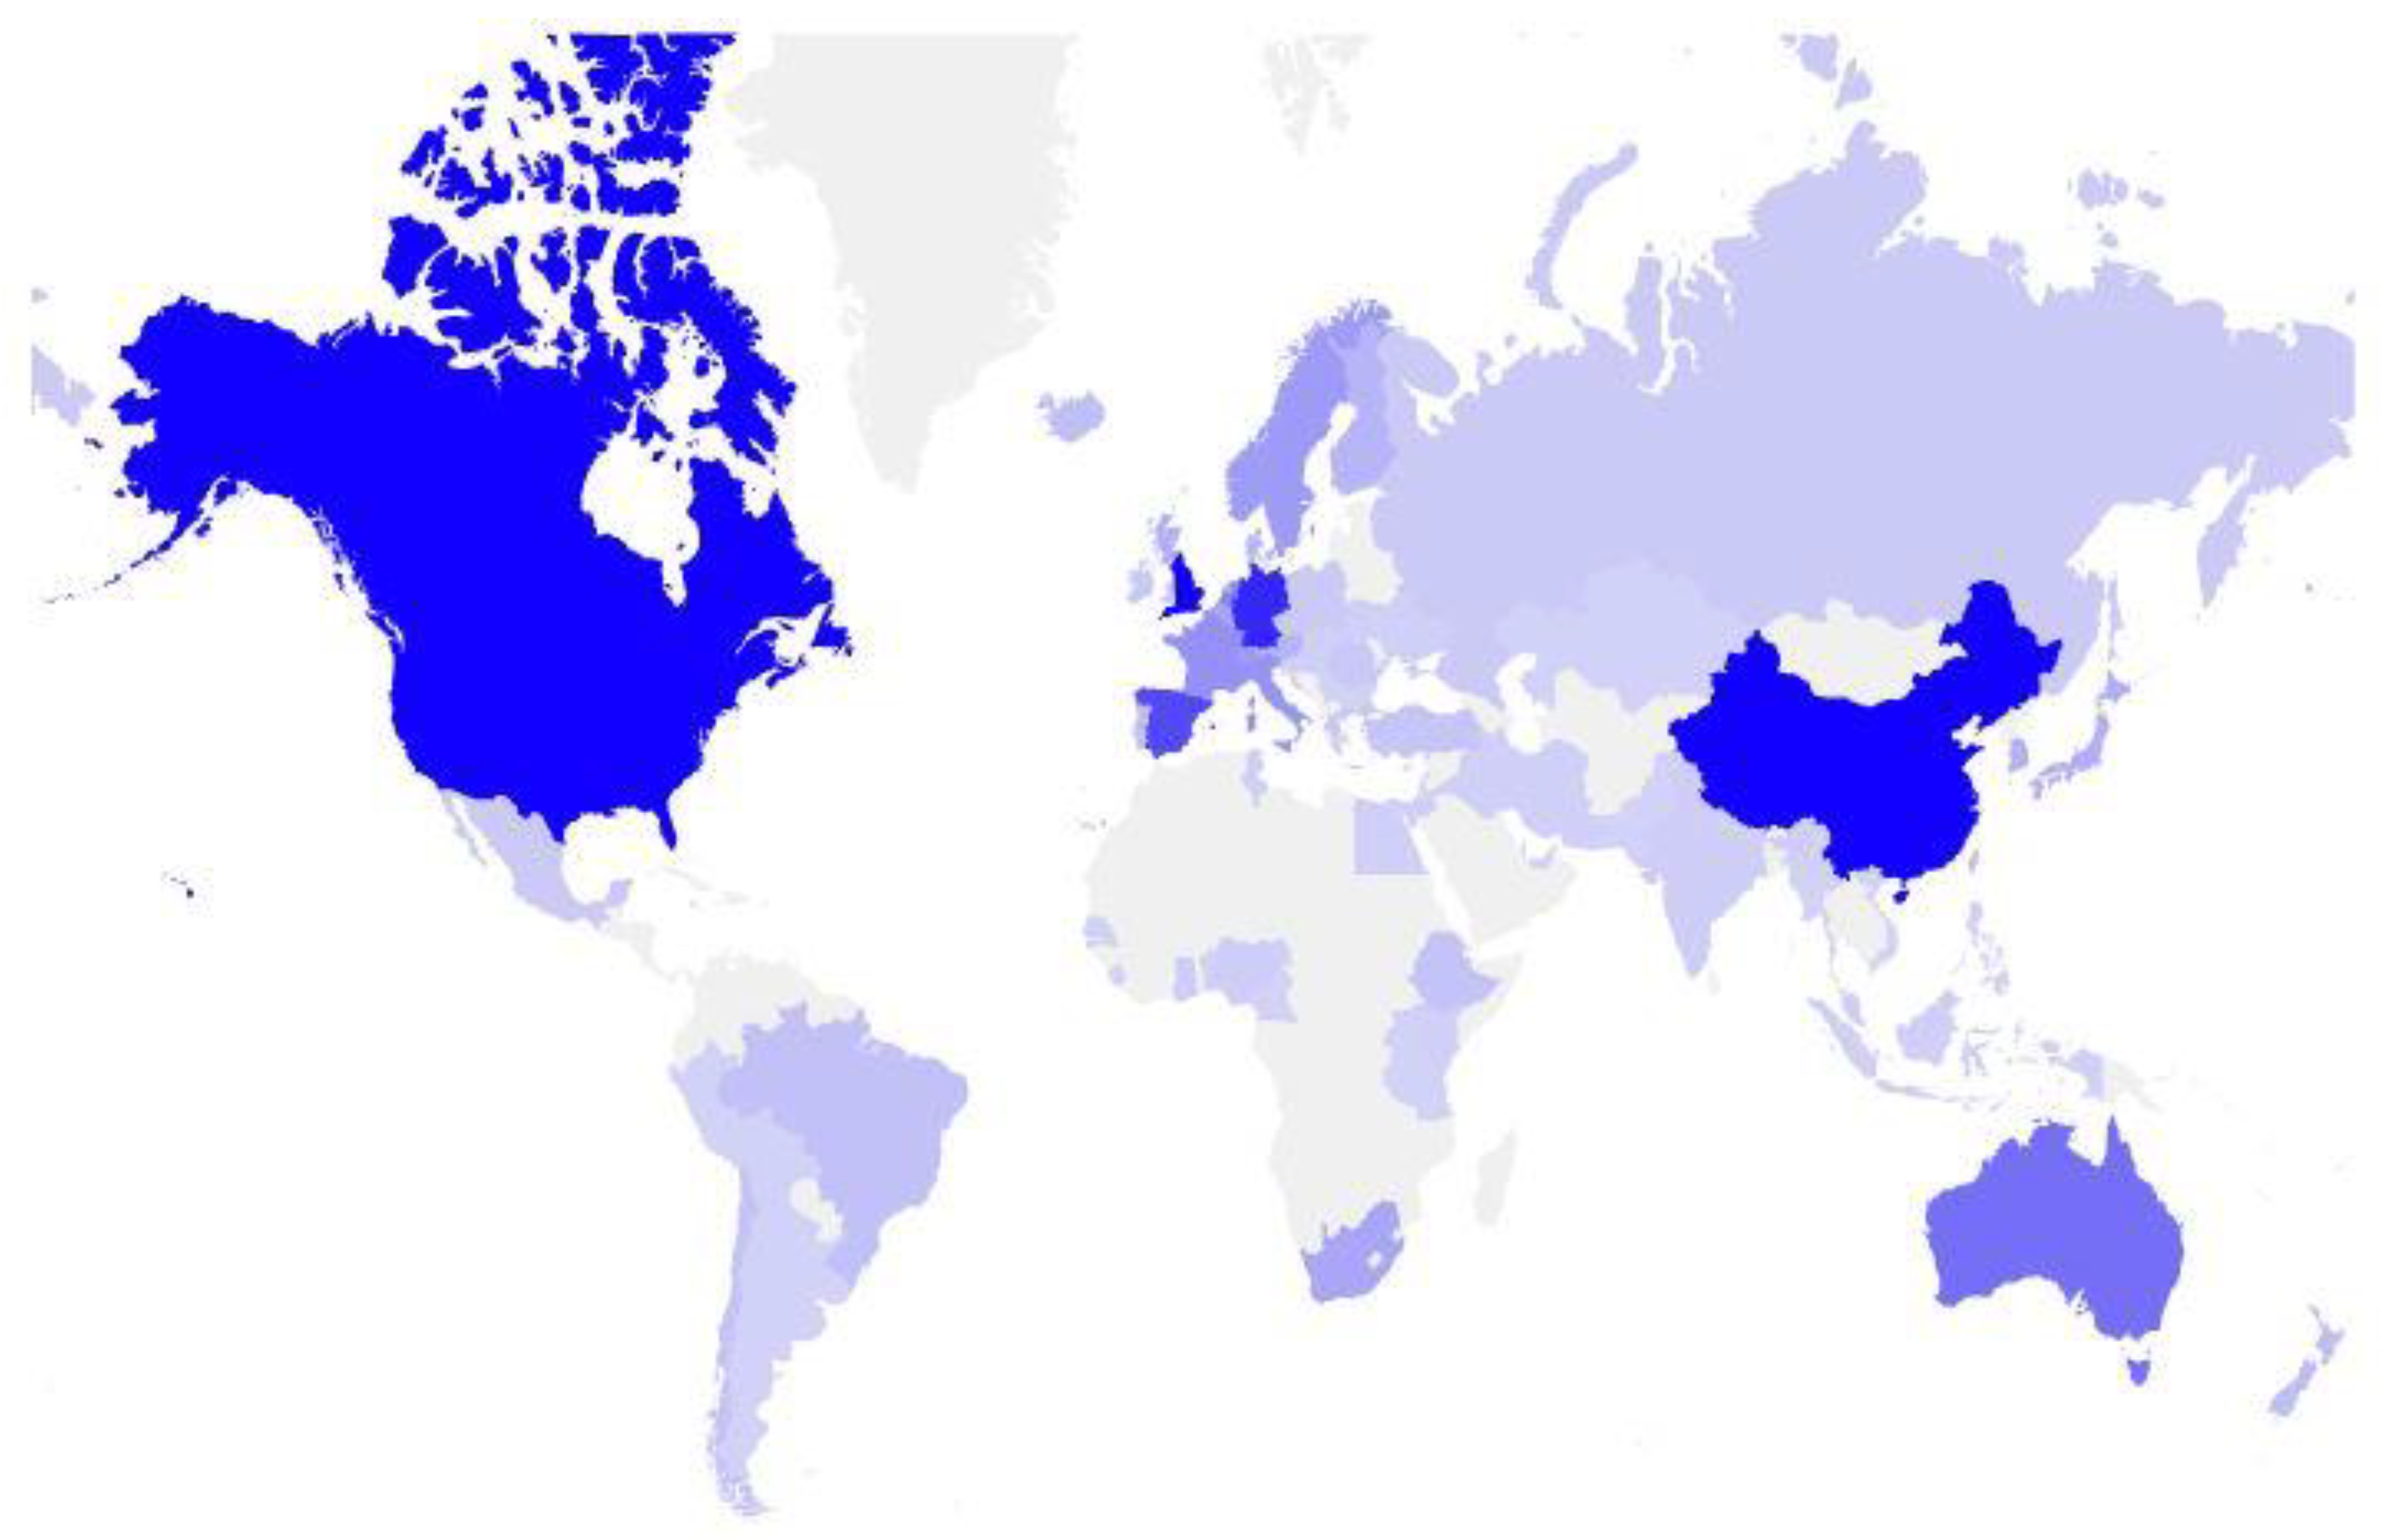
- Zupic, I.; Čater, T. Bibliometric Methods in Management and Organization. Organ. Res. Methods 2015, 18, 429–472. [Google Scholar] [CrossRef]
- Fahimnia, B.; Tang, C.S.; Davarzani, H.; Sarkis, J. Quantitative Models for Managing Supply Chain Risks: A Review. Eur. J. Oper. Res. 2015, 247, 1–15. [Google Scholar] [CrossRef]
- Archambault, É.; Campbell, D.; Gingras, Y.; Larivière, V. Comparing Bibliometric Statistics Obtained from the Web of Science and Scopus. J. Am. Soc. Inf. Sci. Technol. 2009, 60, 1320–1326. [Google Scholar] [CrossRef]
- Thomson Reuters. Social Sciences Citation Index. Available online: https://clarivate.com/webofsciencegroup/solutions/web-of-science/ (accessed on 15 December 2018).
- Lockett, A.; Moon, J.; Visser, W. Corporate Social Responsibility in Management Research: Focus, Nature, Salience and Sources of Influence. J. Manag. Stud. 2006, 43, 115–136. [Google Scholar] [CrossRef]
- OpenHeatMap. Turn Your Spreadsheet into a Map. Available online: http://www.openheatmap.com/ (accessed on 3 April 2018).
- Knutas, A.; Hajikhani, A.; Salminen, J.; Ikonen, J.; Porras, J. Cloud-Based Bibliometric Analysis Service for Systematic Mapping Studies. In Proceedings of Proceedings of the 16th International Conference on Computer Systems and Technologies, Dublin, Ireland, 25–26 June 2015; pp. 184–191. [Google Scholar]
- Kolle, S.R.; Shankarappa, T.; Manjunatha Reddy, T.; Muniyappa, A. Scholarly Communication in the International Journal of Pest Management: A Bibliometric Analysis from 2005 to 2014. J. Agric. Food Inf. 2015, 16, 301–314. [Google Scholar] [CrossRef]
- Juho Salminen, A.K.; Hajikhani, A. HAMMER—Create New Analysis Job. Available online: http://nailsproject.net/ (accessed on 17 February 2019).
- Hansen Henten, A.; Maria Windekilde, I. Transaction Costs and the Sharing Economy. info 2016, 18, 1–15. [Google Scholar] [CrossRef]
- Reinhold, S.; Dolnicar, S. How Airbnb Creates Value. In Peer-to-Peer Accommodation Networks; Goodfellow Publishers: Oxford, UK; pp. 39–53.
- Oskam, J.; Boswijk, A. Airbnb: The Future of Networked Hospitality Businesses. J. Tour. Futures 2016, 2, 22–42. [Google Scholar] [CrossRef]
- Sigala, M. Market Formation in the Sharing Economy: Findings and Implications from the Sub-Economies of Airbnb. In Social Dynamics in a Systems Perspective; Springer: Cham, Switzerland, 2018; pp. 159–174. [Google Scholar]
- Mody, M.A.; Suess, C.; Lehto, X. The Accommodation Experiencescape: A Comparative Assessment of Hotels and Airbnb. Int. J. Contemp. Hosp. Manag. 2017, 29, 2377–2404. [Google Scholar] [CrossRef]
- Gansky, L. The Mesh: Why the Future of Business Is Sharing; Penguin Publishing Group: London, UK, 2010. [Google Scholar]
- Lamberton, C.P.; Rose, R.L. When Is Ours Better Than Mine? A Framework for Understanding and Altering Participation in Commercial Sharing Systems. J. Mark. 2012, 76, 109–125. [Google Scholar] [CrossRef]
- Sacks, D. The Sharing Economy. Fast Co. 2011, 2, 155. [Google Scholar]
- Pesonen, J.; Tussyadiah, I. Peer-To-Peer Accommodation: Drivers and User Profiles. In Collaborative Economy and Tourism; Springer: Cham, Switzerland, 2017; pp. 285–303. [Google Scholar]
- Gössling, S.; Michael Hall, C. Sharing Versus Collaborative Economy: How to Align Ict Developments and the Sdgs in Tourism? J. Sustain. Tour. 2019, 27, 74–96. [Google Scholar] [CrossRef]
- Palgan, Y.V.; Zvolska, L.; Mont, O. Sustainability Framings of Accommodation Sharing. Environ. Innov. Soc. Trans. 2017, 23, 70–83. [Google Scholar] [CrossRef]
- Tussyadiah, I.P. Factors of Satisfaction and Intention to Use Peer-To-Peer Accommodation. Int. J. Hosp. Manag. 2016, 55, 70–80. [Google Scholar] [CrossRef]
- Zvolska, L. Sustainability Potentials of the Sharing Economy: The Case of Accommodation Sharing Platforms; Lund University: Lund, Sweden, 2015. [Google Scholar]
- Martin, C.J. The Sharing Economy: A Pathway to Sustainability or a Nightmarish Form of Neoliberal Capitalism? Ecol. Econ. 2016, 121, 149–159. [Google Scholar] [CrossRef]
- Celata, F.; Hendrickson, C.Y.; Sanna, V.S. The Sharing Economy as Community Marketplace? Trust, Reciprocity and Belonging in Peer-To-Peer Accommodation Platforms. Camb. J. Reg. Econ. Soc. 2017, 10, 349–363. [Google Scholar] [CrossRef]
- Celata, F.; Ribera-Fumaz, R.; Hendrickson, C.; Sanna, V. From Community-Minded to Profit-Oriented? Critical Geographies of the Sharing Economy. In Proceedings of the first international workshop on the sharing economy, Utrecht, The Netherlands, 4–5 June 2015; pp. 4–5. [Google Scholar]
- Roelofsen, M. Exploring the Socio-Spatial Inequalities of Airbnb in Sofia, Bulgaria. Erdekunde 2018, 72, 313–327. [Google Scholar] [CrossRef]
- Katrini, E. Sharing Culture: On Definitions, Values, and Emergence. Sociol. Rev. 2018, 66, 425–446. [Google Scholar] [CrossRef]
- Kim, S.; Lee, K.Y.; Koo, C.; Yang, S.-B. Examining the Influencing Factors of Intention to Share Accommodations in Online Hospitality Exchange Networks. J. Travel Tour. Mark. 2018, 35, 16–31. [Google Scholar] [CrossRef]
- Lyu, J.; Li, M.; Law, R. Experiencing P2P Accommodations: Anecdotes from Chinese Customers. Int. J. Hosp. Manag. 2019, 77, 323–332. [Google Scholar] [CrossRef]
- Munar, A.M.; Jacobsen, J.K.S. Motivations for Sharing Tourism Experiences Through Social Media. Tour. Manag. 2014, 43, 46–54. [Google Scholar] [CrossRef]
- Möhlmann, M. Collaborative Consumption: Determinants of Satisfaction and the Likelihood of Using a Sharing Economy Option Again. J. Consum. Behav. 2015, 14, 193–207. [Google Scholar] [CrossRef]
- Barnes, S.J.; Mattsson, J. Understanding Current and Future Issues in Collaborative Consumption: A Four-Stage Delphi Study. Technol. Forecast. Soc. Chang. 2016, 104, 200–211. [Google Scholar] [CrossRef]
- Benoit, S.; Baker, T.L.; Bolton, R.N.; Gruber, T.; Kandampully, J. A Triadic Framework for Collaborative Consumption (Cc): Motives, Activities and Resources & Capabilities of Actors. J. Bus. Res. 2017, 79, 219–227. [Google Scholar]
- Guyader, H. No One Rides for Free! Three Styles of Collaborative Consumption. J. Serv. Mark. 2018, 32, 692–714. [Google Scholar] [CrossRef]
- Martin, M.; Lazarevic, D.; Gullström, C. Assessing the Environmental Potential of Collaborative Consumption: Peer-to-Peer Product Sharing in Hammarby Sjöstad, Sweden. Sustainability 2019, 11, 190. [Google Scholar] [CrossRef]
- Abramova, O.; Krasnova, H.; Tan, C.-W. How Much Will You Pay? Understanding the Value of Information Cues in the Sharing Economy. In Proceedings of the 25th European Conference on Information Systems (ECIS), Guimarães, Portugal, 5–10 June 2017. [Google Scholar]
- Forgacs, G.; Dimanche, F. Revenue Challenges for Hotels in the Sharing Economy: Facing the Airbnb Menace. J. Revenue Pricing Manag. 2016, 15, 509–515. [Google Scholar] [CrossRef]
- Hyvärinen, H. Motives and Barriers for Engaging in Collaborative Consumption in Finland. Master’s Thesis, Lappeenranta University of Technology, Helsinki, Finland, 2016. [Google Scholar]
- Albinsson, P.A.; Yasanthi Perera, B. Alternative Marketplaces in the 21st Century: Building Community Through Sharing Events. J. Consum. Behav. 2012, 11, 303–315. [Google Scholar] [CrossRef]
- Luchs, M.G.; Naylor, R.W.; Rose, R.L.; Catlin, J.R.; Gau, R.; Kapitan, S.; Mish, J.; Ozanne, L.; Phipps, M.; Simpson, B. Toward a Sustainable Marketplace: Expanding Options and Benefits for Consumers. J. Res. Consum. 2011, 19, 1–12. [Google Scholar]
- Walsh, B. Today’s Smart Choice: Don’t Own. Share. Time Int. 2011, 1, 49. [Google Scholar]
- Piscicelli, L.; Cooper, T.; Fisher, T. The Role of Values in Collaborative Consumption: Insights from a Product-Service System for Lending and Borrowing in the UK. J. Clean. Prod. 2015, 97, 21–29. [Google Scholar] [CrossRef]
- Piscicelli, L.; Ludden, G.D.; Cooper, T. What Makes a Sustainable Business Model Successful? an Empirical Comparison of Two Peer-To-Peer Goods-Sharing Platforms. J. Clean. Prod. 2018, 172, 4580–4591. [Google Scholar] [CrossRef]
- Ye, S.; Ying, T.; Zhou, L.; Wang, T. Enhancing Customer Trust in Peer-To-Peer Accommodation: A “Soft” Strategy via Social Presence. Int. J. Hosp. Manag. 2019, 79, 1–10. [Google Scholar] [CrossRef]
- Molz, J.G. Couchsurfing and Network Hospitality: ‘It’s Not Just About the Furniture’. Hosp. Soc. 2012, 1, 215–225. [Google Scholar] [CrossRef]
- Richard, B.; Cleveland, S. The Future of Hotel Chains: Branded Marketplaces Driven by the Sharing Economy. J. Vacat. Mark. 2016, 22, 239–248. [Google Scholar] [CrossRef]
- Brotherton, B. Towards a Definitive View of the Nature of Hospitality and Hospitality Management. Int. J. Contemp. Hosp. Manag. 1999, 11, 165–173. [Google Scholar] [CrossRef]
- Guttentag, D.; Smith, S.; Potwarka, L.; Havitz, M. Why Tourists Choose Airbnb: A Motivation-Based Segmentation Study. J. Travel Res. 2018, 57, 342–359. [Google Scholar] [CrossRef]
- Guttentag, D.; Smith, S.; Potwarka, L.; Havitz, M. Assessing Airbnb as a Disruptive Innovation Relative to Hotels: Substitution and Comparative Performance Expectations. J. Travel Res. 2018, 57, 342–359. [Google Scholar] [CrossRef]
- Olson, K. National Study Quantifies Reality of the “Sharing Economy” Movement. Retrieved August 2013, 8, 2014. [Google Scholar]
- Pancheva, V. Peers Help Peers. Available online: https://www.uni-kassel.de/fb07/fileadmin/datas/fb07/5-Institute/IBWL/Wagner/EMBS/Pancheva_Vyara_Expose.pdf (accessed on 16 March 2019).
- Keymolen, E. Trust and Technology in Collaborative Consumption. Why It Is Not Just About You and Me. Bridg. Distances Technol. Regul. 2013, 135, 135–150. [Google Scholar]
- Hawlitschek, F.; Notheisen, B.; Teubner, T. The Limits of Trust-Free Systems: A Literature Review on Blockchain Technology and Trust in the Sharing Economy. Electron. Commer. Res. Appl. 2018, 29, 50–63. [Google Scholar] [CrossRef]
- Tussyadiah, I.P.; Zach, F. Identifying Salient Attributes of Peer-To-Peer Accommodation Experience. J. Travel Tour. Mark. 2017, 34, 636–652. [Google Scholar] [CrossRef]
- Alizadeh, T.; Farid, R.; Sarkar, S. Towards Understanding the Socio-Economic Patterns of Sharing Economy in Australia: An Investigation of Airbnb Listings in Sydney and Melbourne Metropolitan Regions. Urban Policy Res. 2018, 36, 445–463. [Google Scholar] [CrossRef]
- Heo, C.Y.; Blal, I.; Choi, M. What Is Happening in Paris? Airbnb, Hotels, and the Parisian Market: A Case Study. Tour. Manag. 2019, 70, 78–88. [Google Scholar] [CrossRef]
- Codagnone, C.; Martens, B. Scoping the Sharing Economy: Origins, Definitions, Impact and Regulatory Issues; European Commission: Brussels, Belgium, 2016. [Google Scholar]
- Hennig-Thurau, T.; Henning, V.; Sattler, H. Consumer File Sharing of Motion Pictures. J. Mark. 2007, 71, 1–18. [Google Scholar] [CrossRef]
- Priporas, C.-V.; Stylos, N.; Rahimi, R.; Vedanthachari, L.N. Unraveling the Diverse Nature of Service Quality in a Sharing Economy: A Social Exchange Theory Perspective of Airbnb Accommodation. Int. J. Contemp. Hosp. Manag. 2017, 29, 2279–2301. [Google Scholar] [CrossRef]
- Rogers, E.M. A Prospective and Retrospective Look at the Diffusion Model. J. Health Commun. 2004, 9, 13–19. [Google Scholar] [CrossRef]
- Chong, A.Y.-L.; Ooi, K.-B.; Sohal, A. The Relationship Between Supply Chain Factors and Adoption of E-Collaboration Tools: An Empirical Examination. Int. J. Prod. Econ. 2009, 122, 150–160. [Google Scholar] [CrossRef]
- Park, H.; Suh, W.; Lee, H. A Role-Driven Component-Oriented Methodology for Developing Collaborative Commerce Systems. Inf. Softw. Technol. 2004, 46, 819–837. [Google Scholar] [CrossRef]
- Trenz, M.; Frey, A.; Veit, D. Disentangling the Facets of Sharing: A Categorization of What We Know and Don’t Know About the Sharing Economy. Internet Res. 2018, 28, 888–925. [Google Scholar] [CrossRef]
- Edbring, E.G.; Lehner, M.; Mont, O. Exploring Consumer Attitudes to Alternative Models of Consumption: Motivations and Barriers. J. Clean. Prod. 2016, 123, 5–15. [Google Scholar] [CrossRef]
- Fagnant, D.J.; Kockelman, K. Preparing a Nation for Autonomous Vehicles: Opportunities, Barriers and Policy Recommendations. Transp. Res. Part A Policy Pract. 2015, 77, 167–181. [Google Scholar] [CrossRef]
- Gabus, A.; Fontela, E. World Problems, an Invitation to Further Thought Within the Framework of DEMATEL; Battelle Geneva Research Center: Geneva, Switzerland, 1972. [Google Scholar]
- Fontela, E.; Gabus, A. The DEMATEL Observer, DEMATEL 1976 Report; Battelle Geneva Research Center: Geneva, Switzerland, 1976. [Google Scholar]
- Fu, X.; Zhu, Q.; Sarkis, J. Evaluating Green Supplier Development Programs at a Telecommunications Systems Provider. Int. J. Prod. Econ. 2012, 140, 357–367. [Google Scholar] [CrossRef]
- Xia, X.; Govindan, K.; Zhu, Q. Analyzing Internal Barriers for Automotive Parts Remanufacturers in China Using Grey-DEMATEL Approach. J. Clean. Prod. 2015, 87, 811–825. [Google Scholar] [CrossRef]
- Bai, C.; Sarkis, J. A Grey-Based DEMATEL Model for Evaluating Business Process Management Critical Success Factors. Int. J. Prod. Econ. 2013, 146, 281–292. [Google Scholar] [CrossRef]
- Wu, W.-W.; Lee, Y.-T. Developing Global Managers’ Competencies Using the Fuzzy DEMATEL Method. Expert Syst. Appl. 2007, 32, 499–507. [Google Scholar] [CrossRef]
- Zhu, Q.; Sarkis, J.; Geng, Y. Barriers to Environmentally-Friendly Clothing Production Among Chinese Apparel Companies. Asian. Bus. Manag. 2011, 10, 425–452. [Google Scholar] [CrossRef]
- Lin, R.-J. Using Fuzzy DEMATEL to Evaluate the Green Supply Chain Management Practices. J. Clean. Prod. 2013, 40, 32–39. [Google Scholar] [CrossRef]
- Dou, Y.; Zhu, Q.; Sarkis, J. Integrating Strategic Carbon Management into Formal Evaluation of Environmental Supplier Development Programs. Bus. Strategy Environ. 2015, 24, 873–891. [Google Scholar] [CrossRef]
- Dou, Y.; Zhu, Q.; Sarkis, J. Green Multi-Tier Supply Chain Management: An Enabler Investigation. J. Purch. Supply Manag. 2018, 24, 95–107. [Google Scholar] [CrossRef]
- Tsai, W.-H.; Chou, W.-C.; Hsu, W. The Sustainability Balanced Scorecard as a Framework for Selecting Socially Responsible Investment: An Effective Mcdm Model. J. Oper. Res. Soc. 2009, 60, 1396–1410. [Google Scholar] [CrossRef]
- Bai, C.; Sarkis, J. Evaluating Supplier Development Programs with a Grey Based Rough Set Methodology. Expert Syst. Appl. 2011, 38, 13505–13517. [Google Scholar] [CrossRef]
- Bai, C.; Kusi-Sarpong, S.; Sarkis, J. An Implementation Path for Green Information Technology Systems in the Ghanaian Mining Industry. J. Clean. Prod. 2017, 164, 1105–1123. [Google Scholar] [CrossRef]
- Deng, J.-L. Control Problems of Grey Systems. Syst. Control Lett. 1982, 1, 288–294. [Google Scholar]
- Ren, J.; Liang, H.; Dong, L.; Gao, Z.; He, C.; Pan, M.; Sun, L. Sustainable Development of Sewage Sludge-To-Energy in China: Barriers Identification and Technologies Prioritization. Renew. Sustain. Energy Rev. 2017, 67, 384–396. [Google Scholar] [CrossRef]
- Li, G.-D.; Yamaguchi, D.; Nagai, M. A Grey-Based Decision-Making Approach to the Supplier Selection Problem. Math. Comput. Model. 2007, 46, 573–581. [Google Scholar] [CrossRef]
- Jin, J.-j.; Yu, Z.-w.; Mi, C.-m. Commercial Bank Credit Risk Management Based on Grey Incidence Analysis. Proceedings of 2011 IEEE International Conference on Grey Systems and Intelligent Services, Nanjing, China, 15–18 September 2011; pp. 534–538. [Google Scholar]
- Liu, S.; Yang, Y.; Xie, N.; Forrest, J. New Progress of Grey System Theory in the New Millennium. Grey Syst. Theory Appl. 2016, 6, 2–31. [Google Scholar] [CrossRef]
- Rahimnia, F.; Moghadasian, M.; Mashreghi, E. Application of Grey Theory Approach to Evaluation of Organizational Vision. Grey Syst. Theory Appl. 2011, 1, 33–46. [Google Scholar] [CrossRef]
- Wang, W.; Tian, Y.; Zhu, Q.; Zhong, Y. Barriers for Household E-Waste Collection in China: Perspectives from Formal Collecting Enterprises in Liaoning Province. J. Clean. Prod. 2017, 153, 299–308. [Google Scholar] [CrossRef]
- Bhatia, M.S.; Srivastava, R.K. Analysis of External Barriers to Remanufacturing Using Grey-DEMATEL Approach: An Indian Perspective. Resour. Conserv. Recy. 2018, 136, 79–87. [Google Scholar] [CrossRef]
- Resonance Consultancy. World’s Best Cities. Available online: http://media.resonanceco.com/uploads/2018/11/Resonance-2019-Worlds-Best-Cities-Report.pdf (accessed on 27 April 2019).
- Euromonitor International. Top 100 City Destination. Available online: https://go.euromonitor.com/white-paper-travel-2018-100-cities.html?utm_source=blog&utm_medium=blog&utm_campaign=CT_WP_18_12_04_100%20Cities&utm_content=organic (accessed on 11 April 2019).
- Expo 2020. Expo 2020 Dubai UAE. Available online: https://www.expo2020dubai.com/en (accessed on 24 March 2019).
- Dudley, D. The $33B Question: Can Dubai Make a Success of Expo 2020? Available online: https://www.forbes.com/sites/dominicdudley/2019/05/15/dubai-expo-2020/ (accessed on 4 March 2019).
- Airbnb. Superhost: Recognizing the Best in Hospitality. Available online: https://www.airbnb.com/superhost (accessed on 23 May 2019).
- Shao, J.; Taisch, M.; Ortega-Mier, M. A Grey-Decision-Making Trial and Evaluation Laboratory (Dematel) Analysis on the Barriers Between Environmentally Friendly Products and Consumers: Practitioners’ Viewpoints on the European Automobile Industry. J. Clean. Prod. 2016, 112, 3185–3194. [Google Scholar] [CrossRef]
- Tseng, M.-L. A Causal and Effect Decision Making Model of Service Quality Expectation Using Grey-Fuzzy DEMATEL Approach. Expert Syst. Appl. 2009, 36, 7738–7748. [Google Scholar] [CrossRef]
- World Bank. Tourism and the Sharing Economy. Available online: http://documents.worldbank.org/curated/en/161471537537641836/pdf/130054-REVISED-Tourism-and-the-Sharing-Economy-PDF.pdf (accessed on 3 June 2019).
- Ranchordás, S.; Gedeon, Z.; Zurek, K. Home-Sharing in the Digital Economy: The Cases of Brussels, Stockholm, and Budapest: Impulse Paper for the European Comission; University of Groningen: Groningen, The Netherlands, 2016. [Google Scholar]
- Huckle, S.; Bhattacharya, R.; White, M.; Beloff, N. Internet of Things, Blockchain and Shared Economy Applications. Procedia Comput. Sci. 2016, 98, 461–466. [Google Scholar] [CrossRef]
- Nica, E.; Potcovaru, A.-M. The Social Sustainability of the Sharing Economy. Econ. Manag. Financ. Mark. 2015, 10, 69. [Google Scholar]
- Heinrichs, H. Sharing Economy: A Potential New Pathway to Sustainability. GAIA-Ecol. Perspect. Sci. Soc. 2013, 22, 228–231. [Google Scholar] [CrossRef]


| Research Area | Paper Quantity | Research Area | Paper Quantity |
|---|---|---|---|
| Economics | 323 | Urban Studies | 67 |
| Environmental Studies | 143 | Business | 57 |
| Management | 82 | Geography | 49 |
| Hospitality Leisure Sport Tourism | 75 | Business Finance | 46 |
| Environmental Sciences | 71 | Political Science | 44 |
| Drivers |
|---|
| D1: Lower costs and higher value are associated with accommodation sharing [15,22,39,63,64,65,66] |
| D2: Sharing accommodation increases the usage rate of existing products and reduces the use of raw materials associated with the manufacturing of the new products [17,18,22,67,68,69,70,71] |
| D3: Accommodation sharing contributes to the development of the local economy and supports the residents [17,62,68,72,73,74,75,76,77] |
| D4: Accommodation sharing positively influences the creation of social relationships and helps to build community [15,72,73,74,78,79] |
| D5: Taking part in accommodation sharing is agreeable [15,35,66,80,81,82,83] |
| D6: The accommodation sharing system is user-friendly and highly informative [11,60,84,85] |
| D7: Innovative technologies and social media greatly influence the adoption of accommodation sharing [15,23,66,86] |
| Barriers |
|---|
| B1: Lack of trust between the participants (guests, hosts, company) or toward the technologies supporting accommodation sharing [15,23,66,86] |
| B2: Doubts regarding accommodation sharing services and product quality and related benefits or losses [15,22,39,63,64,65,66] |
| B3: Insufficient cost savings due to high prices [15,35,101,102] |
| B4: Taking part in accommodation sharing involves understanding how to use new platforms and technologies [15,23,66,86] |
| B5: Insufficient or underdeveloped legislation regarding accommodation sharing [103,104,105] |
| Linguistic Terms | Values |
|---|---|
| No influence (N) | 0 |
| Very low influence (VL) | 1 |
| Low influence (L) | 2 |
| High influence (H) | 3 |
| Very high influence (VH) | 4 |
| Number | Level on Airbnb Dubai | Experience on the Airbnb Platform | Experience in the Rental/Accommodation Industry | Type of Host | Number of Properties for Rent |
|---|---|---|---|---|---|
| 1 | Superhost | 2 years | 10 years | Private owner | 2 |
| 2 | Superhost | 2 years | 8 years | Private owner | 3 |
| 3 | Superhost | 2 years | 8 years | Private owner | 2 |
| 4 | Superhost | 2 years | 15 years | Private owner | 6 |
| 5 | Superhost | 2 years | 11 years | Limited Liability Company | 9 |
| Driver | D1 | D2 | D3 | D4 | D5 | D6 | D7 |
|---|---|---|---|---|---|---|---|
| D1 | 0.9627 | 1.2047 | 1.1031 | 1.1181 | 1.1123 | 1.1108 | 1.0944 |
| D2 | 0.7168 | 0.6334 | 0.6481 | 0.6355 | 0.6425 | 0.6462 | 0.6834 |
| D3 | 1.0164 | 1.1315 | 0.8887 | 1.0500 | 1.0377 | 1.0233 | 1.0269 |
| D4 | 0.9792 | 1.0637 | 0.9807 | 0.8673 | 1.0158 | 0.9946 | 0.9770 |
| D5 | 1.0136 | 1.1078 | 1.0141 | 1.0280 | 0.8951 | 1.0215 | 1.0181 |
| D6 | 1.0684 | 1.1685 | 1.0758 | 1.0911 | 1.0921 | 0.9436 | 1.1011 |
| D7 | 0.9885 | 1.1017 | 0.9883 | 1.0155 | 1.0168 | 1.0163 | 0.8797 |
| Barrier | B1 | B2 | B3 | B4 | B5 |
|---|---|---|---|---|---|
| B1 | 1.9482 | 2.1986 | 1.9076 | 1.6633 | 1.5209 |
| B2 | 2.0963 | 1.9080 | 1.8764 | 1.6088 | 1.3874 |
| B3 | 1.8939 | 1.9334 | 1.4871 | 1.3818 | 1.2581 |
| B4 | 2.0179 | 2.0717 | 1.8341 | 1.3762 | 1.3404 |
| B5 | 1.7735 | 1.8008 | 1.4985 | 1.2983 | 1.0641 |
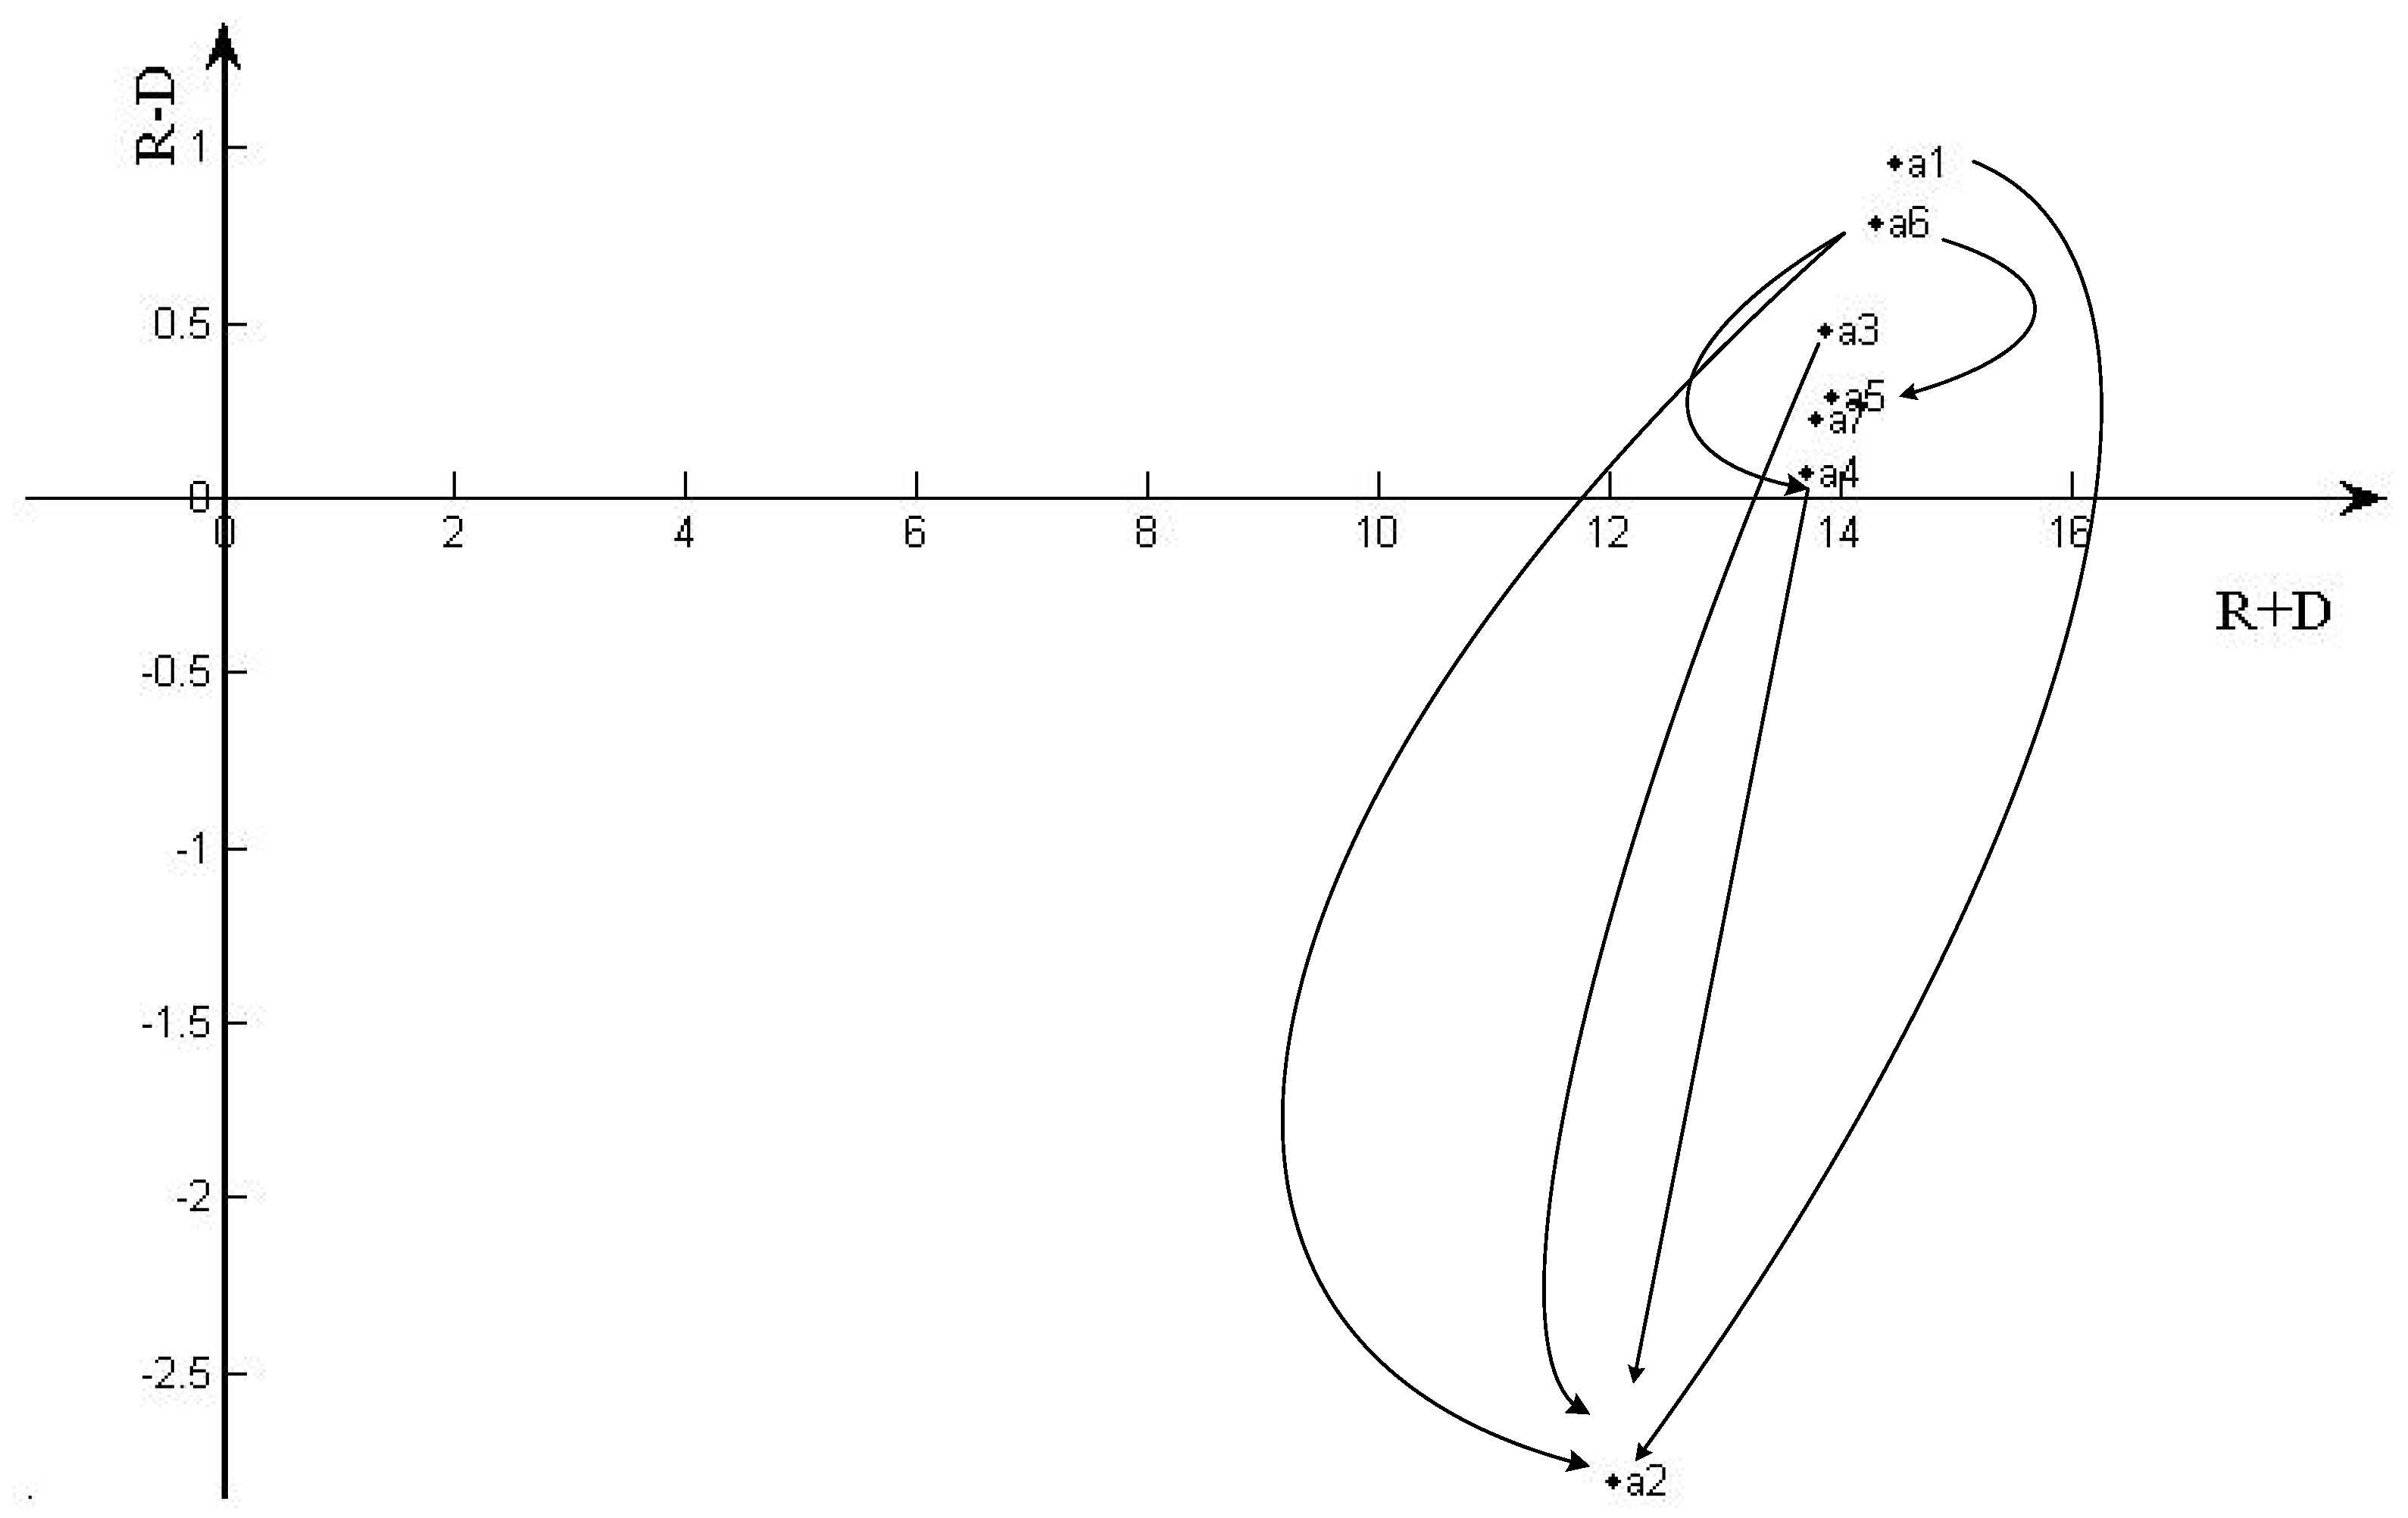
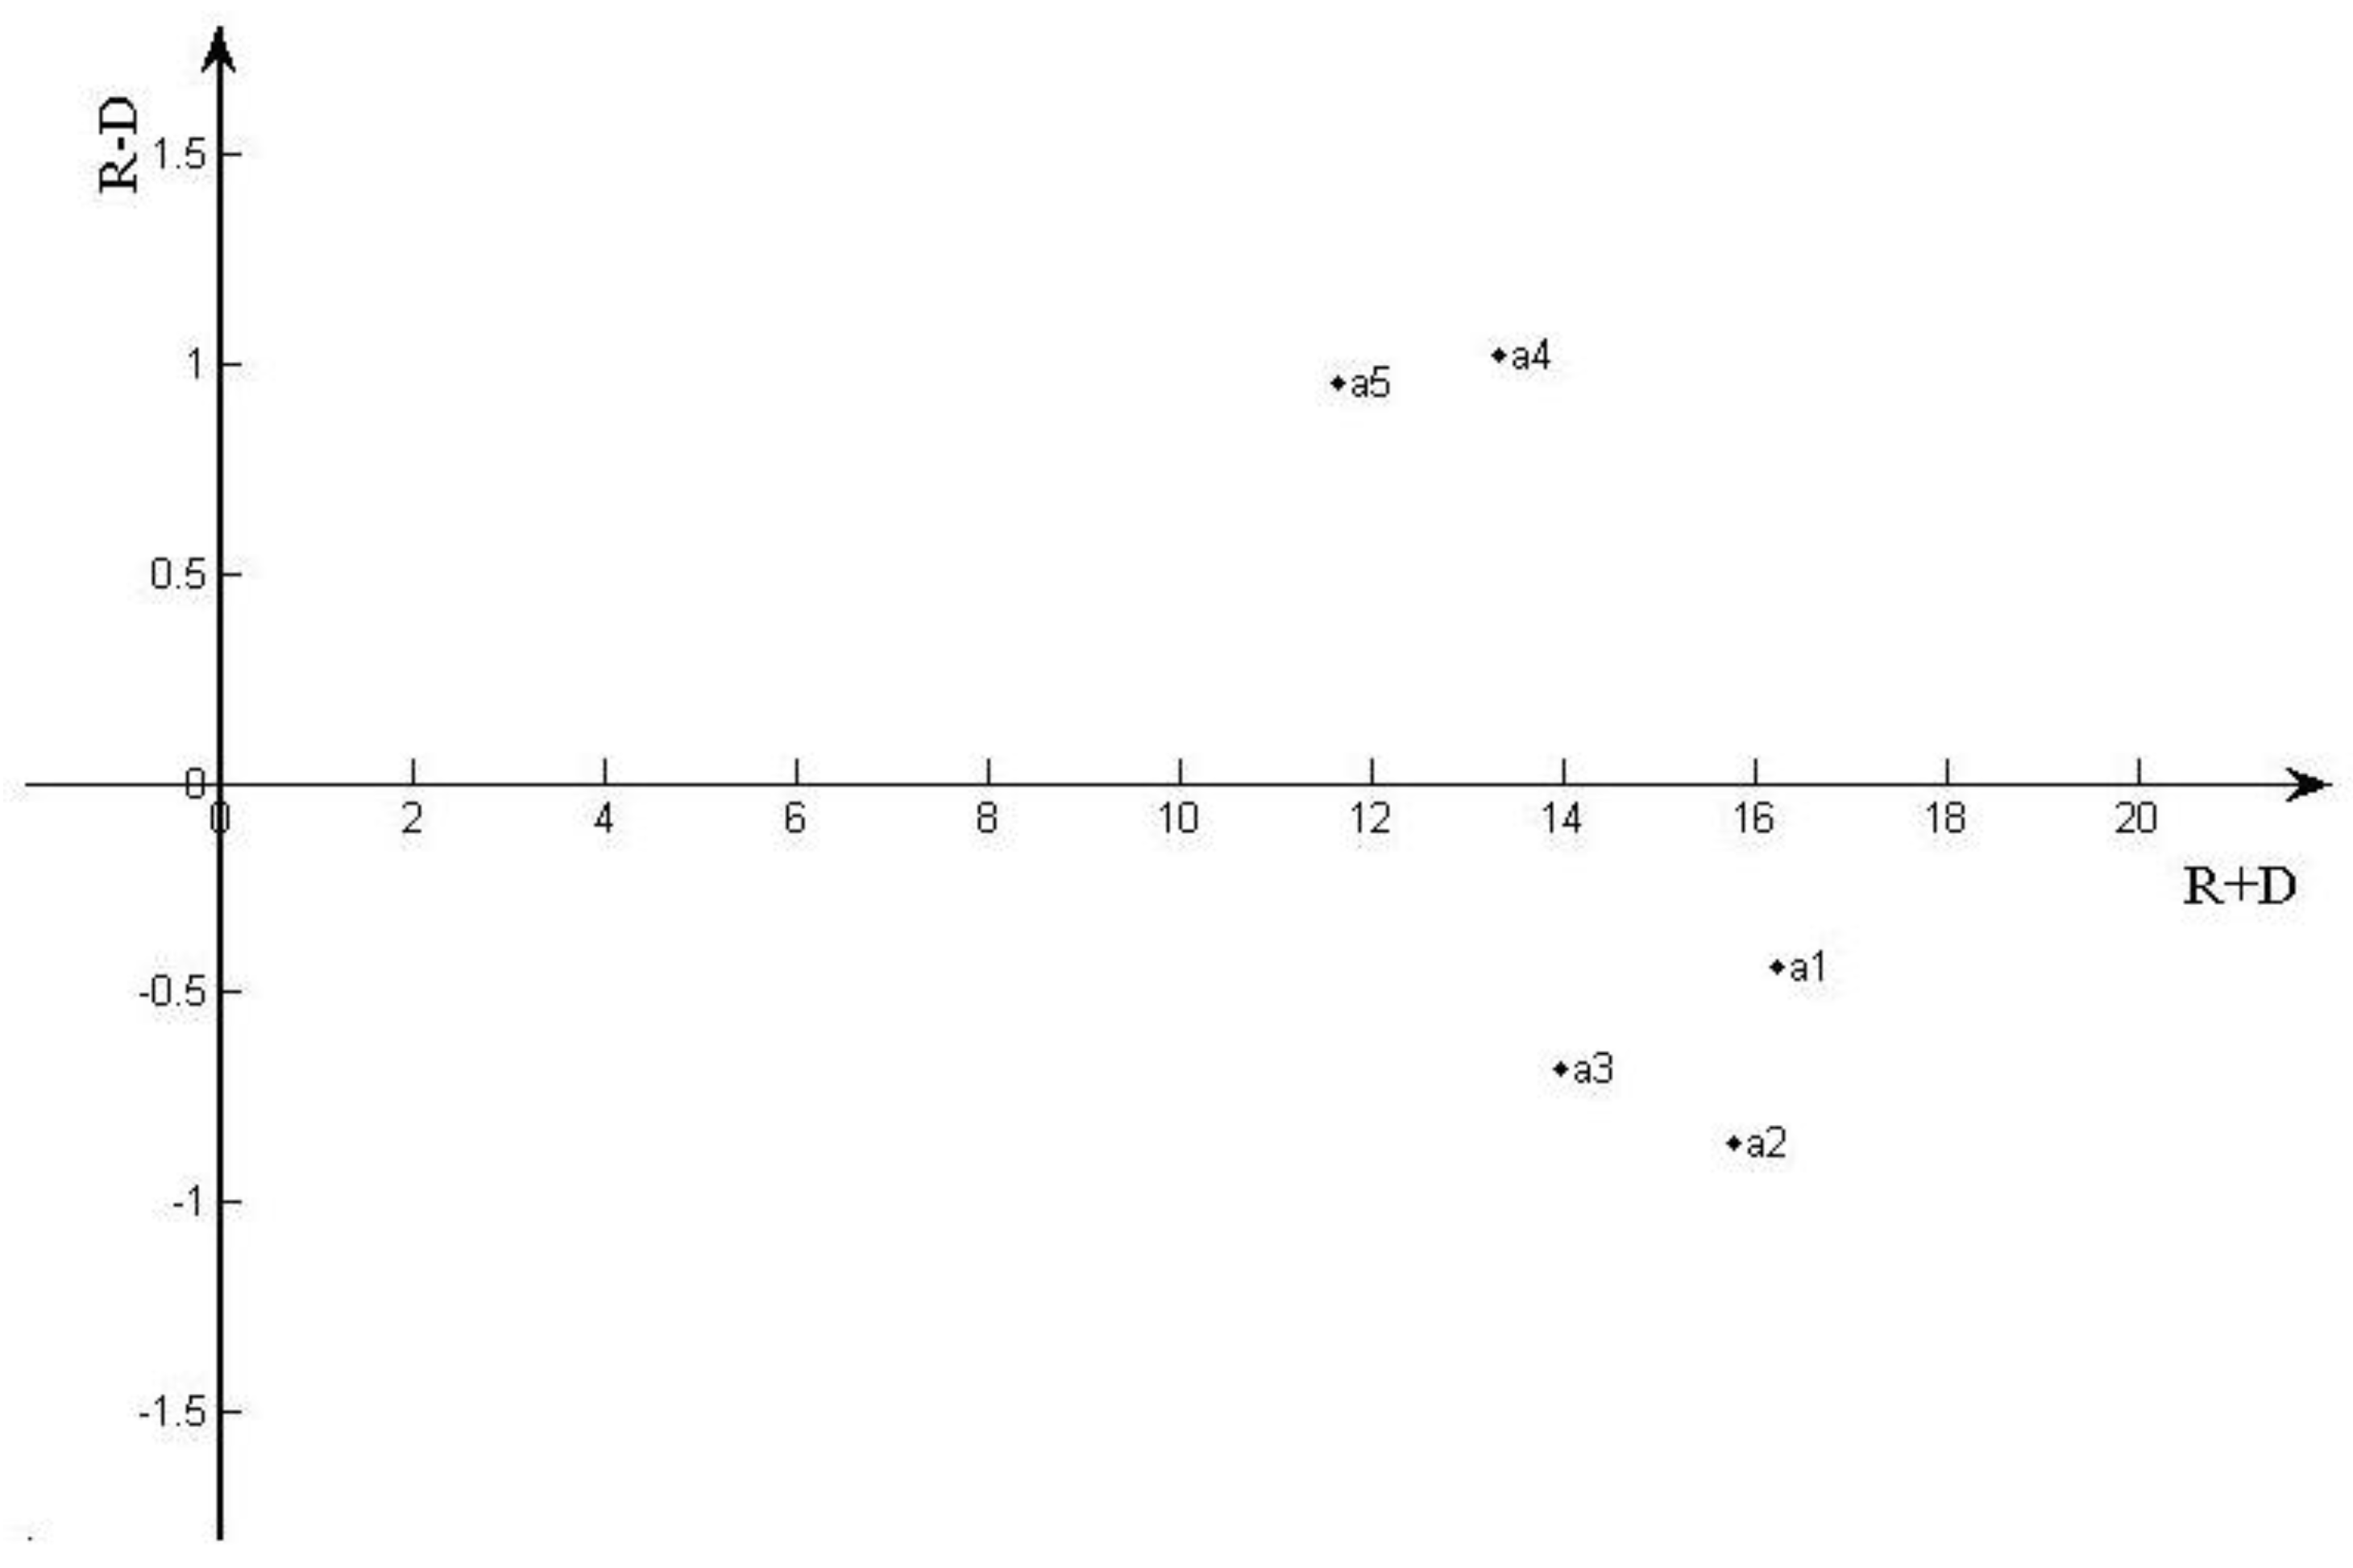
| Driver | R Sum | D Sum | R+D | R-D |
|---|---|---|---|---|
| D1 | 7.7060 | 6.7454 | 14.4514 | 0.9606 |
| D2 | 4.6059 | 7.4113 | 12.0172 | −2.8054 |
| D3 | 7.1747 | 6.6989 | 13.8736 | 0.4757 |
| D4 | 6.8784 | 6.8055 | 13.6839 | 0.0729 |
| D5 | 7.0981 | 6.8124 | 13.9105 | 0.2857 |
| D6 | 7.5405 | 6.7563 | 14.2967 | 0.7842 |
| D7 | 7.0067 | 6.7805 | 13.7872 | 0.2262 |
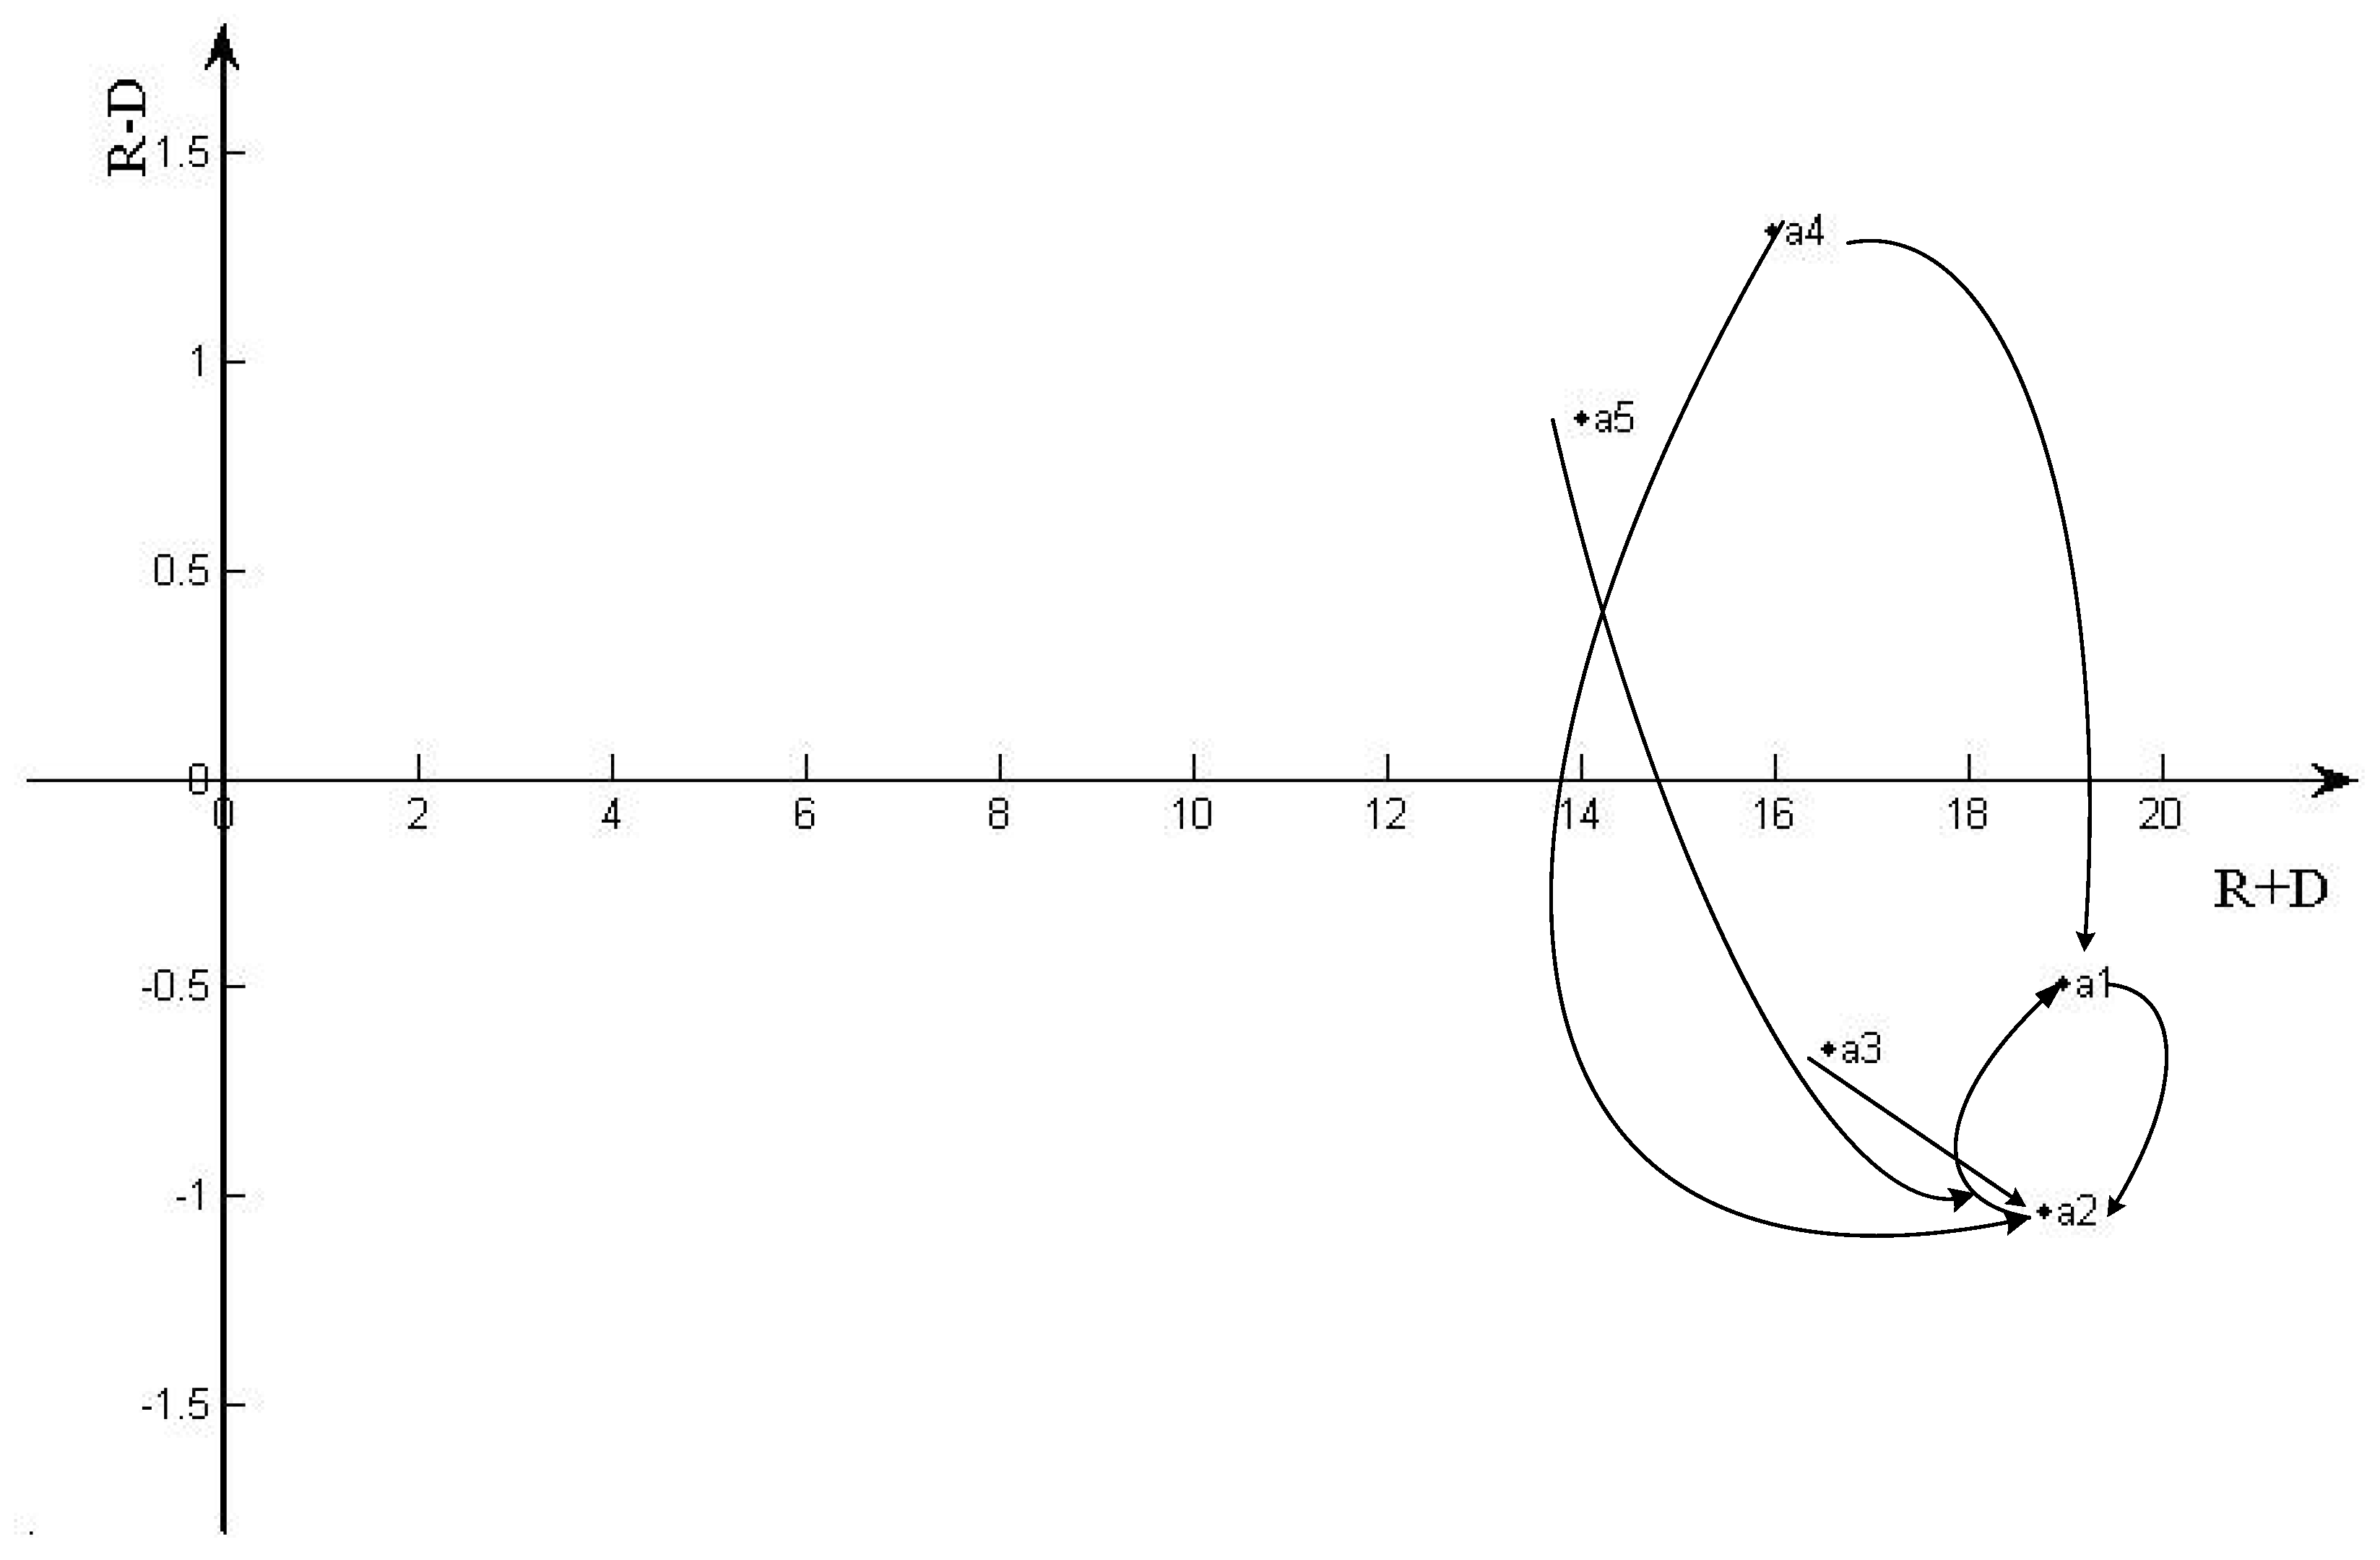
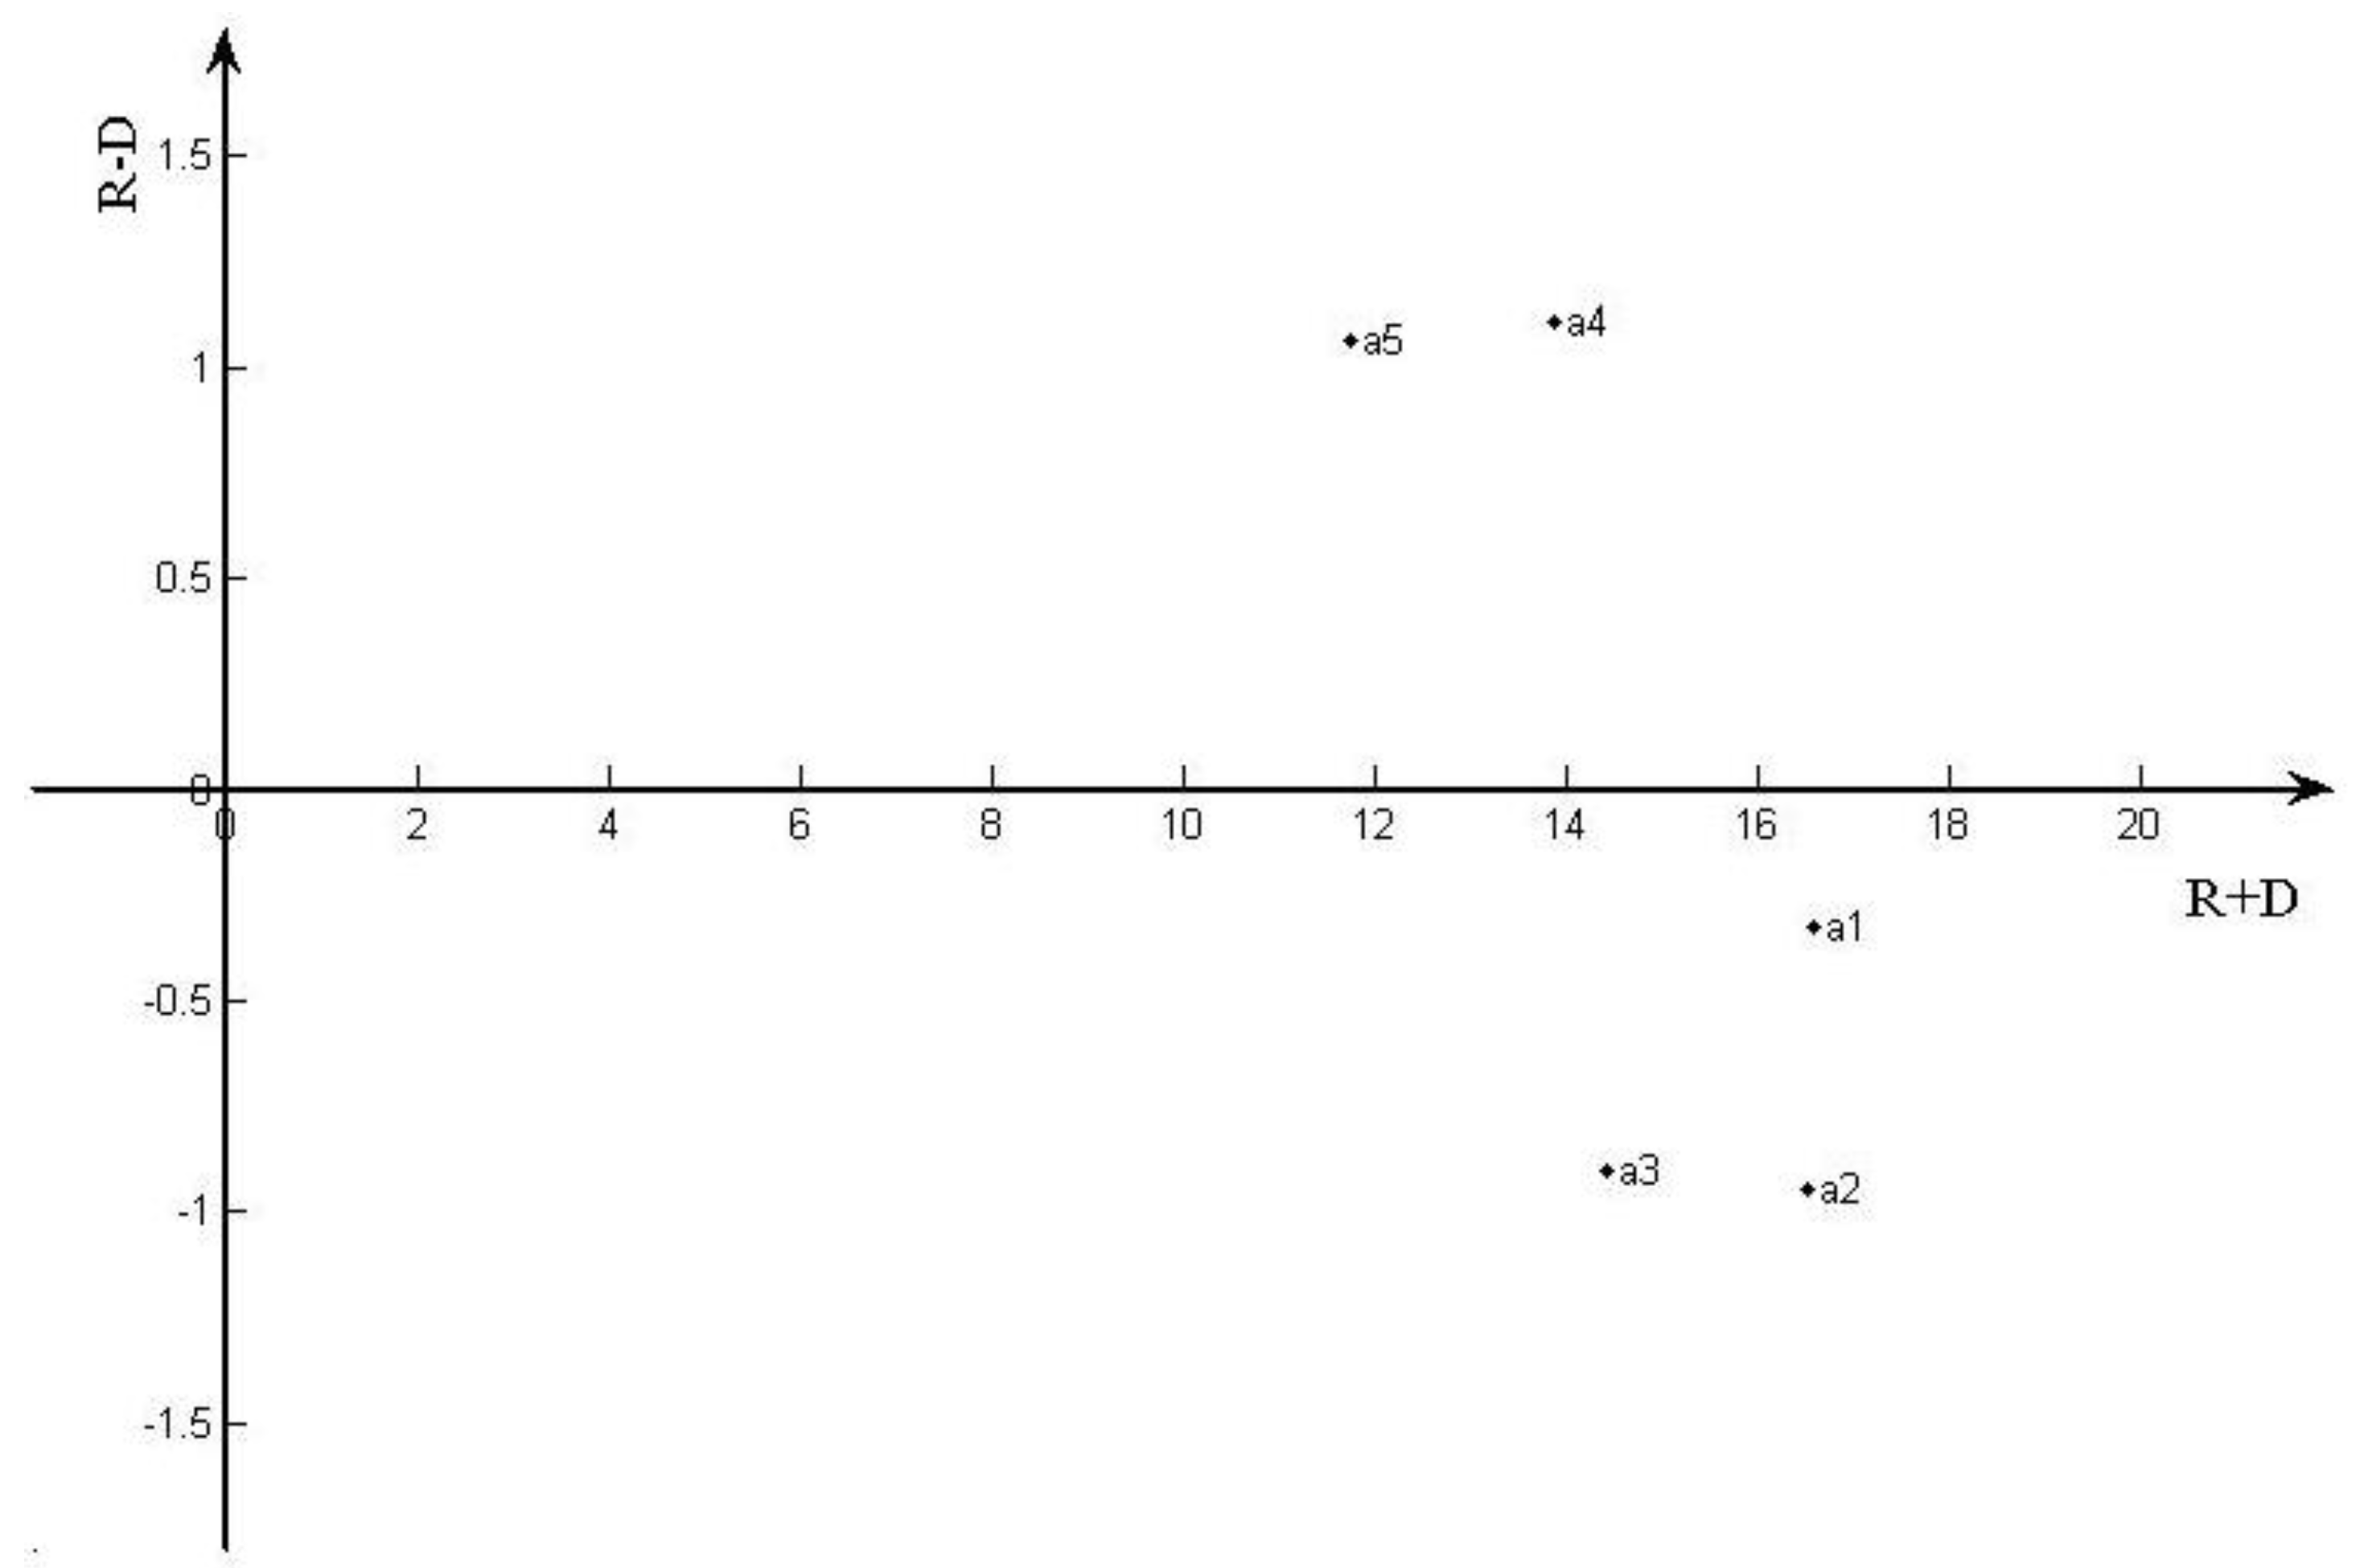
| Barrier | R Sum | D Sum | R+D | R-D |
|---|---|---|---|---|
| B1 | 9.2385 | 9.7298 | 18.9683 | −0.4912 |
| B2 | 8.8769 | 9.9125 | 18.7894 | −1.0356 |
| B3 | 7.9544 | 8.6038 | 16.5582 | −0.6493 |
| B4 | 8.6403 | 7.3284 | 15.9687 | 1.3119 |
| B5 | 7.4352 | 6.5709 | 14.0061 | 0.8642 |
© 2019 by the authors. Licensee MDPI, Basel, Switzerland. This article is an open access article distributed under the terms and conditions of the Creative Commons Attribution (CC BY) license (http://creativecommons.org/licenses/by/4.0/).
Share and Cite
Alraeeini, M.; Zhong, Q.; Antarciuc, E. Analysing Drivers and Barriers of Accommodation Sharing in Dubai Using the Grey-DEMATEL Approach. Sustainability 2019, 11, 5645. https://doi.org/10.3390/su11205645
Alraeeini M, Zhong Q, Antarciuc E. Analysing Drivers and Barriers of Accommodation Sharing in Dubai Using the Grey-DEMATEL Approach. Sustainability. 2019; 11(20):5645. https://doi.org/10.3390/su11205645
Chicago/Turabian StyleAlraeeini, Mohammed, Qiuyan Zhong, and Elena Antarciuc. 2019. "Analysing Drivers and Barriers of Accommodation Sharing in Dubai Using the Grey-DEMATEL Approach" Sustainability 11, no. 20: 5645. https://doi.org/10.3390/su11205645
APA StyleAlraeeini, M., Zhong, Q., & Antarciuc, E. (2019). Analysing Drivers and Barriers of Accommodation Sharing in Dubai Using the Grey-DEMATEL Approach. Sustainability, 11(20), 5645. https://doi.org/10.3390/su11205645