1. Introduction
Having reliable estimates of personal income levels at a highly granular level is of paramount importance for businesses and policymakers alike. This may be achieved using population census data. Unfortunately, the census is typically carried out once every ten years. In Romania, the last one was conducted in 2011. Given that social and economic conditions can change rapidly, it would also be useful to have such an indicator in a timely fashion. Furthermore, most of the data regarding income and living standards (e.g., average wages) is collected at the county level. With only 41 counties in Romania, this is insufficient to provide an accurate estimate of the affluence of households across the country. It is in this context that we propose using a novel open government database not primarily intended for this purpose.
The goal of this paper is to derive estimates of personal income levels in Romania at the local community level. We make use of a rich dataset made available in 2016 by the Romanian Ministry of Finance, which contains the revenues and expenditures realized by thousands of government institutions. Its aim is to improve transparency of public spending, as stated in the name of the system used to produce it: “The National System for Verification, Monitoring, Reporting and Controlling of Financial Statements, Legal Commitments, and Budgets of Romanian Public Entities”. As will be discussed below, this falls under the category of open government data (OGD) due to its recent availability and volume. Therefore, another aim of the present study is to add to the literature on the use of OGD. As such, we discuss the potential utility of our analysis for two distinct categories of users: businesses and policymakers. We first give an overview of the definition and main characteristics of OGD.
2. Literature Review
OGD is defined by the European Commission as information collected, produced, or paid for by public sector institutions and made freely available for re-use for any purpose. The term “open” is given some further qualification. The file storing the data is machine-readable and its format is not restricted to usage by a particular non-open source software program [
1]. By this definition, OGD has existed for decades, with national statistical offices and other public institutions publishing economic, census, and other datasets for use by businesses and the public. Nevertheless, OGD researchers typically refer to the significant increase in volumes and variety of datasets made available in recent years. For example, Magalhaes, Roseira and Manley [
2] (p. 1) characterize OGD as the “new wave of public sector data release and promotion”.
The justification for this recent openness has been a desire for greater government transparency and accountability, as well as enhanced economic benefits. For the latter, the European Commission estimates a direct market size of OGD at EUR 75.7 billion in 2020, a 37% increase from 2016, while the total market size is projected to reach EUR 265–286 billion. Direct benefits are defined as monetized benefits realized in market transactions. Indirect benefits come from job creation, new goods and services developed, knowledge economy growth, time savings, and greater efficiency in public services [
3].
The OGD agenda began to materialize in the mid-2000s but has its origins in the freedom of information movement of the 1960s. Later, the concept of e-government emerged, which proposed making government documents and services available online. OGD differs from these two concepts in the multitude of uses, which extend beyond government transparency [
4,
5]. It may be considered as an ecosystem comprised of elements such as participants and data resources that depend primarily on a set of background conditions: political, regulatory, technical, and not least public enthusiasm [
6].
A number of benefits as well as obstacles relating to OGD use have been identified in the literature. Benefits can be political and social (e.g., greater government transparency and accountability, new or improved government services); economic (e.g., innovation, improved processes/products/services); operational and technical (e.g., new data created from combining data, easier data access and discovery). Barriers relate to institutional reluctance (e.g., lack of policies for data publication); task complexity (e.g., data is hard to use and search); usage (e.g., fees, lack of relevant statistical knowledge by the end-user); legislation (e.g., privacy and security concerns); quality of information (e.g., inaccurate or incomplete information); and technical aspects (e.g., absence of standards or metadata) [
7]. The various technical and organizational constraints may make OGD provision fragile and its future development limited, with the datasets easiest to provide—those already in a machine-readable format and requiring few updates—already open [
5].
Given the diversity of its potential benefits, OGD is relevant for a wide array of social groups, from students, researchers, journalists, and non-governmental organizations to city managers, entrepreneurs, and large corporations [
8]. Some additional obstacles are found pertaining to the commercial use of OGD. Among these is the power imbalance between companies and the government as the latter has sole control over the open data resources it provides. As a result, continued availability of OGD is a source of uncertainty that can limit its use. Furthermore, since data by itself is useless and OGD can be considered a public good due to its open nature, OGD is insufficient to create a competitive advantage and needs to be combined with other means such as human resources, IT infrastructure, or other proprietary data [
9]. Some of the barriers identified such as difficulty to use formats, quality, and future availability issues apply to all open data [
10]. In the case of local governments, the heterogeneity of institutions and public services (e.g., the local library or police department) plays an important role in the release of OGD. Those organizations where data storage is centralized and its ownership is clear are found to be better able to release data. This heterogeneity makes large-scale implementation of OGD infrastructure difficult [
11].
Despite all the barriers to commercial use, business models have emerged around OGD. Magalhaes, Roseira and Manley [
2] developed a taxonomy of companies by their use of OGD. They distinguish between companies for which OGD is a central part of the business model, and those that use OGD in combination with internal or other proprietary data to enhance their business capabilities. The former provides technologies for the management of OGD and services which aggregate data from different sources (enablers), and develop applications that make the data easier to navigate and explore by end-users (facilitators). The latter category comprises any company which uses OGD for various activities (e.g., marketing, R&D), but for which OGD is not a core part of the business model. Magalhaes and Roseira [
12] further classify OGD uses across five themes: data to fact—extracting specific facts from data; data to data—sharing original data or an augmented version; data to information—creating a representation and interpretation of the data (e.g., visualizations, reports); data to interface—creating an interface for data accessibility and exploration; and data to service—data supports a particular service. Business intelligence use is placed in the latter category due to its role in supporting market analyses in combination with proprietary data. The authors note that OGD use in the private sector is well established.
The creation of economic value has been the cornerstone of OGD strategy in the EU, but evidence pertaining to the actual value creation mechanism remains scarce [
8]. End-user adoption and use is difficult to measure [
13]. Zuiderwijk, Janssen and Dwivedi [
14] analyze factors affecting the behavioral intention to use open data technologies and find a significant influence from performance and effort expectancy, as well as social influence. However, their research is limited to data from a survey provided to participants at open data conferences and only concerns the intention to use open data technologies.
Furthermore, there have been concerns among OGD communities regarding the possibility that business use may crowd out other social and environmental uses [
4]. As previously stated, in the present paper we demonstrate both business and policy applications of a dataset primarily intended for enhancing government transparency and argue that social, environmental, and economic applications are not mutually exclusive. Nevertheless, a fundamental question regarding the justification for opening the data remains unanswered: should OGD be provided for a specific purpose, regardless of the nature of that purpose, or should it be provided as a right of all citizens? Sieber and Johnson [
5] highlight this issue, arguing that the motivations for opening government data are connected to the actors involved. As such, the civil society focuses on OGD as a right, while government initiatives emphasize the economic aspects.
Lastly, we should note that the government and the public could play a role in ensuring the provision of open data from the private sector. As such, the government can require companies to provide financial and nonfinancial data in a transparent manner. For companies in the energy, extractive, or other sectors perceived as being environmentally damaging, these requirements are compounded by pressure from public opinion and environmental organizations to disclose additional sustainability data [
15].
3. Materials and Methods
We use data from the aforementioned Romanian Ministry of Finance database [
16]. The purpose is to estimate the personal income levels at the level of municipalities, towns, and communes as a step towards increasing local governments’ financial sustainability. These are the smallest Romanian territorial administrative units with a judicial authority, an elected mayor, and a budget. This corresponds to the local administrative unit (LAU) European classification and shall hereafter be referred to as such. LAUs are comprised of villages, but these have no judicial personality or organizational structure. There are 3181 LAUs in the country, forming 41 counties. The counties, along with the capital, correspond to the NUTS level 3 European classification.
The data include detailed income and expenditure accounts for the year 2017. Data are available on a monthly basis (year-to-date), but unfortunately only starting from year 2016. No further historical data is available from before this point. Therefore, a time series analysis cannot be conducted. We chose 2017 as it was the most recent available year at the time of writing. Of the many items in the accounts we selected three: incomes from taxes on vehicles (ITV) and buildings (ITB) owned by natural persons, and subsidies received for aid in heating homes with wood, coal, fossil fuels. Hereafter, for simplicity, we will refer to the latter as energy subsidies. The rationale is that in communities where taxes received on buildings and vehicles from natural persons are high, said persons are more affluent since the value of their assets is higher. Conversely, communities that offer high energy subsidies can be considered less affluent. This is because only households with a monthly income per family member below a certain threshold are eligible for this form of support. The eligibility criteria also take into account the assets owned, thus excluding, for example, persons that own multiple vehicles or have large bank deposits. Other data on the development of local communities is provided by the Romanian National Statistics Institute, such as natural gas consumption, the crime rate, and the number of medical doctors. We opt for using the three indicators mentioned above exclusively since these are directly connected to the citizens’ wealth. The condition of local healthcare facilities, schools, and infrastructure depends largely on allocations from the central government.
Our rationale is illustrated by the positive correlation between the first two variables and the negative correlation between the first two variables and the latter (
Table 1). We can also argue that using these indicators may yield more accurate results than salary or unemployment data since many Romanians may gain their income from other sources (e.g., remittances from family members working abroad, activities outside the normal economy). However, our analysis depends on the assumption that citizens actually pay these local taxes.
Because the population of the communities varies substantially—from over 2 million persons in the capital, to several hundred in some communes, we divide all variables by population and use per capita values. For this, we use population data as of January 2017 from the Ministry of Regional Development and Public Administration [
17]. Descriptive statistics for the variables used are presented in
Table 2.
A brief note on Bucharest, the capital, is in order. The city is a legal entity with its own mayor. It is comprised of six districts that are also legal entities with their own mayors. Some tax collection occurs at the district level, while in other cases it is collected at the city level. We therefore sum up the values for the districts and city.
In order to define the personal income categories in which to place the communities we employ the cluster analysis methodology. This has been developed in a number of fields, primarily as a classification tool, leading to the existence of various different methods [
18]. Examples of usage with a purpose similar to our own include the classification of local governments by central government revenue allocation [
19] and by the level of information and communications technology infrastructure and provision of e-government services [
20]. Swianiewicz [
21] uses hierarchical clustering to classify local governments in Eastern Europe across several dimensions such as the level of decentralization, as well as territorial and administrative organization. For Romania specifically, research is lacking possibly due to limitations in data availability. The closest example we were able to find is an article classifying 165 Romanian cities based on the quality and contents of the official websites of the respective city halls [
22]. However, this classification was done based on a simple scoring and ranking system.
The k-means clustering algorithm we applied functions as follows: once a number of clusters (k) has been defined, the algorithm starts by randomly selecting a center for each cluster. It then computes squared Euclidian distances from each point to each center. It assigns each point to the cluster with the shortest distance between it and the cluster center. Next, it recalculates the cluster centroids (geometric centers) and reassigns points based on shortest distance to these centroids. The algorithm repeats this step, stopping once it achieves convergence or after a predetermined number of iterations. The result is a classification of the data into clusters characterized by a small distance between the points in each cluster (high proximity) and a large distance between the points from different clusters. This clustering algorithm has been highly successful due to its ease of implementation, simplicity, and efficiency. However, it presents some limitations, one of the most important being the choice of number of clusters [
23]. The algorithm requires that the number of clusters (k) be set by the user prior to running. As long as k is less or equal to the number of data points, the algorithm will converge to the number of clusters set, regardless of whether or not any natural grouping exists in the data. In order to overcome this issue, we used the Calinski-Harabasz criterion to determine the optimal number of clusters. This has been found to be among the best procedures for determining the number of clusters in a dataset [
24]. It works by computing the ratio between the inter-cluster variability and intra-cluster variability for each proposed k, with the highest value indicating the best solution [
25].
We ran the clustering analysis using Matlab on the vehicle and building tax variables, and on all three variables. The Calinski-Harabasz criterion indicates the presence of a high number of clusters (more than 10). This makes the results difficult to interpret, contrary to the goal of cluster analysis (and all data analysis!), which is to reach a solution that can be interpreted and is useful. To address this, we removed 21 outliers (18 for vehicle and building tax and a further 3 for energy subsidies). Following this, the Calinski-Harabasz criterion indicated the presence of three clusters for both cases.
4. Results
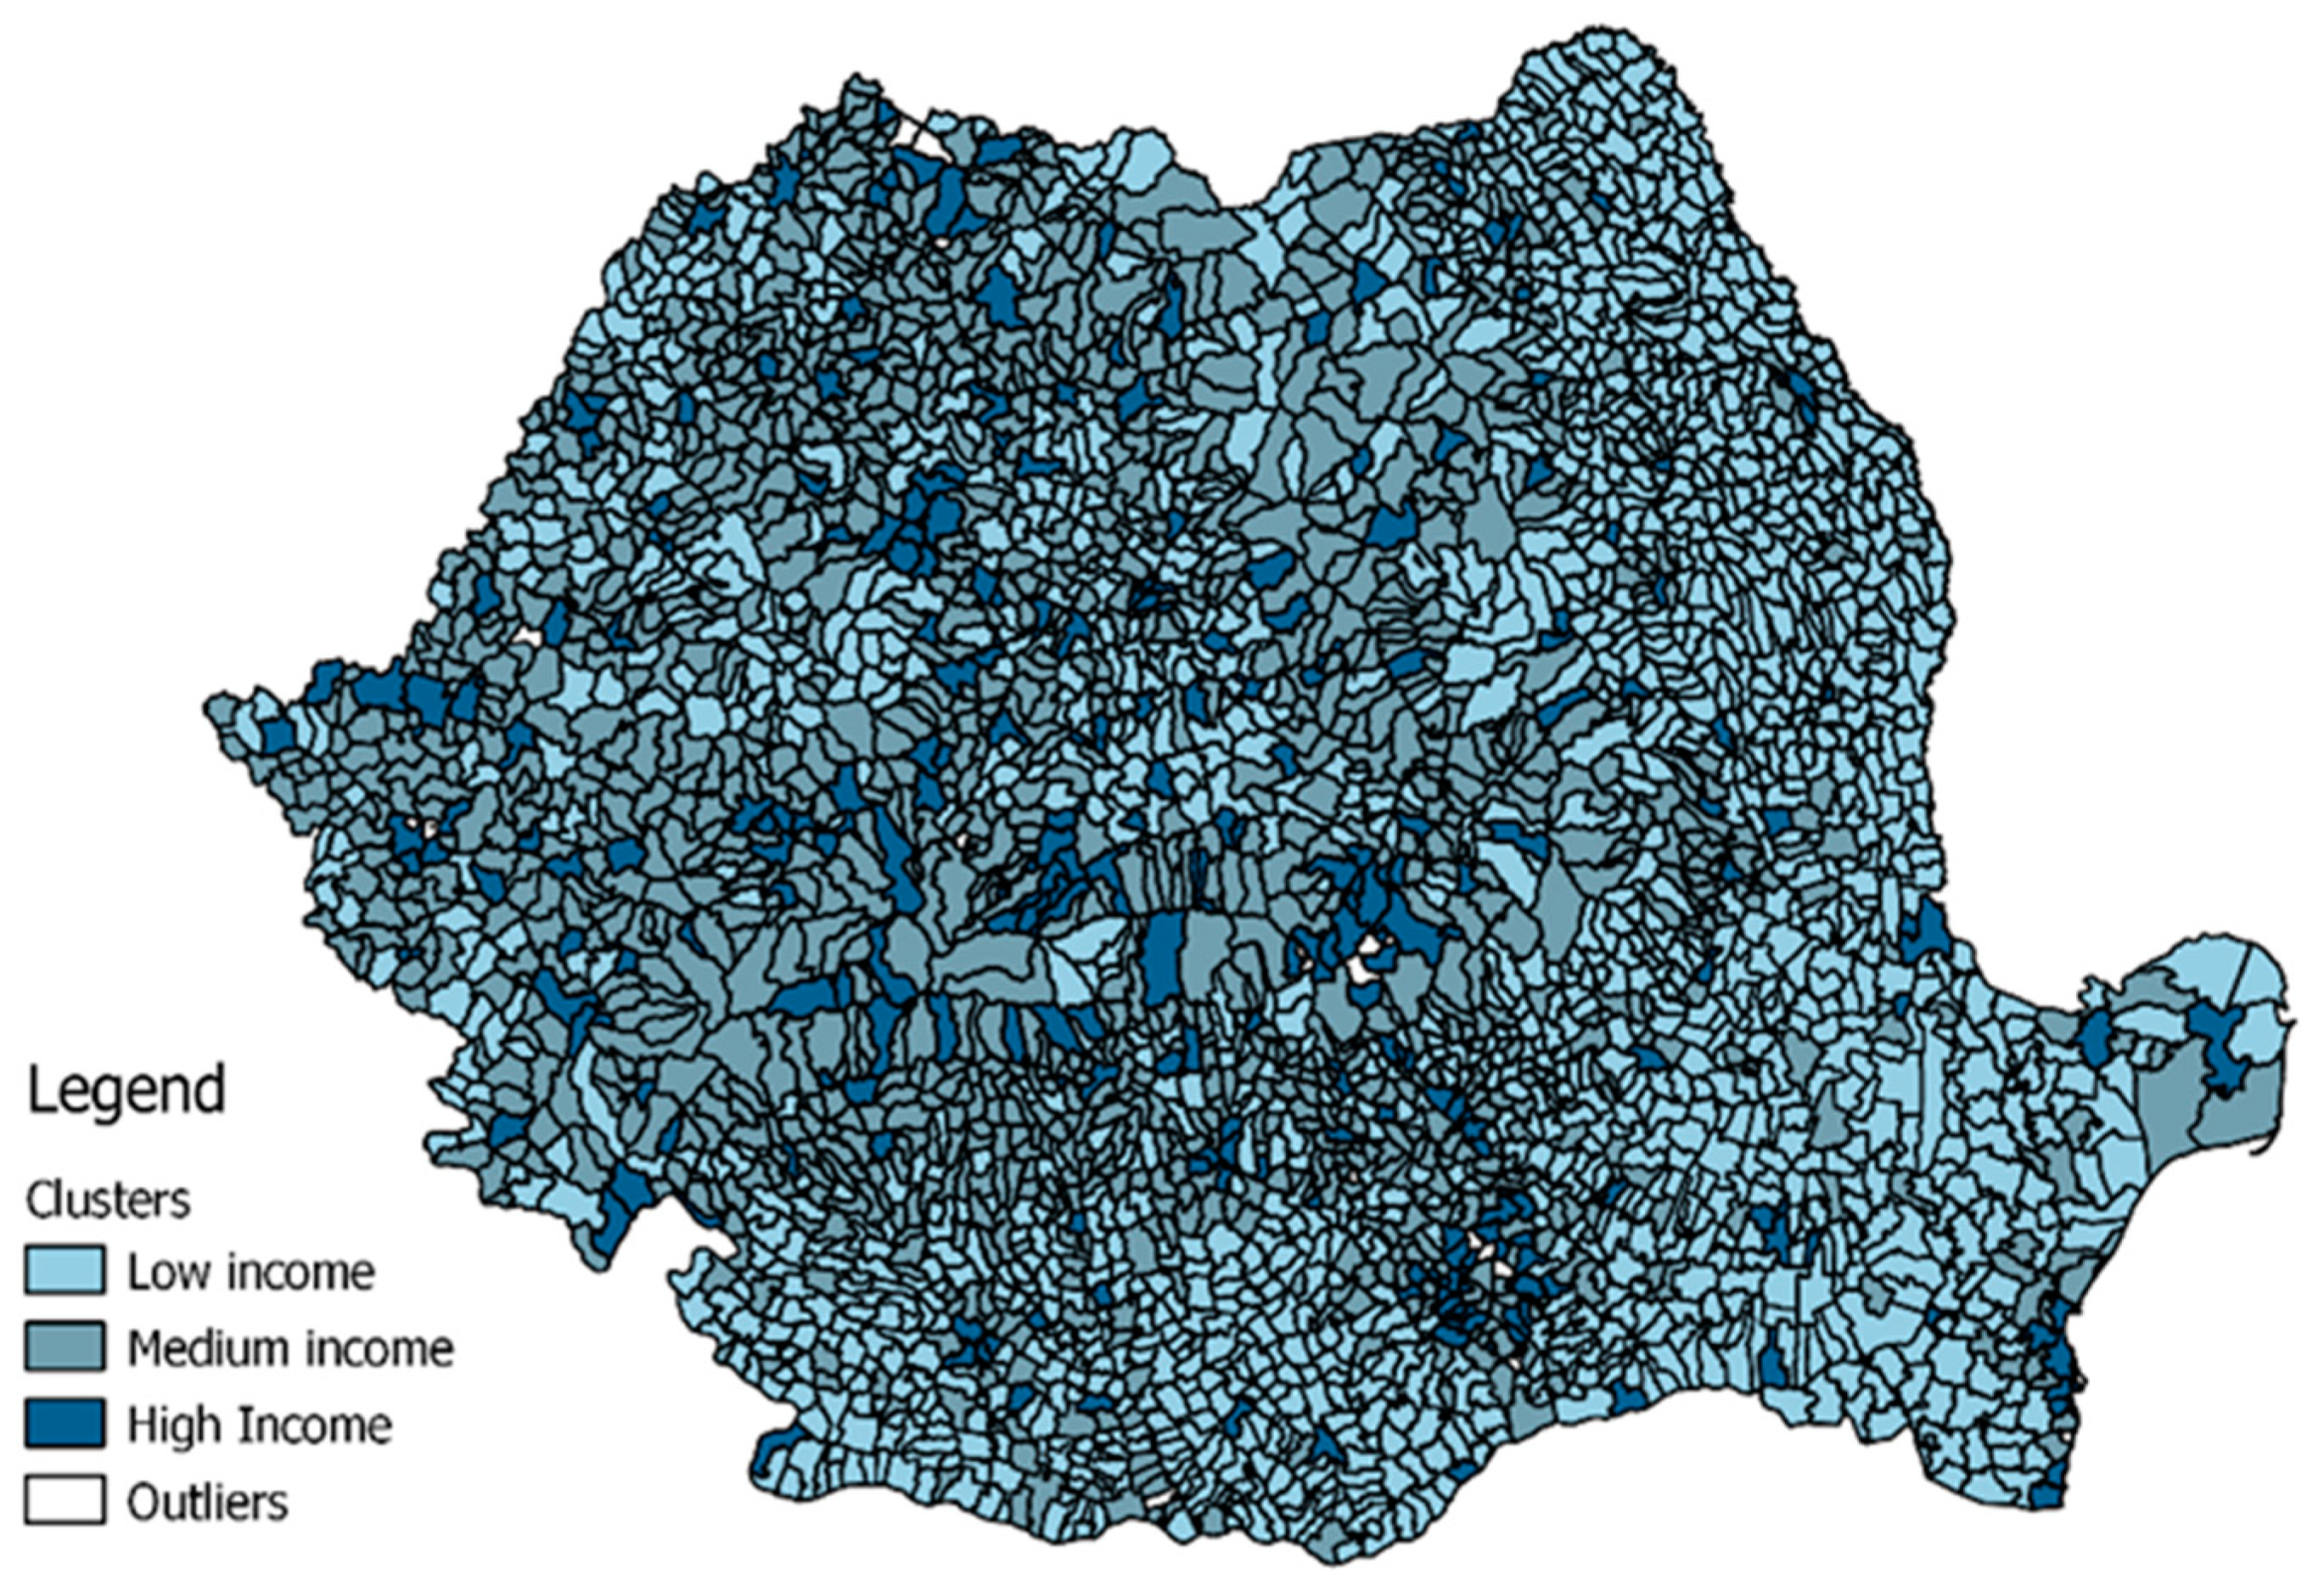
We present the results of the clustering analysis in
Figure 1 and
Figure 2. The three clusters obtained can be interpreted as low, medium, and high income. As we can see, in the case of clustering based on tax data only (
Figure 1), the low-income group is characterized by a reduced level of taxes on both buildings and vehicles. The medium income cluster presents average to high vehicle tax, but low building tax. This is natural since a house or an apartment represents a greater investment compared to a vehicle. Finally, the high-income cluster is described by average to high building and vehicle taxes.
The results of clustering based on all three variables can be interpreted in a similar fashion (
Figure 2). The low, medium, and high-income categories are roughly similar, with only 57 entities switching clusters. We can observe that the low-income cluster is also marked by a high level of energy subsidies. This declines for the medium and high-income clusters. This can also be seen in the descriptive statistics provided in
Table 3 for all three clusters. More variables could be added, but we caution against this. All variables included should have an underlying rationale for their inclusion. Furthermore, the data should present some natural clusters, allowing for their interpretation. We also ran the analysis on building and tax revenues from legal persons and failed to identify a relevant number of clusters that could be interpreted. This data could potentially be valuable if used in conjunction with other variables, but this is beyond the scope of this study. We therefore do not report these results here.
When dealing with data relating to a high number of geographical units, it is useful to represent it on a map. To this end, we use map layer data from the geoportal of the National Zoning and Real Estate Publicity Agency (ANCPI) [
26]. This covers all the LAUs in Romania (including the six districts of Bucharest) and, as all data used in this paper, it qualifies as OGD. As mentioned previously, we summed up all values for Bucharest so we cannot distinguish between the districts. We applied the data to the map for both cases using QGIS (
Figure 3 and
Figure 4).
5. Discussion
The previous two sections have provided and applied the methodology for estimating income levels with a high level of granularity. We now turn to the potential applications of our results in light of the reviewed OGD literature. First, we discuss the benefits for businesses and highlight the challenges encountered in our analysis. We then argue the implications for policymakers from the perspective of evaluating the financial sustainability of local governments.
5.1. Business Applications
The main business application that we can identify lies in the area of market intelligence. This corresponds to the latter category within the taxonomy of companies developed by Magalhaes, Roseira, and Manley [
2]—companies for which the use of OGD is not part of the core business and where such data is used in combination with other proprietary data for various processes. This is because it is hard to envision the usefulness of these results for the public even after providing visualizations, as we have done in the previous section.
Nevertheless, we believe that the OGD used can be combined with other data of a public or proprietary nature to enhance a company’s competitiveness. Alas, here we must also highlight some of the challenges encountered in using the data. As mentioned in the literature review section, a number of barriers exist inhibiting the use of OGD. In our case, the portal hosting the financial accounts data, while user-friendly, does not allow for bulk downloads. Moreover, the user must introduce a captcha code before downloading the file for each entity. This is not a problem when searching for a specific entity, but when conducting an analysis such as the one in this paper, downloading all necessary data can be highly time-consuming. Furthermore, some minor discrepancies between the financial accounts and population data were encountered. These relate to the names of the entities. The data in both cases have unique identifiers, but these do not match since the financial data uses the entity’s fiscal registration code, whereas the population data uses the National Institute of Statistics classification code (SIRUTA). These obstacles, while not insurmountable, represent a cost for the company. Such a cost may prove too great for some.
That being said, potential market intelligence uses are numerous. For example, a fuel retailer may identify small communities with relatively high per capita vehicle tax payments. This does not distinguish between a small number of luxury cars and a large number of low-cost ones. Nevertheless, taking into account our other two variables along with other data (possibly from field research) may provide an accurate picture of that community. This would allow the company to place its filling stations and adjust its offers accordingly. The approach could be used by other retailers. In this case, one might consider OGD redundant at best, since retailers can rely on their own proprietary data collected via customer interaction (e.g., loyalty cards, scanning vehicle license plates). However, such usage may face some regulatory barriers relating to privacy. Perhaps most notable in this regard is the EU’s General Data Protection Regulation that obliges companies using personal data for profiling customers to obtain their consent and provide the reasons for the profiling [
27]. Such barriers are absent in the case of OGD. Furthermore, a new market entrant may find the data highly valuable in making its entry easier. Lower barriers to entry may mean greater competition and benefits to consumers.
5.2. Policy Applications
Finally, the results can be of use to policymakers as well. Having an overview of the level of affluence (or lack thereof) for all local communities may help in allocating subsidies and other forms of government aid where they are needed the most. Moreover, the analysis may serve as a starting point in a broader evaluation of the financial sustainability of local governments. A comprehensive discussion on this topic is beyond the scope of this paper, but we do note the fact that there is no universally accepted definition of the concept of financial sustainability at the subnational level, as there exist a number of terminologies (e.g., “financial condition”, “fiscal health”) [
28,
29]. Nevertheless, income statement data is found to be a useful tool in evaluating the financial sustainability of local governments and its determinants [
30,
31]. Basic financial ratios computed from financial statements, while useful, may not give a complete and accurate picture of the risks to a local government’s finances. Bethlendi and Lentner [
32] highlight
inter alia the foreign exchange structure of the debt incurred by Hungarian municipalities, as well as their ownership of highly indebted businesses. These factors led to a high level of risk accumulating in Hungary’s subnational sector prior to the 2008 financial crisis.
We can thus conclude that the issue of local government financial sustainability is a complex topic in need of further discussion. The results presented in this paper can add to this discussion by providing an estimate of the level of affluence in different communities across the country. This can be an essential component of a measure of financial sustainability due to the simple logic that communities that are more affluent may be better equipped to handle a potential downturn in local government finances.
In Romania, this topic is particularly pressing. For decades, the management of communities was based on communist ideology rather than practicality. This entailed an emphasis on rapid urbanization and a supporting role for heavy industry [
33]. Following the collapse of the communist regime, local governments were given more responsibilities, as well as the freedom to collect certain taxes. Still, despite their greater autonomy, they remain largely dependent on central government funding, which may be distributed on political grounds [
34]. Therefore, an assessment of the financial sustainability of local budgets may constitute a fruitful avenue for further research.


