Article

An Evaluation Framework for the Planning of Electric Car-Sharing Systems: A Combination Model of AHP-CBA-VD

1
Management School, Shanghai University, Shanghai 200444, China
2
School of Automotive Studies, Tongji University, Shanghai 201804, China
*
Author to whom correspondence should be addressed.
Sustainability 2019, 11(20), 5627; https://doi.org/10.3390/su11205627
Submission received: 22 August 2019 / Revised: 29 September 2019 / Accepted: 8 October 2019 / Published: 12 October 2019

Abstract

:
The combination of car-sharing and electric vehicles can increase the acceptance of electric vehicles and facilitate car-sharing to be a more sustainable means of transport. However, this also poses more challenges for the good planning of electric car-sharing systems. To assist car-sharing companies in improving the planning decisions, this paper developed an evaluation framework from a comprehensive view. In the first step, four evaluation criteria were identified according to the planning process: construction of stations; routine inspection; vehicle usability and relocation management; and the maintenance and replacement of stations. Then, a combinatorial method based on analytic hierarchy process (AHP), cost-benefit analysis (CBA), and Voronoi diagram (VD) is developed to determine the relative weight of the four criteria and evaluate the alternative. Finally, the evaluation framework was applied in a realistic case of EVCARD, which is the most influential electric car-sharing company in China. The performance of two different operational districts of EVCARD—Jingan and Changning—were compared. The results showed that vehicle usability and relocation management is the greatest criterion influencing the planning performance of the electric car-sharing system in China, and that routine inspection is a negligible but important factor. According to the relative scores, Jiagan District performed better than Changning district.

1. Introduction

Over the past few decades, road transport has been considered to be a main unsustainable source regarding its large and increasing contribution to high oil dependency and global air pollution, traffic congestion and parking difficulty, and traffic accidents [1,2]. Most of these challenges are related to the rapid increase in the private ownership of internal combustion engine vehicles (ICEVs). In recent years, two main sustainable solutions for the transportation sector are receiving attention around the world. One is car-sharing (CS). Although there has been no unified agreement on the definition of CS until now, most of literature generally accepts its principle as individuals who are able to access vehicles that are shared by a group of members or organizations, on an as-needed basis without paying [3,4]. Typically, CS is maintained and managed by a third-party organization [5]. It was first introduced in 1948 and holds the potential to achieve a reduction in overall personal vehicle ownership as an alternative mode of transportation as well as alleviate traffic congestion and parking difficulties [6]. Typically, the reduction of total vehicle ownership can contribute to reducing CO2 emissions. However, CS may otherwise bring about additional CO2 emissions when users replace previous more environmentally friendly modes of transportation such as public transport, bicycles, or even walking with car-sharing [7]. In general, most scholars believe that CS is a more sustainable mode of transportation even considering the two different effects. The other solution is electric vehicles (EVs), one of the most promising and possible innovations to bring down the consumption of petroleum products and related emissions [8,9,10]. The combination of them (i.e., electric car-sharing system (ECSS)) can help overcome the disadvantages of EVs such as a relatively high initial purchasing cost and the inconvenience of recharging, and further facilitate CS to be a more sustainable means of transportation [11,12].
Typically, CS modalities can be classified into two categories: a station-based system and a free-floating system [13]. A station-based system means that customers must pick up and drop off vehicles at designated stations. A free-floating system, however, allows customers to pick up and drop off vehicles at any parking spot within a large city-wide service area (i.e., the whole operational area of the CS company) [14]. The station-based system provides two different types of schemes: one-way and round-trip station-based schemes. The former means that vehicles much be returned to locations where it is picked up and the latter means that the departure and ending location of vehicles do not need to be the same [14]. The three different systems have both advantages and disadvantages. Round-trip station-based systems are easy to manage for operators, but is not very convenient for users. The YoucheKu company located in Guizhou Province, China is adopting this system. A one-way station-based system can provide relative flexible service to users, but may cause an unbalanced distribution of vehicles at different stations. Most electric car-sharing (ECS) operators such as Car2go and EVCARD choose this system, and this paper thus considered a station-based ECSS with the one-way trip. A free-floating system is more flexible for users than a one-way station-based system, however, it may bring about more complexity in management and more difficulty in profitability [15]. By now, few companies provide free-floating systems; although some companies located in large cities of Germany, Italy, and Switzerland provide a free-floating service [15], the total number is still limited.
For ECS operators, planning a good station-based ECSS with a one-way trip is critical for successful business, however, this is not easy because it is very difficult to achieve a perfect balance between revenue and cost [16]. A flexible ECSS with more stations, more parking areas, and charging facilities are more attractive to ECS users and can in turn create more revenue for its operators. However, such an ECSS plan would definitely result in more cost expenditure [17]. When considering the technical limitations of EVs such as driving range and recharging time, planning an ECSS is even more difficult than a conventional ICEV-based sharing system [12]. How to improve the planning performance of ECSS is thus currently becoming an urgent issue. However, the current academic literature has mostly focused on the optimization of a single aspect of operation and a comprehensive proper framework to evaluate the operation performance of different ECSS approaches in the market is lacking.
This study aimed to examine the operation of an ECSS by developing a comprehensive evaluation framework. The specific research goals included: (1) identifying the evaluation indicators of operation performance of ECSS; (2) determining the relative importance of those indicators and evaluating the operation performance of ECSS alternatives; and (3) developing suggestions for operation improvement based on the evaluation results.
Since constructing a new complex evaluation model was not this paper’s priority, but rather the establishment of a comprehensive and general evaluation framework of an ECSS operation in the market, this paper tended to adopt some widely accepted practical models for analysis. AHP (Analytic Hierarchy Process), which was first proposed by Saaty [18], is a generally accepted better method for assigning ranking alternatives [19]. The AHP technique can facilitate decomposing and evaluating complex systems [20] and rank alternatives based on their degree of meeting the initial objective [21]. It has been applied in many fields such as plant selection for phytoremediation of petroleum-contaminated soils in shale gas and oil fields [22], 3D scanners for cultural heritage applications [19], strategies for sustainable energy planning [23], livelihood options for effective and sustainable rural development interventions [24], mobile health applications [25], and private investment preferences in the Chinese biogas sector [26]. The operation of an ECSS is a complex system and needs to be market-oriented. Its performance is influenced by many quantitative revenue-related and cost-related factors. Thus, the operation evaluation of an ECSS should be as objective as possible and based on quantitative judgement. This study adopted the AHP method to evaluate the planning of an ECSS. This method is essentially a logical mathematical model and has been proven to be a useful tool for multi criteria decision-making. However, to the best of the authors’ knowledge, AHP has not yet been used to evaluate the operation performance of an ECSS in any country.
In the application of the AHP method, one critical issue is how to reduce uncertainty in the experts’ opinions and improve the assessment accuracy [27]. In such cases, some extension models have been proposed [27,28] and a current important improvement direction is to combine practical analysis tools such as SWOT (Strength, Weakness, Opportunity, Threat) with AHP to systematically determine the indicators and sub-indicators and provide a clearer reference assessment for the experts’ assessment [26,29,30]. However, the SWOT method focuses on decomposing complex strategy systems into opportunities, threats, strengths, and weakness, which may not be suitable for an ECSS. As elaborated above, an ECSS operation is a complex system, of which a good operation system must achieve a balance between revenue (benefits) and costs, in other words, revenue-related and cost-related factors should be the key indicators of performance.
Cost–benefit analysis has a long history in the economy with distortions [31]. Now, it has become a common tool for economically analyzing the efficiency of policies and investment decisions [32]. Recently, there have been several cost–benefit analyses conducted on CS [33], electric vehicles [34], offshore wind energy [35], active cold storage for building demand management [36], and geothermal heat pump de-icing systems [37]. In this method, all relevant costs and benefits need to be listed and quantified as much as possible, which is consistent with the characteristics of an ECSS operation. Therefore, we tried to combine CBA with the AHP in this paper to decompose the operation of an ECSS from a cost and benefit perspective. A comprehensive list of interrelated critical evaluation indicators was identified, with the aim to provide experts with a judgement reference.
The AHP-CBA-VD is a further combination of analysis tools to further improve the objective of judgement as well as to develop recommendations with regard to performance improvement. The VD is regarded as a trusted and powerful tool to study geometric proximity [38,39] and has been used in many fields such as geography, forestry, chemistry, and biology [40]. Among these fields, the VD has played an important role in the location allocation of facilities [41]. For a one-way CS system, planning the location of stations is a very important factor influencing its operation efficiency, as described above, and its importance will become more prominent for a one-way ECSS [42]. However, a cost–benefit analysis can only provide economic criteria for distributing the geographic location of car-sharing stations and is hardly able to provide judgement criteria for location distribution from a geographical perspective. Therefore, we attempted to combine the VD with CBA and AHP in this study. Specifically, we tried to summarize some basic principles of ideal station distribution based on the actual situation of the ECSS in China and take these principles with the cost-related and benefit-related factors as a reference for evaluating alternatives.
The above analysis demonstrates that the AHP-CBA-VD is suitable for the research aim. CBA and VD are incorporated into AHP, which allows a judgement reference to be derived from a cost–benefit analysis and station distribution, and determines the relative weight for each criterion. The contribution of this paper is thus to fill in the gap in the existing research through a combinatorial decision support tool for evaluating the planning of an ECSS. This combinatorial model of AHP-CBA-VD allows experts to judge each alternative more quantitatively and ECS operators to precisely compare their operation performance with others and determine directions for improvement.
The rest of the paper is organized as follows: Section 2 reviews the previous research in this field. Section 3 defines the critical evaluation indicators where some important indicators have been ignored by past research. In order to determine the evaluation indicators, a literature review and the opinions of experts and scholars with a background in CS and EVs were integrated. Then, a combination model of AHP-CBA-VD is developed in Section 4. CBA and VD were adopted to supplement the classical AHP. Experts would be given a detailed assessment reference extracted from the methods of CBA and VD in order to better quantify and objectify the weights of each criterion and the values of alternatives with respect to each criterion. A realistic case that describes one influential electric car-sharing (ECS) company in China is conducted in Section 5 to illustrate the procedure of the proposed evaluation framework. In the last section, we summarize the paper and some policy suggestions are provided.

2. Literature Review

2.1. Evaluation of Car-sharing (CS)

To comprehensively review the relevant studies, the literature in this part includes both ECSS and conventional systems. According to the study by Qu et al. [3], the evaluation of CS or ECSS has gained considerable attention in recent years and most of the research has focused on the benefit evaluation brought by CS to consumers and the society. For example, Fellows and Pitfield [33] employed cost benefit analysis techniques to examine the economic benefits of CS under three scenarios with different participation rates. The results showed that CS could bring great economic benefits (journey costs, vehicle kilometers, average speeds, fuel, accidents, and emissions) for both individuals and society, even with conservative participation rates and relative low patronage. In addition, two major road schemes in the UK were compared with CS where CS produced comparable economic benefits with less implementation costs. Kopp et al. [43] evaluated the overall travel behavior of free-floating CS members and non-car sharers through an innovative survey design GPS tracking smartphone application. This demonstrates that the travel behavior of CS members tends to be more purpose-oriented and flexible. Different travel modes are better used by CS members, which means that free-floating CS can perform more trips with less traffic. Rabbitt and Ghosh [44] assessed the economic and environmental influence of CS in Ireland and the results showed that CS could benefit both the individual in terms of travel cost savings, and society in terms of CO2 emissions reduction. Schlüter and Weyer [45] adopted the technology acceptance model to evaluate the impact of CS on EV acceptance. Nijland and van Meerkerk [7] assessed the impact of CS on car ownership, car use, and the possible benefits on CO2 emissions. The results showed that CS could greatly reduce car ownership by 30% and car use by 15–20%. Moreover, CS could also benefit the reduction of CO2 emissions, even considering its possible alternative to public transport or walking.
The above analysis reveals that most of the existing studies have focused on the benefit evaluation of CS systems including social, economic, and environmental benefits to society and consumers, especially from the environmental aspect where they have tried to explore whether CS can contribute to emissions reduction, traffic congestion alleviation, or travel cost reductions. In addition, most research has selected the one-way station-based CS modality as the research object and the other two modalities (i.e., round-trip station-based CS modality and free-floating CS modality) are less studied [42]. Like most of the previous literature, this paper also focused on the one-way modality. However, unlike the previous literature, this paper tried to evaluate the performance of an ECCS from the perspective of the operators instead of evaluating the benefits of CS to consumers or society as a whole.

2.2. Planning the CS

Planning is an integral part of CS and it is very difficult for CS operators to achieve successful design and planning. Typically, the planning of a CS system can be categorized into strategic and operational planning [13].
The operational planning of CS systems mainly refers to the daily operation management such as assigning travel to vehicles, re-balancing the one-way system, or relocation management such as the redistribution of vehicles between stations [46], maintenance, and so on. For example, Cepolina et al. [47] developed an object-oriented simulator to assess the different impacts of three relocation procedure systems on the level of service and efficiency of urban CS systems. Deng and Cardin [16] developed a simulation-based solution approach to explore how to minimize the overall daily and maintain a certain service level through vehicle redistribution. Nourinejad et al. [46] not only considered the optimization of car relocation, but also explored the optimization of staff relocation. Two integrated multi-traveling salesman formulations were used to analyze the joint optimization of the above-mentioned questions.
However, for an ECSS, avoiding battery depletion is an additional critical operation decision that must be considered when compared to conventional CS systems [13]. EVs must be charged at an idle time and ECSS operators must consider the battery status when relocating the shared EVs. For example, Gambella et al. [13] presented a mathematical model to explore how to maximize profit through vehicle relocation, while the battery consumption and recharging are key constraints of the model. Lemme et al. [48] presented an optimization model assessing the economic and environmental influence of different technologies including EVs and ICEVs to determine the optimal fleet composition in station-based CS systems. Weikl and Bogenberger [49] used the free-floating CS system with both ICEVs and EVs as the research object and developed a practice-ready relocation optimization model where recharging EVs and the relocation of assigning fully charged EVs to unblock charging stations were integrated. Folkestad et al. [50] explored the problem of how to optimize the charging and repositioning of shared EVs in one free-floating ECSS. A mixed integer programming model was developed to minimize the route distance of staff relocating EVs with depleted batteries to charging stations and relocating EVs.
Strategic planning may need to take a relatively longer time for decision-making when compared to daily operational planning [13]. This involves many interacting aspects such as the number and locations of stations, the sizes of the vehicle fleet and relocation team, and the station capacity [49]. For example, Deveci et al. [51] proposed a weighted aggregated sum product assessment based technique for order preference by similarity to the ideal solution with an interval type-2 fuzzy multi-criteria decision-making model to help CS companies with station site selection. Correia et al. [52] adopted a mixed-integer programming model to optimize the depot locations in a one-way CS under three trip selection schemes, with the objective to maximize profit. Santos and Correia [53] also adopted a mixed-integer linear programing model to explore the optimization of relocation in a one-way CS. In addition to relocation, the optimization of another important aspect, daily maintenance, is also jointly discussed in this paper.
However, the strategic planning of an ECSS needs to consider the additional charging time issue when designing the fleet size and station locations when compared to conventional ICEV-based sharing systems. For example, Li et al. [54] introduced a continuum approximation model to determine the optimal station locations and EV inventories of an ECSS under a battery charging constraint. Brandstätter et al. [55] pointed out that unlike conventional ICEV-based sharing systems, ECSS operators usually needed to consider putting charging stations along the trips of users, rather than at only the departure and end points, when considering the recharging demand of EVs. They proposed a two-stage integer linear program to solve the problems of the location selection of ECCS stations by incorporating the recharging issue in the traditional models with an assumption of the given stochastic demand forecast. Xu and Meng [56] adopted the set partitioning model to explore the optimal fleet size for a one-way ECSS by taking into account the nonlinear EV charging profile.
Through the above-mentioned analysis, we found that the previous literature on the planning of an ECSS had been mainly conducted on optimization problems rather than evaluation. Unlike the existing literature, the research aim of this paper was an evaluation of planning performance. In addition, among the existing literature, the three topics that are the most frequently discussed are location, fleet size, and daily relocation. However, other planning decisions such as routine inspection and the growth strategies of stations (i. e. closing existing stations or opening new ones) during the operation process have seldom been discussed. In fact, the planning performance of an ECSS is influenced by a series of interacting elements. Therefore, this study contributes to the evaluation of planning systems from a comprehensive perspective. A detailed explanation on the comprehensive evaluation framework can be found in Section 3 and Section 4.

3. Identification of Planning Evaluation Criteria

The planning evaluation of an ECSS is a complex system with many hierarchies. To establish a comprehensive evaluation system, this paper structured the preliminary criteria by reviewing the related academic literature and taking opinions from experts. Four major indicators and their definitions are summarized and presented in Table 1. The four indicators involve both strategic and operational planning and cover the whole process of the ECSS planning. Specifically, the indicators of construction of stations and maintenance & replacement of stations both belong to strategic planning, which may be the first and last step of ECSS planning. They basically include all the station-related decisions such as the location or distribution of stations, the capacity of each station, the total number of stations built and the fleet size of each station, maintaining the stations, closing the stations, and opening new stations. The indicators of routine inspection and vehicle usability & relocation management both belong to operational planning, which involve the various aspects of daily operation such as routine checks and relocation. The four indicators interact with each other and are intrinsically linked to each other, therefore, they have a collective effect on revenue and cost.
The detailed description of the four indicators are as follows. It is worth mentioning that this paper focused on the planning system. Therefore, the power supply system, types of EVs, and charging facilities were considered as fixed.

3.1. Construction of CS Stations (CSS)

To overcome the recharge disadvantages of EVs and get the expected profit, Brandstätter et al. [55] mentioned that making proper strategic decisions about how to build a set of car-sharing stations is critical for operators. The construction of stations in this study refers to the station network layout, which involves many interrelating decisions such as the location, capacity and number of stations, and fleet size [57]. This is an indispensable factor for comprehensively evaluating the planning of an ECSS [16] because it greatly influences both the attractiveness level of the ECSS for consumers and the costs for operators. A relatively dense network distribution and more available EVs can provide better service for consumers, whereas these would result in more construction and operation costs for operators. Good planning requires a balance between them.

3.2. Routine Inspection (RI)

Routine inspection, which is an important factor in achieving good planning performance, has not been identified by most previous studies. Typically, it refers to checking whether there are issues such as the occupation of parking spaces, vehicle or battery failure, in the infrastructure or vehicles, with the aim to improve equipment reliability and operation quality.
In practice, the efficiency of such patrols is influenced by many things such as the design of station network and the monitoring equipment. Typically, the more frequently EVs at one station are used, the greater the pressure of routine inspection. Therefore, excessive use of EVs at some stations may exert a great burden on the routine inspection, if the CS station network is not appropriately constructed. In addition, it is necessary to rationally design the monitoring and emergency equipment because the installation and technical level of these equipment would influence the demand and efficiency for and of routine inspection. For example, with good monitoring equipment, the parking vehicles with temporary malfunctions in charging can be discovered in a timely manner and relevant information can be quickly transmitted to inspectors by monitoring the real-time operation of vehicles.

3.3. Vehicle Usability and Relocation Management (VURM)

Vehicle usability is defined as user flexibility in picking up and returning vehicles, by which user satisfaction is basically determined. This factor is influenced by the distance between the users’ origin and pick-up stations, drop-off stations, and their destination, which is in turn determined by the station network and availability of vehicles at stations. Usually, an over-radius of service would reduce the convenience of users; too small a service radius, however, would cause competition from other transportation modes such as on-demand mobility services (Uber, Lyft, etc.) and sharing bicycles.
In the one-way system, another major planning decision is vehicle relocation [46]. This term can be defined as a vehicle being relocated by staff from one station to another to re-balance the vehicle distribution. It is a basic strategy for cutting down operation costs [17]. According to the study of Gambella et al. [13] and Weikl and Bogenberger [49], the objectives of relocation can be categorized into different types based on the relocation strategy such as minimizing the relocation distance or costs, maximizing the operator profits, and maximizing the users’ benefit.

3.4. Maintenance and Replacement of Stations (MR)

The MR in this paper refers to the operating or closing existing inefficient ECSS or creating new ECSS, in other words, the growth strategy planning of the ECSS. This dimension has been ignored by previous literature because most studies have focused on how to optimally distribute the ECSS before starting the business. However, this is an indispensable part of optimizing the distribution network and improving service since some unpredictable problems may occur during the daily operation.
Regarding the MR, two aspects need to be considered, that is, frequency of maintenance and period of replacement. If the maintenance frequency is too high, the user experience about the charging stations may be affected. However, too low frequency may bring about greater potential problems. Similarly, a too short replacement period may lead to users’ concerns and confusion about the stability of the ECSS. However, under the situation of a too long replacement period, the distribution of ECSS may not be able to adapt to the changes in the users’ needs or if some useless ECSS may result in a waste of resources.

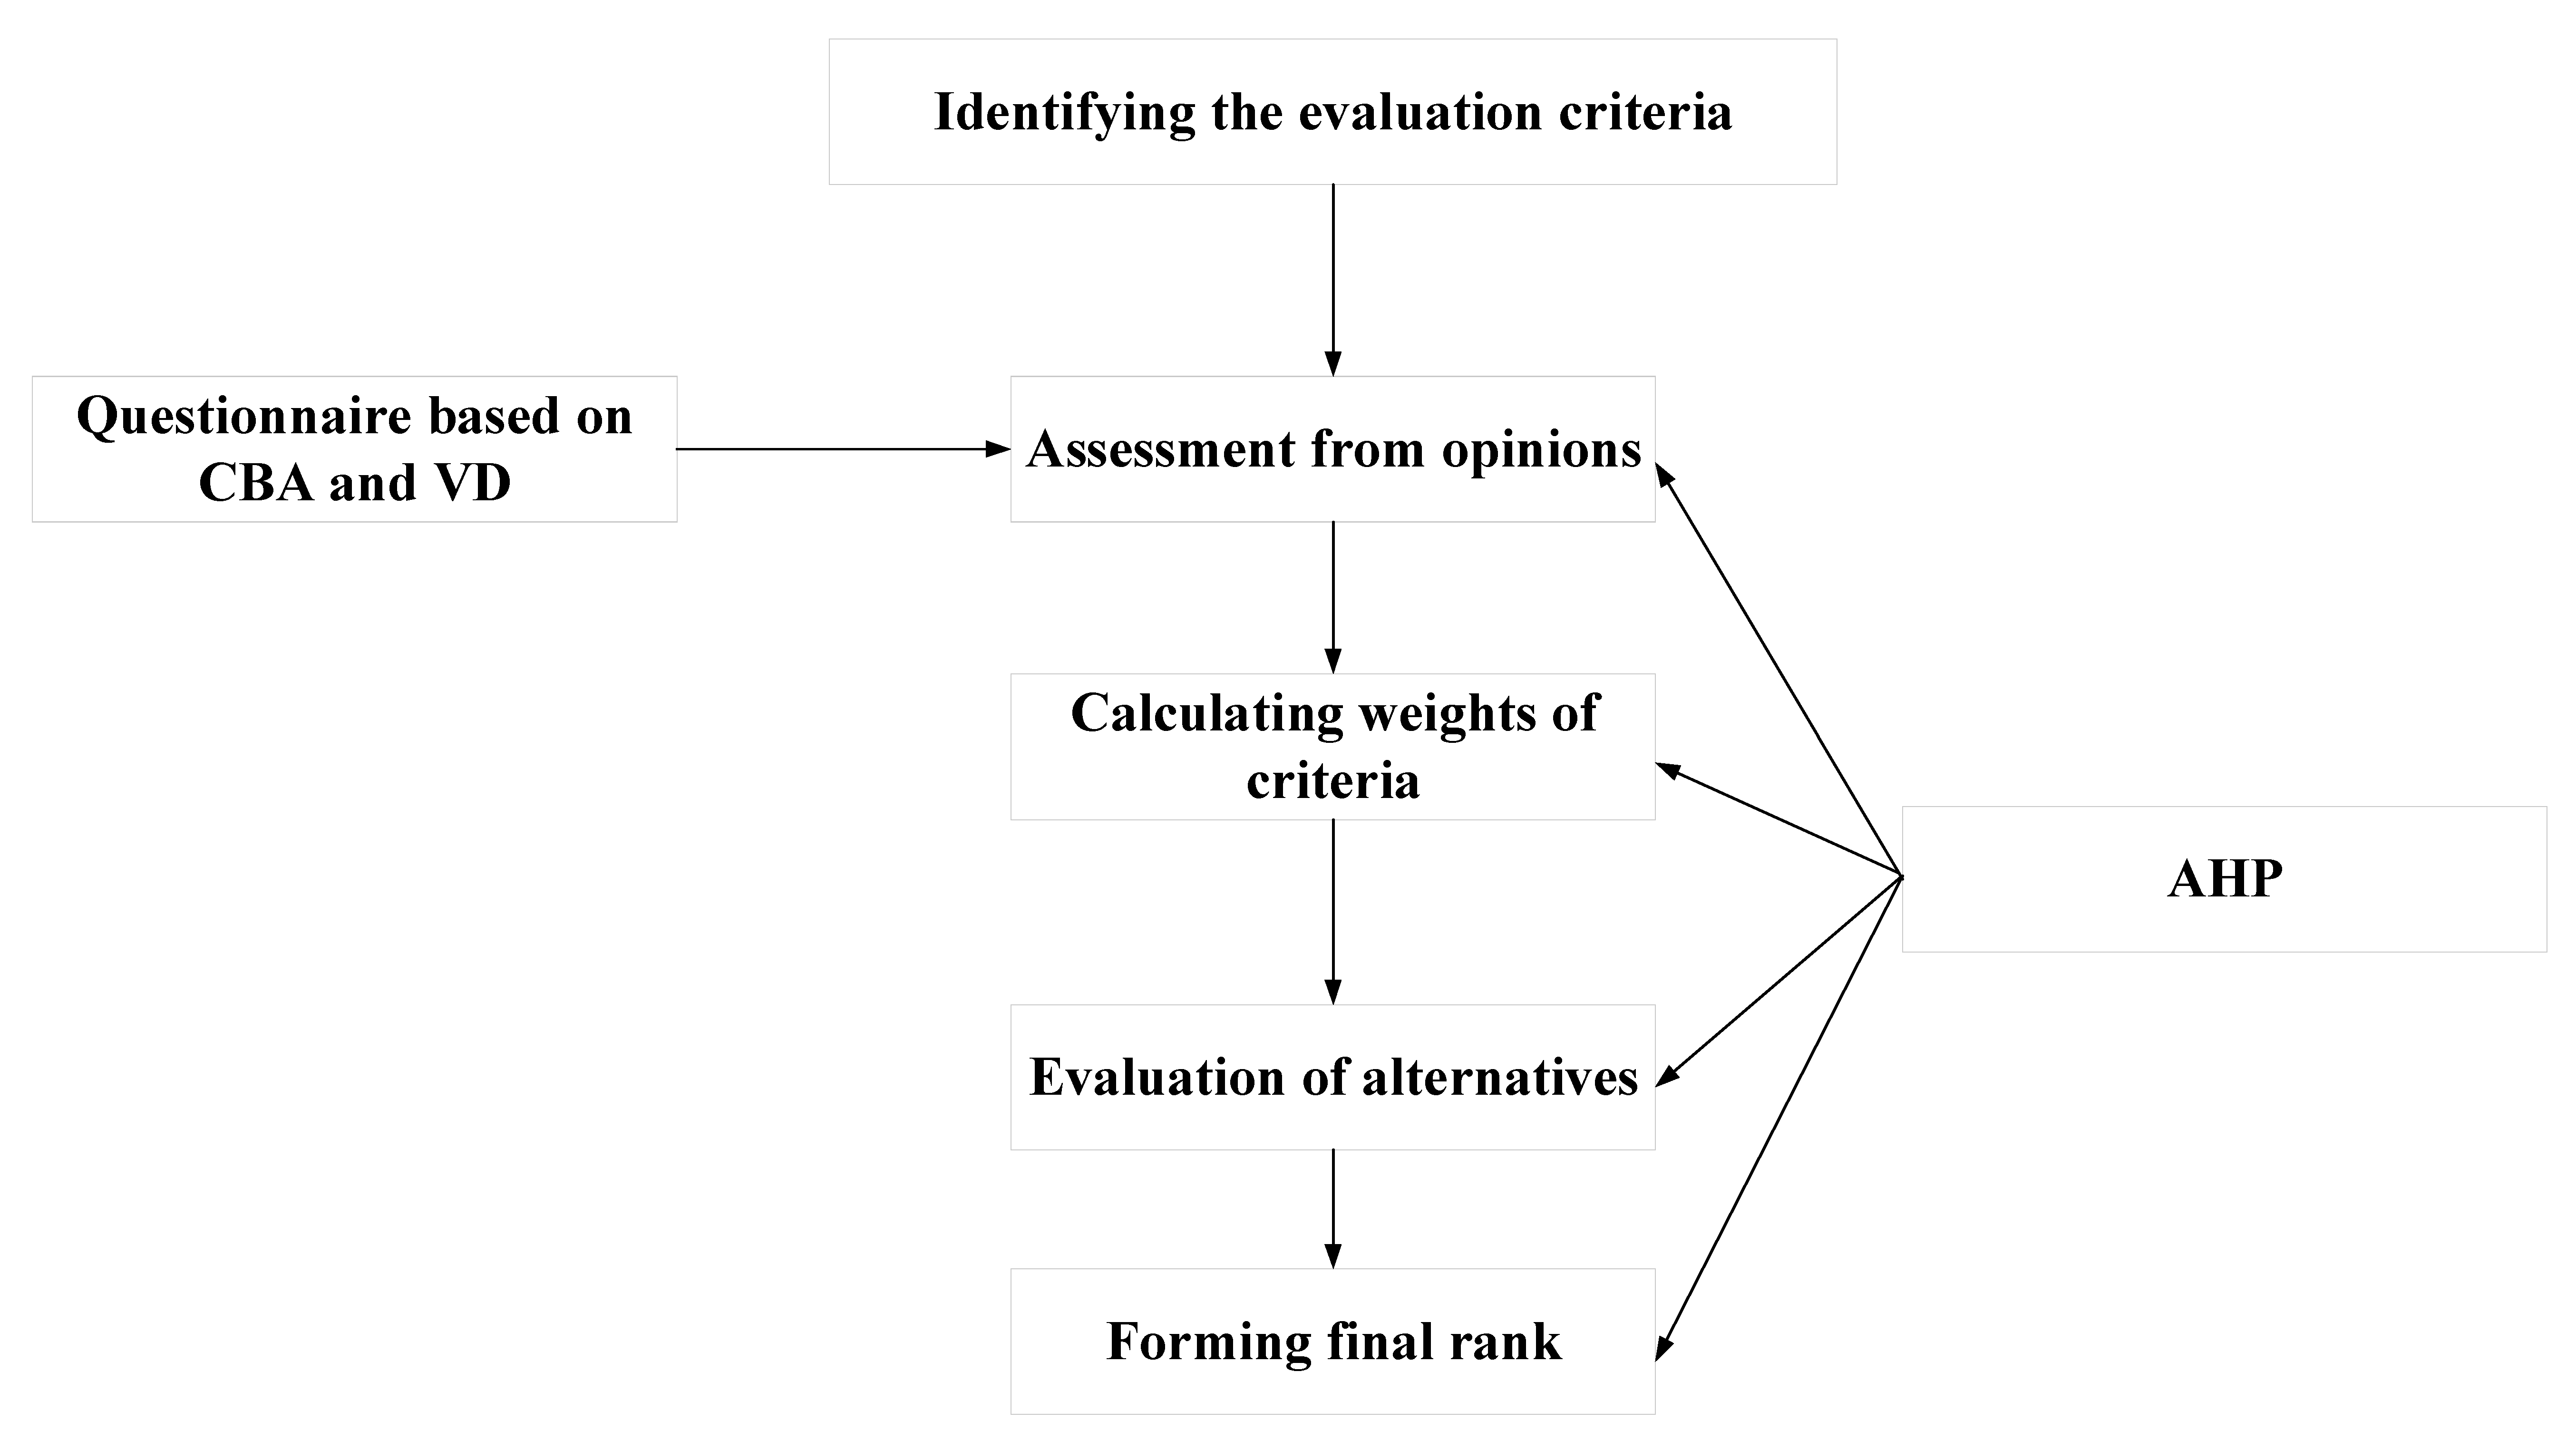
4. Research Methodology

4.1. Analytic Hierarchy Process (AHP)

AHP in this paper is composed of the following five steps.

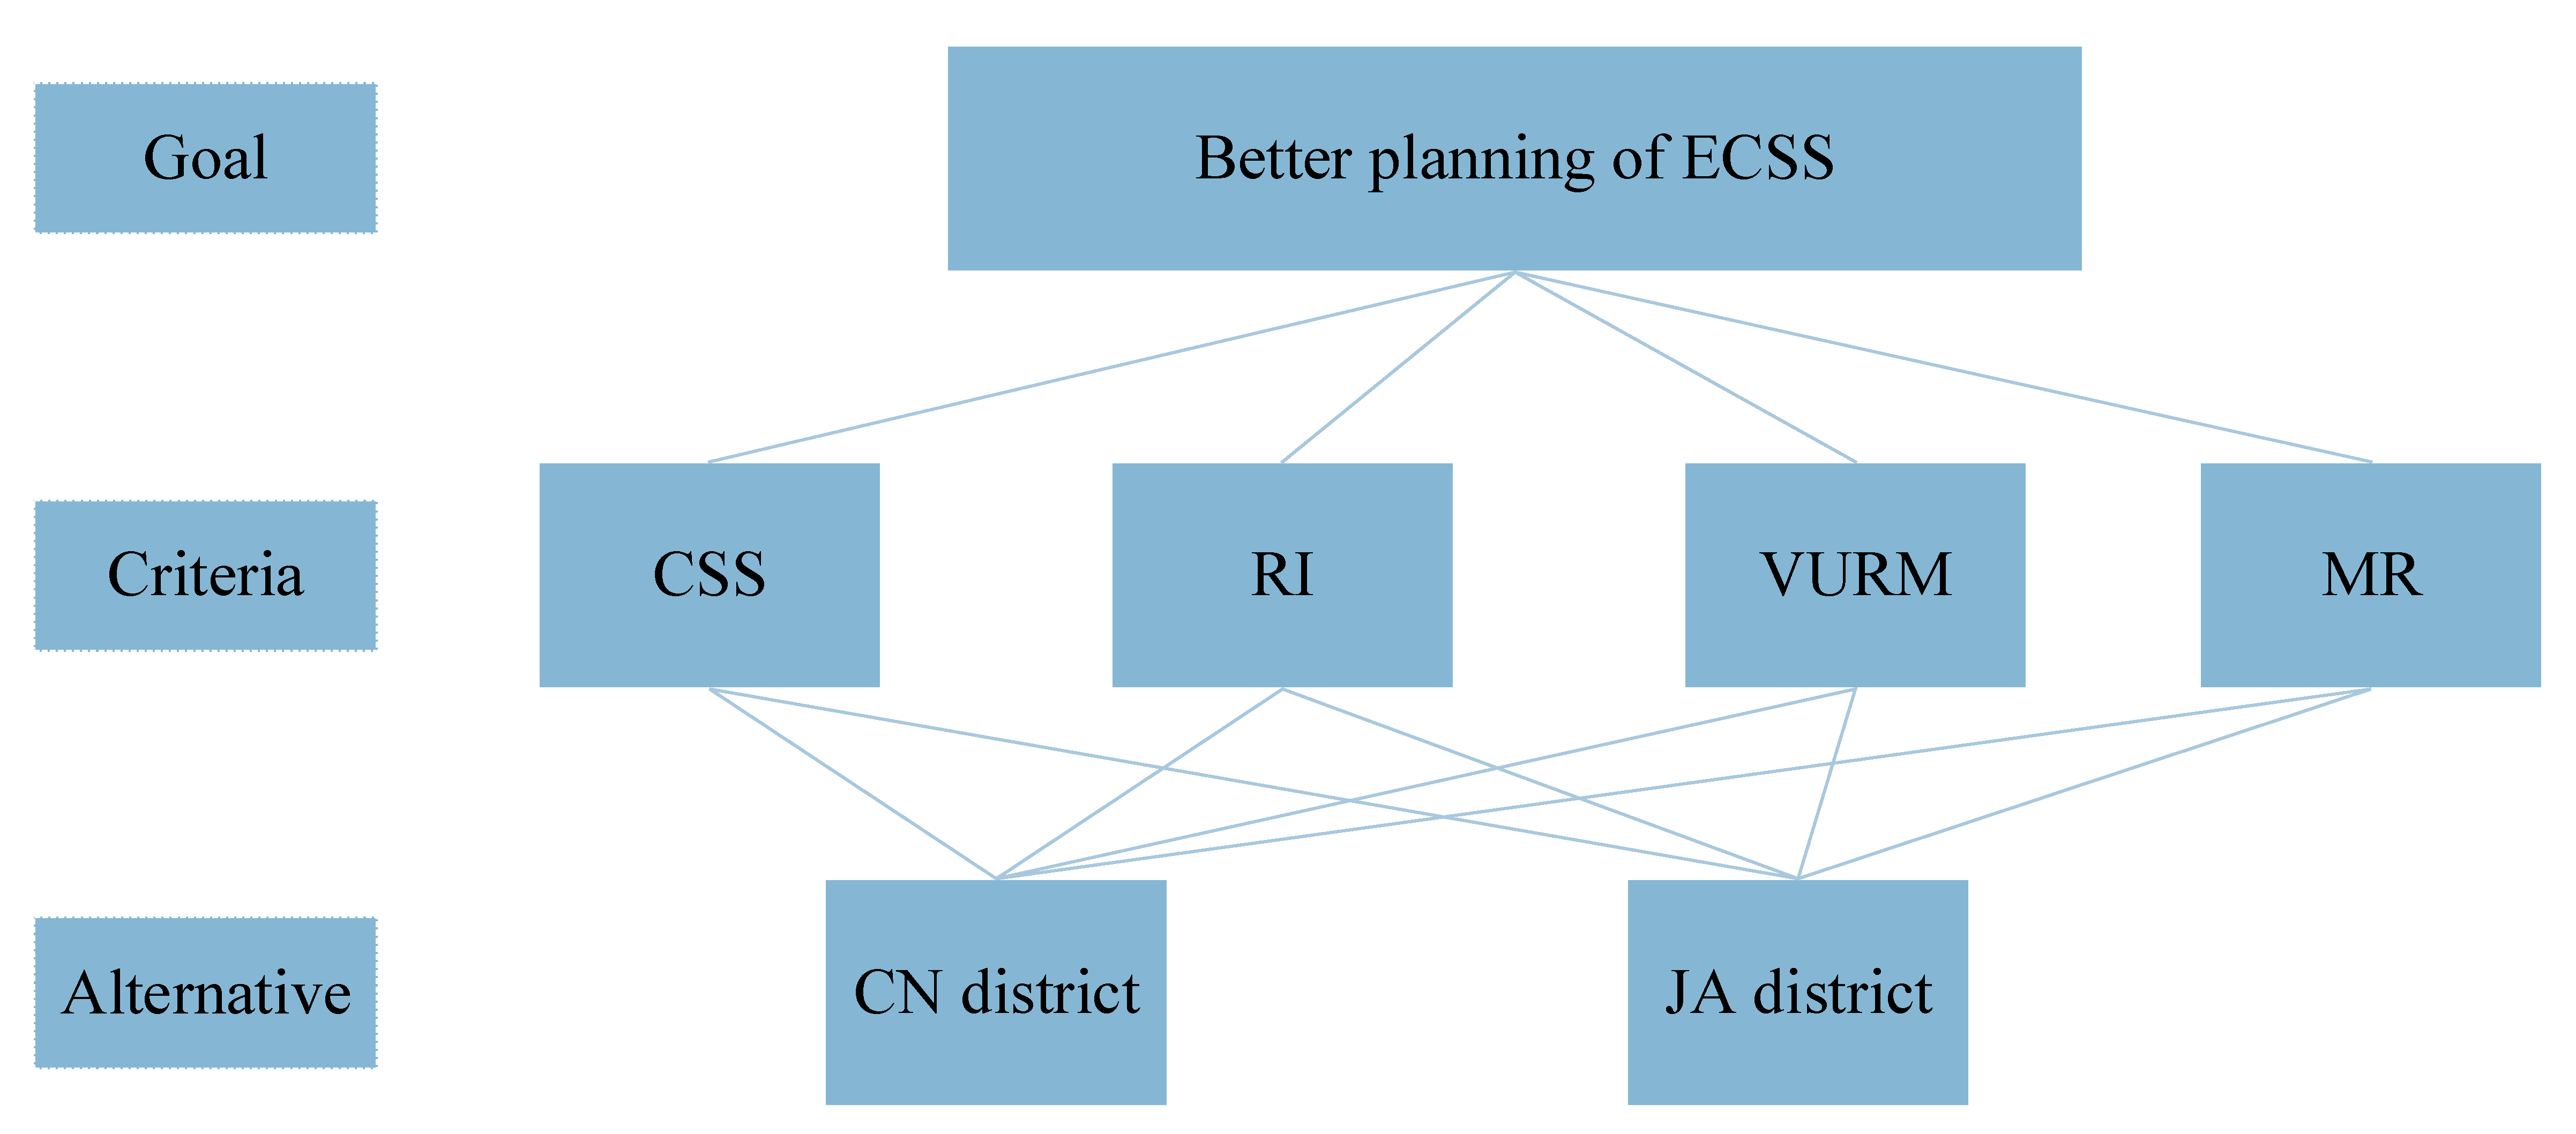
4.1.1. Construction of the Hierarchical Structure

The hierarchical structure consists of three levels: the goal of the decision, the criteria necessary to achieve the goal, and the set of alternatives.
In this paper, the goal was to evaluate the planning of an ECSS by ranking different alternatives. The results of the evaluation would have significant implications for the performance improvement of CS operators. To better achieve this goal, four criteria, CSS, RI, VURM, and MR were selected for the evaluation based on the literature and expert interviews, as described in Section 3.

4.1.2. Formulation of Pair-Wise Comparison Matrix

A pair-wise comparison matrix was developed according to the experts’ judgement on the relative importance of each criteria. The judgement was provided based on Satty’s 9-point scale [19]. Let i, j represent two different criteria in the AHP, respectively, then conducting a pairwise comparison among “n” criteria to obtain a n×n pair-wise comparison matrix A. Each component in matrix A, aij (i,j = 1,2,...,n), denotes the relative importance of criteria i to j, and aji = 1/aij.

4.1.3. Calculation of Eigen Value and Eigen Vector

Eigen value Wi refers to the weight of each criteria, which can be calculated through
W i = j = 1 n a i j n
a i j = a i j i = 1 n a i j
Eigen vector W = (W1, W2…, Wn)T. W’ = A × W, then, the largest eigen value λmax can be obtained through
λ max = i = 1 n ( W ) i n × W i = i = 1 n ( A × W ) i n × W i

4.1.4. Determination of Consistency Ration (CR)

After obtaining the largest eigen value, the consistency index (CI) can be calculated as follows
C I = ( λ max n ) n 1
Then, CR = CI/RI, where RI is the random index. CR is the measurement indicator of the consistency of the pair-wise comparison matrix. Generally speaking, the smaller the CR, the better the consistency of the matrix. According to the AHP method, if the value of CR is not more than 0.1, then the consistence of the matrix is acceptable [17].

4.1.5. Ranking the Alternatives

The last step is to rank the alternatives based on their aggregate priority values, which can be obtained by aggregating the weight of each criterion with respect to the goal and the weights of alternatives with respect to each criterion.

4.2. Cost-benefit Analysis (CBA)

In this section, we adopted CBA to further decompose the criteria and construct the questionnaire for the assessment reference. Specifically, the following steps were employed.

4.2.1. Identifying Sub-Factors Based on CBA

In order to make the values of different alternatives reflect the actual planning status, this paper lists the factors that need to be considered when experts make assessments and defines each factor in detail. Based on the previous literature and expert interviews, thirteen factors are proposed, and their definitions are shown in Table 2. Experts compared the specific performance of alternatives on each factor to obtain the whole assessment value of each alternative.

4.2.2. Constructing the Questionnaire Based on CBA

Based on Table 2, we constructed a questionnaire for the experts’ assessment reference, to better quantitatively analyze the criteria. This questionnaire was comprised of several questions that reflected the possible costs and revenues for the operators and the benefits for consumers based on the definition of each criterion (Table 3) and each question corresponded to the sub-factors in Table 2. The experts were asked to score each question in the questionnaire on a scale of 1 to 10 according to their importance in the planning of an ECSS. The average values of each criterion can thus be obtained. The difference between the two average values can reflect the relative importance of each criterion.

4.3. Voronoi Diagram

Generally, a VD is a partitioning of a plane into regions based on the distance to a set of points (or called generators, sites, seeds) that are randomly arranged in the plane [67]. For each generator, there is a corresponding region around it and the distance of all points in this region is shorter to this generator than to any other Voronoi generator. These regions are called Voronoi cells.
Given a planar n-point set R, R = {R1, R2, …, Rn}, then the Voronoi cell V(Ri) for the generator Ri can be defined as
V ( R i ) = { x V ( R i ) d ( x , R i ) d ( x , R j ) , j = 1 , 2 , , n ; i j }
where d(x, Ri) refers to the Euclidean distance between point x and Ri. Interested readers can refer to the study by Senechal et al. [40] for more descriptions on the VD.
In this section, we summarize some of the basic principles for an ideal station distribution based on the actual situation of the ECSS in China, and used these principles with the thirteen factors in Table 2 as a reference for evaluating the alternatives. The method was carried out as follows.

4.3.1. Determining the Generator Point Sets

Clarifying the planar point sets is the basic premise of constructing the VD. In reality, the places that can generate fixed traffic demand are usually the origins or destinations of the consumers’ travel and these places can be regarded as generators. Based on the study by Hu et al. [68], three types of generator sets are chosen according to the actual traffic. Set A, A = {a1, a2, …, am}, 1 < m < ∞, represents transportation centers including airports, railway stations, bus stations, and ferry terminals where consumers usually have a fixed transportation demand and distribution demand of logistics. Set B, B = {b1, b2, …, bm}, 1 < m < ∞, consists of hotels, places related science, education, culture, and health and parks where consumers usually have a demand for car-sharing services. Set C, C = {c1, c2, …, cm}, 1 < m < , is a set of urban sub-centers in a certain area such as the central business district.

4.3.2. Analyzing the Demand Characteristics for the ECSS

Consumer demand for CS systems in different planar point sets has different characteristics. It is important to analyze these characteristics to judge whether the network of CS stations can adapt to the characteristics of these demands. By reviewing the relevant literature and examining the actual situation in China, the characteristics can be summarized as follows.
Specifically, for consumers who plan to leave places belonging to set A, their travel destinations are mostly 10 km away. For consumers whose destinations belong to set A, they mostly need the point-to-point service on renting and returning vehicles. Therefore, the distance between each ECS station in set A should not be less than 10 km in order to avoid redundancy. This principle is combined with the factors of the ‘coverage rate’ and ‘distance between picking and returning EVs’ for evaluation.
The places in set B are mainly industrial parks and universities. The population density in these places are relatively stable and the space for parking and charging of CS is relatively large. Target users in these places usually have their specific usage scenarios for car-sharing. For example, college students in China rarely own private cars, however, many of them usually spend a long time traveling such as traveling between different campuses of universities for studying or traveling for leisure. [69]. Compared to public transit, which is not adequately provided in some Chinese cities, it is very convenient for these students to rent out or return the shared cars since they live on the campus. According to previous studies [68], there exist positive relationships between the capacity of a station (or called service unit, in terms of parking areas and charging facilities) [16] and shared car usage. To satisfy the CS demands, the capacity in each station belonging to set B should be more than the average capacity of the stations belonging to set C. This principle is combined with the factor of ‘number ratio of stations to EVs’ for evaluation.
For set C, there are usually more pedestrian facilities and shared bicycles in the urban sub-centers. The public transportation is much more convenient and the rental of parking space in these regions is much higher. Therefore, we can consider that within a circular area of which the radius is 2 km, the number of CS stations should not be more than one. This principle is combined with the factor of ‘coverage rate’ for evaluation.

4.3.3. Analyzing the Service Areas

The recharging and parking service provided by the EVS is similar to a location-based service that can deliver geographic information to shared car users so that they can find the nearest station. Therefore, this paper analyzed the service areas of each ECS station through the generation of a VD. Specifically, the incremental method and divide-and-conquer method were jointly adopted to generate the service areas. The incremental method emphasizes randomly inserting the point in the planar one by one. Each point generates a new Voronoi cell and modifies the lines of previous Voronoi cells. However, this may result in some loss of efficiency when applied to general sites [68]. The divide-and-conquer method is suitable for constructing whole objects, emphasizes turning all objects in the database into a binary tree structure, and adopts the recursive method to merge the branches with the same root until the whole Voronoi diagram is reached [70].
First, we generated the service areas of stations belonging to set C, when considering the openness of urban sub centers. According to the incremental method, we added the station, which was considered as a generator point, one by one randomly on the planar space. Each addition of a station would result in the generation of a new Voronoi cell and the modification of the lines of the original Voronoi cells. After all of the stations belonging to site C are added in the planar space, we can obtain their original service areas.
According to the divide-and-conquer method, we took each Voronoi cell generated in the incremental method as a sub-segment. The stations (belonging to A, B, and C) located in each sub-segment are regarded as generator points and spread outward simultaneously at the same speed. Thus, we can obtain the sub VDs. The neighboring sub VDs are integrated and the whole Voronoi diagram is generated. Each Voronoi cell in this Voronoi diagram stands for the service area of each station area.

4.3.4. Estimating the Capacity of the ECS

To make an estimation of the number of service units of each station in sets A, B, and C, this paper adopted the analysis method of Wang et al. [69] and Sun et al. [71], which is based on the variable of traffic flow. Interested readers can refer to the two studies for further information. The number of charging piles in one CS station relies on several variables such as the service radius of the station, which determines the number of contained road nodes, the potential shared EV flows, charging power of charging piles, and recharging rate of chargers. The prerequisite is that each ECS can satisfy the recharging demand for all shared EVs that use the station and maximize the expected value of the charging stations.
Since the purpose of this paper is to evaluate the planning performance rather than determining the optimal capacity of stations, we provide a brief estimation of the capacity of each ECS. The capacity of each ECSS should be more than three service units because the number of shared EVs in the fleet size in most ECS systems in China is over three. A flow chart showing the research process is presented in Figure 1.

5. Case Study

5.1. Study Area

To identify the set of alternatives, this paper adopted the EVCARD as the evaluation case. According to the Electric Vehicle Initiative signed by eight countries including China and the United States in April 2011, Shanghai was selected the first international demonstration city for EVs. The Shanghai International Automobile City (SIAC), a municipal owned enterprise, was then established to be responsible for the international demonstration in Shanghai. EVCARD is the first and biggest EV sharing program in China, which was launched by the SIAC in July 2013 and formally put into operation in January 2015. EVCARD provides users with a self-service rental service after they register a membership. By the end of 2018, EVCARD had 3.4 million registered members, and operated a whole fleet of more than 38,000 EVs in China. A total of 13,000 stations have been constructed and are distributed in Shanghai, Zhejiang Province, Jiangsu Province, Hainan Province, and Chongqing. In Shanghai, EVCARD operates about 2130 stations, with most of them distributed in industrial parks, traffic hubs, universities, and business centers.
This study took the Changning (hereinafter referred to as CN) district and Jingan (hereinafter referred to as JA) district as the evaluation objects. This selection relied on three reasons. First, all stations in the two districts belong to public use rather than internal use, so the planning performance of the two districts can be equally compared. Second, the stations of the two districts contain the three types of A, B, and C, thus the planning performance could be comprehensively evaluated. Third, as above-mentioned, this paper only discusses the ECSS with a one-way system, and all stations in the two districts provided a one-way service. A detailed description of EVCARD stations in the two districts is presented in Table A1 in Appendix A.
According to the above analysis, the hierarchical structure was formed for the evaluation, as shown in Figure 2.

5.2. Data Collection

The number of experts needed for a reliable AHP interview has not been agreed on in the past, so the range of which can be one to a large number [72]. However, Thanki et al. [73] pointed out that the AHP method with a large number of respondents may be impractical due to the inconsistency. For example, the number of experts in the study by Angelo et al. [19] was only two; while it was ten in the study by Solangi et al. [22]. In this paper, ten relevant experts were first identified, and a brief profile of the experts is listed in Table 4. (1) Industrial practitioners of ECS (five respondents). To improve the accuracy of evaluation, the industrial experts selected in this paper all had more than 5-years of work experience in ECS in China. (2) Government agencies (two respondents). They are one key category of ECS stakeholders in China [74], which act in both supportive and ‘control’ roles. Experts from the government agencies are responsible for the promotion of electric vehicles and car-sharing in Shanghai. (3) Academic experts (three respondents). Professionals with relevant knowledge on EVs and CS were invited for evaluation from universities and research institutes.
Then, the experts were consulted to examine the proposed criterion (Table 1) and sub-factors (Table 2) were summarized from the relevant literature. After that, the experts were asked to fill in a questionnaire to compare the weight of each criterion. Finally, the experts were given detailed information about the sub-factors from the CBA principles from VD so that they could better evaluate the relative values of the CN and JA districts. The whole surveys were conducted through face-to-face interviews and email.

5.3. Results and Analysis

5.3.1. Criteria Hierarchy Results

Columns 3 and 4 of Table 3 show the results of the interviews on the importance of each criterion. After pairwise comparison, the difference between the average evaluation scores of each criterion could be obtained, as shown in Table 5. As presented in Table 3, the average score of VURM was the largest (i.e., 9.300) and the average score of MR was the lowest (i.e., 6.200). Thus, the maximum difference between the average evaluation scores was about 3.100. Since the AHP method adopts the 9-point scale, therefore the numbers in Table 5 were changed into a 9-point scale. In light of the maximum difference between two criteria being about 3.100, the relative importance degree was graded according to the difference size of 0.300. According to the 9-point scale, the pairwise comparison matrix was obtained in Table 6, and the relative weights of each criterion are demonstrated in Table 7.
Table 7 indicates that VURM had the greatest influence (62.5%) on the operation performance of the ECSS, followed by CSS (16.5%), RI (16.5%), and MR (4.5%). Among the four criteria, VURM is the most widely studied factor in the previous literature, which is consistent with the results of this paper. The score of CR was less than 0.1, which means that the consistency of the matrix is acceptable.

5.3.2. Results of Overall Ranking

The detailed steps of the alternative evaluation on the planning of the CN and JA districts are illustrated in Table 8 and Table 9. Table 8 shows the pairwise comparison results of the CN district and JA district versus each criterion based on the experts’ opinions. Table 9 shows the synthesis of Table 7 and Table 8 and presents the relative performance of the CN district and JA district with respect to each criterion. As presented in Table 9, the CN district performed better on the criteria of CSS and MR, while the JA district performed better on RI and VURM. The overall weights and ranking of the two districts with respect to the overall goal are presented in Table 10, by summing up the relative weight of the CN district and JA district on each criterion. It can be seen that the overall weight of the JA district to the overall goal was 0.642, much higher than that of the CN district. Consequently, the planning of the ECSS by the EVCARD company in the JA district is estimated to be better than that in the CN district. Moreover, the overall score of the JA district was far higher than that of the CN district.
Since there are only two alternatives, the consistency check can always be satisfied.

6. Discussion and Conclusions

6.1. Discussion

This research takes the specific case of EVCARD in China for study and application; therefore, the evaluation outcomes may provide some useful insights for ECS companies, the government, and other stakeholders in terms of improving the planning of the ECSS and the attractiveness of CS.
  • According to the experts’ assessment, the score of each question under VURM was higher than that of the other questions (Table 3). VURM is considered to be the greatest criterion influencing the planning performance of ECSS in China (Table 6). This means that ECS companies must pay more attention in controlling the relocation costs by reducing the relocation distance and relocation staff. Meanwhile, this assessment result shows that the convenience of renting and returning shared vehicles means the most for users and the score for this question was the highest. This demonstrates that the value co-creation between the CS companies and users is essential in the ECSS, in other words, the planning performance improvement of the ECSS must be based on the satisfaction of the consumers’ travel demand. [74]. Operators may have to consider how to increase the convenience through good planning methods such as increasing the reservation time (time between requesting and picking up a vehicle) [75], adequate parking spaces [63], longer business hours [74], or the application of intelligent networking technology. The development of CS/ECSS in China greatly relies on government support [68]. It is essential for the government to take appropriate policies to promote the takeoff of CS/ECSS. The results show that policies such as appropriately allocating parking resources to CS/ECSS operators are key for improving the attractiveness of CS/ECSS.
  • CSS and RI were reported as the second highest factors influencing the planning (Table 6). The importance of CSS on the strategic planning has already been identified in prior studies as described above. For CS companies, station attributes such as the coverage area of each station and the corresponding density and fleet size should be calculated regarding the demand forecast so that use efficiency and construction costs can be balanced. The location of stations is what consumers emphasize, and its choice should consider the built environment.
  • RI is a negligible but important factor, which is directly related to user satisfaction. How to deal with facility failure and equipment occupancy more effectively and efficiently is what CS operators must focus on. In fact, for CS operators, intelligent and information technology should be integrated to improve the supervision efficiency, and achieve the coordination of vehicles, charging piles, parking spaces, and power grids.
  • MR was reported as the least important factor (Table 6). This may be due to the operation phase of ECS. After all, most of the ECS companies in China are still in the early stage of development.
  • According to the evaluation results, the JA district of EVCARD performed better than the CN district (Table 10). The main reasons were the RI and VURM. However, the assessment value of the JD district was lower than the CN district in CSS and MR. The main reason may be due to the geographic location. The JA district is much closer to the urban center, which may cause difficulties in distributing station networks and controlling the relevant costs. In fact, the stations of EVCARD are distributed more in the outskirts of the city rather than in urban centers. How to improve the construction planning of ECSS in urban centers, therefore, should be seriously considered during future development.

6.2. Conclusions

This paper is among the first to evaluate the planning of ECSS from a comprehensive view. In this paper, we contribute to the existing literature by developing a comprehensive evaluation framework consisting of evaluation criteria and an evaluation method. Through a literature review and expert interviews, four major evaluation criteria were determined: construction of stations, routine inspection, vehicle usability and relocation management, and maintenance and replacement of stations. These criteria present a comprehensive consideration of the whole planning process of the ECSS. Then, a combinational decision support tool for evaluating the planning of ECSS is presented in this paper, based on AHP, CBA, and VD. CBA and VD were adopted as a supplement to the AHP method with the aim to increase the accuracy of the evaluation. Based on the CBA method, thirteen sub-factors were introduced to measure the alternatives and some evaluation principles related to the distribution of the station network and station capacity are presented based on the VD method. This evaluation framework is capable of comprehensively evaluating the planning of the ECSS.
The case study of EVCARD contributes to an original analysis of the planning of the most influential ECS business in China. We demonstrate that the planning of EVCARD in different areas has great differences. EVCARD should seek a balanced development between different districts. For EVCARD, the construction planning of the JA district is a key direction for improvement; relocation management and convenience of picking up and returning EVs, however, should be the key improvement direction for the CN district.
However, there are several limitations to our study. This paper focused on the evaluation of EVCARD in different districts rather than on different ECS companies. In fact, the comparison between different companies can provide better more valuable evaluation results and directions for improvement. Moreover, the assessment on the relative weight of each criterion were mainly based on Chinese practice, which may not necessarily apply to other countries or regions. However, our methods are still enlightening to other countries.

Author Contributions

Conceptualization, Y.X. and Y.C.; methodology, Y.Z.; writing—original draft preparation, Y.X. and Y.Z.; writing—review and editing, Y.C.

Funding

This research was funded by the National Natural Science Foundation of China (Grant number: 71802127).

Acknowledgments

The authors really appreciate the support of the SIAC for providing us with first-hand data and the opportunity to conduct a case study. The authors would also like to thank all of the experts who participated in the evaluation interviews.

Conflicts of Interest

The authors declare no conflict of interest.

Appendix A

Table A1. Description of the EVCARD stations in the CN and JA districts.
No.Station NameAddress (CN District)Parking NumberType
1Guoxue Yanxiu CenterNo.106, Jinbang Road9B
2Shanghai International Trade CenterNo. 2201, West Yan’an Road3C
3Shanghai Second Construction HeadquartersNo. 768, Changning Road3B
4Shanghai Institute of Ceramics Chinese Academy of SciencesNo. 1295, Dingxi Road3B
5Linkong Economic Park Public Security Police StationNo. 23, Tongxie Road2C
6Grand Millennium Shanghai HongqiaoNo. 2588, West Yan’an Road3C
7L’AvenueNo. 99, Xianxia Road8C
8Shangjie Loft Changning Assembly HallNo. 546, Changning Road3C
9Renaissance Yangtze Shanghai HotelNo. 2099, West Yan’an Road3C
10New Town MansionNo. 55, Loushanguan Road3C
11Xinhongqiao Plaza Underground GarageNo. 48, Xingyi Road4C
12Xinhongqiao Garden Parking LotYan’an Elevated Road Entrance20C
13Songhong Road Station P + R Parking Lot631 Long, Jinzhong Road10C
14Green Convention CenterNo. 111, Xiehe Road2C
15Greenland ResidenceNo. 193, Xiehe Road6C
16Sheraton Shanghai Hongqiao HotelNo. 5, South Zunyi Road5C
17Hongqiao International Science & Technology Square288 Long, Tongxie Road4C
18Yinglong MansionNo. 1358, West Yan’an Road5C
No.Station NameAddress (JA District)Parking NumberType
15i CENTER (Feimalv Headquarters)No. 538, Hutai Branch Road12C
2Shanghai Railway StationNo. 760, Datong Road25A
3CITIC Pacific PlazaNo. 1168, West Nanjing Road3C
4Shanghai Shuhao Automobile Service Co. LtdNo. 1, Sanquan Road4C
5Wheelock SquareNo. 1717, West Nanjing Road4C
6Tongji University Hubei CampusNo. 727, North Zhongshan Road4B
7Hedian Originality ParkNo. 108, West Jiangchang Road5B
8Daning Central Square 2No. 700, Wanrong Road2C
9Daning International Commercial PlazaNo. 1878-2008, Gonghexin Road3C
10Baotong Road Parking lotNo. 1, Baotong Road4C
11Shanghai DOBE Cultural and Creative Industry Development Co. Ltd.No. 602, Pengjiang Road4C
12Xinhe Middle SchoolNo. 128, Yuanping Road4B
13European CityNo. 437-1, East Luochuan Road3C
14Shangtex HotelNo. 670, North Shanxi Road1C
15Merry Hotel ShanghaiNo. 396, West Yan’an Road5C
16Yuncheng Road Parking LotNo. 625, Yuncheng Road4C
17Metropolo Jinjiang HotelsNo. 3033, Changzhong Road7C
18Changxing Road Parking LotIntersection of Jingjiang Road and Changxing Road2C
19Jing’an Hilton HotelNo. 250, Huashan Road5C

References

  1. Egbue, O.; Long, S. Barriers to widespread adoption of electric vehicles: An analysis of consumer attitudes and perceptions. Energy Policy 2012, 48, 717–729. [Google Scholar] [CrossRef]
  2. Geels, F.W. A socio-technical analysis of low-carbon transitions: Introducing the multi-level perspective into transport studies. J. Transp. Geogr. 2012, 24, 471–482. [Google Scholar] [CrossRef]
  3. Qu, M.; Yu, S.; Yu, M. An improved approach to evaluate car sharing options. Ecol. Indic. 2017, 72, 686–702. [Google Scholar] [CrossRef]
  4. Shaheen, S.; Chan, N.; Bansal, A.; Cohen, A. Shared Mobility: Shared Mobility: A Sustainability and Technologies Workshop—Definitions Industry Developments, and Early Understanding; Transportation Sustainability Research Center, University of California, Berkeley and California Department of Transportation: Richmond, CA, USA, 2015.
  5. Shaheen, S.A.; Chan, N.D.; Micheaux, H. One-way carsharing’s evolution and operator perspectives from the Americas. Trasnportation 2015, 42, 519–536. [Google Scholar] [CrossRef]
  6. Moradi, A.; Vagnoni, E. A multi-level perspective analysis of urban mobility system dynamics: What are the future transition pathways? Technol. Forecast. Soc. Chang. 2018, 126, 231. [Google Scholar] [CrossRef]
  7. Nijland, H.; Van Meerkerk, J. Mobility and environmental impacts of car sharing in The Netherlands. Environ. Innov. Soc. Transit. 2017, 23, 84–91. [Google Scholar] [CrossRef]
  8. Nykvist, B.; Whitmarsh, L. A multi-level analysis of sustainable mobility transitions: Niche development in the UK and Sweden. Technol. Forecast. Soc. Chang. 2008, 75, 1373–1387. [Google Scholar] [CrossRef]
  9. Park, G.; Lee, S.; Jin, S.; Kwak, S. Integrated modeling and analysis of dynamics for electric vehicle powertrains. Expert. Syst. Appl. 2014, 41, 2595–2607. [Google Scholar] [CrossRef]
  10. Sierzchula, W. Factors influencing fleet manager adoption of electric vehicles. Transp. Res. Part D-Transp. Environ. 2014, 31, 126–134. [Google Scholar] [CrossRef]
  11. Wang, N.; Tang, L.; Pan, H. Analysis of public acceptance of electric vehicles: An empirical study in Shanghai. Technol. Forecast. Soc. Chang. 2018, 126, 284. [Google Scholar] [CrossRef]
  12. Illgen, S.; Höck, M. Electric vehicles in car sharing networks—Challenges and simulation model analysis. Transp. Res. Part D-Transp. Environ. 2018, 63, 377–387. [Google Scholar] [CrossRef]
  13. Gambella, C.; Malaguti, E.; Masini, F.; Vigo, D. Optimizing relocation operations in electric car-sharing. Omega 2018, 81, 234–245. [Google Scholar] [CrossRef]
  14. Becker, H.; Ciari, F.; Axhausen, K.W. Modeling free-floating car-sharing use in Switzerland: A spatial regression and conditional logit approach. Transp. Res. Part C-Emerg. Technol. 2017, 81, 286–299. [Google Scholar] [CrossRef] [Green Version]
  15. Li, Q.; Liao, F.X.; Timmermans, H.J.P.; Huang, H.J.; Zhou, J. Incorporation free-floating car-sharing into an activity-based dynamic user user equilibrium model: A demand-side model. Transp. Res. Part B Methodol. 2018, 107, 102–123. [Google Scholar] [CrossRef]
  16. Deng, Y.; Cardin, M.A. Integrating operational decisions into the planning of one-way vehicle-sharing systems under uncertainty. Transp. Res. Part C-Emerg. Technol. 2018, 86, 407–424. [Google Scholar] [CrossRef] [Green Version]
  17. Jorge, D.; Correia, G. Carsharing systems demand estimation and defined operations: A literature review. Eur. J. Transp. Infrastruct. Res. 2013, 13, 201–220. [Google Scholar]
  18. Saaty, T.L. A scaling method for priorities in hierarchical structures. J. Math. Psychol. 1977, 15, 234–281. [Google Scholar] [CrossRef]
  19. Angelo, L.D.; Stefano Paolo, D.; Fratocchi, L.; Marzola, A. An AHP-based method for choosing the best 3D scanner for cultural heritage applications. J. Cult. Herit. 2018, 34, 109–115. [Google Scholar] [CrossRef]
  20. Li, S.X.; Knights, P.; Dunn, D. Geological uncertainty and risk: Implications for the viability of mining projects. J. Coal Sci. Eng. 2008, 14, 176–180. [Google Scholar] [CrossRef]
  21. Saaty, R.W. The Analytic Hierarchy Process. In Decision Analysis; 1980; Available online: http://www.dii.unisi.it/~mocenni/Note_AHP.pdf (accessed on 11 October 2019).
  22. Solangi, Y.A.; Tan, Q.; Mirjat, N.H.; Ali, S. Application of AHP, TOPSIS, and TFNs to plant selection for phytoremediation of petroleum-contaminated soils in shale gas and oil fields. J. Clean. Prod. 2019, 233, 13–22. [Google Scholar] [CrossRef]
  23. Solangi, Y.A.; Tan, Q.; Mirjat, N.H.; Ali, S. Evaluating the strategies for sustainable energy planning in Pakistan: An integrated SWOT-AHP and Fuzzy-TOPSIS approach. J. Clean. Prod. 2019, 236, 117655. [Google Scholar] [CrossRef]
  24. Baffoe, G. Exploring the utility of Analytic Hierarchy Process (AHP) in ranking livelihood activities for effective and sustainable rural development interventions in developing countries. Eval. Program Plan. 2019, 72, 197–204. [Google Scholar] [CrossRef] [PubMed]
  25. Rajak, M.; Shaw, K. Evaluation and selection of mobile health (mHealth) applications using AHP and fuzzy topsis. Technol. Soc. 2019, 59, 101186. [Google Scholar] [CrossRef]
  26. Gottfried, O.; De Clercq, D.; Blair, E.; Weng, X.; Wang, C. SWOT-AHP-TOWS analysis of private investment behavior in the Chinese biogas sector. J. Clean. Prod. 2018, 184, 632–647. [Google Scholar] [CrossRef]
  27. Khan, A.A.; Shameem, A.; Kumar, R.R.; Hussain, S.; Yan, X. Fuzzy AHP based prioritization and taxonomy of software process improvement success factors in global software development. Appl. Soft Comput. 2019, 83, 105648. [Google Scholar] [CrossRef]
  28. Ly PT, M.; Lai, W.H.; Hsu, C.W.; Shih, F.Y. Fuzzy AHP analysis of Internet of Things (IoT) in enterprises. Technol. Forecast. Soc. Chang. 2018, 136, 1–13. [Google Scholar] [CrossRef]
  29. Tavana, M.; Zareinejad, M.; Caprio, D.D.; Kaviani, M.A. An integrated intuitionistic fuzzy AHP and SWOT method for outsourcing reverse logistics. Appl. Soft Comput. 2016, 40, 544–557. [Google Scholar] [CrossRef]
  30. Brunnhofer, M.; Gabriella, N.; Schöggl, J.; Stern, T.; Posch, A. The biorefinery transition in the European pulp and paper in dustry—A three-phase Delphi study including a SWOT-AHP analysis. Forest Policy Econ. 2019. [Google Scholar] [CrossRef]
  31. Eliasson, J.; Fosgerau, M.O.G.E.N.S. Cost-benefit analysis of transport improvements in the presence of spillovers, matching and an income tax. Econ. Transp. 2007, 18, 1–20. [Google Scholar] [CrossRef]
  32. Liu, B.; Wu, Q.; Wang, F.; Zhang, B. Is straw return-to-field always beneficial? Evidence from an integrated cost-benefit analysis. Energy 2019, 171, 393–402. [Google Scholar] [CrossRef]
  33. Fellows, N.T.; Pitfield, D.E. An economic and operational evaluation of urban car-sharing. Transp. Res. Part D-Transp. Environ. 2000, 5, 1–10. [Google Scholar] [CrossRef]
  34. Massiani, J. Cost-Benefit Analysis of policies for the development of electric vehicles in Germany: Methods and results. Transp. Policy 2015, 38, 19–26. [Google Scholar] [CrossRef] [Green Version]
  35. Nian, V.; Liu, Y.; Zhong, S. Life cycle cost-benefit analysis of offshore wind energy under the climatic conditions in Southeast Asia– Setting the bottom-line for deployment. Appl. Energy 2019, 233–234, 1003–1014. [Google Scholar] [CrossRef]
  36. Cui, B.; Gao, D.; Wang, S.; Xue, X. Effectiveness and life-cycle cost-benefit analysis of active cold storages for building demand management for smart grid applications. Appl. Energy 2015, 147, 523–535. [Google Scholar] [CrossRef]
  37. Habibzadeh-Bigdarvish, O.; Yu, X.; Lei, G.; Li, T.; Puppala, A.J. Life-Cycle cost-benefit analysis of Bridge deck de-icing using geothermal heat pump system: A case study of North Texas. Sustain. Cities Soc. 2019, 47, 101492. [Google Scholar] [CrossRef]
  38. Hu, H.; Liu, X.H.; Hu, P. Voronoi diagram generation on the ellipsoidal earth. Comput. Geosci. 2014, 73, 81–87. [Google Scholar] [CrossRef]
  39. Muramatsu, T.; Hayama, Y.; Kutsukake, K.; Maeda, K.; Matsumoto, T.; Kudo, H.; Usami, N. Application of weighted Voronoi diagrams to analyze nucleation sites of multicrystalline silicon ingots. J. Cryst. Growth 2018, 499, 62–66. [Google Scholar] [CrossRef]
  40. Senechal, M.; Okabe, A.; Boots, B.; Sugihara, K. Spatial Tessellations: Concepts and Applications of Voronoi Diagrams. Coll. J. 1995, 26, 79–81. [Google Scholar] [CrossRef]
  41. Nicholson, T.; Sambridge, M.; Gudmundsson, Ó. On entropy and clustering in earthquake hypocentre distributions. Geophys. J. Int. 2000, 142, 37–51. [Google Scholar] [CrossRef] [Green Version]
  42. Ferrero, F.; Perboli, G.; Rosano, M.; Vesco, A. Car-sharing services: An annotated review. Sustain. Cities Soc. 2018, 37, 501–518. [Google Scholar] [CrossRef]
  43. Kopp, J.; Gerike, R.; Axhausen, K.W. Do sharing people behave differently? An empirical evaluation of the distinctive mobility patterns of free-floating car-sharing members. Transportation 2015, 42, 449–469. [Google Scholar] [CrossRef]
  44. Rabbitt, N.; Ghosh, B. Economic and environmental impacts of organised Car Sharing Services: A case study of Ireland. Res. Transp. Econ. 2016, 57, 3–12. [Google Scholar] [CrossRef]
  45. Schlüter, J.; Weyer, J. Car sharing as a means to raise acceptance of electric vehicles: An empirical study on regime change in automobility. Transp. Res. Part F-Traffic Psychol. Behav. 2019, 60, 185–201. [Google Scholar] [CrossRef]
  46. Nourinejad, M.; Zhu, S.; Bahrami, S.; Roorda, M.J. Vehicle relocation and staff rebalancing in one-way carsharing systems. Transp. Res. Part E Logist. Transp. Rev. 2015, 81, 98–113. [Google Scholar] [CrossRef]
  47. Cepolina, E.M.; Farina, A.; Holloway, C.; Tyler, N. Innovative strategies for urban car-sharing systems and a simulator to assess their performance. Transp. Plan. Technol. 2015, 38, 375–391. [Google Scholar] [CrossRef]
  48. Lemme RF, F.; Arruda, E.F.; Bahiense, L. Optimization model to assess electric vehicles as an alternative for fleet composition in station-based car sharing systems. Transp. Res. Part D-Transp. Environ. 2019, 67, 173–196. [Google Scholar] [CrossRef]
  49. Weikl, S.; Bogenberger, K. A practice-ready relocation model for free-floating carsharing systems with electric vehicles—Mesoscopic approach and field trial results. Transp. Res. Part C-Emerg. Technol. 2015, 57, 206–223. [Google Scholar] [CrossRef]
  50. Folkestad, C.A.; Hansen, N.; Fagerholt, K.; Andersson, H.; Pantuso, G. Optimal charging and repositioning of electric vehicles in a free-floating carsharing system. Comput. Oper. Res. 2020, 113, 104771. [Google Scholar] [CrossRef]
  51. Deveci, M.; Canıtez, F.; Gökaşar, I. WASPAS and TOPSIS based interval type-2 fuzzy MCDM method for a selection of a car sharing station. Sustain. Cities Soc. 2018, 41, 777–791. [Google Scholar] [CrossRef]
  52. Correia, G.H.D.A.; Jorge, D.R.; Antunes, D.M. The added value of accounting for users flexibility and information on the potential of a station-based one-way car-sharing system: An application in Lisbon, Portugal. J. Intell. Transp. Syst. 2014, 18, 299–308. [Google Scholar] [CrossRef]
  53. Correia, G.H.D.A.; Antunes, A.P. Optimization approach to depot location and trip selection in one-way carsharing systems. Transp. Res. Part E Logist. Transp. Rev. 2012, 48, 233–247. [Google Scholar] [CrossRef]
  54. Li, X.; Ma, J.; Cui, J.; Ghiasi, A.; Zhou, F. Design framework of large-scale one-way electric vehicle sharing systems: A continuum approximation model. Transp. Res. Part B-Methodol. 2016, 88, 21–45. [Google Scholar] [CrossRef] [Green Version]
  55. Brandstätter, G.; Kahr, M.; Leitner, M. Determining optimal locations for charging stations of electric car-sharing systems under stochastic demand. Transp. Res. Part B-Methodol. 2017, 104, 17–35. [Google Scholar] [CrossRef]
  56. Xu, M.; Meng, Q. Fleet sizing for one-way electric carsharing services considering dynamic vehicle relocation and nolinear charging profile. Transp. Res. B-Meth. 2019, 128, 33–49. [Google Scholar] [CrossRef]
  57. Boyaci, B.; Zografos, K.G.; Geroliminis, N. An optimization framework for the development of efficient one-way car-sharing systems. Eur. J. Oper. Res. 2015, 240, 718–733. [Google Scholar] [CrossRef] [Green Version]
  58. Boyaci, B.; Zografos, K.G.; Geroliminis, N. An integrated optimization-simulation framework for vehicle and personnel relocations of electric carsharing systems with reservations. Transp. Res. Part B-Methodol. 2017, 95, 214. [Google Scholar] [CrossRef]
  59. Fassi AEl Awasthi, A.; Viviani, M. Evaluation of carsharing network’s growth strategies through discrete event simulation. Expert. Syst. Appl. 2012, 39, 6692–6705. [Google Scholar] [CrossRef]
  60. Rickenberg, T.; Gebhardt, A.; Breitner, M.H. A Decision Support System for the Optimization of Car-Sharing Stations. In Proceedings of the 21st European Conference on Information Systems, Utrecht, The Netherlands, 5–8 June 2013. [Google Scholar]
  61. Mounce, R.; Nelson, J.D. On the potential for one-way electric vehicle car-sharing in future mobility systems. Transp. Res. Part A-Policy Pract. 2019, 120, 17–30. [Google Scholar] [CrossRef]
  62. Erbaş, M.; Kabak, M.; Özceylan, E.; Çetinkaya, C. Optimal siting of electric vehicle charging stations: A GIS-based fuzzy Multi-Criteria Decision Analysis. Energy 2018, 163, 1017–1031. [Google Scholar] [CrossRef]
  63. Prieto, M.; Baltas, G.; Stan, V. Car sharing adoption intention in urban areas: What are the key sociodemographic drivers? Transp. Res. Part A-Policy Pract. 2017, 101, 218–227. [Google Scholar] [CrossRef]
  64. Kortum, K.; Schönduwe, R.; Stolte, B.; Bock, B. Free-Floating Carsharing: City-Specific Growth Rates and Success Factors. Transp. Res. Procedia 2016, 19, 328–340. [Google Scholar] [CrossRef]
  65. Chen, X.; Cheng, J.; Ye, J.; Jin, Y.; Li, X.; Zhang, F. Locating Station of One-Way Carsharing Based on Spatial Demand Characteristics. J. Adv. Transp. 2018, 16. [Google Scholar] [CrossRef]
  66. Stillwater, T.; Mokhtarian, P.L.; Shaheen, S.A. Carsharing and the Built Environment: Geographic Information System–Based Study of One U.S. Operator. Transp. Res. Rec. 2009, 2010, 27–34. [Google Scholar] [CrossRef]
  67. Aurenhammer, F. Voronoi diagrams—A survey of a fundamental geometric data structure. ACM Comput. Surv. 1991, 23, 345–405. [Google Scholar] [CrossRef]
  68. Hu, S.; Chen, P.; Lin, H.; Xie, C.; Chen, X. Promoting carsharing attractiveness and efficiency: An exploratory analysis. Transp. Res. Part D-Transp. Environ. 2018, 65, 229–243. [Google Scholar] [CrossRef]
  69. Wang, M.; Martin, E.; Shaheen, S. Carsharing in Shanghai, China Analysis of Behavioral Response to Local Survey and Potential Competition. Transp. Res. Rec. 2012, 2319, 86–95. [Google Scholar] [CrossRef]
  70. Aichholzer, O.; Aigner, W.; Aurenhammer, F.; Hackl, F.; Jüttler, B.; Pilgerstorferc, E.; Rablc, B. Divide-and-conquer for Voronoi diagrams revisited. Comp. Geom.-Theory Appl. 2010, 43, 688–699. [Google Scholar] [CrossRef] [Green Version]
  71. Sun, Z.; Gao, W.; Li, B.; Wang, L. Locating charging stations for electric vehicles. Transp. Policy 2018, 1–7. [Google Scholar] [CrossRef]
  72. Ghimire, L.P.; Kim, Y. An analysis on barriers to renewable energy development in the context of Nepal using AHP. Renew. Energy 2018, 129, 446–456. [Google Scholar] [CrossRef]
  73. Thanki, S.; Govindan, K.; Thakkar, J. An investigation on lean-green implementation practices in Indian SMEs using analytical hierarchy process (AHP) approach. J. Clean. Prod. 2016, 135, 284–298. [Google Scholar] [CrossRef]
  74. Ma, Y.; Rong, K.; Mangalagiu, D.; Thornton, T.F.; Zhu, D. Co-evolution between urban sustainability and business ecosystem innovation: Evidence from the sharing mobility sector in Shanghai. J. Clean. Prod. 2018, 188, 942–953. [Google Scholar] [CrossRef]
  75. Nourinejad, M.; Roorda, M.J. A dynamic carsharing decision support system. Transp. Res. Part E-logist. Transp. Rev. 2014, 66, 36–50. [Google Scholar] [CrossRef]
Figure 1. Flow chart of the methodology.
Sustainability 11 05627 g001
Figure 2. Hierarchical structure for the operation evaluation of an ECSS.
Sustainability 11 05627 g002
Table 1. Definitions of the four main criteria.
CriteriaDefinitionSource
Construction of StationsRelated to location network, size and infrastructure of stations.Brandstätter et al. [55], Deveci et al. [51].
Routine InspectionRelated to the routine check on equipment fault and parking occupancy.Expert Interview
Vehicle Usability & Relocation ManagementRelated to the flexibility of picking up and returning vehicles and vehicle relocation.Boyaci et al. [57,58], Gambella et al. [13].
Maintenance & Replacement of StationsRelated to the maintenance and replacement of car-sharing stations.Fassi et al. [59].
Table 2. Definitions of the thirteen factors.
CriteriaSub-FactorsDefinitionTypeSource
CSSNumber of stationsThe total number of ECS stations.Cost/benefitRickenberg et al. [60], Boyaci et al. [57]
Construction costsThe construction costs per station including lease cost, infrastructure cost, and vehicle purchase cost.CostMounce and Nelson [61]
Coverage rateThe ratio of coverage area of stations to the total area of districts.BenefitBrandstätter et al. [55], Erbaş et al. [62]
RIPatrol distanceThe total patrol distance between different stations.CostExpert Interviews
Patrol batchesPatrol frequency within a certain period.BenefitExpert Interviews
Monitoring equipmentTotal installation quantity and technical level of the monitoring equipment.Cost/benefitExpert Interviews
VURMDistance between picking and returning EVsAverage radius value between reachable stations.BenefitCorreia et al. [52], Prieto et al. [63]
Number ratio of stations to EVsThe number of stations to the number of EVs.BenefitKortum et al. [64], Chen et al. [65]
Relocation distanceAverage radius value from parking station to destination station.CostPark et al. [9]
MRMaintenance frequencyThe frequency of maintaining stations within a certain period.BenefitFassi et al. [59]
Maintenance costsAverage maintenance costs of all stations.CostJorge and Correia [15]
Replacement periodThe average period that is used to shut down and open up stations.BenefitStillwater et al. [66]
Replacement costsAverage replacement costs.CostFassi et al. [59]
Table 3. Questionnaire for evaluating the weights of criteria.
CriteriaQuestionsScoresAverage Scores
CS(1) Do the charging and parking facilities have a great impact on the operation costs of ECSS?7.57.800
(2) Do the geographical locations of ECSS matter a lot to consumers’ benefits?8.8
(3) Does the intensity of ECSS matter a lot to consumers’ benefits?7.1
RI(1) Do the energy-related fault handling capabilities of ECSS matter a lot to consumers’ benefits?8.07.633
(2) Does the charging monitoring capability matter a lot to consumers’ benefits?6.3
(3) Does the occupancy of parking and charging facilities have a great impact on the consumers’ benefits?8.6
(4) Do the numbers of inspectors and monitoring facilities have great impact on the operation cost of ECSS?7.6
VURM(1) Does the convenience of picking up and returning vehicles matter a lot to consumers’ benefits?9.49.300
(2) Does the number of vehicles and available capacity of batteries matter a lot to consumers’ benefits?9.2
(3) Does the relocation manage have great impact on the operation cost of ECSS?9.3
MR(1) Does the shut-down and repair of stations have a great impact on the operation costs of ECSS?7.06.200
(2) Does the repair and maintenance of stations matter a lot to consumers’ benefits?6.2
(3) Does the stable and continuous operation of stations matter a lot to consumers’ benefits?5.4
Table 4. Brief profile of experts.
DesignationActor Group
Expert 1General ManagerCS companies
Expert 2ManagerCS companies
Expert 3Chief EngineerCS companies
Expert 4ManagerCS companies
Expert 5General ManagerCS companies
Expert 6Deputy DirectorGovernment
Expert 7Assistant DirectorGovernment
Expert 8ProfessorAcademic
Expert 9Research ProfessorshipAcademic
Expert 10Associate professorAcademic
Table 5. Difference between the average score of each criterion.
CriteriaCSSRIVURMMR
CSS0.0000.167−1.5001.600
RI-0.000−1.6671.433
VURM--0.0003.100
MR---0.000
Table 6. Criteria to criteria pairwise comparison matrix.
CriteriaCSSRIVURMMR
CSS111/55
RI111/55
VURM5519
MR1/51/51/91
Table 7. Eigen vector and largest eigen vector value.
WW’λmaxCICR
CSS0.1650.684.1400.0470.052
RI0.1650.68
VURM0.6252.68
MR0.0450.18
Table 8. Pairwise comparison of the alternatives versus the criteria.
CSSCN DistrictJA District
CN District13
JA District1/31
Normalized
CSSCN DistrictJA DistrictW
CN District0.75 0.75 0.75
JA District0.25 0.25 0.25
RICN DistrictJA District
CN District11/3
JA District31
Normalized
RICN DistrictJA DistrictW
CN District0.25 0.25 0.25
JA District0.75 0.75 0.75
VURMCN DistrictJA District
CN District11/3
JA District31
Normalized
VURMCN DistrictJA DistrictW
CN District0.25 0.25 0.25
JA District0.75 0.75 0.75
MRCN DistrictJA District
CN District15
JA District1/51
Normalized
MRCN DistrictJA DistrictW
CN District0.83 0.83 0.83
JA District0.17 0.17 0.17
Table 9. Calculation of alternatives with respect to the criteria.
Criteria versus Goal AlternativeABC
CSS0.165CN District
JA District
0.75 × 0.165 = 0.124
0.25 × 0.165 = 0.041
RI0.165CN District
JA District
0.25 × 0.165 = 0.041
0.75 × 0.165 = 0.124
VURM0.625CN District
JA District
0.25 × 0.625 = 0.156
0.75 × 0.625 = 0.469
MR0.045CN District
JA District
0.83 × 0.045 = 0.037
0.17 × 0.045 = 0.008
Table 10. Better preformation of the ECSS based on the experts’ assessment.
Priority with Respect to
ECSSCSSRIVURMMRGoalRank
CN District0.1240.0410.1560.0370.3582
JA District0.0410.1240.4690.0080.6421

