Use of GIS Tools in Sustainable Heritage Management—The Importance of Data Generalization in Spatial Modeling
Abstract
1. Introduction
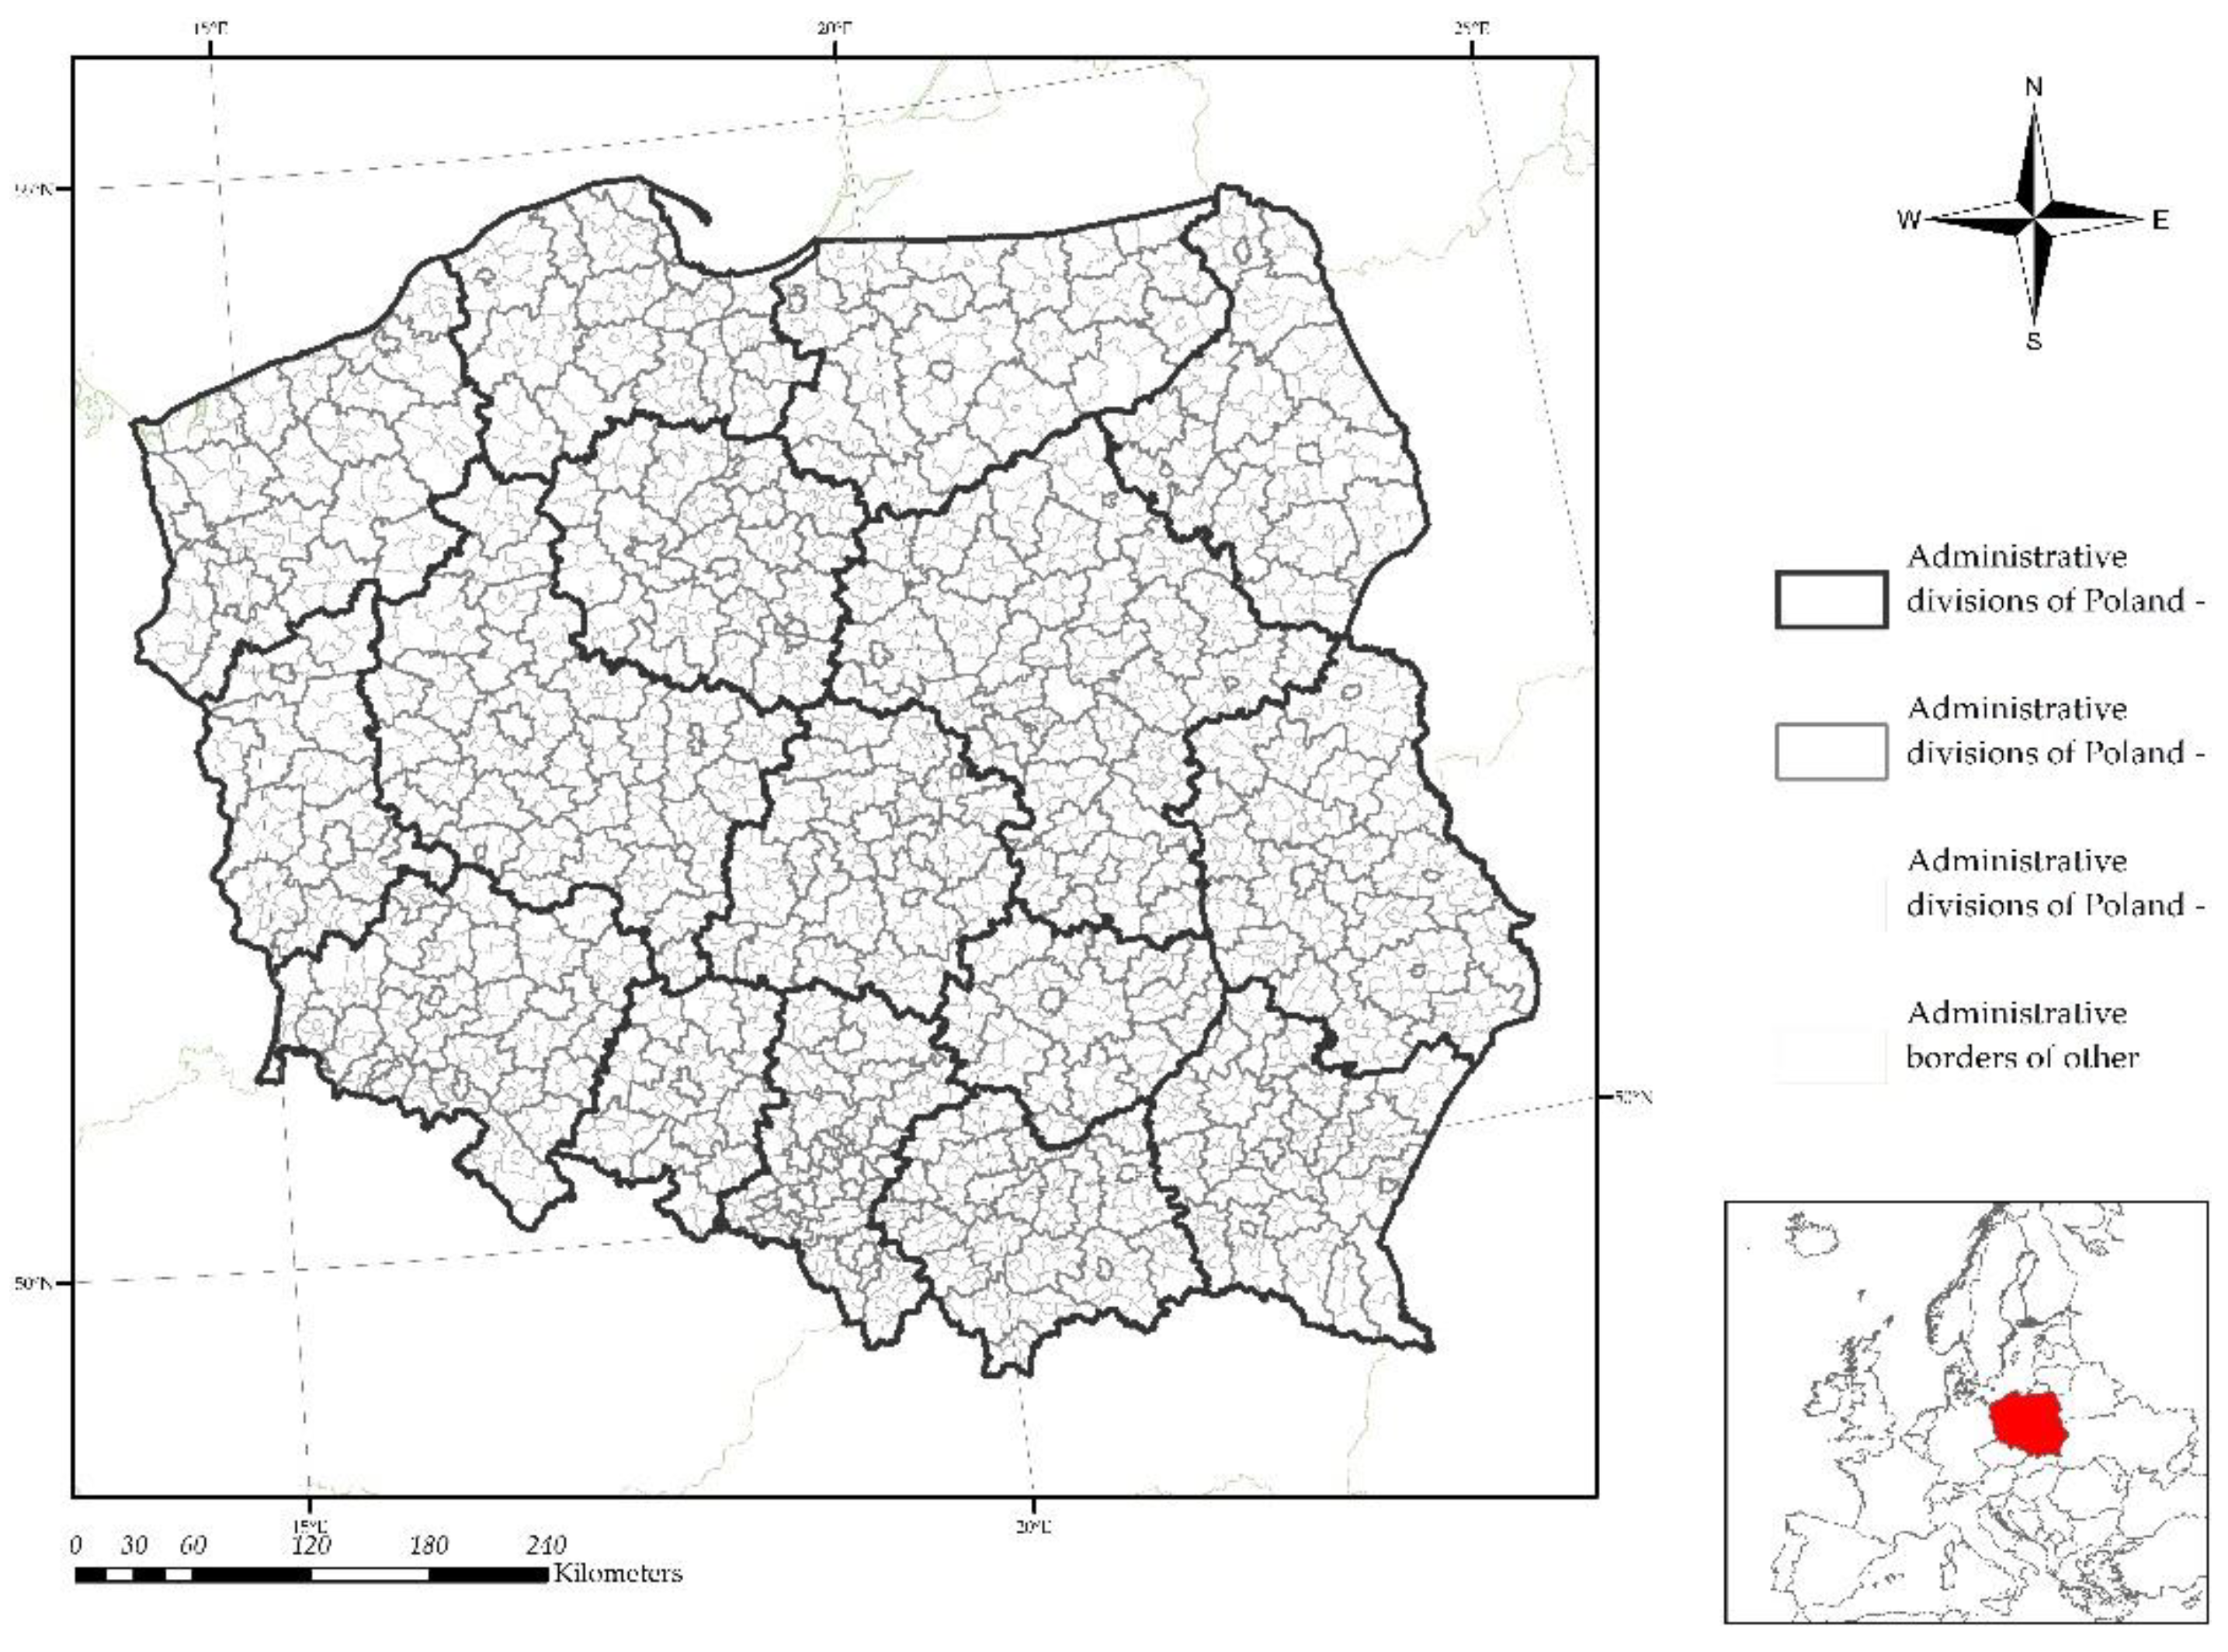
- 16 voivodeships,
- 314 poviats and 66 cities with poviat rights,
- 2477 municipalities (including 302 urban municipalities, 638 urban–rural municipalities, and 1537 rural municipalities).
2. Materials and Methods
- Stage I—Creating the map of the density of non-movable monuments with kernel density estimation
- Stage II—Choosing the optimal method of spatial interpolation
- Stage III—Finding the optimal size of the geometric grid
3. Results
3.1. Map of the Density of Non-Movable Monuments—Kernel Density Estimation
3.2. Optimal Method of Spatial Interpolation
3.3. Optimal Size of the Geometric Grid
4. Discussion
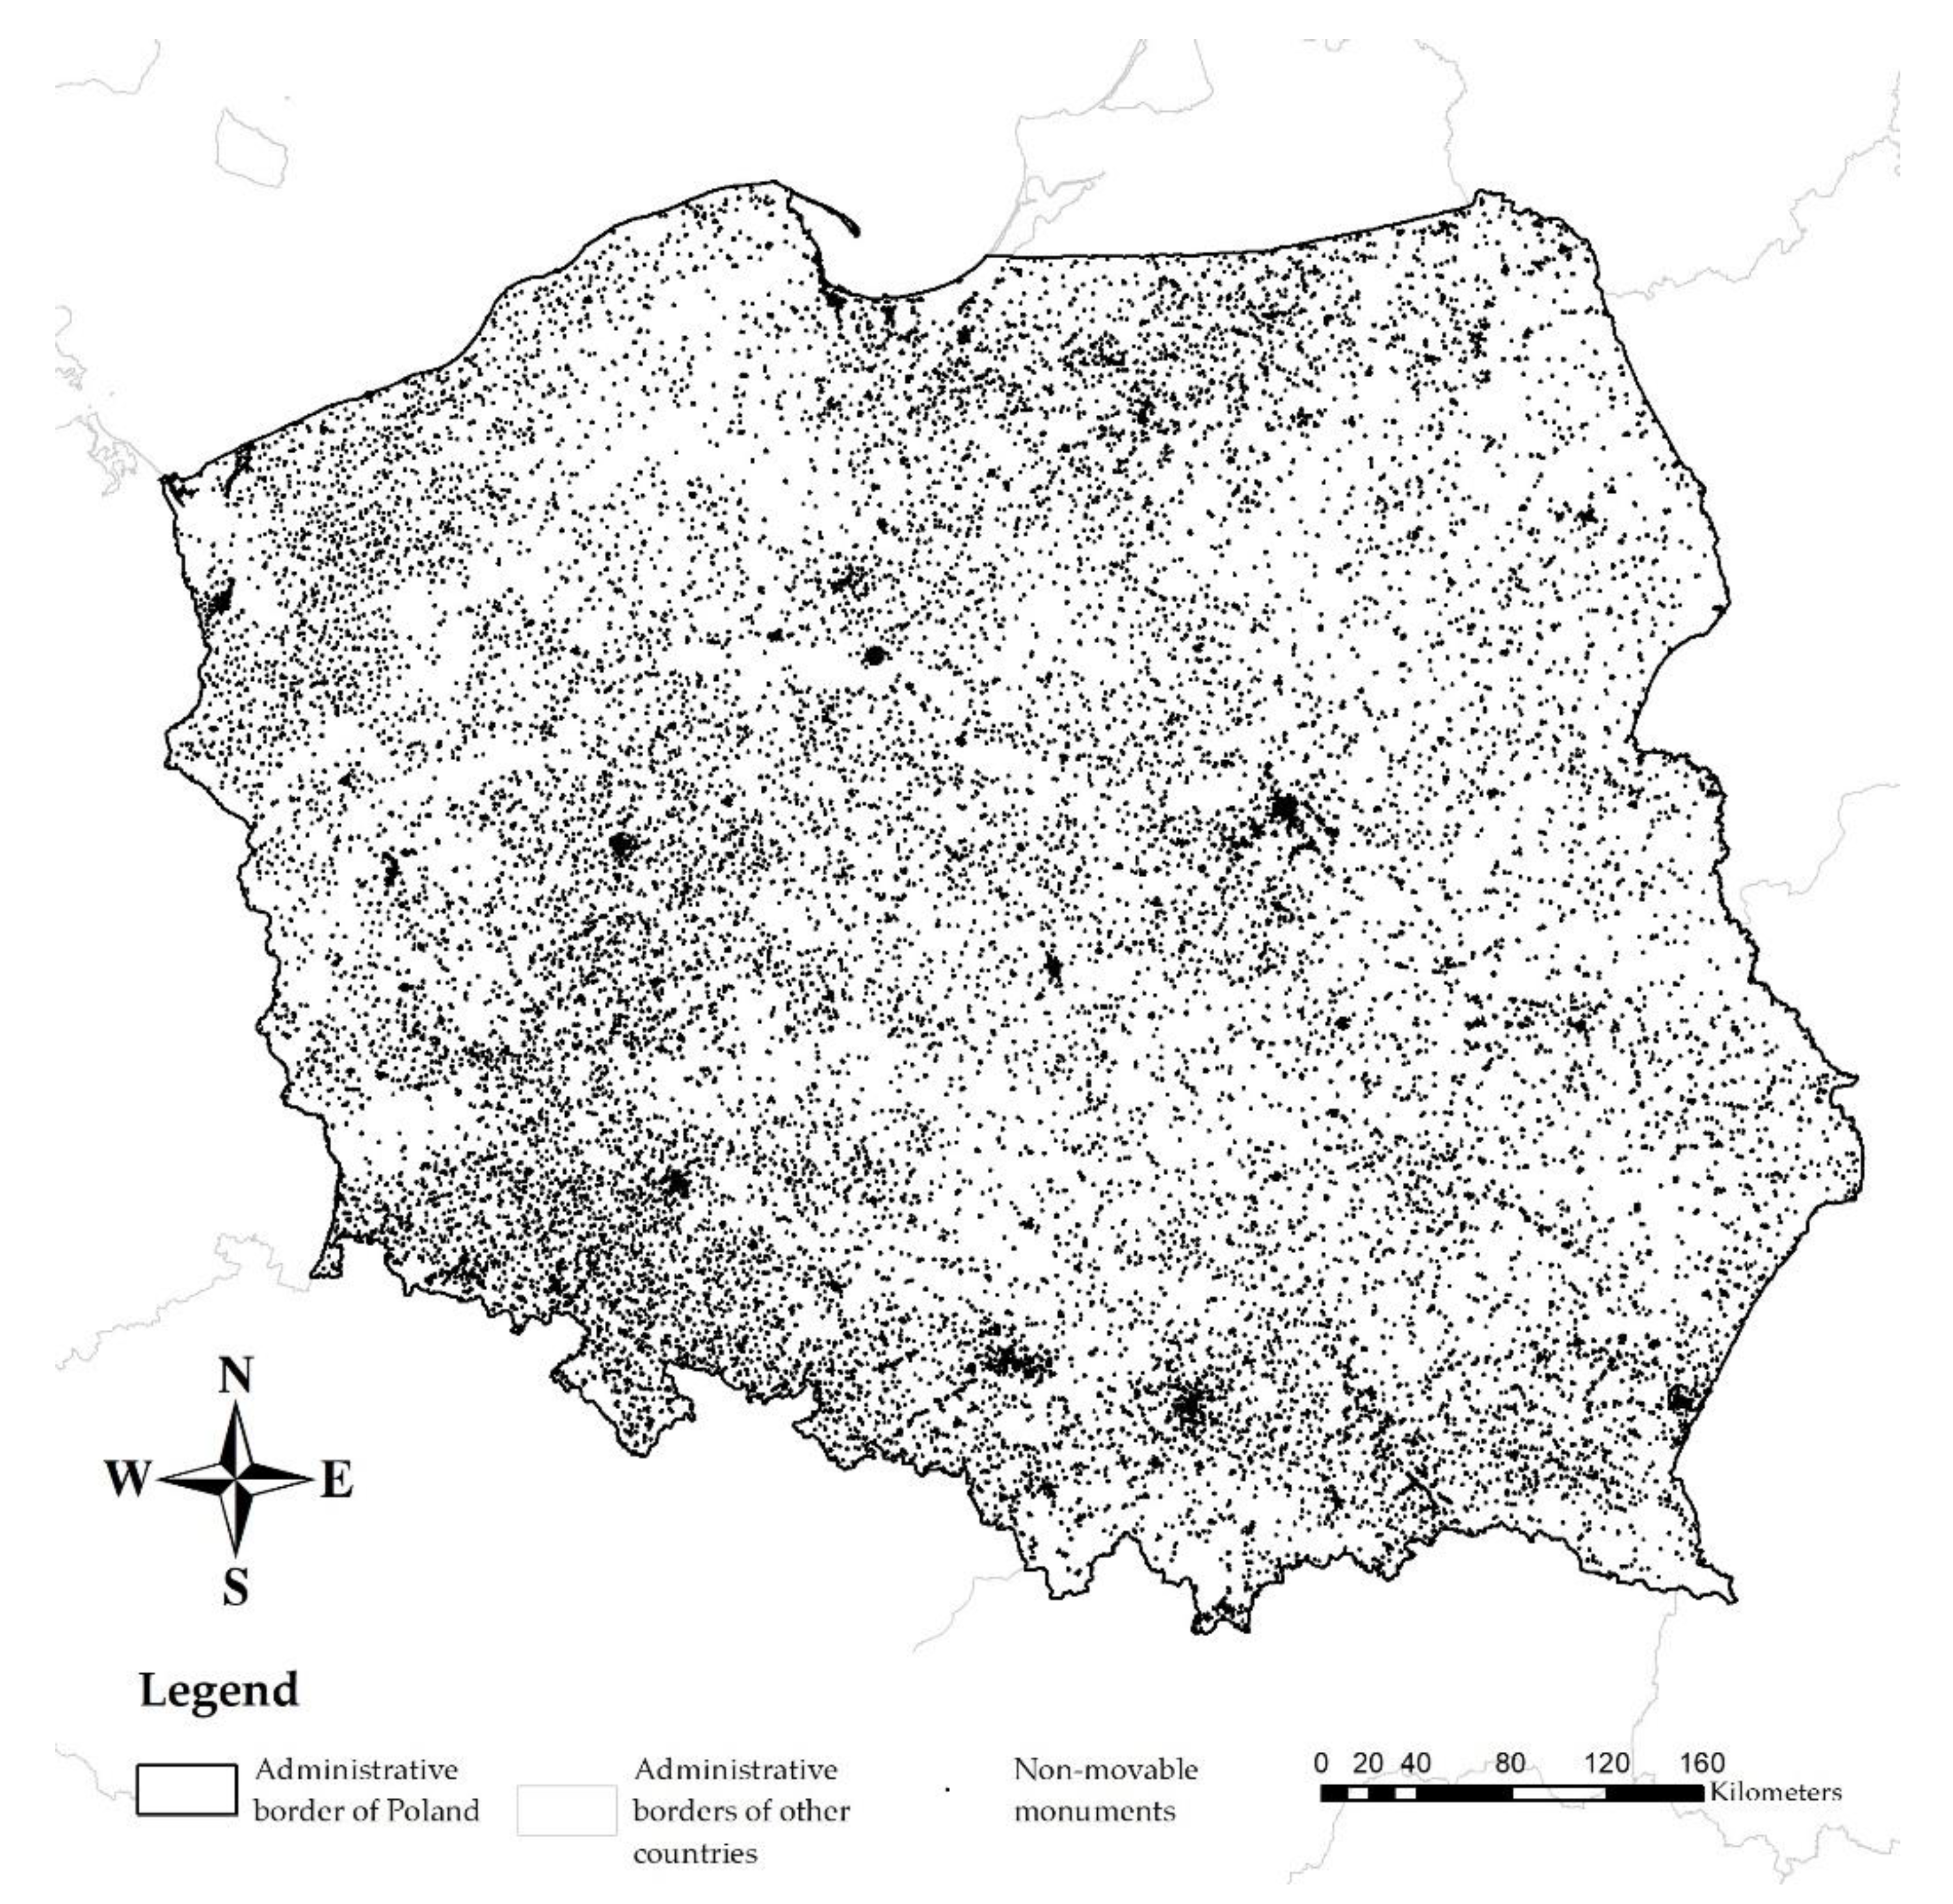
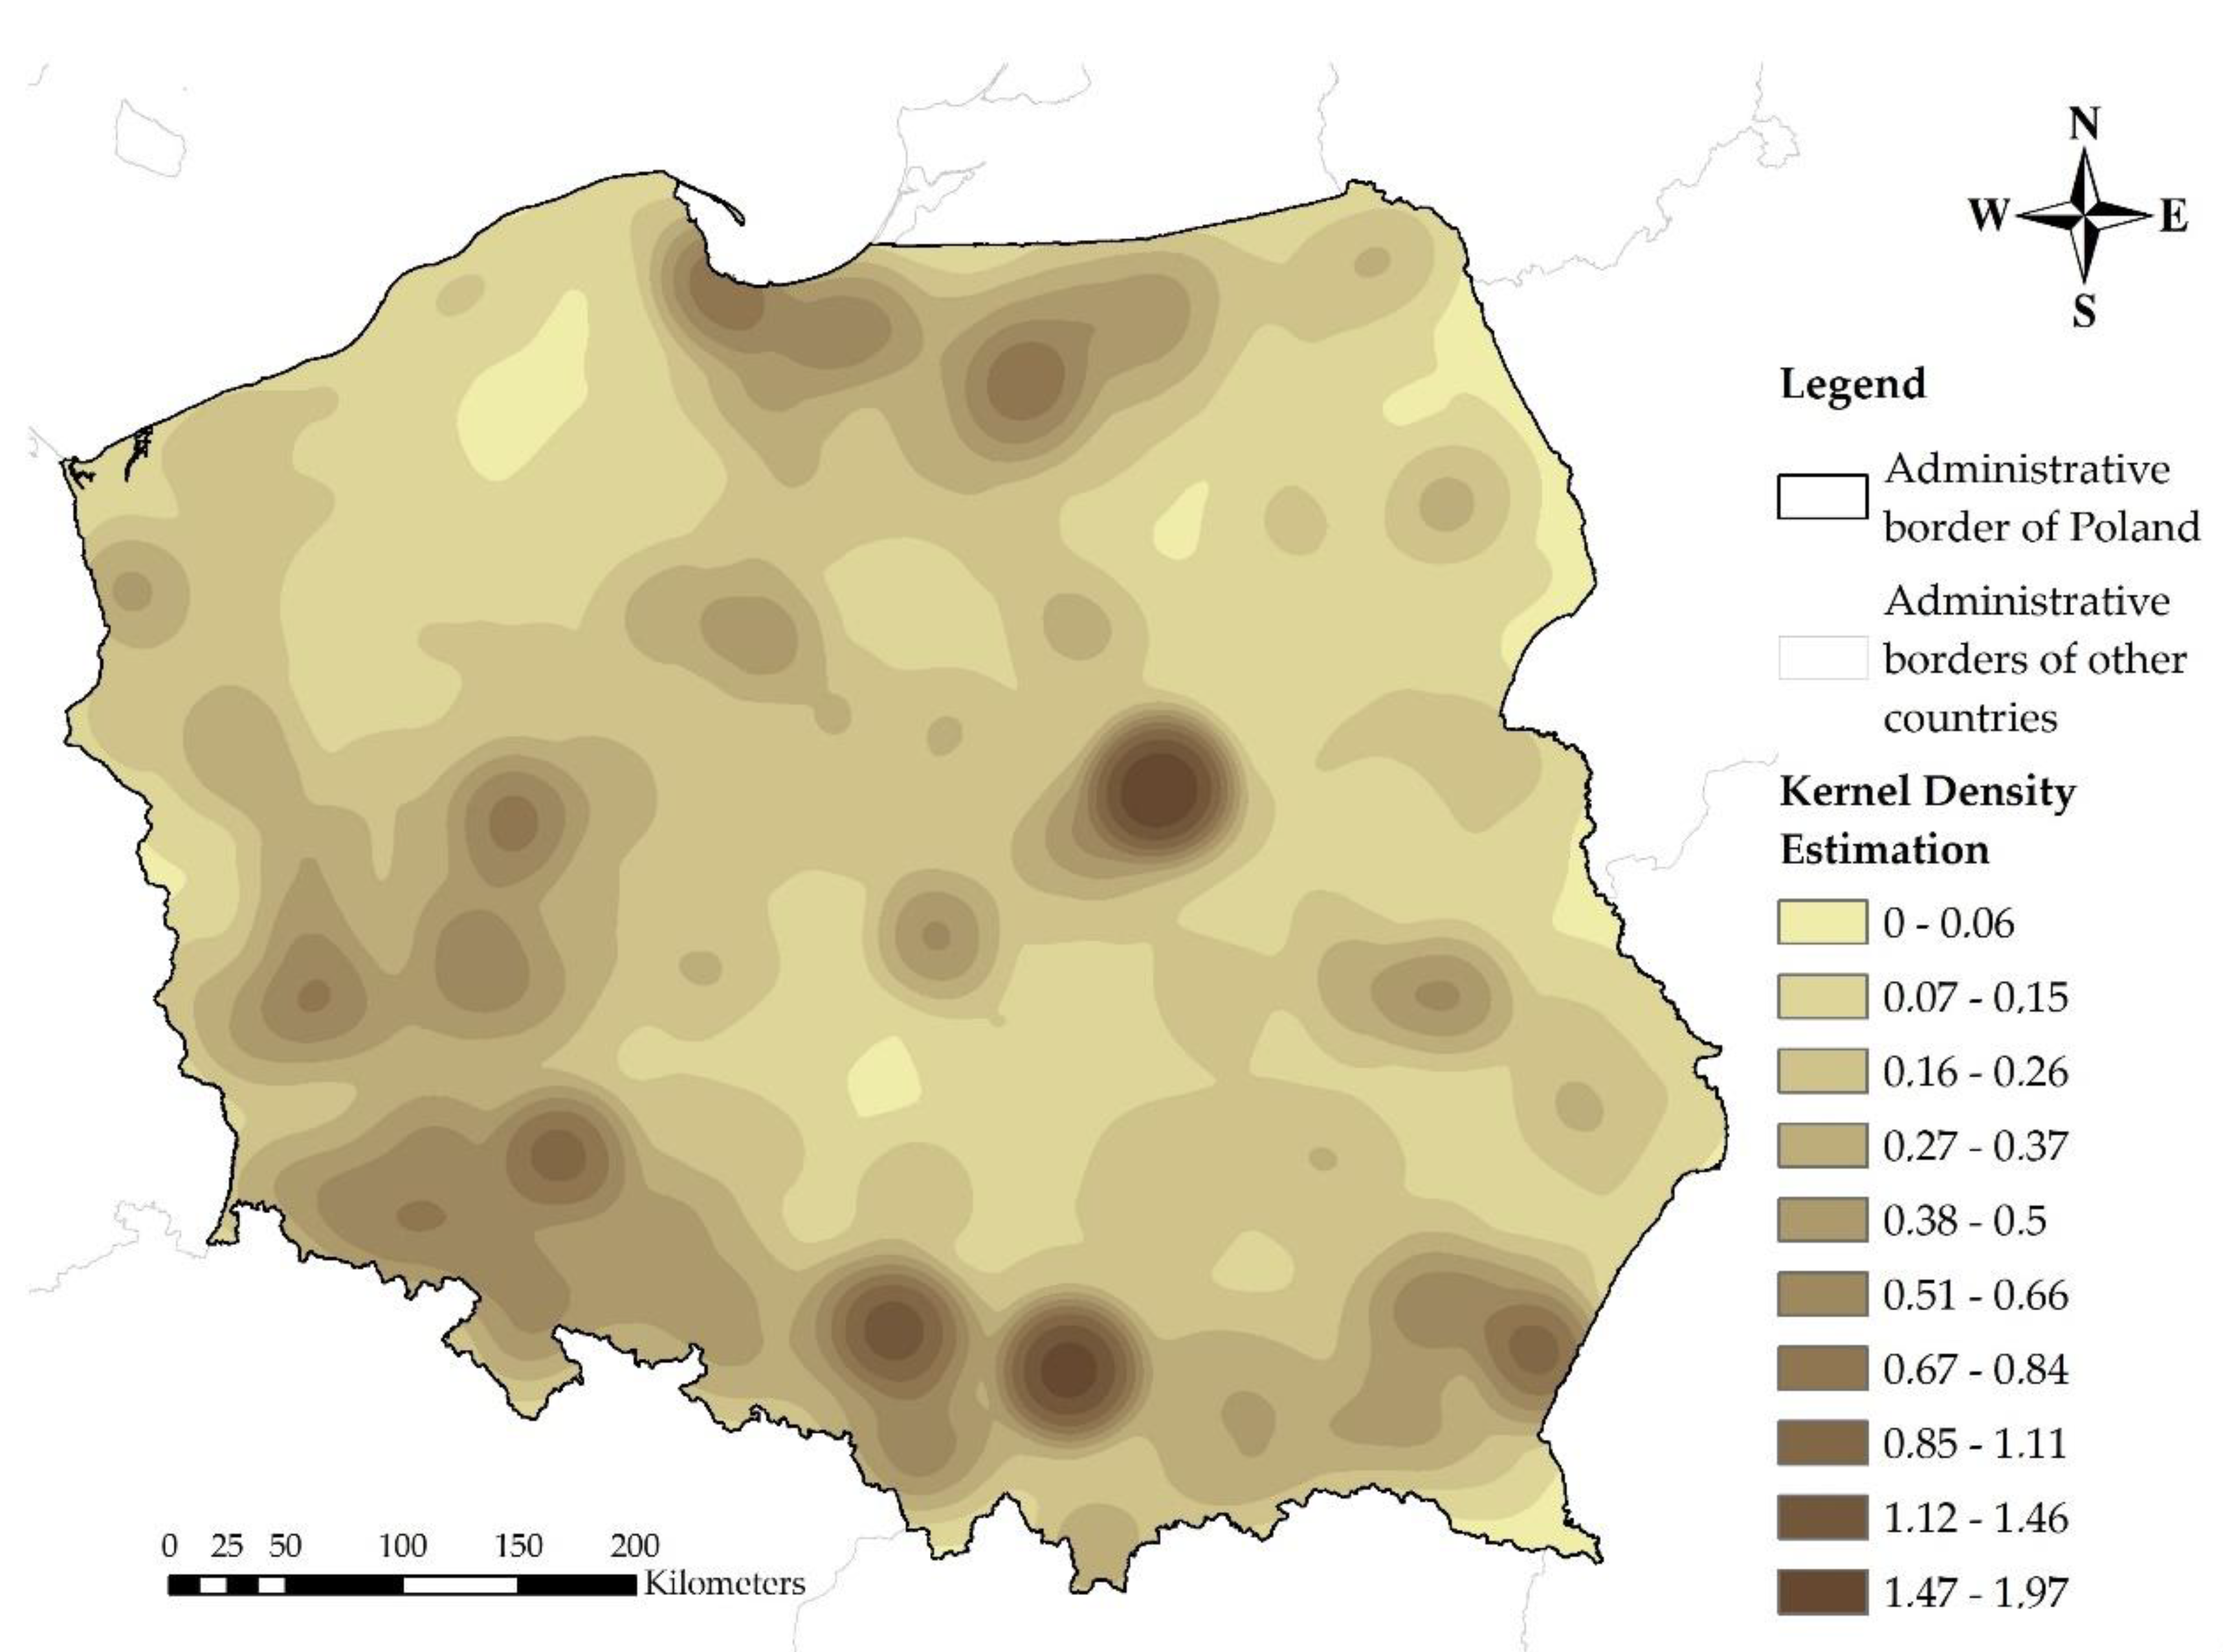
- With the availability of point data containing detailed information about the location of objects, kernel density estimation gives an accurate picture of reality, as shown in the Results section. This is due to the fact that KDE is a non-parametric method, taking into account only the location of objects—not affected by a generalization error.
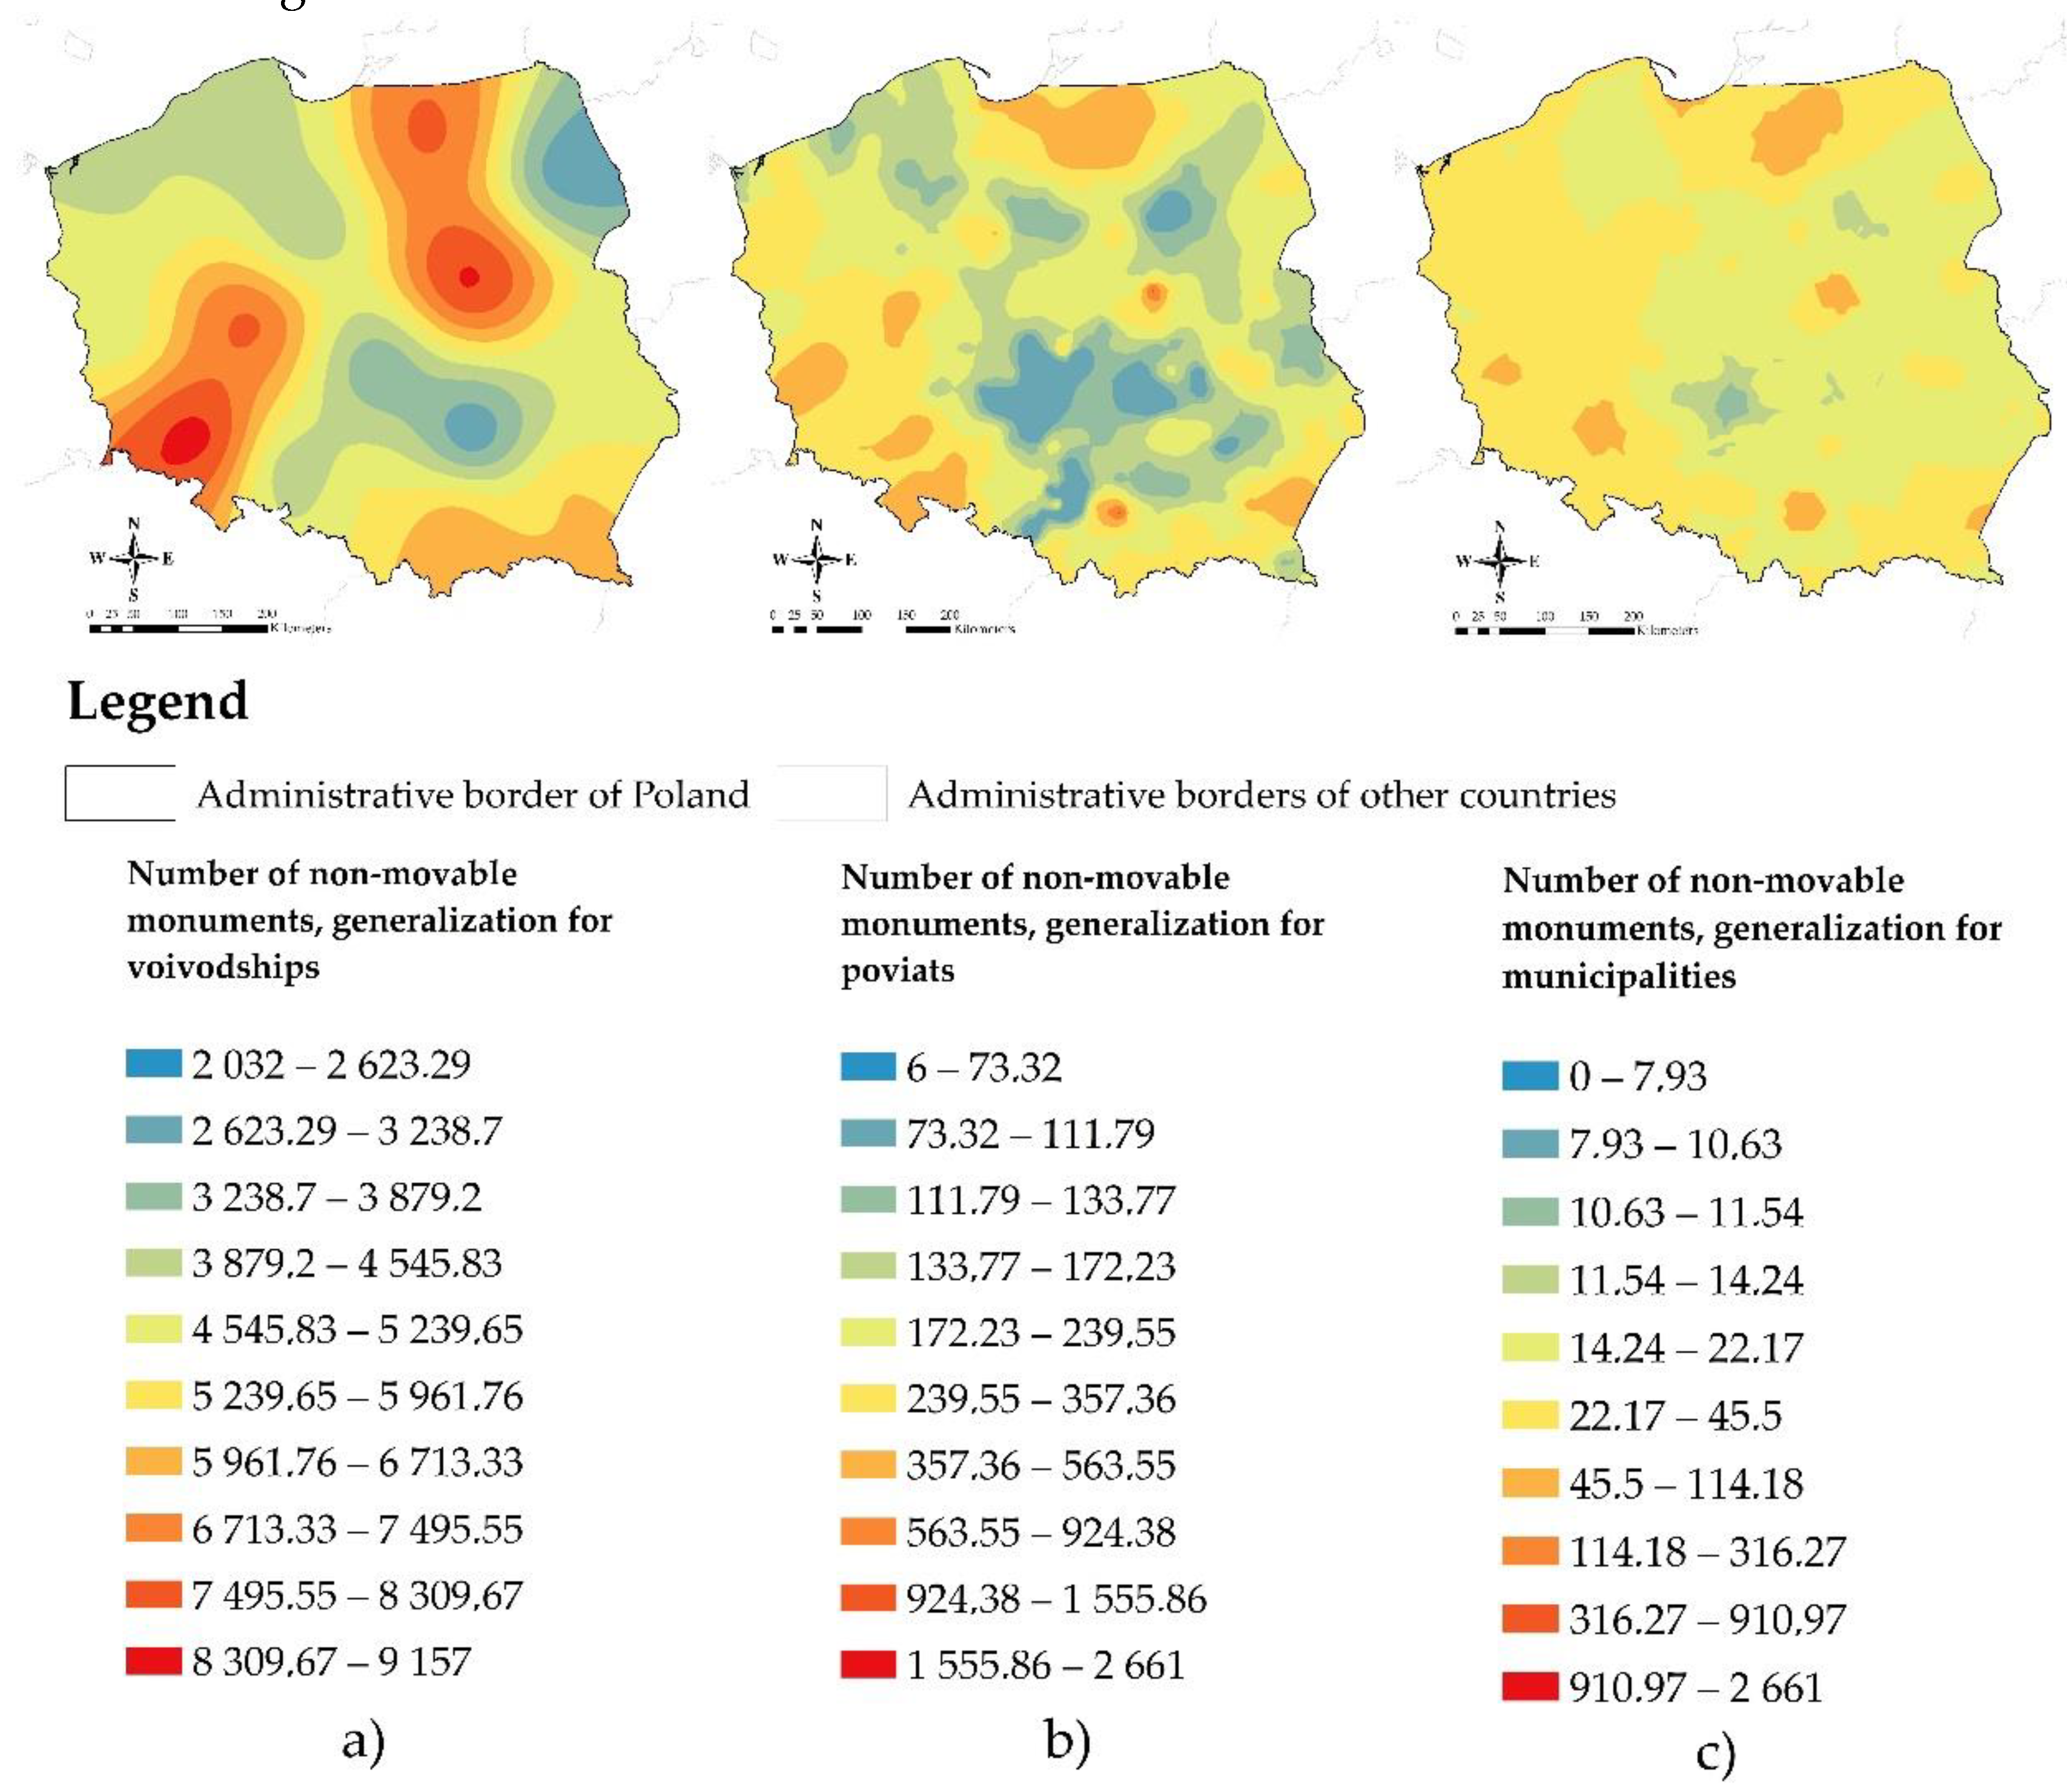
- With the availability of point data, which does not contain detailed information about the location of objects, containing only parameters describing it quantitatively, spatial analyses require a different approach. Conducted research has shown that spatial interpolation should be performed; from the methods analyzed in the article, the simple kriging method proved to be optimal. This was confirmed by the smallest RMSE value.
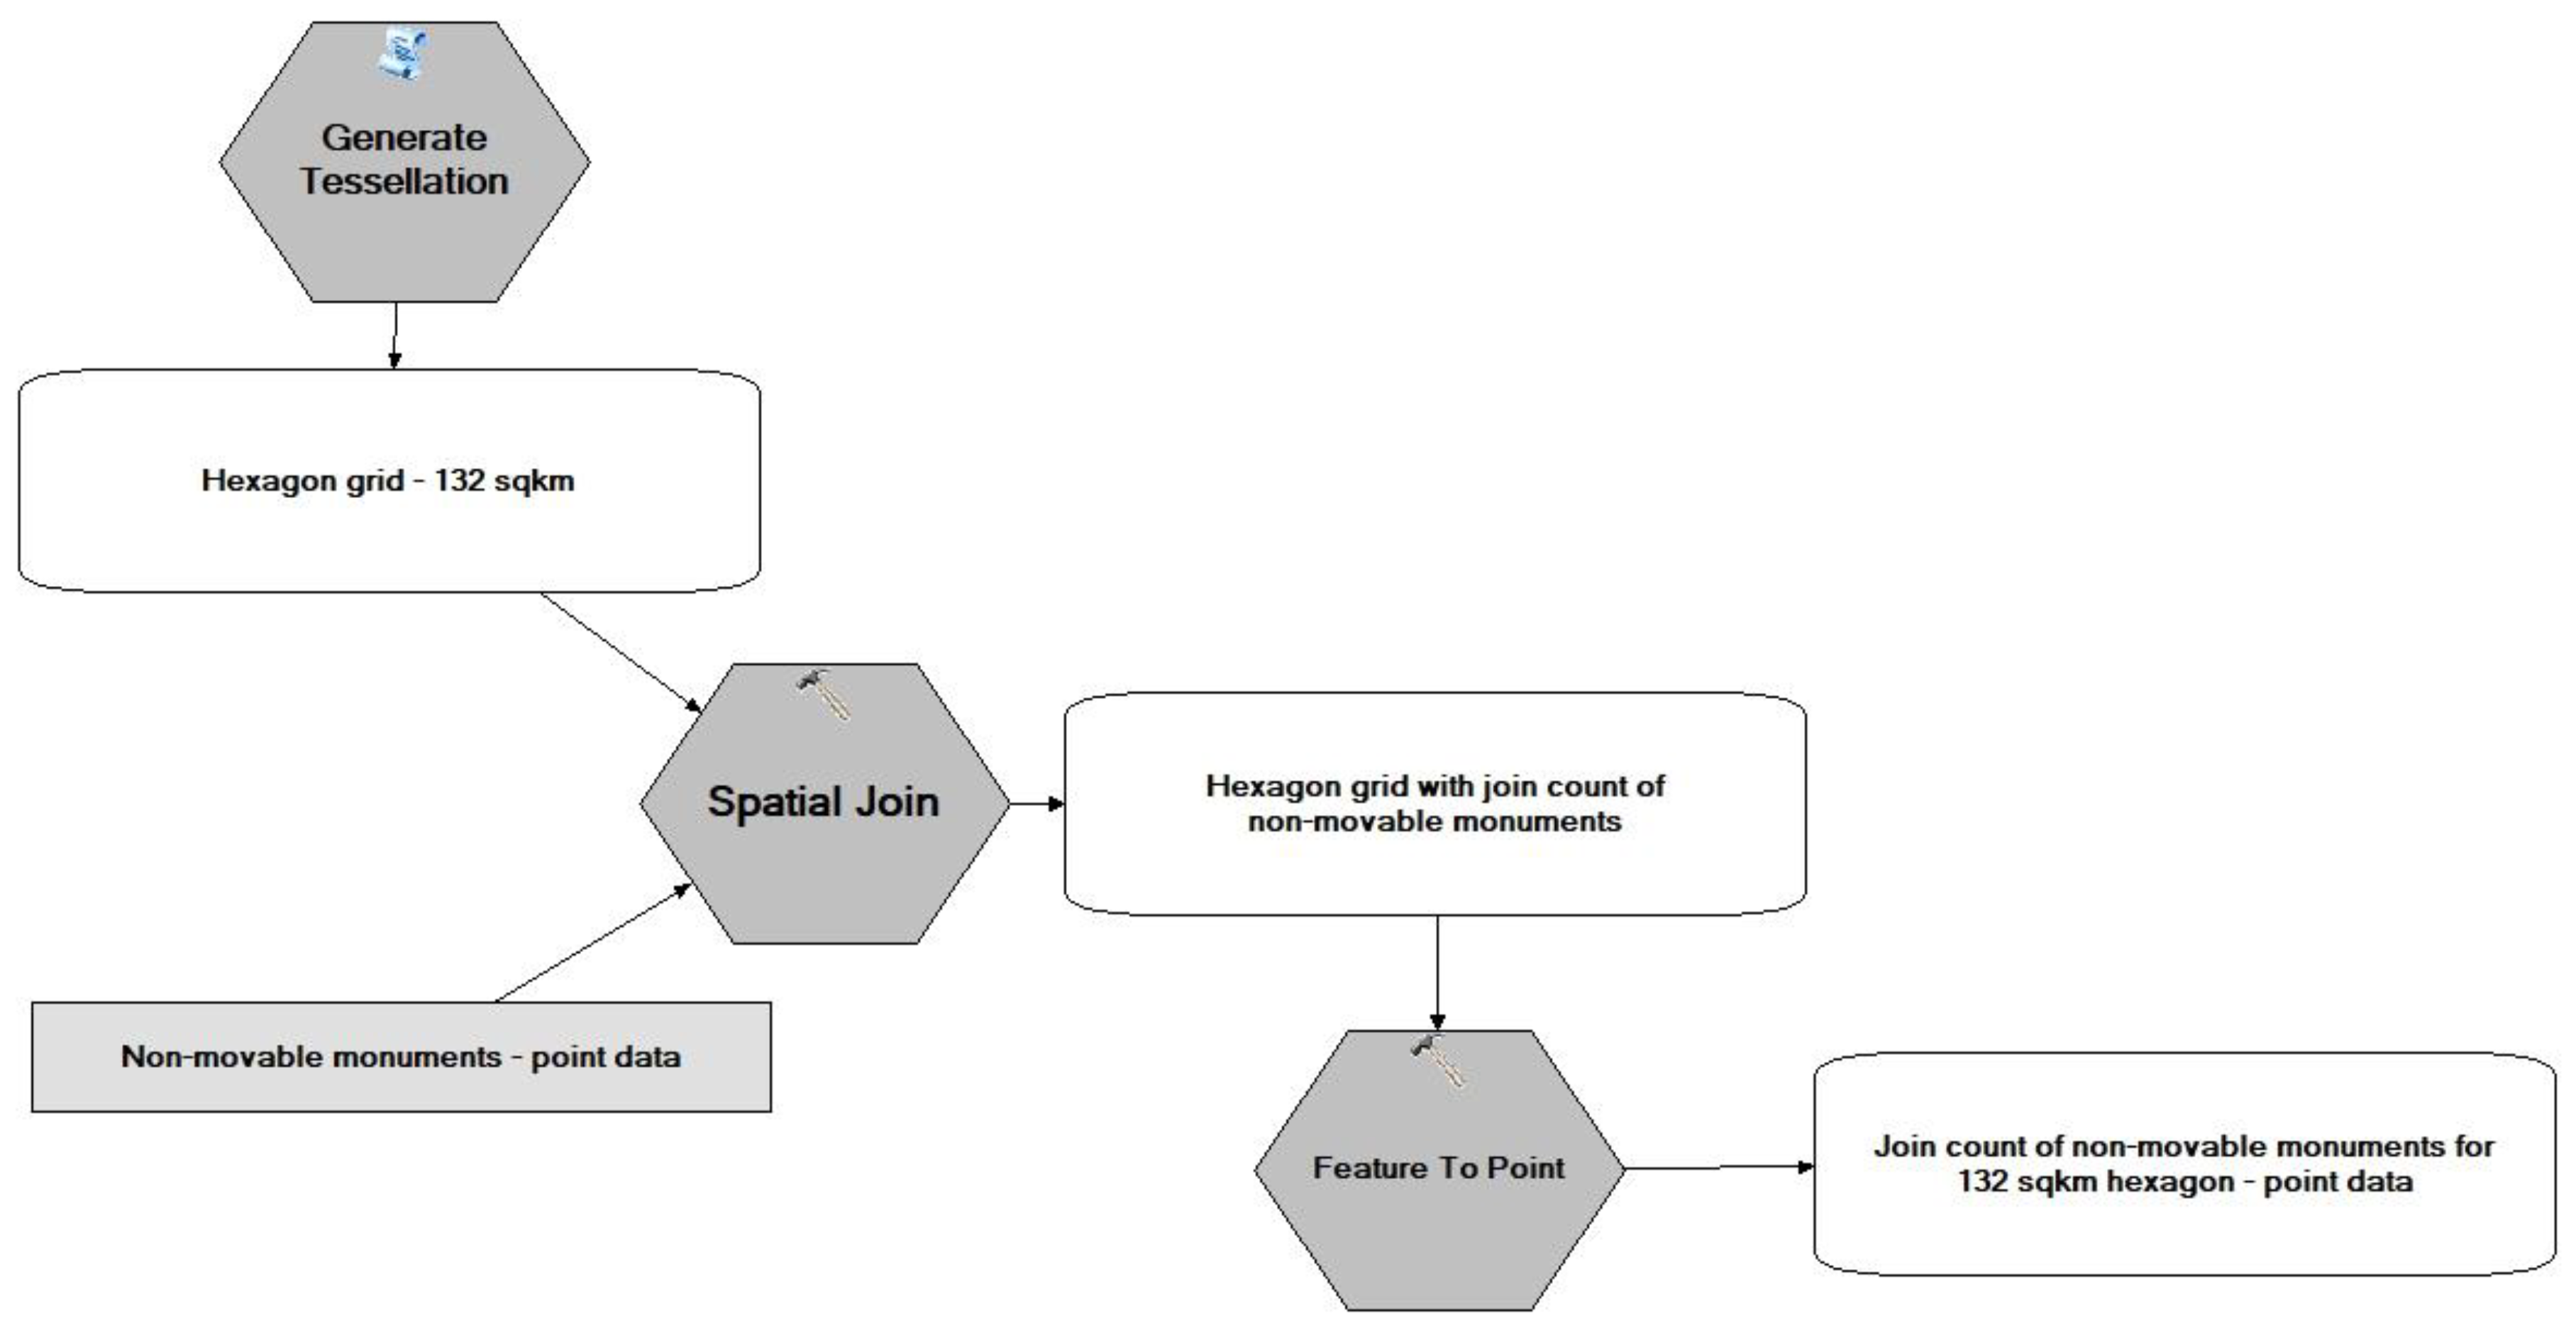
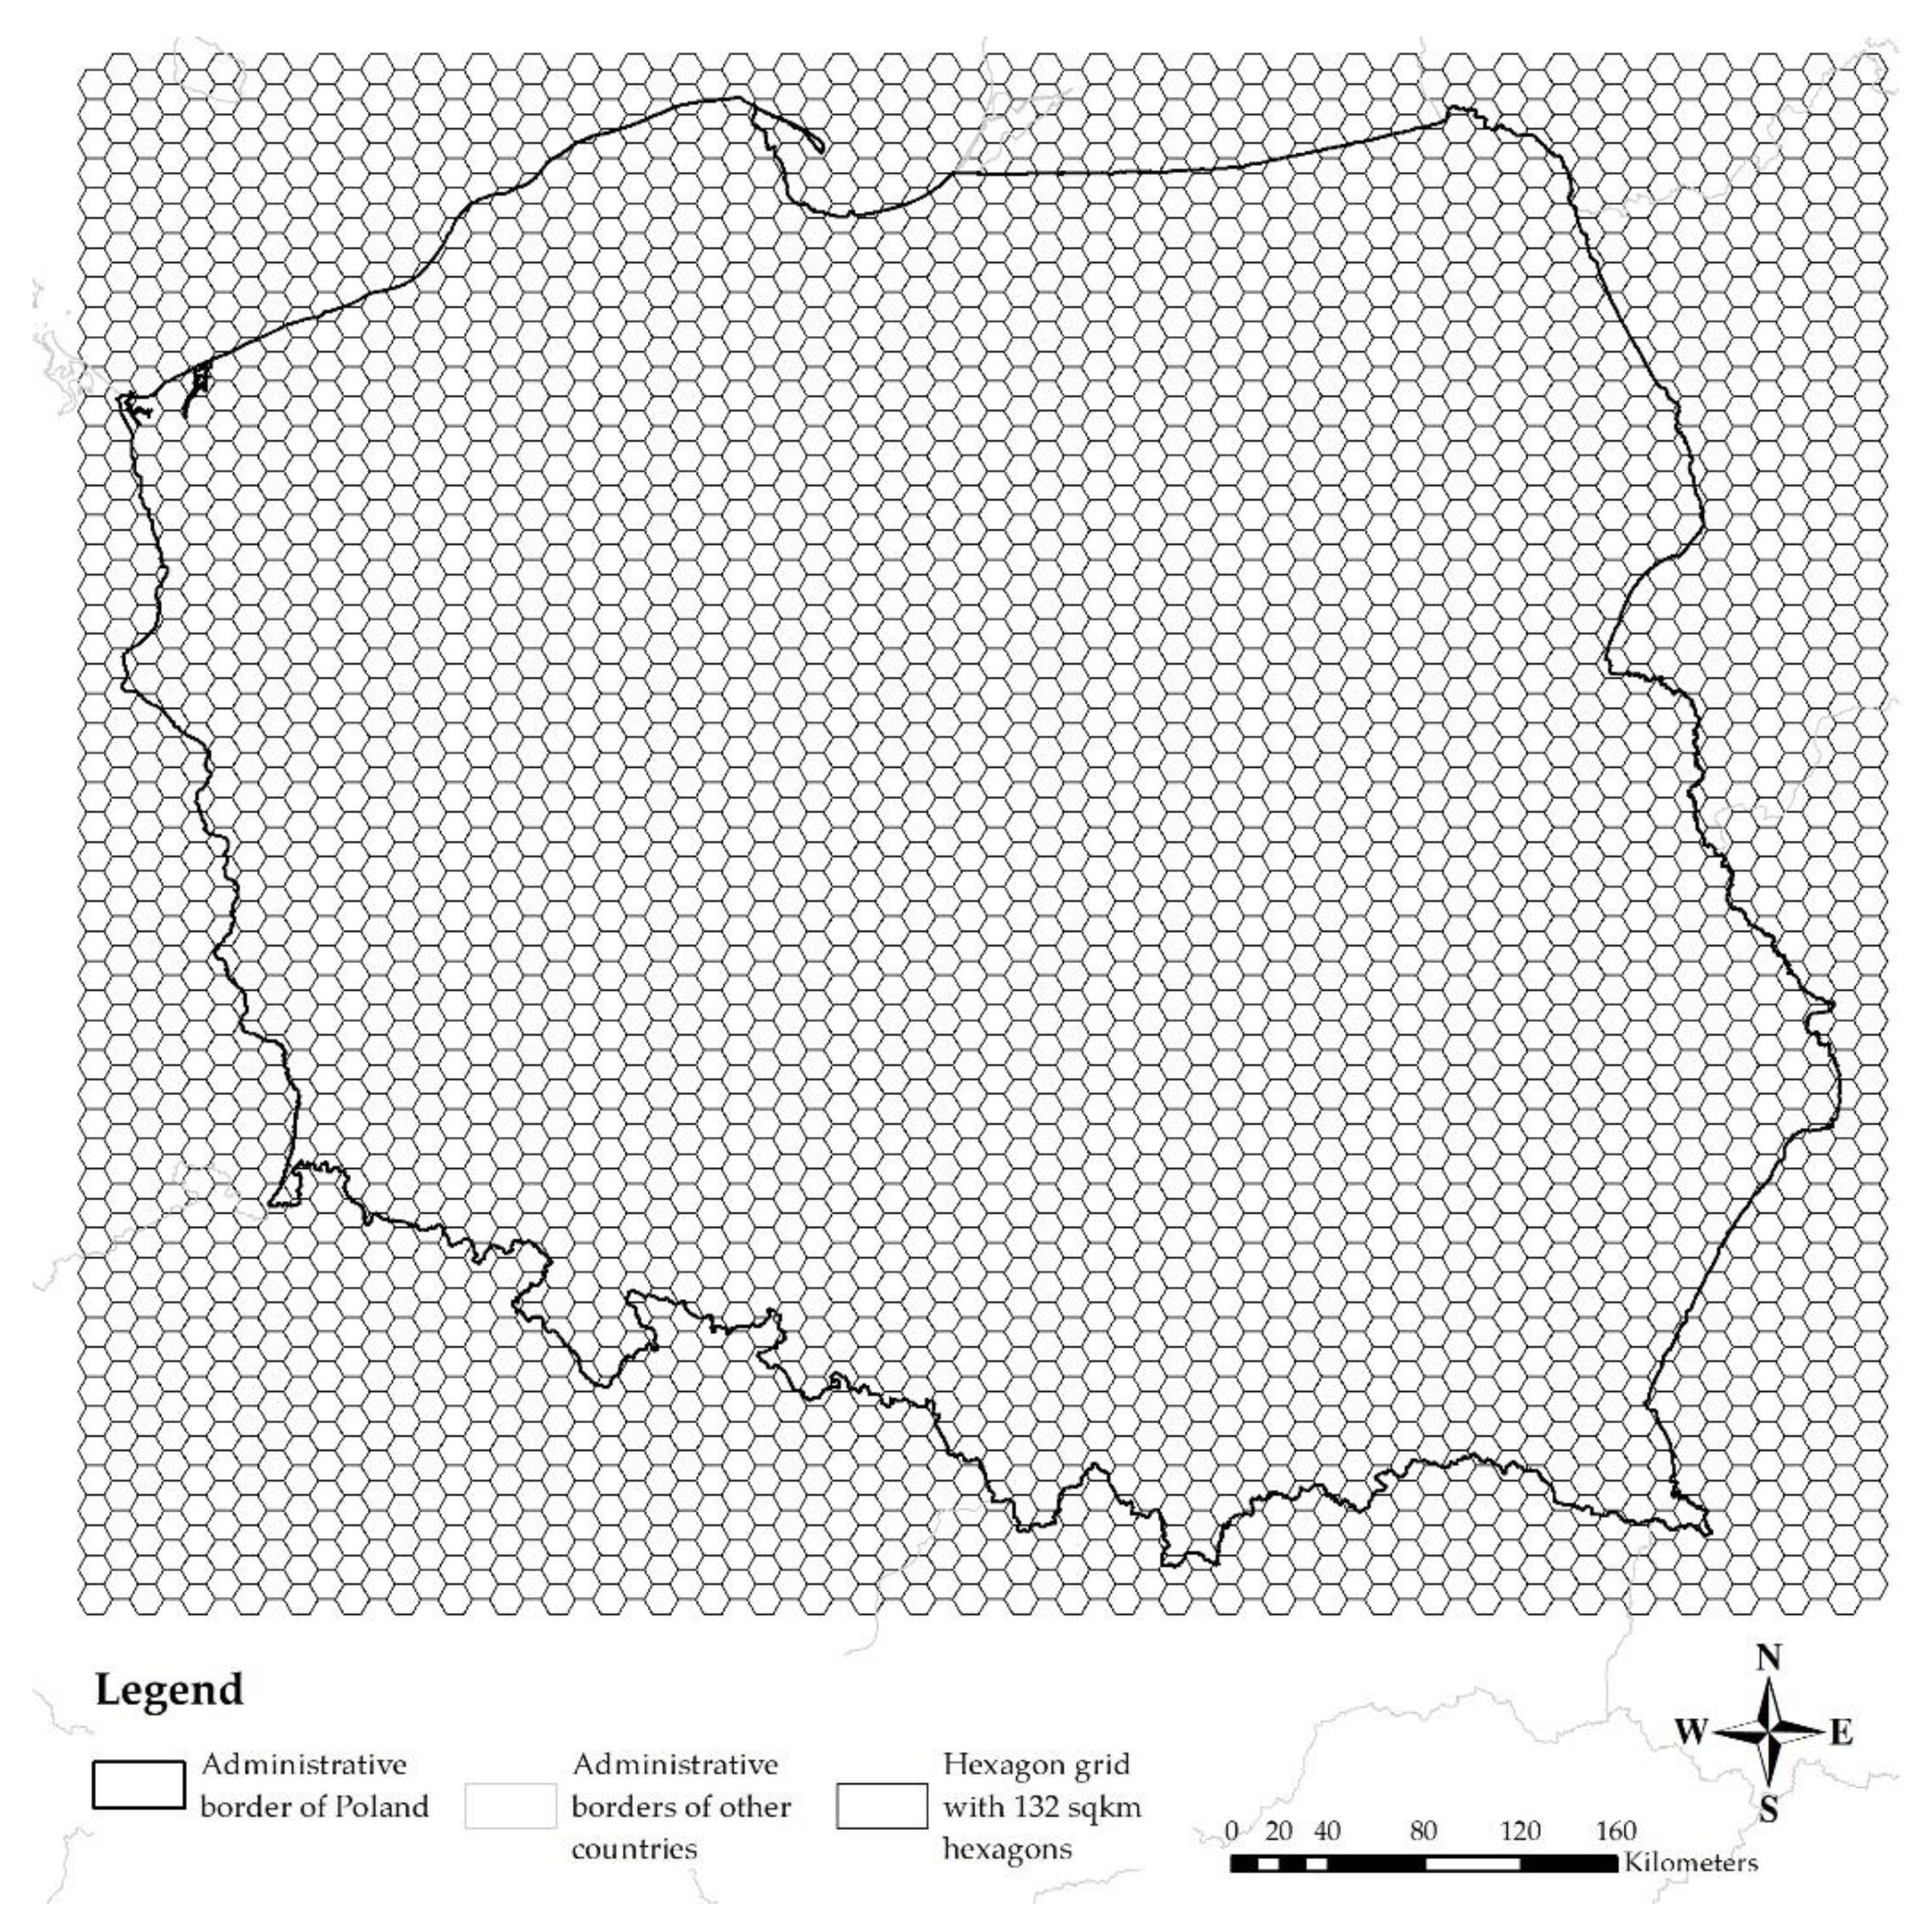
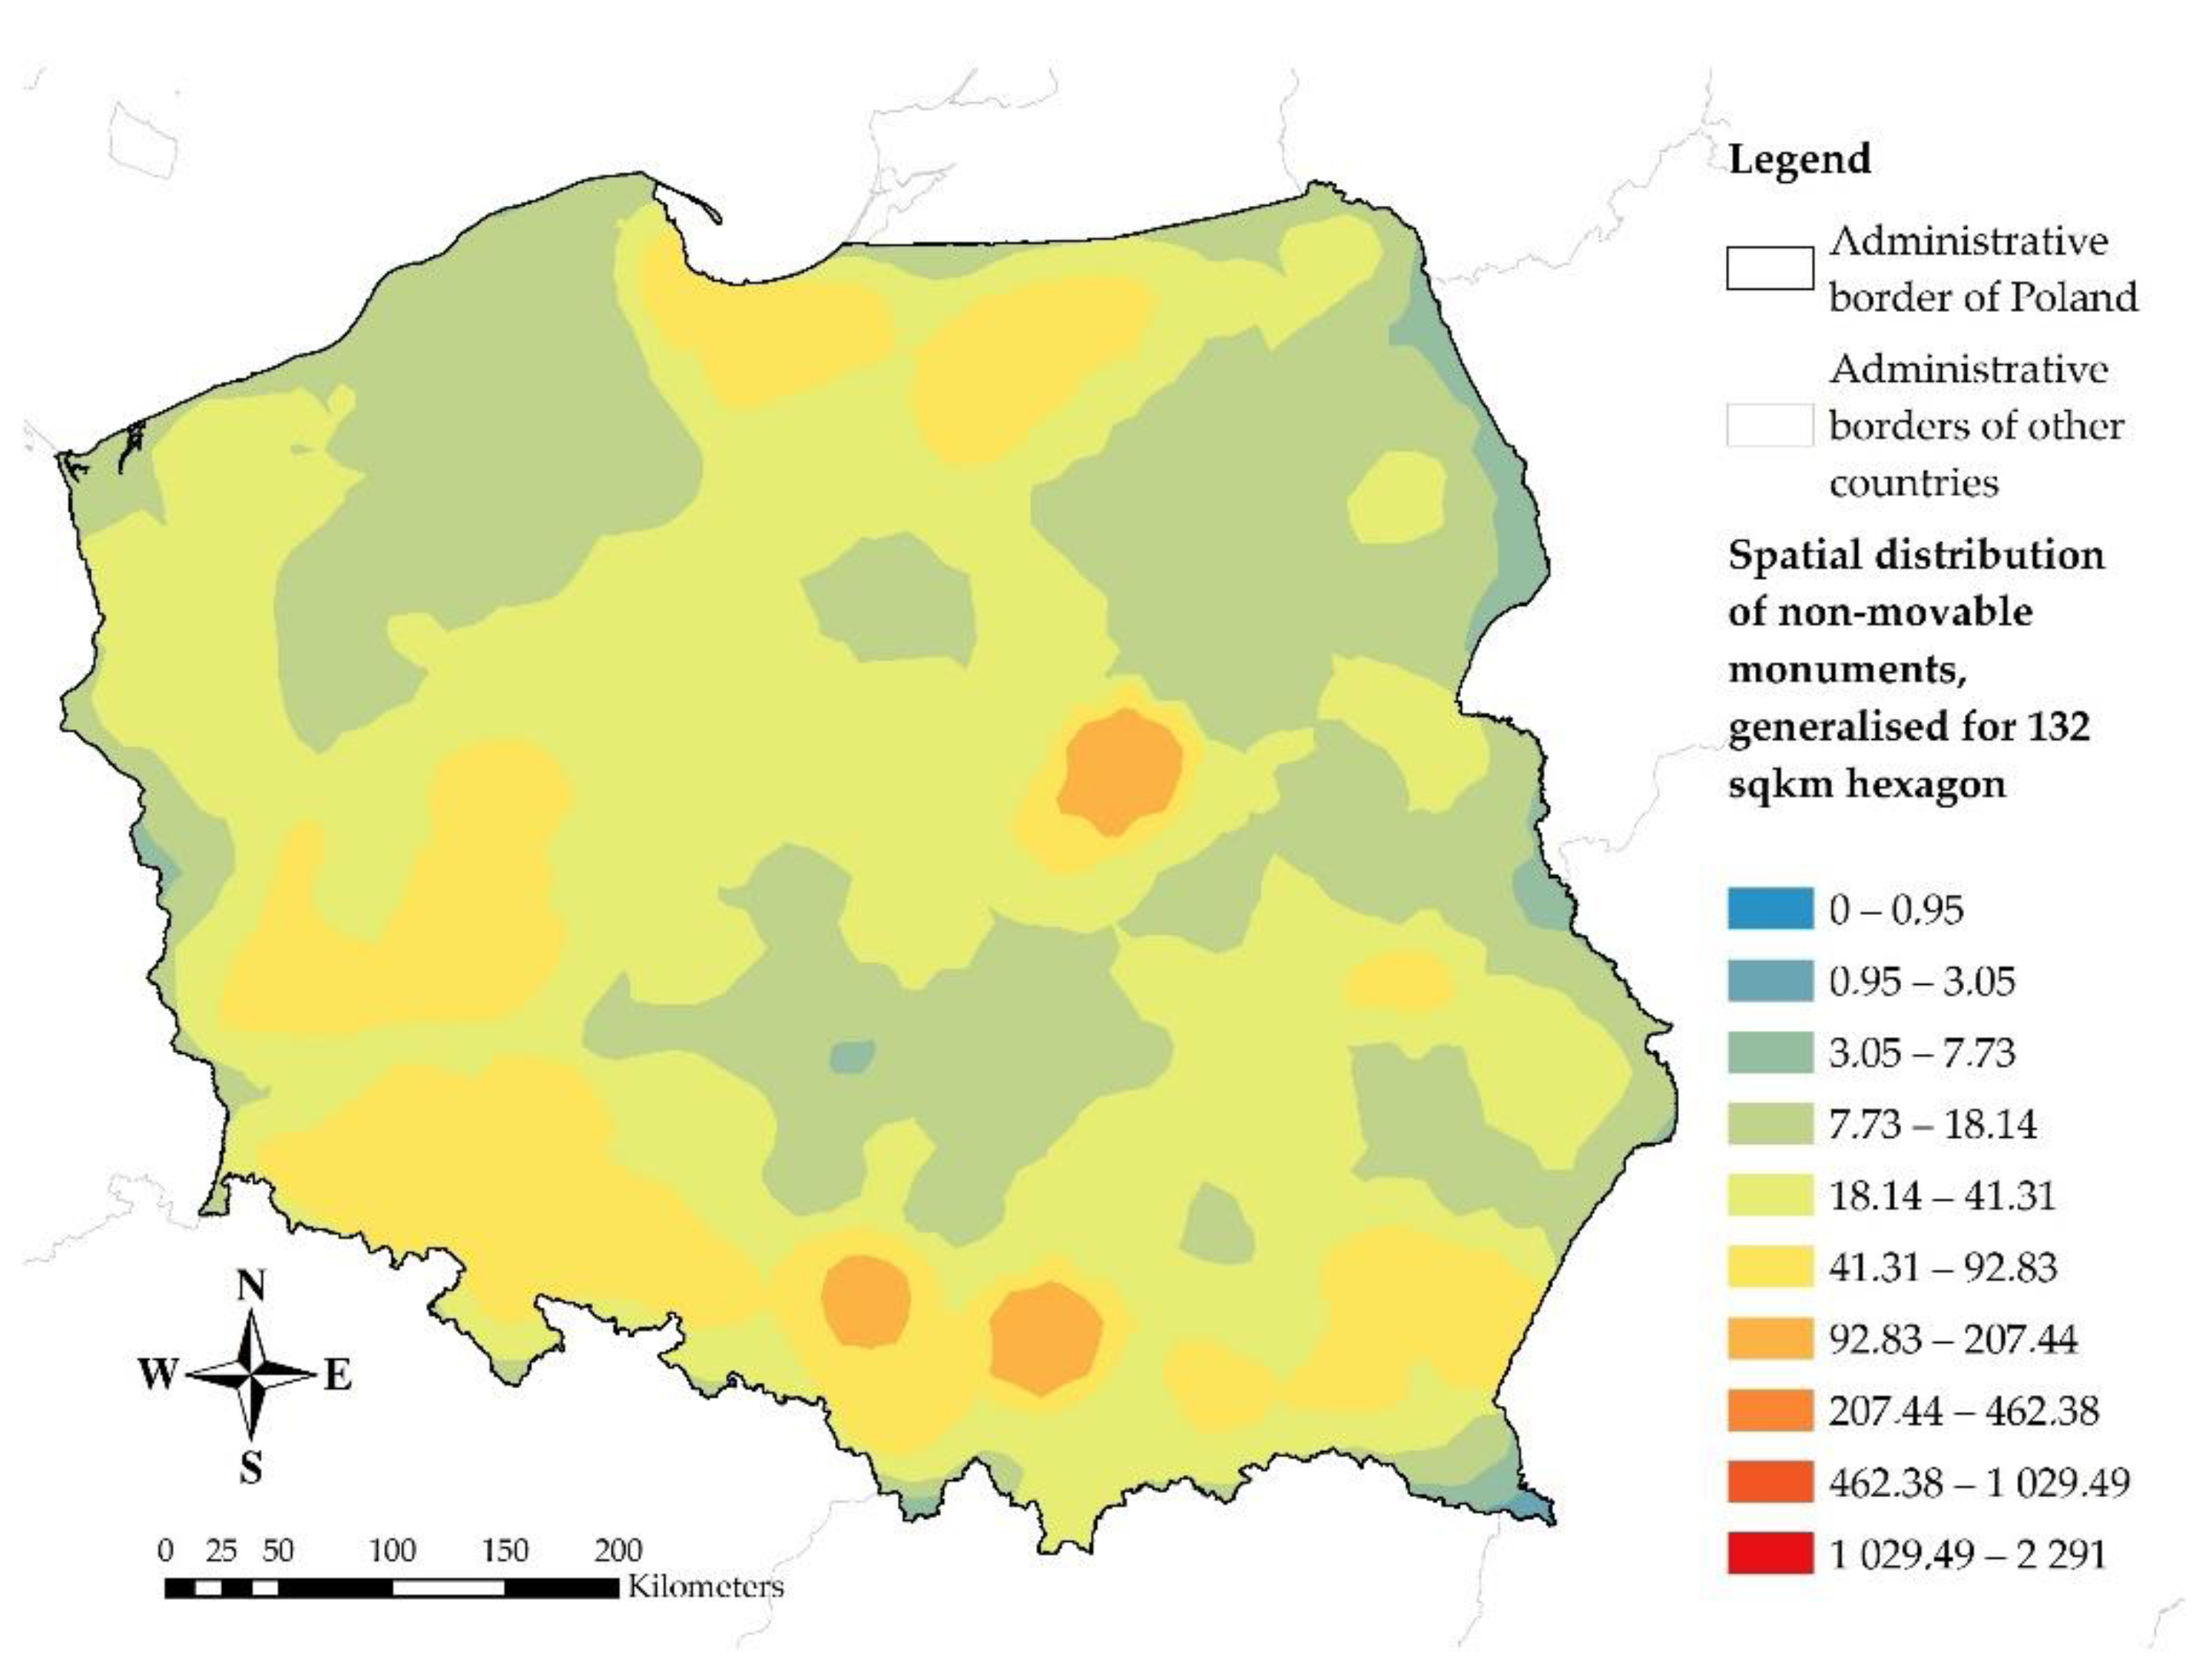
- In the case of unavailability of point data, the literature analysis showed a solution in the form of data generalization through the use of a hexagonal grid. The research conducted in the article showed that in the range of 110–200 km2 hexagons, very satisfying results are obtained (Pearson’s correlation coefficient assumes values above 0.95). The 132 km2 hexagon proved to be an optimal one—the Pearson’s correlation coefficient after averaging for all five test layers is 0.9829.
5. Conclusions
- To properly implement sustainable heritage management, thematic maps are required for various related analyses. Development of such maps (as indicated in the article) can be expensive, long, and not always possible to implement based on detailed location data. In the article, using data on non-moveable monuments in Poland, the methodology of creating more generalized maps using less data, is shown. Studies created in Poland (indicated in Conclusions, point 4) often require aggregated maps, without detailed location of the objects. The methodology presented in the article is a response to these needs.
- The study was based on point data of non-movable monuments in Poland, and the result of the 132 km2 hexagonal grid is the result only for this specific data. The methodology proposed in the article gives the possibility of universal application. Further research may be based on a comparison of different types of data using the methodology developed in this article. The hexagonal grid gave a specific result, and a comparison of other geometric figures can also become the basis for further studies.
- The scope of the analysis is also universal. The research in the article was carried out for the area of one country—Poland, including its administrative division units. Similar analyses can be made for any other country with a different administrative division, or even for larger areas (e.g., continents). The scope of the tests may also be limited to a smaller area (e.g., regions).
- In Poland, some studies on spatial management (part of the sustainable heritage management) directly concern the administrative areas and the analysis closes within its borders. Such documents include: National Spatial Development Concept for the country level; Voivodeship Development Strategy, and Voivodeship Spatial Management Plan for the voivodeship level; and Municipality Development Strategy, Study Of The Conditions And Directions Of The Spatial Management Of Municipality, Local Spatial Management Plans for the municipality level. For such applications, the point level of detail may even be unnecessarily high. Generalization of data may end at the level of a given administrative unit (this is also shown in the article).
- The research conducted in the article confirmed the wide possibilities of using GIS tools for various purposes, in this particular case concerning cultural heritage, and in particular sustainable heritage management.
Author Contributions
Funding
Acknowledgments
Conflicts of Interest
References
- Alkhalidi, A.; Qoaider, L.; Khashman, A.; Al-Alami, A.R.; Jiryes, S. Energy and Water as Indicators for Sustainable City SiteSelection and Design in Jordan using smart grid. Sustain. Cities Soc. 2018, 37, 125–132. [Google Scholar] [CrossRef]
- Antonopoulos, E. Sustainable Urban Development in Greece Using Integrated Territorial Investments. Eur. Struct. Investig. Funds J. 2018, 6, 28–34. [Google Scholar]
- Bell, S.; Morse, S. Routledge Handbook of Sustainability Indicators; Routledge: London, UK, 2018; ISBN 9781138674769. [Google Scholar]
- Act of 27 April 2001 Environmental Protection Law; Journal of Laws: Warsaw, Poland, 2001; Volume 62.
- World Commission on Environment and Development: Our Common Future; Oxford University Press: Oxford, UK, 1987.
- Pearce, D.W. Sustainable development and developing country economies. In Sustainable Environmental Management; Turner, R.K., Ed.; Bellhaven Press: London, UK, 1993; pp. 70–105. [Google Scholar]
- Bogacz-Wojtanowska, E.; Góral, A.; Bugdol, M. The Role of Trust in Sustainable Heritage Management Networks. Case Study of Selected Cultural Routes in Poland. Sustainability 2019, 11, 2844. [Google Scholar] [CrossRef]
- Hawkes, J. The Fourth Pillar of Sustainability: Culture’s Essential Role in Public Planning; Cultural Development Network: Melbourne, Australia, 2001; ISBN 1 86335 050 0. [Google Scholar]
- James, P.; Magee, L.; Scerri, A.; Steger, M. Measuring Community Sustainability: The social Life Questionaire. In Urban Sustainability in Theory and Practice: Circles of Sustainability; Routledge: London, UK, 2015; pp. 161–180. ISBN 9781138025721. [Google Scholar]
- Soini, K.; Birkeland, I. Exploring the scientific discourse on cultural sustainability. Geoforum 2014, 51, 213–223. [Google Scholar] [CrossRef]
- Janikowski, R. Kultura osią zrównoważonego rozwoju. In Kultura a Zrównoważony Rozwój; Janikowski, R., Krzysztofek, K., Eds.; Polski Komitet do spraw UNESCO: Warsaw, Poland, 2009; pp. 17–39. ISBN 9788390293943. [Google Scholar]
- Barthel-Boucher, D. Cultural Heritage and the Challenge of Sustainability. Online J. Public Archaeol. 2018, 4, 163. [Google Scholar]
- Hall, S.; Evans, J.; Nixon, S. Representation. Cultural Representations and Signifying Practices, 2nd ed.; Sage/Open University: London, UK, 2013; ISBN 9781849205634. [Google Scholar]
- Kirshenblatt-Gimblett, B. Intangible heritage as metacultural production. Mus. Int. 2014, 66, 52–65. [Google Scholar] [CrossRef]
- Davies, J.; Whimster, R.; Clayton, L. Heritage Counts 2009, England; English Heritage: London, UK, 2009. [Google Scholar]
- Boryczka, E.M.; Michalak, J.; Rzeńca, P. Protection of valuable areas of local cultural heritage in sustainable development. Cultural parks in the Lodz region. Ekon. I Środowisko 2019, 1, 225–240. [Google Scholar]
- Pereira Roders, A.; van Oers, R. Editorial: Bridging cultural heritage and sustainable development. J. Cult. Herit. Manag. Sustain. Dev. 2011, 1, 5–14. [Google Scholar] [CrossRef]
- Bonenberg, W. The Role of Cultural Heritage in Sustainable Development. Values and Valuation as Key Factors in Spatial Planning of Rural Areas. In Advances in Intelligent Systems and Computing Book Series (AISC, Volume 966); Springer: Cham, Switzerland, 2019; pp. 124–134. [Google Scholar]
- Rzasa, K.; Ogryzek, M.; Kulawiak, M. Cultural Heritage in Spatial Planning. In Proceedings of the 2016 Baltic Geodetic Congress (BGC Geomatics), Gdansk, Poland, 2–4 June 2016; pp. 85–89. [Google Scholar]
- Papoulias, E.; Zounis, T.-P. The Historic and Monumental Enhancement as a Tool for the Sustainable Development of Cultural Assets of Greece; Springer: Cham, Switzerland, 2019; pp. 271–278. [Google Scholar]
- Persson-Fischier, U. Sustainability in conflict: A study of cruise tourism to Gotland. In Proceedings of the MARE People and the Sea X, Amsterdam, The Netherlands, 24–28 June 2019. [Google Scholar]
- Ndiaye, M. Barriers to sustainable tourism in Senegal. Int. J. Innov. Educ. Res. 2019, 7, 258–274. [Google Scholar] [CrossRef]
- Act of 23 July 2003 on the Protection of Monuments and the Guardianship of Monuments; Journal of Laws: Warsaw, Poland, 2003; Volume 162.
- Regulation of the Minister of Culture of 9 February 2004 on the Model of an Information Sign Affixed to Non-Movable Monuments Entered in the Register of Monuments; Journal of Laws: Warsaw, Poland, 2004; Volume 30.
- Final act of the Intergovernmental Conference on the Protection of Cultural Property in the Event of Armed Conflict; UNESCO: Hague, The Netherlands, 1954; p. 83.
- Bielak, R.; Głowacka-Smolis, K.; Gustyn, J.; Kozera, A.; Kozłowska, J.; Lipowska, E.; Marikin, M.; Nowak, T.; Pilaszek, K.; Rybak-Nguyen, E.; et al. Statistical Yearbook of the Republic of Poland 2018; Statistics Poland: Warsaw, Poland, 2018. [Google Scholar]
- Database of Global Administrative Areas, GADM. Available online: https://gadm.org (accessed on 25 July 2019).
- Head Office of Geodesy and Cartography, Poland. Available online: http://www.gugik.gov.pl/pzgik/dane-bez-oplat/dane-z-panstwowego-rejestru-granic-i-powierzchni-jednostek-podzialow-terytorialnych-kraju-prg (accessed on 25 July 2019).
- Qi, L.; Huang, J.; Gao, J.; Cui, Z. Modelling the Impacts of Bathymetric Changes on Water Level in China’s Largest Freshwater Lake. Water 2019, 11, 1469. [Google Scholar] [CrossRef]
- Yang, B. Developing a Mobile Mapping System for 3D GIS and Smart City Planning. Sustainability 2019, 11, 3713. [Google Scholar] [CrossRef]
- Erdin, C.; Akbaş, H.E. A Comparative Analysis of Fuzzy TOPSIS and Geographic Information Systems (GIS) for the Location Selection of Shopping Malls: A Case Study from Turkey. Sustainability 2019, 11, 3837. [Google Scholar] [CrossRef]
- Layomi Jayasinghe, S.; Kumar, L.; Sandamali, J.; Layomi Jayasinghe, S.; Kumar, L.; Sandamali, J. Assessment of Potential Land Suitability for Tea (Camellia sinensis (L.) O. Kuntze) in Sri Lanka Using a GIS-Based Multi-Criteria Approach. Agriculture 2019, 9, 148. [Google Scholar] [CrossRef]
- Xiong, J.; Li, J.; Cheng, W.; Wang, N.; Guo, L.; Xiong, J.; Li, J.; Cheng, W.; Wang, N.; Guo, L. A GIS-Based Support Vector Machine Model for Flash Flood Vulnerability Assessment and Mapping in China. ISPRS Int. J. Geo-Inf. 2019, 8, 297. [Google Scholar] [CrossRef]
- Kartoziia, A. Assessment of the Ice Wedge Polygon Current State by Means of UAV Imagery Analysis (Samoylov Island, the Lena Delta). Remote Sens. 2019, 11, 1627. [Google Scholar] [CrossRef]
- Nohani, E.; Moharrami, M.; Sharafi, S.; Khosravi, K.; Pradhan, B.; Pham, B.T.; Lee, S.; Melesse, A.M. Landslide Susceptibility Mapping Using Different GIS-Based Bivariate Models. Water 2019, 11, 1402. [Google Scholar] [CrossRef]
- Tien Bui, D.; Khosravi, K.; Shahabi, H.; Daggupati, P.; Adamowski, J.F.; Melesse, A.M.; Thai Pham, B.; Pourghasemi, H.R.; Mahmoudi, M.; Bahrami, S.; et al. Flood Spatial Modeling in Northern Iran Using Remote Sensing and GIS: A Comparison between Evidential Belief Functions and Its Ensemble with a Multivariate Logistic Regression Model. Remote Sens. 2019, 11, 1589. [Google Scholar] [CrossRef]
- Kimsey, M.; Page-Dumroese, D.; Coleman, M.; Kimsey, M.; Page-Dumroese, D.; Coleman, M. Assessing Bioenergy Harvest Risks: Geospatially Explicit Tools for Maintaining Soil Productivity in Western US Forests. Forests 2011, 2, 797–813. [Google Scholar] [CrossRef]
- Song, B.; Park, K. Analysis of Spatiotemporal Urban Temperature Characteristics by Urban Spatial Patterns in Changwon City, South Korea. Sustainability 2019, 11, 3777. [Google Scholar] [CrossRef]
- Rząsa, K.; Ogryzek, M.; Ciski, M. Application of GIS technology in the protection of monuments on the example of Historic Monuments. E3s Web Conf. 2018, 63. [Google Scholar] [CrossRef]
- Rząsa, K.; Ciski, M. Archaeological monuments of the Warmian-Masurian voivodeship—Spatial analysis using GIS tools. E3s Web Conf. 2018, 63. [Google Scholar] [CrossRef]
- Rząsa, K.; Ciski, M.; Ogryzek, M. Application of GIS Tools in Spatial Distribution Modeling of Historical Monuments. Geomat. Environ. Eng. 2019, 13, 61. [Google Scholar] [CrossRef]
- Weichselbaum, J.; Papathoma, M. Sharpening census information in GIS to meet real-world conditions—The case for Earth Observation. Wit Trans. Ecol. Environ. 2005, 84. [Google Scholar] [CrossRef]
- Ogryzek, M.; Ciski, M. Cartographic Methods of Presentation the Average Transaction Prices of the Undeveloped Land. Civ. Environ. Eng. Rep. 2018, 28, 85–100. [Google Scholar] [CrossRef]
- Singh, A. Remote sensing and GIS applications for municipal waste management. J. Environ. Manag. 2019, 243, 22–29. [Google Scholar] [CrossRef] [PubMed]
- Peragón, J.M.; Pérez-Latorre, F.J.; Delgado, A.; Tóth, T. Best management irrigation practices assessed by a GIS-based decision tool for reducing salinization risks in olive orchards. Agric. Water Manag. 2018, 202, 33–41. [Google Scholar] [CrossRef]
- Kogure, K.; Takasaki, Y. GIS for empirical research design: An illustration with georeferenced point data. PLoS ONE 2019, 14, e0212316. [Google Scholar] [CrossRef] [PubMed]
- Escobar, F.; Williamson, I. Hierarchical Spatial Reasoning Applied To the Automated Design of Administrative Boundaries Using GIS. In Proceedings of the URISA 2000, Orlando, FL, USA, 19–23 August 2000; pp. 185–200. [Google Scholar]
- Estrada-Peña, A.; Venzal, J.M. A GIS framework for the assessment of tick impact on human health in a changing climate. Geospat. Health 2007, 1, 157–168. [Google Scholar] [CrossRef]
- Gullberg, J. Mathematics: From the Birth of Numbers; University of Denver: Denver, CO, USA, 1997; ISBN 039304002X. [Google Scholar]
- De Sousa, L.; Nery, F.; Sousa, R.; Matos, J. Assessing the accuracy of hexagonal versus square tilled grids in preserving DEM surface flow directions. In Proceedings of the 7th International Symposium on Spatial Accuracy Assessment in Natural Resources and Environmental Sciences, Lisbon, Portugal, 5–7 July 2006; pp. 191–200. [Google Scholar]
- Golay, M.J.E. Hexagonal Parallel Pattern Transformations. IEEE Trans. Comput. 1969, 18, 733–740. [Google Scholar] [CrossRef]
- Mersereau, R.M. The processing of hexagonally sampled two-dimensional signals. Proc. IEEE 1979, 67, 930–949. [Google Scholar] [CrossRef]
- He, X.; Shen, G.; Xu, R.; Yang, W.; Zhang, C.; Liu, Z.; Chen, B.; Liu, J.; Song, M. Hexagonal and square patterned silver nanowires/PEDOT:PSS composite grids by screen printing for uniformly transparent heaters. Polymers 2019, 11, 468. [Google Scholar] [CrossRef]
- Uher, V.; Gajdoš, P.; Snášel, V.; Lai, Y.-C.; Radecký, M. Hierarchical Hexagonal Clustering and Indexing. Symmetry 2019, 11, 731. [Google Scholar] [CrossRef]
- Brimkov, V.E.; Barneva, R.P. “Honeycomb” vs Square and Cubic Models. Electron. Notes Theor. Comput. Sci. 2001, 46, 321–338. [Google Scholar] [CrossRef]
- Wen, W.; Khatibi, S. The impact of curviness on four different image sensor forms and structures. Sensors 2018, 18, 429. [Google Scholar] [CrossRef] [PubMed]
- Lee, G.; Chong, N.Y. A geometric approach to deploying robot swarms. Ann. Math. Artif. Intell. 2008, 52, 257–280. [Google Scholar] [CrossRef]
- Snyder, J.P. Flattening the Earth: Two Thousand Years of Map Projections; University of Chicago Press: Chicago, IL, USA, 1993; ISBN 9780226767475. [Google Scholar]
- Steenmans, C.; Lillethun, A.; Cryan, S.; Bliki, J.; Jessen, T.; Lund, M.; Bredahl, L.; Jeppesen, J. Guide to Geographical Data and Maps; European Environmental Agency: Copenhagen, Denmark, 2005. [Google Scholar]
- Annoni, A.; Bernard, L.; Lillethun, A.; Ihde, J.; Gallego, J.; Rives, M.; Sommer, E.; Poelman, H.; Condé, S.; Greaves, M.; et al. 1st Workshop on European Reference Grids. In Proceedings of the 1st European Reference Grid workshop and Proposal for a European Reference Grid Coding System; Annoni, A., Ed.; JRC-Institute for Environment and Sustainability: Ispra, Italy, 2004. [Google Scholar]
- Silverman, B.W. Density Estimation: For Statistics and Data Analysis; Routledge: London, UK, 2018; ISBN 9781351456173. [Google Scholar]
- Nie, K.; Wang, Z.; Du, Q.; Ren, F.; Tian, Q.; Nie, K.; Wang, Z.; Du, Q.; Ren, F.; Tian, Q. A Network-Constrained Integrated Method for Detecting Spatial Cluster and Risk Location of Traffic Crash: A Case Study from Wuhan, China. Sustainability 2015, 7, 2662–2677. [Google Scholar] [CrossRef]
- Yang, X.; Zhao, Z.; Lu, S. Exploring spatial-temporal patterns of urban human mobility hotspots. Sustainability 2016, 8, 674. [Google Scholar] [CrossRef]
- Qin, Z.; Li, W.; Xiong, X. Estimating wind speed probability distribution using kernel density method. Electr. Power Syst. Res. 2011, 81, 2139–2146. [Google Scholar] [CrossRef]
- Baxter, M.J.; Beardah, C.C.; Wright, R.V.S. Some archaeological applications of kernel density estimates. J. Archaeol. Sci. 1997, 24, 347–354. [Google Scholar] [CrossRef]
- Brigand, R.; Weller, O. Kernel density estimation and transition maps of Moldavian Neolithic and Eneolithic settlement. Data Brief 2018, 17, 452–458. [Google Scholar] [CrossRef]
- Fadda, D.; Slezak, E.; Bijaoui, A. Density estimation with non-parametric methods. Astron. Astrophys. Suppl. Ser. 1997, 127, 335–352. [Google Scholar] [CrossRef]
- Danese, M.; Lazzari, M.; Murgante, B. Kernel Density Estimation Methods for a Geostatistical Approach in Seismic Risk Analysis: The Case Study of Potenza Hilltop Town (Southern Italy). In Computational Science and Its Applications—ICCSA 2008; Springer: Berlin/Heidelberg, Germany, 2008; pp. 415–429. [Google Scholar]
- Kremer, J.; Gieseke, F.; Steenstrup Pedersen, K.; Igel, C. Nearest neighbor density ratio estimation for large-scale applications in astronomy. Astron. Comput. 2015, 12, 67–72. [Google Scholar] [CrossRef]
- Jang, W.; Hendry, M. Cluster analysis of massive datasets in astronomy. Stat. Comput. 2007, 17, 253–262. [Google Scholar] [CrossRef]
- Vio, R.; Fasano, G.; Lazzarin, M.; Lessi, O. Kernel density estimators applied to gamma ray light curves. Astron. Astrophys. 1986, 289, 640–648. [Google Scholar]
- Worton, B.J. Kernel methods for estimating the utilization distribution in home- range studies. Ecology 1989, 70, 164–168. [Google Scholar] [CrossRef]
- Pittiglio, C.; Skidmorea, A.K.; van Gils, H.A.M.J.; Prins, H.H.T. Identifying transit corridors for elephant using a long time-series. Int. J. Appl. Earth Obs. Geoinf. 2012, 14, 61–72. [Google Scholar] [CrossRef]
- Maxwell, S.M.; Scales, K.L.; Bograd, S.J.; Briscoe, D.K.; Dewar, H.; Hazen, E.L.; Lewison, R.L.; Welch, H.; Crowder, L.B. Seasonal spatial segregation in blue sharks (Prionace glauca) by sex and size class in the Northeast Pacific Ocean. Divers. Distrib. 2019. [Google Scholar] [CrossRef]
- Niblett, M.; Church, R.; Sweeney, S.; Barber, K.; Niblett, M.R.; Church, R.L.; Sweeney, S.H.; Barber, K.H. Characterizing Habitat Elements and Their Distribution over Several Spatial Scales: The Case of the Fisher. Forests 2017, 8, 186. [Google Scholar] [CrossRef]
- Jeon, J.; Taylor, J.W. Using Conditional Kernel Density Estimation for Wind Power Density Forecasting. J. Am. Stat. Assoc. 2012, 107, 66–79. [Google Scholar] [CrossRef]
- Juban, J.; Fugon, L.; Kariniotakis, G. Probabilistic Short-Term Wind Power Forecasting Based on Kernel Density Estimators. In Proceedings of the European Wind Energy Conference and Exhibition, EWEC 2007, Milan, Italy, 7–10 May 2007. [Google Scholar]
- Wang, L.; Chen, Z.; Ma, D.; Zhao, P.; Wang, L.; Chen, Z.; Ma, D.; Zhao, P. Measuring Carbon Emissions Performance in 123 Countries: Application of Minimum Distance to the Strong Efficiency Frontier Analysis. Sustainability 2013, 5, 5319–5332. [Google Scholar] [CrossRef]
- Fan, Z.; Fan, X.; Crosby, M.K.; Moser, W.K.; He, H.; Spetich, M.A.; Shifley, S.R. Spatio-temporal trends of oak decline and mortality under periodic regional drought in the Ozark Highlands of Arkansas and Missouri. Forests 2012, 3, 614–631. [Google Scholar] [CrossRef]
- Stacciarini, J.M.R.; Vacca, R.; Mao, L. Who and where: A socio-spatial integrated approach for community-based health research. Int. J. Environ. Res. Public Health 2018, 15, 1375. [Google Scholar] [CrossRef] [PubMed]
- Wang, J.; Kwan, M.P.; Chai, Y. An innovative context-based crystal-growth activity space method for environmental exposure assessment: A study using GIS and GPS trajectory data collected in Chicago. Int. J. Environ. Res. Public Health 2018, 15, 703. [Google Scholar] [CrossRef] [PubMed]
- Wang, C.-C.; Chang, C.-D.; Jiang, B. Developing a Health Risk Evaluation Method for Triple H. Int. J. Environ. Res. Public Health 2019, 16, 1168. [Google Scholar] [CrossRef] [PubMed]
- Bonato, M.; Parazzini, M.; Chiaramello, E.; Fiocchi, S.; Le Brusquet, L.; Magne, I.; Souques, M.; Röösli, M.; Ravazzani, P.; Bonato, M.; et al. Characterization of Children’s Exposure to Extremely Low Frequency Magnetic Fields by Stochastic Modeling. Int. J. Environ. Res. Public Health 2018, 15, 1963. [Google Scholar] [CrossRef] [PubMed]
- Chiu, S.-T. Bandwidth Selection for Kernel Density Estimation. Ann. Stat. 1991, 19, 1883–1905. [Google Scholar] [CrossRef]
- Sheather, S.J.; Jones, M.C. A Reliable Data-Based Bandwidth Selection Method for Kernel Density Estimation. J. R. Stat. Soc. Ser. B (Methodol.) 1991, 53, 683–690. [Google Scholar] [CrossRef]
- Krisp, J.M.; Peters, S.; Murphy, C.E.; Fan, H. Visual Bandwidth Selection for Kernel Density Maps. Photogramm. Fernerkund. Geoinf. 2009, 2009, 445–454. [Google Scholar] [CrossRef]
- Di Piazza, A.; Conti, F.L.; Viola, F.; Eccel, E.; Noto, L.V. Comparative analysis of spatial interpolation methods in the Mediterranean area: Application to temperature in Sicily. Water 2015, 7, 1866–1888. [Google Scholar] [CrossRef]
- Xia, X.; Qi, Q.; Liang, H.; Zhang, A.; Jiang, L.; Ye, Y.; Liu, C.; Huang, Y. Pattern of Spatial Distribution and Temporal Variation of Atmospheric Pollutants during 2013 in Shenzhen, China. ISPRS Int. J. Geo-Inf. 2016, 6, 2. [Google Scholar] [CrossRef]
- Kethireddy, S.R.; Tchounwou, P.B.; Ahmad, H.A.; Yerramilli, A.; Young, J.H. Geospatial interpolation and mapping of tropospheric ozone pollution using geostatistics. Int. J. Environ. Res. Public Health 2014, 11, 983–1000. [Google Scholar] [CrossRef]
- Johnson, B.; Tateishi, R.; Kobayashi, T. Remote sensing of fractional green vegetation cover using spatially-interpolated endmembers. Remote Sens. 2012, 4, 2619–2634. [Google Scholar] [CrossRef]
- Huo, X.-N.; Li, H.; Sun, D.-F.; Zhou, L.-D.; Li, B.-G.; Huo, X.-N.; Li, H.; Sun, D.-F.; Zhou, L.-D.; Li, B.-G. Combining Geostatistics with Moran’s I Analysis for Mapping Soil Heavy Metals in Beijing, China. Int. J. Environ. Res. Public Health 2012, 9, 995–1017. [Google Scholar] [CrossRef] [PubMed]
- Chabala, L.M.; Mulolwa, A.; Lungu, O. Application of Ordinary Kriging in Mapping Soil Organic Carbon in Zambia. Pedosphere 2017, 27, 338–343. [Google Scholar] [CrossRef]
- Gharechelou, S.; Tateishi, R.; Sharma, R.; Johnson, B. Soil Moisture Mapping in an Arid Area Using a Land Unit Area (LUA) Sampling Approach and Geostatistical Interpolation Techniques. ISPRS Int. J. Geo-Inf. 2016, 5, 35. [Google Scholar] [CrossRef]
- Jia, Z.; Zhou, S.; Su, Q.; Yi, H.; Wang, J.; Jia, Z.; Zhou, S.; Su, Q.; Yi, H.; Wang, J. Comparison Study on the Estimation of the Spatial Distribution of Regional Soil Metal(loid)s Pollution Based on Kriging Interpolation and BP Neural Network. Int. J. Environ. Res. Public Health 2017, 15, 34. [Google Scholar]
- Zhang, Z.; Sun, Y.; Yu, D.; Mao, P.; Xu, L. Influence of sampling point discretization on the regional variability of soil organic carbon in the Red Soil Region, China. Sustainability 2018, 10, 3603. [Google Scholar] [CrossRef]
- Szcześniak, M.; Piniewski, M. Improvement of Hydrological Simulations by Applying Daily Precipitation Interpolation Schemes in Meso-Scale Catchments. Water 2015, 7, 747–779. [Google Scholar] [CrossRef]
- Curtarelli, M.; Leão, J.; Ogashawara, I.; Lorenzzetti, J.; Stech, J.; Curtarelli, M.; Leão, J.; Ogashawara, I.; Lorenzzetti, J.; Stech, J. Assessment of Spatial Interpolation Methods to Map the Bathymetry of an Amazonian Hydroelectric Reservoir to Aid in Decision Making for Water Management. ISPRS Int. J. Geo-Inf. 2015, 4, 220–235. [Google Scholar] [CrossRef]
- Dysarz, T. Development of RiverBox—An ArcGIS Toolbox for River Bathymetry Reconstruction. Water 2018, 10, 1266. [Google Scholar] [CrossRef]
- Jung, S.-W.; Lee, K.; Cho, Y.-S.; Choi, J.-H.; Yang, W.; Kang, T.-S.; Park, C.; Kim, G.-B.; Yu, S.-D.; Son, B.-S.; et al. Association by Spatial Interpolation between Ozone Levels and Lung Function of Residents at an Industrial Complex in South Korea. Int. J. Environ. Res. Public Health 2016, 13, 728. [Google Scholar] [CrossRef]
- Xi, Y.; Ren, F.; Liang, S.; Zhang, J.; Lin, D.-N.; Xi, Y.; Ren, F.; Liang, S.; Zhang, J.; Lin, D.-N. Spatial Analysis of the Distribution, Risk Factors and Access to Medical Resources of Patients with Hepatitis B in Shenzhen, China. Int. J. Environ. Res. Public Health 2014, 11, 11505–11527. [Google Scholar] [CrossRef] [PubMed]
- Cressie, N. Spatial prediction and ordinary kriging. Math. Geol. 1988, 20, 405–421. [Google Scholar] [CrossRef]
- Li, J.; Heap, A.D. A review of comparative studies of spatial interpolation methods in environmental sciences: Performance and impact factors. Ecol. Inform. 2011, 6, 228–241. [Google Scholar] [CrossRef]
- Hernández-Ceballos, M.Á.; De Felice, L. Air Mass Trajectories to Estimate the “Most Likely” Areas to Be Affected by the Release of Hazardous Materials in the Atmosphere—Feasibility Study. Atmosphere 2019, 10, 253. [Google Scholar] [CrossRef]



| Interpolation Method | Voivodeships | Poviats | Municipalities |
|---|---|---|---|
| Inverse distance weighting (IDW) | 2735.33 | 226.06 | 94.42 |
| Global polynomial interpolation (GPI) | 4709.37 | 231.23 | 91.86 |
| Radial basis function (RBF) | 2813.37 | 222.06 | 94.14 |
| Local polynomial interpolation (LPI) | 3672.84 | 225.64 | 91.77 |
| Ordinary kriging (OK) | 2477.61 | 230.30 | 96.06 |
| Simple kriging (SK) | 2223.73 | 215.70 | 91.52 |
| Universal kriging (UK) | 2477.61 | 228.88 | 95.89 |
| Disjunctive kriging (DK) | 2477.61 | 217.65 | 91.64 |
| Empirical Bayesian kriging (EBK) | 2538.04 | 226.01 | 94.42 |
| Measure | Voivodeships | Poviats | Municipalities |
|---|---|---|---|
| Skewness | 0.34 | 5.50 | 17.08 |
| Kurtosis | 1.85 | 49.21 | 408.73 |
| Minimum | 2032 | 6 | 0 |
| Maximum | 9157 | 2661 | 2661 |
| Mean | 5368.10 | 226.03 | 34.675 |
| Standard deviation | 2295.40 | 231.68 | 92.358 |
| Hexagon Size | Test Layer 1 | Test Layer 2 | Test Layer 3 | Test Layer 4 | Test Layer 5 | Mean |
|---|---|---|---|---|---|---|
| 10 | 0.68 | 0.68 | 0.67 | 0.67 | 0.67 | 0.67 |
| 20 | 0.76 | 0.75 | 0.75 | 0.75 | 0.75 | 0.75 |
| 30 | 0.80 | 0.81 | 0.80 | 0.79 | 0.80 | 0.80 |
| 40 | 0.82 | 0.82 | 0.82 | 0.82 | 0.82 | 0.82 |
| 50 | 0.84 | 0.84 | 0.84 | 0.84 | 0.84 | 0.84 |
| 60 | 0.86 | 0.86 | 0.86 | 0.86 | 0.86 | 0.86 |
| 70 | 0.86 | 0.86 | 0.86 | 0.85 | 0.85 | 0.85 |
| 80 | 0.86 | 0.86 | 0.86 | 0.86 | 0.86 | 0.86 |
| 90 | 0.86 | 0.86 | 0.86 | 0.85 | 0.86 | 0.86 |
| 100 | 0.87 | 0.87 | 0.87 | 0.87 | 0.87 | 0.87 |
| 110 | 0.97 | 0.97 | 0.97 | 0.97 | 0.97 | 0.97 |
| 120 | 0.98 | 0.98 | 0.98 | 0.97 | 0.97 | 0.98 |
| 130 | 0.98 | 0.98 | 0.98 | 0.98 | 0.98 | 0.98 |
| 140 | 0.98 | 0.98 | 0.98 | 0.98 | 0.98 | 0.98 |
| 150 | 0.98 | 0.98 | 0.98 | 0.98 | 0.97 | 0.98 |
| 160 | 0.97 | 0.97 | 0.97 | 0.97 | 0.97 | 0.97 |
| 170 | 0.91 | 0.92 | 0.92 | 0.91 | 0.91 | 0.92 |
| 180 | 0.87 | 0.87 | 0.88 | 0.87 | 0.88 | 0.87 |
| 190 | 0.95 | 0.95 | 0.95 | 0.94 | 0.95 | 0.95 |
| 200 | 0.95 | 0.95 | 0.95 | 0.95 | 0.94 | 0.95 |
| 210 | 0.90 | 0.91 | 0.91 | 0.90 | 0.90 | 0.90 |
| 220 | 0.88 | 0.88 | 0.88 | 0.88 | 0.88 | 0.88 |
| 230 | 0.87 | 0.87 | 0.87 | 0.86 | 0.87 | 0.87 |
| 240 | 0.89 | 0.89 | 0.88 | 0.88 | 0.88 | 0.88 |
| 250 | 0.86 | 0.86 | 0.86 | 0.86 | 0.86 | 0.86 |
| 260 | 0.89 | 0.89 | 0.89 | 0.88 | 0.88 | 0.88 |
| 270 | 0.86 | 0.86 | 0.86 | 0.86 | 0.86 | 0.86 |
| 280 | 0.88 | 0.87 | 0.88 | 0.87 | 0.87 | 0.87 |
| 290 | 0.86 | 0.87 | 0.87 | 0.86 | 0.86 | 0.86 |
| 300 | 0.87 | 0.87 | 0.88 | 0.87 | 0.87 | 0.87 |
| Hexagon Size | Test Layer 1 | Test Layer 2 | Test Layer 3 | Test Layer 4 | Test Layer 5 | Mean |
|---|---|---|---|---|---|---|
| 110 | 0.970 | 0.972 | 0.971 | 0.971 | 0.968 | 0.970 |
| 115 | 0.979 | 0.979 | 0.981 | 0.981 | 0.980 | 0.980 |
| 120 | 0.976 | 0.976 | 0.977 | 0.974 | 0.974 | 0.975 |
| 125 | 0.978 | 0.979 | 0.978 | 0.978 | 0.977 | 0.978 |
| 130 | 0.979 | 0.981 | 0.980 | 0.980 | 0.978 | 0.980 |
| 135 | 0.983 | 0.984 | 0.983 | 0.983 | 0.982 | 0.983 |
| 140 | 0.979 | 0.980 | 0.980 | 0.979 | 0.977 | 0.979 |
| 145 | 0.979 | 0.978 | 0.979 | 0.978 | 0.977 | 0.978 |
| 150 | 0.976 | 0.975 | 0.976 | 0.977 | 0.974 | 0.976 |
| 155 | 0.962 | 0.963 | 0.960 | 0.962 | 0.960 | 0.961 |
| 160 | 0.972 | 0.972 | 0.971 | 0.971 | 0.971 | 0.971 |
| 165 | 0.971 | 0.970 | 0.972 | 0.972 | 0.971 | 0.971 |
| 170 | 0.915 | 0.918 | 0.916 | 0.912 | 0.915 | 0.915 |
| 175 | 0.880 | 0.878 | 0.879 | 0.876 | 0.878 | 0.878 |
| 180 | 0.875 | 0.871 | 0.876 | 0.870 | 0.876 | 0.874 |
| 185 | 0.933 | 0.933 | 0.932 | 0.929 | 0.929 | 0.931 |
| 190 | 0.948 | 0.950 | 0.947 | 0.944 | 0.946 | 0.947 |
| 195 | 0.898 | 0.894 | 0.899 | 0.896 | 0.897 | 0.897 |
| 200 | 0.946 | 0.947 | 0.946 | 0.945 | 0.944 | 0.946 |
| Hexagon Size | Test Layer 1 | Test Layer 2 | Test Layer 3 | Test Layer 4 | Test Layer 5 | Mean |
|---|---|---|---|---|---|---|
| 110 | 0.9699 | 0.9719 | 0.9711 | 0.9710 | 0.9685 | 0.9705 |
| 111 | 0.9689 | 0.9717 | 0.9702 | 0.9708 | 0.9681 | 0.9699 |
| 112 | 0.9717 | 0.9720 | 0.9726 | 0.9714 | 0.9705 | 0.9716 |
| 113 | 0.9802 | 0.9791 | 0.9785 | 0.9801 | 0.9799 | 0.9796 |
| 114 | 0.9762 | 0.9753 | 0.9755 | 0.9768 | 0.9742 | 0.9756 |
| 115 | 0.9795 | 0.9793 | 0.9811 | 0.9811 | 0.9795 | 0.9801 |
| 116 | 0.9809 | 0.9801 | 0.9810 | 0.9799 | 0.9786 | 0.9801 |
| 117 | 0.9779 | 0.9774 | 0.9784 | 0.9766 | 0.9766 | 0.9774 |
| 118 | 0.8564 | 0.8542 | 0.8532 | 0.8473 | 0.8514 | 0.8525 |
| 119 | 0.9793 | 0.9793 | 0.9802 | 0.9790 | 0.9777 | 0.9791 |
| 120 | 0.9761 | 0.9760 | 0.9767 | 0.9744 | 0.9738 | 0.9754 |
| 121 | 0.9780 | 0.9780 | 0.9798 | 0.9802 | 0.9769 | 0.9786 |
| 122 | 0.9778 | 0.9764 | 0.9779 | 0.9780 | 0.9746 | 0.9769 |
| 123 | 0.9815 | 0.9803 | 0.9807 | 0.9815 | 0.9785 | 0.9805 |
| 124 | 0.9804 | 0.9776 | 0.9805 | 0.9798 | 0.9774 | 0.9791 |
| 125 | 0.9783 | 0.9785 | 0.9781 | 0.9784 | 0.9772 | 0.9781 |
| 126 | 0.9795 | 0.9779 | 0.9789 | 0.9800 | 0.9777 | 0.9788 |
| 127 | 0.9805 | 0.9803 | 0.9806 | 0.9811 | 0.9789 | 0.9803 |
| 128 | 0.9827 | 0.9819 | 0.9824 | 0.9822 | 0.9811 | 0.9821 |
| 129 | 0.9820 | 0.9821 | 0.9819 | 0.9813 | 0.9801 | 0.9815 |
| 130 | 0.9792 | 0.9810 | 0.9804 | 0.9797 | 0.9779 | 0.9796 |
| 131 | 0.9778 | 0.9788 | 0.9794 | 0.9787 | 0.9769 | 0.9783 |
| 132 | 0.9822 | 0.9822 | 0.9843 | 0.9839 | 0.9821 | 0.9829 |
| 133 | 0.9787 | 0.9791 | 0.9795 | 0.9788 | 0.9779 | 0.9788 |
| 134 | 0.9811 | 0.9819 | 0.9819 | 0.9818 | 0.9808 | 0.9815 |
| 135 | 0.9829 | 0.9837 | 0.9829 | 0.9825 | 0.9823 | 0.9828 |
| 136 | 0.9770 | 0.9777 | 0.9776 | 0.9770 | 0.9766 | 0.9772 |
| 137 | 0.9769 | 0.9769 | 0.9785 | 0.9779 | 0.9767 | 0.9774 |
| 138 | 0.8902 | 0.8865 | 0.8883 | 0.8855 | 0.8873 | 0.8875 |
| 139 | 0.9620 | 0.9636 | 0.9612 | 0.9594 | 0.9606 | 0.9614 |
| 140 | 0.9788 | 0.9803 | 0.9797 | 0.9789 | 0.9772 | 0.9790 |
| 141 | 0.9754 | 0.9789 | 0.9769 | 0.9756 | 0.9748 | 0.9763 |
| 142 | 0.8726 | 0.8682 | 0.8738 | 0.8700 | 0.8718 | 0.8713 |
| 143 | 0.8780 | 0.8749 | 0.8790 | 0.8733 | 0.8760 | 0.8762 |
| 144 | 0.9730 | 0.9745 | 0.9740 | 0.9737 | 0.9725 | 0.9735 |
| 145 | 0.9792 | 0.9777 | 0.9788 | 0.9783 | 0.9769 | 0.9782 |
| 146 | 0.9797 | 0.9795 | 0.9794 | 0.9794 | 0.9772 | 0.9790 |
| 147 | 0.9774 | 0.9784 | 0.9773 | 0.9777 | 0.9762 | 0.9774 |
| 148 | 0.9665 | 0.9686 | 0.9665 | 0.9664 | 0.9647 | 0.9665 |
| 149 | 0.9612 | 0.9619 | 0.9600 | 0.9595 | 0.9586 | 0.9602 |
| 150 | 0.9756 | 0.9753 | 0.9757 | 0.9767 | 0.9744 | 0.9755 |
| 151 | 0.9788 | 0.9777 | 0.9784 | 0.9790 | 0.9760 | 0.9780 |
| 152 | 0.9782 | 0.9781 | 0.9783 | 0.9791 | 0.9759 | 0.9779 |
| 153 | 0.9775 | 0.9771 | 0.9769 | 0.9778 | 0.9766 | 0.9772 |
| 154 | 0.9674 | 0.9685 | 0.9659 | 0.9679 | 0.9667 | 0.9673 |
| 155 | 0.9617 | 0.9628 | 0.9602 | 0.9616 | 0.9604 | 0.9613 |
| 156 | 0.9747 | 0.9748 | 0.9754 | 0.9744 | 0.9737 | 0.9746 |
| 157 | 0.9752 | 0.9748 | 0.9753 | 0.9759 | 0.9749 | 0.9752 |
| 158 | 0.9764 | 0.9752 | 0.9754 | 0.9765 | 0.9752 | 0.9757 |
| 159 | 0.9776 | 0.9766 | 0.9765 | 0.9773 | 0.9767 | 0.9769 |
| 160 | 0.9716 | 0.9722 | 0.9712 | 0.9714 | 0.9706 | 0.9714 |
| 161 | 0.9630 | 0.9641 | 0.9630 | 0.9638 | 0.9619 | 0.9632 |
| 162 | 0.9575 | 0.9570 | 0.9563 | 0.9569 | 0.9564 | 0.9568 |
| 163 | 0.9700 | 0.9699 | 0.9715 | 0.9692 | 0.9694 | 0.9700 |
| 164 | 0.9736 | 0.9726 | 0.9745 | 0.9729 | 0.9723 | 0.9732 |
| 165 | 0.9713 | 0.9704 | 0.9724 | 0.9723 | 0.9710 | 0.9715 |
© 2019 by the authors. Licensee MDPI, Basel, Switzerland. This article is an open access article distributed under the terms and conditions of the Creative Commons Attribution (CC BY) license (http://creativecommons.org/licenses/by/4.0/).
Share and Cite
Ciski, M.; Rząsa, K.; Ogryzek, M. Use of GIS Tools in Sustainable Heritage Management—The Importance of Data Generalization in Spatial Modeling. Sustainability 2019, 11, 5616. https://doi.org/10.3390/su11205616
Ciski M, Rząsa K, Ogryzek M. Use of GIS Tools in Sustainable Heritage Management—The Importance of Data Generalization in Spatial Modeling. Sustainability. 2019; 11(20):5616. https://doi.org/10.3390/su11205616
Chicago/Turabian StyleCiski, Mateusz, Krzysztof Rząsa, and Marek Ogryzek. 2019. "Use of GIS Tools in Sustainable Heritage Management—The Importance of Data Generalization in Spatial Modeling" Sustainability 11, no. 20: 5616. https://doi.org/10.3390/su11205616
APA StyleCiski, M., Rząsa, K., & Ogryzek, M. (2019). Use of GIS Tools in Sustainable Heritage Management—The Importance of Data Generalization in Spatial Modeling. Sustainability, 11(20), 5616. https://doi.org/10.3390/su11205616


