3.1.1. Distributions of Total Nutrient Elements and Ratio of Nutrient Elements in Sediments
The overall distribution of nutrient elements in sediments of the upper reaches of Minjiang River is shown in
Table 2. The contents of TOC, TN and TP in sediment of the upper reaches were 1.11–3.05%, 643.28–2427.82 mg·kg
−1 and 190.09–722.60 mg·kg
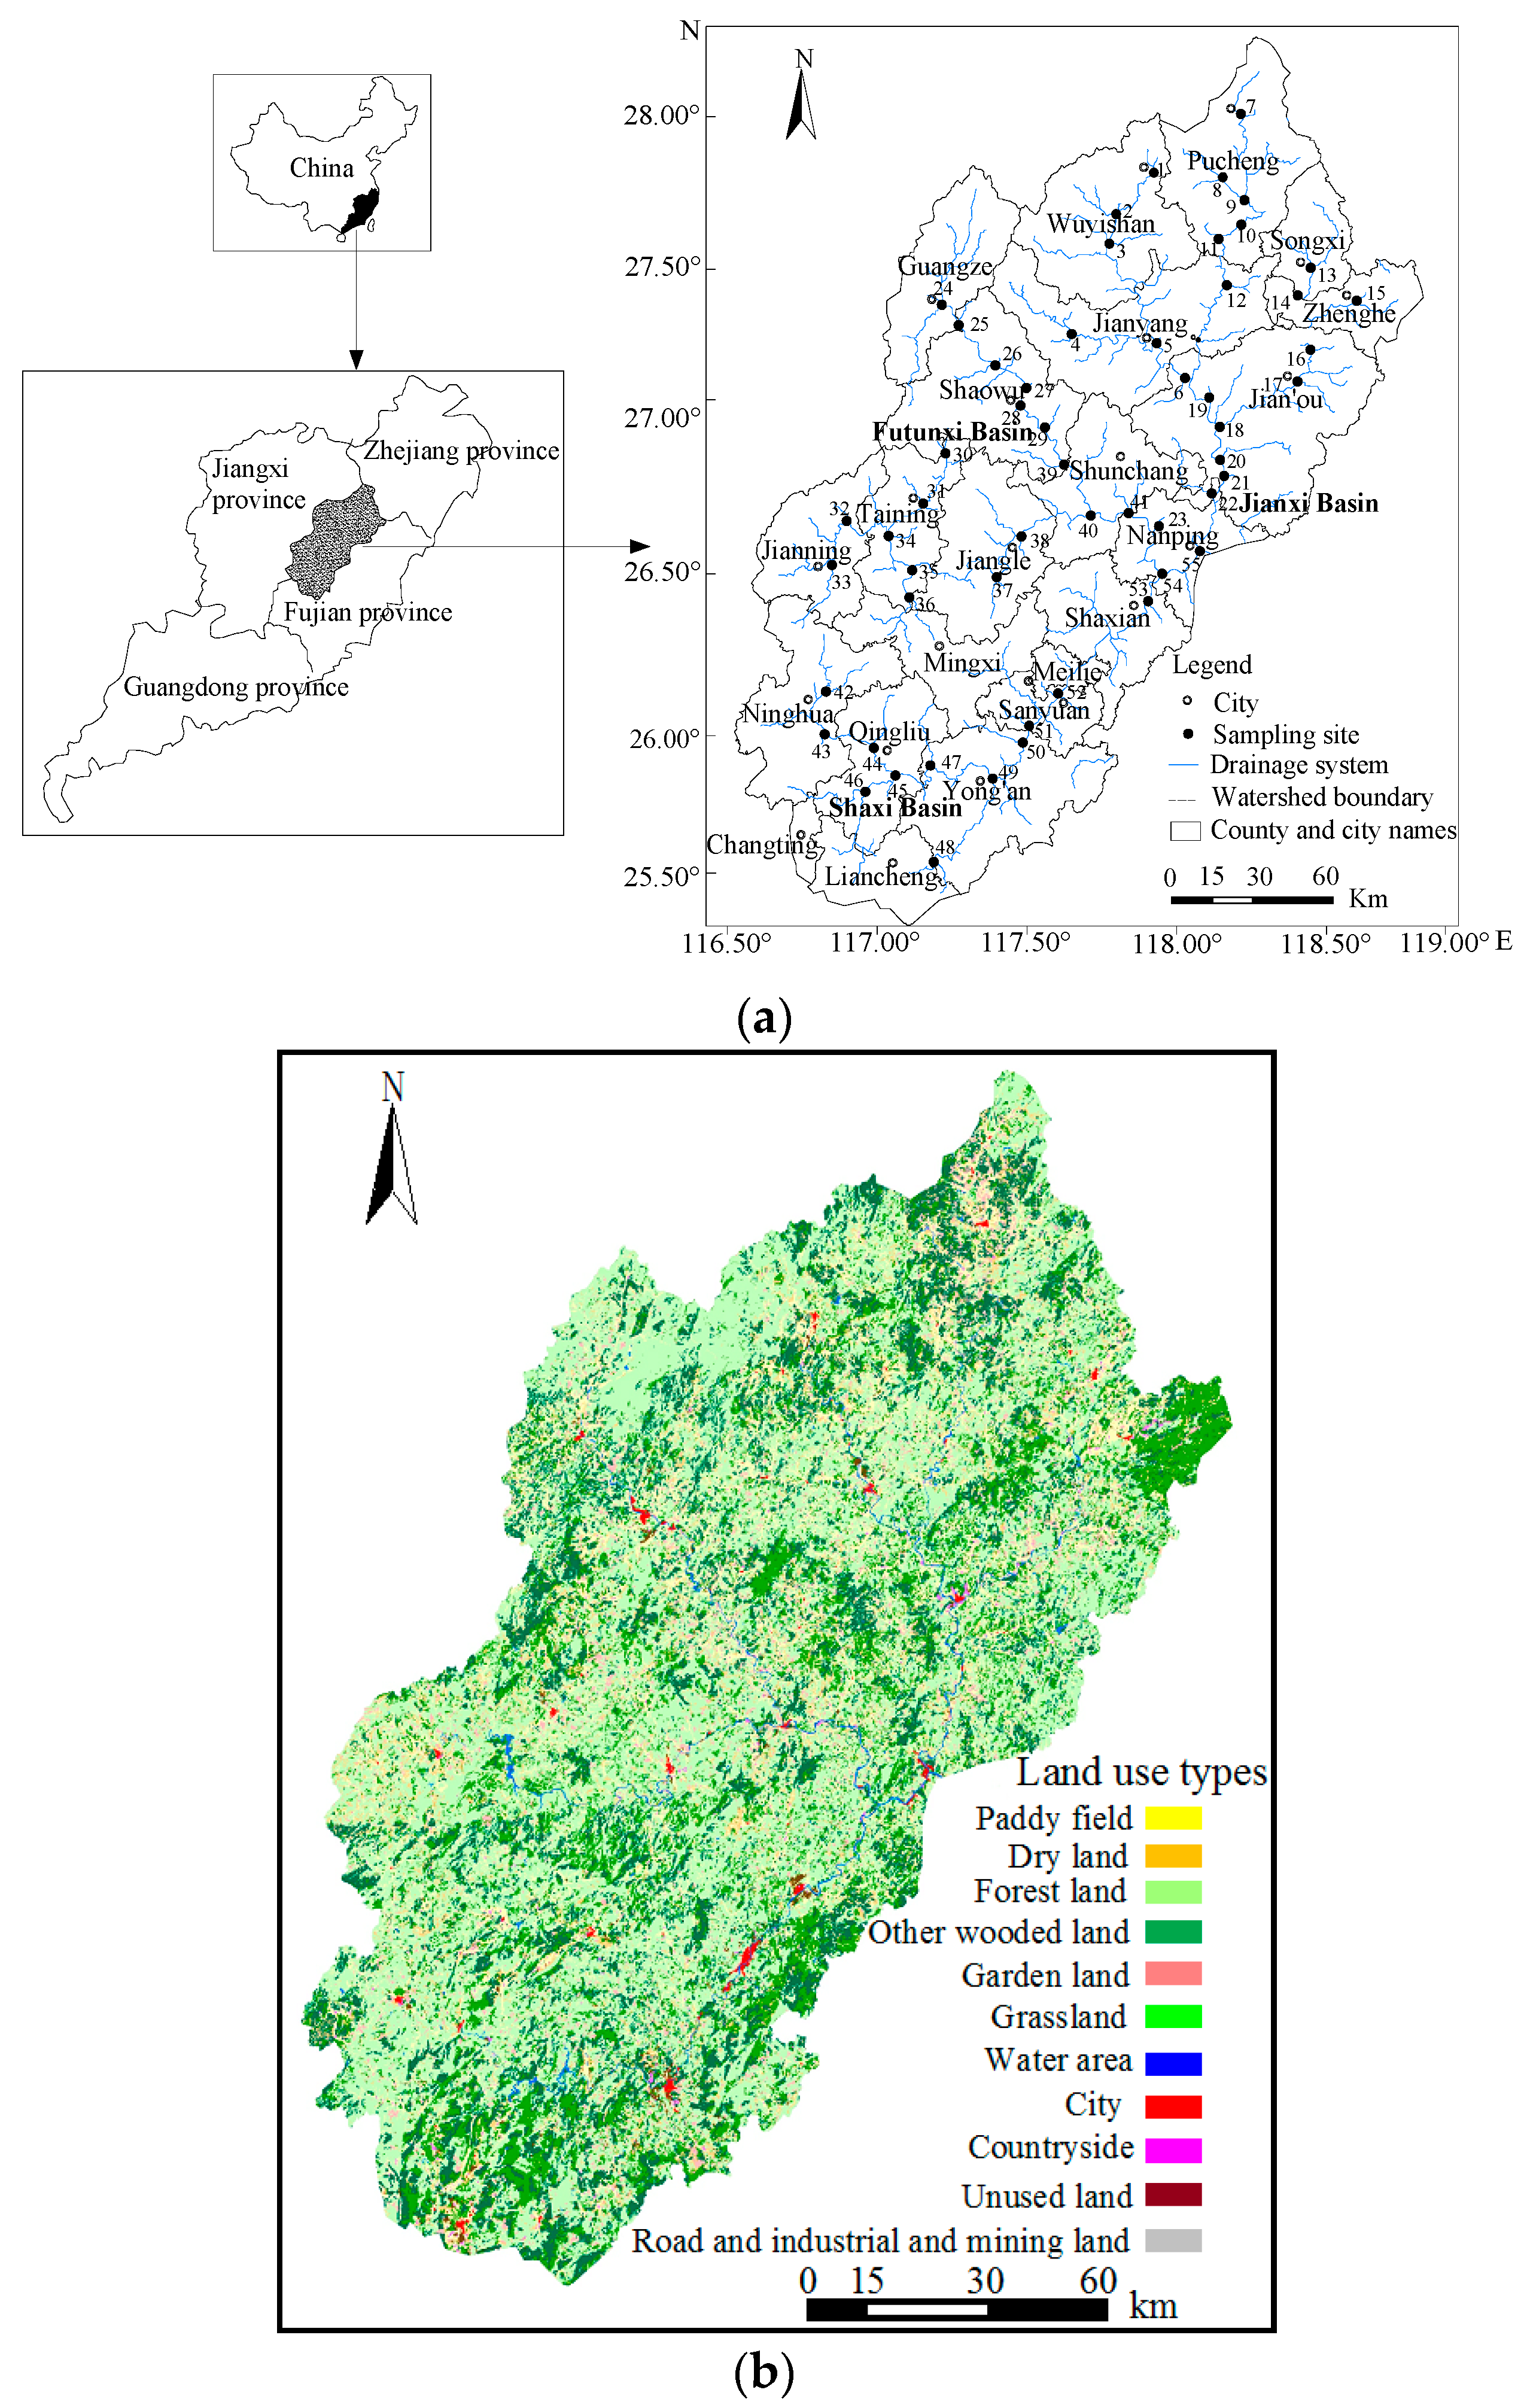
−1, respectively. From the distribution results, the mean value of TOC in the sediments was in the order of high to low in the following sub-watersheds: Jianxi Basin > Shaxi Basin > Futunxi Basin. Similarly, the orders of sub-watersheds for the mean value of TN and TP contents were Futunxi Basin > Shaxi Basin > Jianxi Basin and Shaxi Basin > Futunxi Basin > Jianxi Basin, respectively. The difference in the contents of the same element in the sediments from the three basins indicated the variation of element accumulation origin among the basins. Meanwhile, the difference in the content among different elements can reflect the distinction of the main element sources in the basin. Indeed, the distributions of nutrient elements are related to the geological background, geographical environment, land use, human activities and water conditions [
22,
23].
Previous studies have shown that the ratios of nutrient elements in sediments can reflect the geochemical behaviors of elements, the environment and the internal and external pollution sources [
9]. Specifically, the TOC/TN ratio is widely used to identify the potential sources of organic matters and the variations between species. The TOC/TP ratio reflects the decomposition rate of organic carbon and phosphorus compounds in sediments to a certain extent [
7]. The TN/TP ratio reflects the dynamic processes of the accumulation, deposition and release of nitrogen and phosphorus in water [
5,
7]. If TOC/TN > 10, the organic matter is primarily from land sources; if TOC/TN = 10, the internal and external organic matters are basically in equilibrium; if TOC/TN < 10, the organic matter is primarily from water bodies [
5,
7].
From
Table 3, in the upper reaches of the Minjiang River, the TOC/TN ratios in sediments ranged from 6.39 to 32.30. In addition, the average TOC/TN ratios of sediments in Jianxi, Futunxi and Shaxi Basins were 17.78, 12.23 and 14.27, respectively. The TOC/TN ratios of sediments in the upper reaches of the Minjiang River were higher than the TOC/TN ratio in the wetland soils (ranged 8.0–15.5 with an average of 11.7), the TOC/TN ratio in the sediments in the lower reaches of Minjiang River (ranged 10.3–13.2 with the average of 11.9) [
7], and the average TOC/TN ratio in China (11.9) [
24]. Due to the high forest coverage (more than 75%), large rainfall and terrain gradient in the upper reaches of the Minjiang River, plant litter and debris in this area are readily flushed into the river during soil erosion. Therefore, the TOC accumulation and TOC/TN ratio in sediments in the upper reaches of the Minjiang River are positively related to the organic components from terrestrial sources [
9].
The TOC/TP ratios in sediments in the upper reaches of the Minjiang River ranged from 16.58 to 103.39. The average values of the TOC/TP ratios in the Jianxi, Futunxi and Shaxi Basins were 45.97, 33.22 and 36.57, respectively, which were significantly higher than that in the wetland soils in the Minjiang Estuary (which ranged from 16.0 to 56.1, with an average of 27.4) [
7]. On the one hand, the spatial variations of nutrient element ratios in sediments in the upstream basin are relatively large. On the other hand, land use in the upstream basin has a significant impact on the spatial variations of nutrient element ratios, because compared with the downstream basin, the upstream basin has higher forest land coverage and lower urbanization. Therefore, the accumulation of TOC in the upstream watershed dominates the TOC/TP ratio.
The TN/TP ratios in sediments in the upper reaches of Minjiang River ranged from 1.22 to 5.12, and the average values in the Jianxi, Futunxi and Shaxi Basins were 2.67, 2.93 and 2.55, respectively. In addition, the TN/TP ratio in sediments in the upper reaches was higher than that of wetland soils in the Minjiang Estuary (this ranged from 1.5 to 4.2 with an average of 2.3) [
7]. This phenomenon was related to the severe farmland pollution in the upstream basin and the severe municipal pollution in the downstream basin [
15].
3.1.2. Spatial Distribution of Nitrogen in Sediments
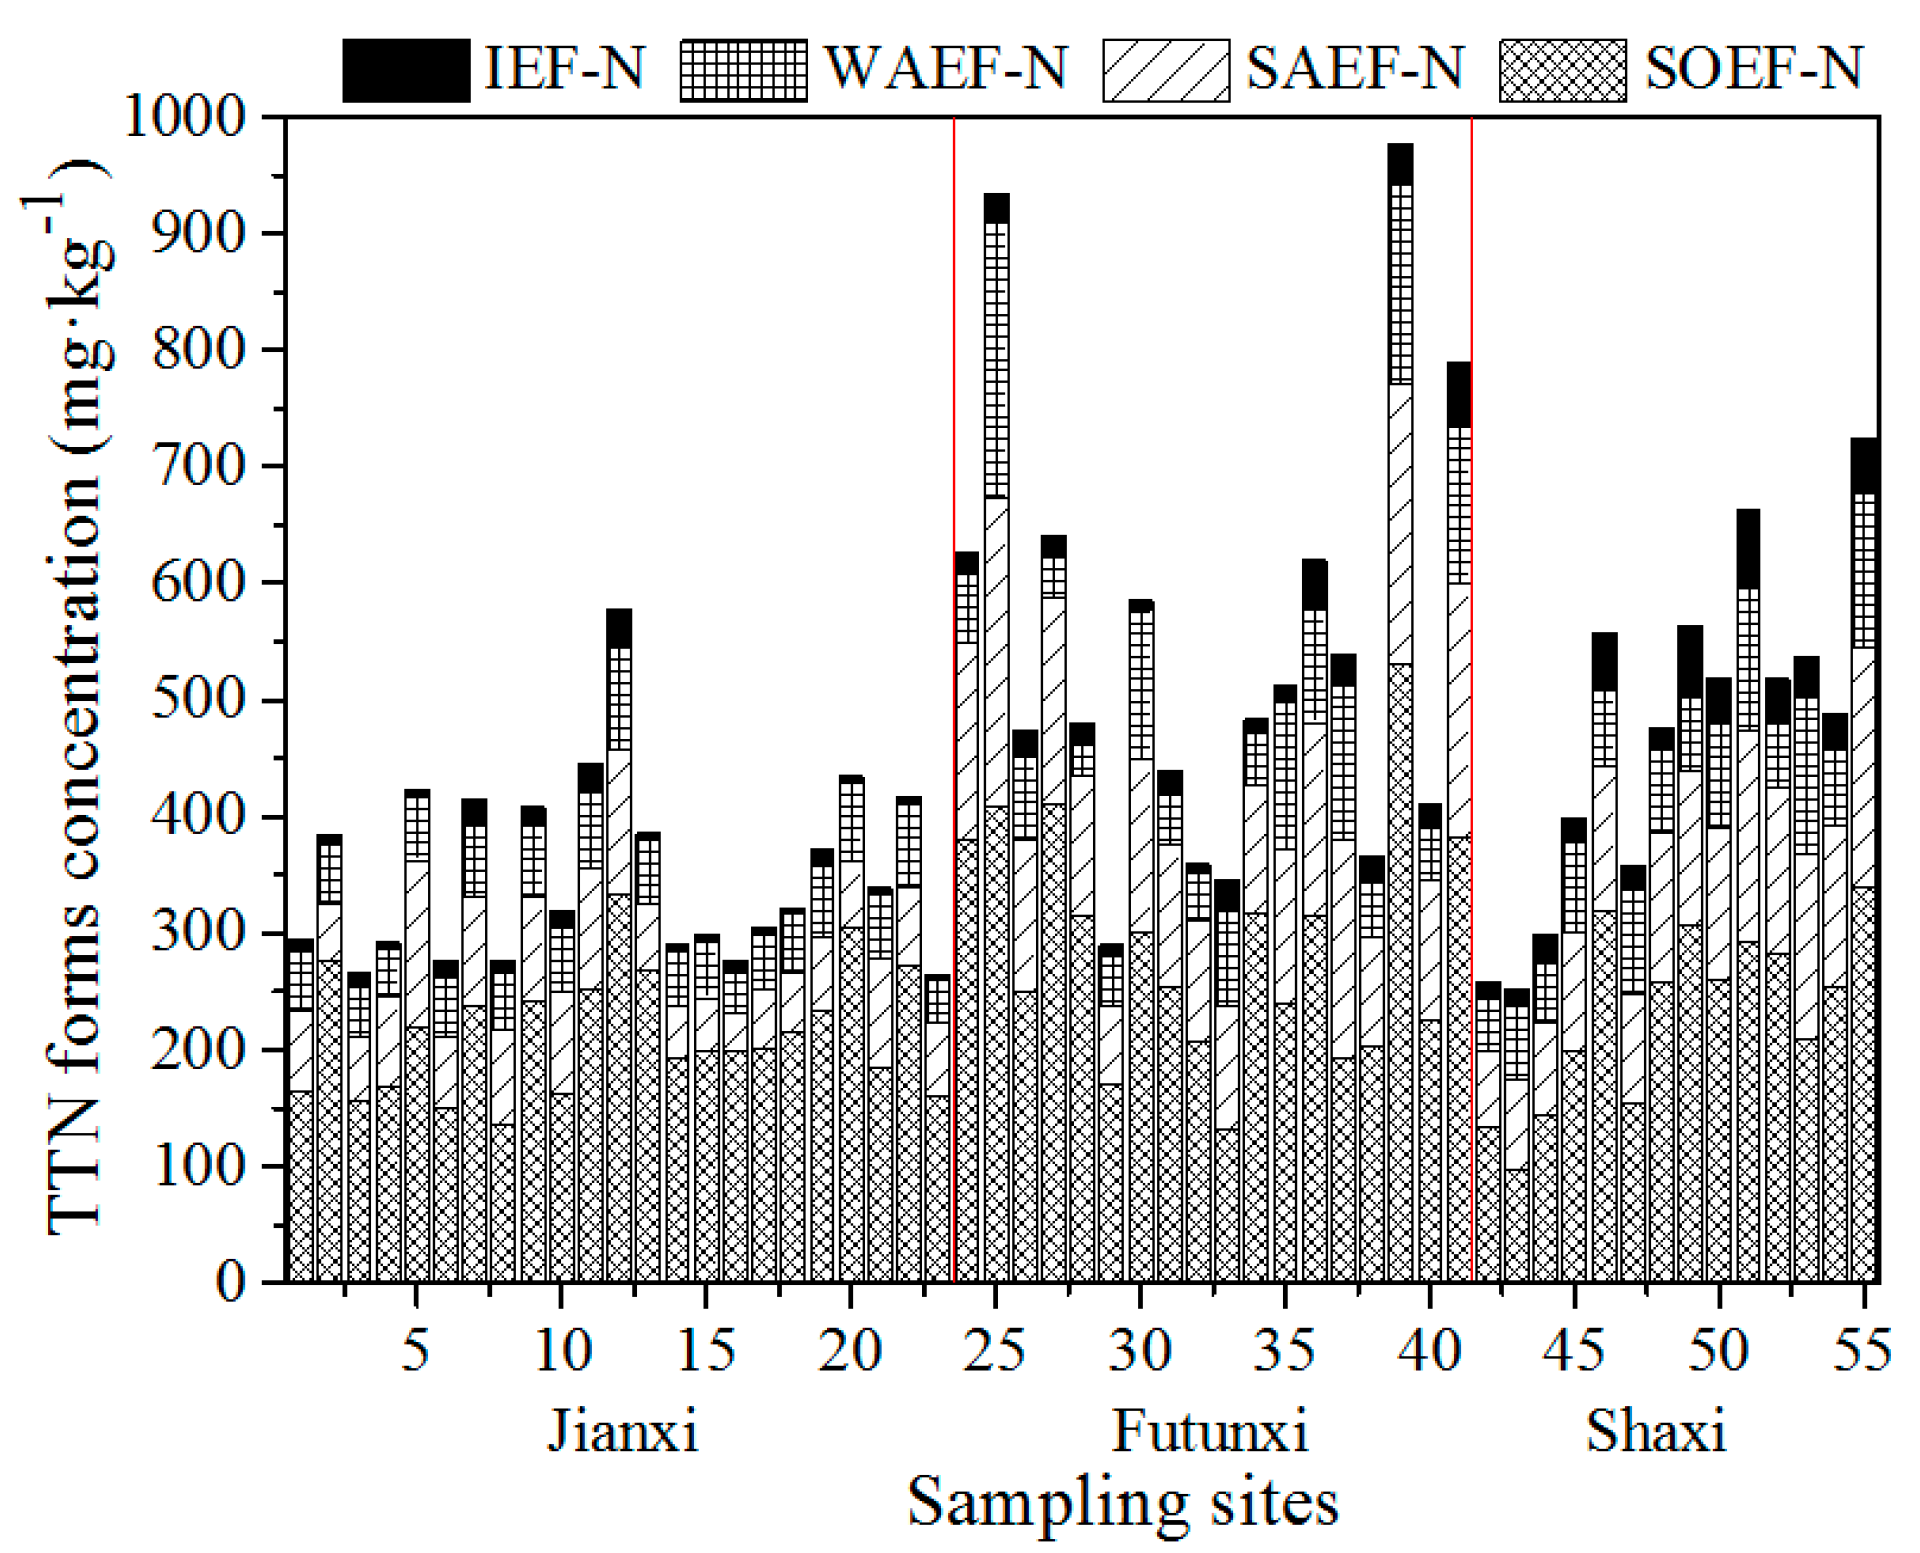
The distribution of bioavailable nitrogen in sediments in the upper reaches of the Minjiang River is shown in
Figure 3. As observed, the spatial distribution and concentration of nitrogen varied significantly among different sediments. The TTN concentration ranged from 251.18 to 976.59 mg·kg
−1, accounting for 22.18% to 55.49% of TN content.
The maximum TTN concentration was observed in Samples No. 25 and No. 39. Sample No. 25 was located in the suburb of Guangze County in the upper reaches of the Futunxi River. The sampling site was close to residential areas, thus untreated discharges of livestock and poultry manure, domestic refuse and domestic sewage were found in the sample. Sample No. 39 was located in the suburb of Shunchang County in the lower reaches of the Futunxi River. The sampling site was close to farmland, houses, sand quarries and wastewater. The minimum TTN concentration was observed in Samples No. 42 and No. 43, both of which were collected in the suburb of Ninghua County in the upper reaches of the Shaxi River Basin. Both sampling sites were close to farmland and woodland. From the results, the intensity of land use and human activities had a significant effect on the the accumulation of TTN in sediments [
12,
18].
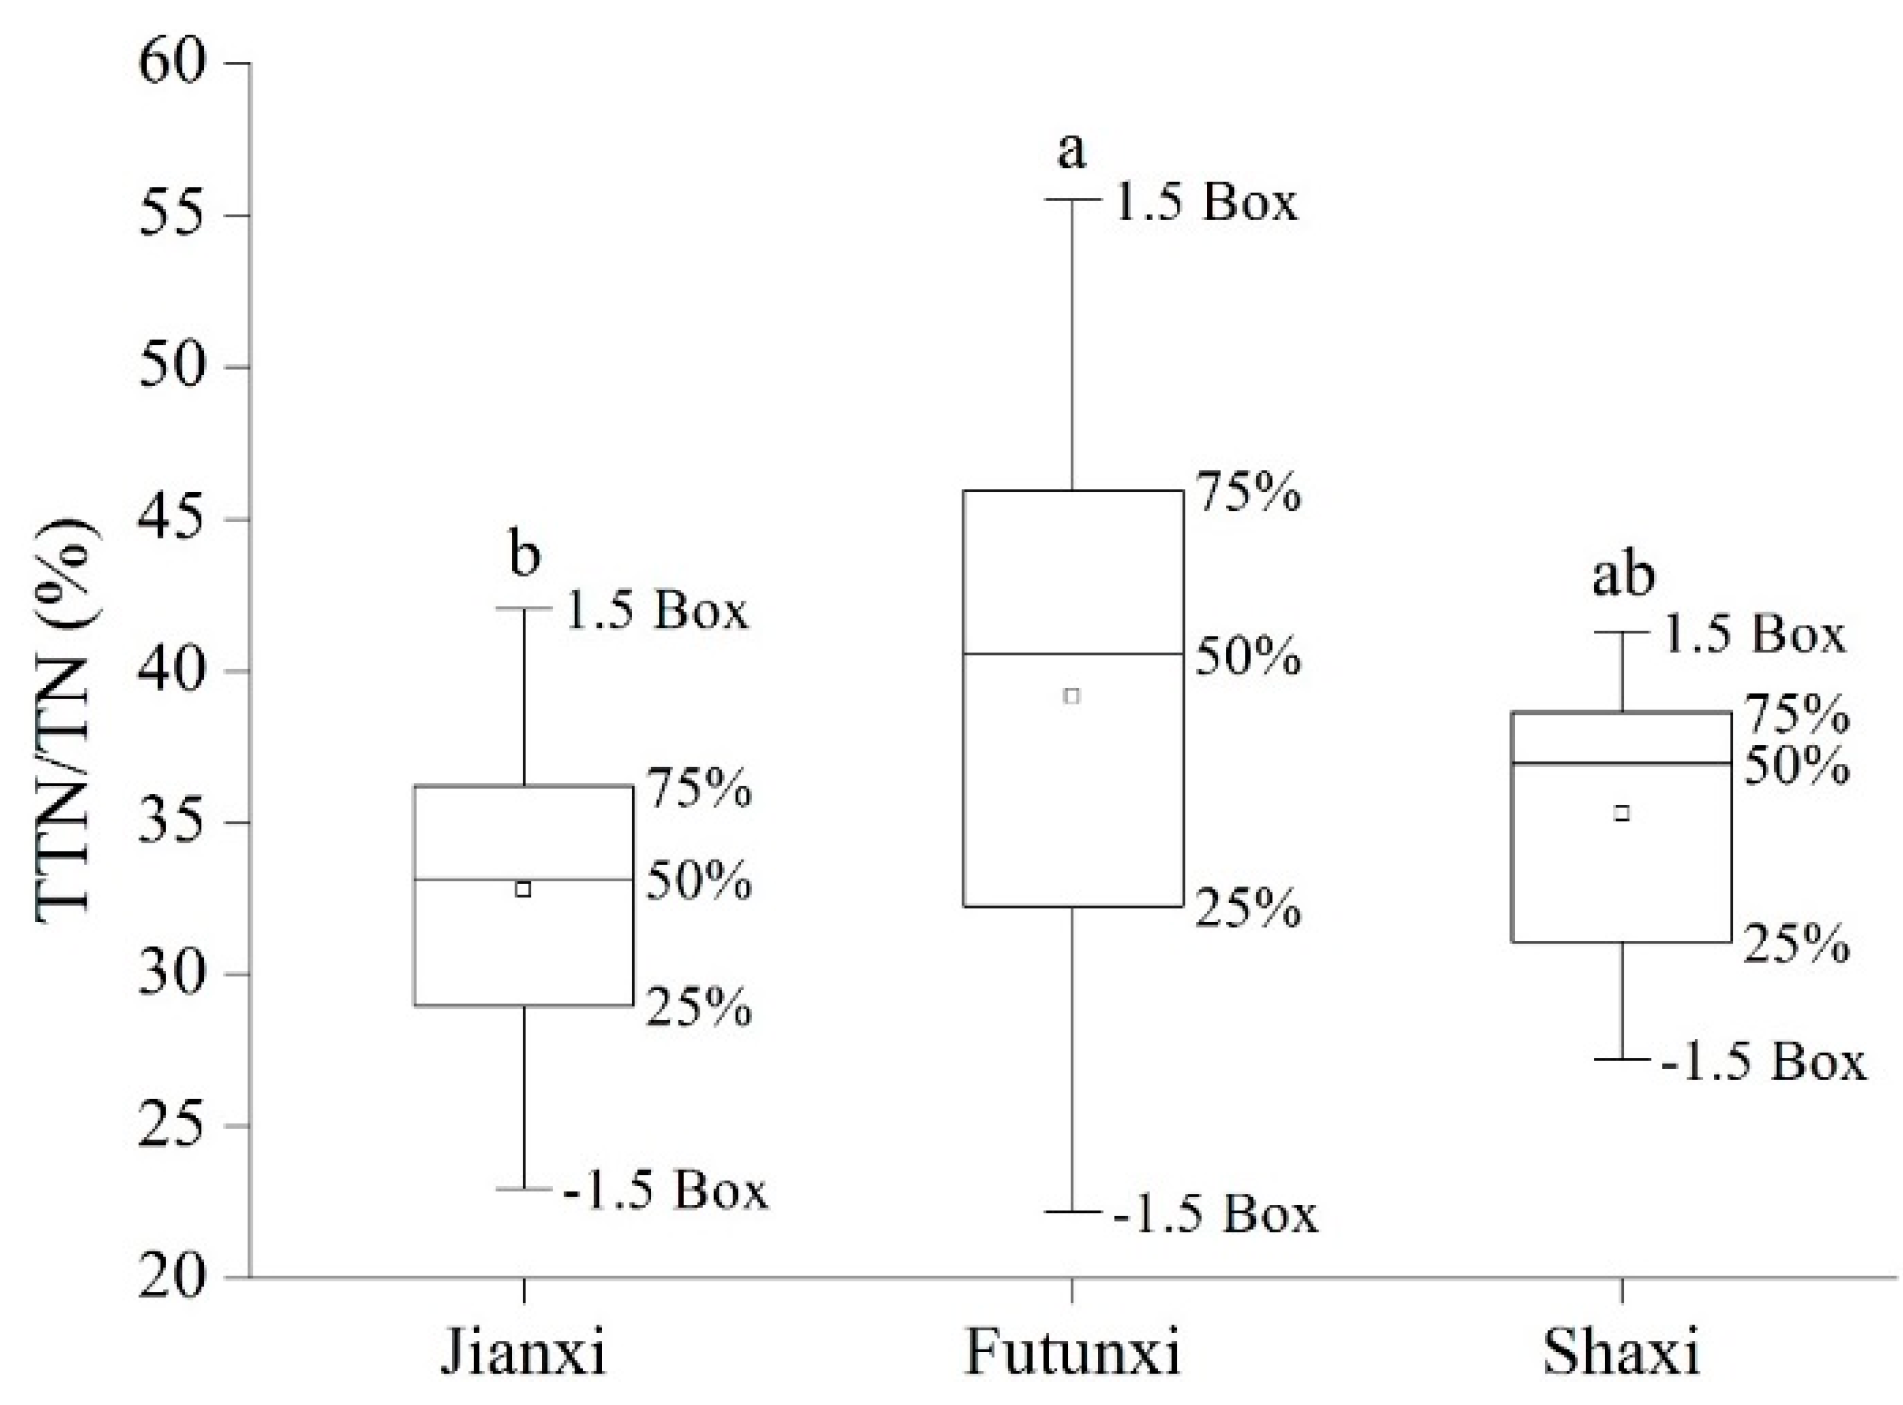
In order to further investigate the distribution of nitrogen forms, the distributions of TTN in sediments in the three sub-basins are summarized in
Figure 4 and
Figure 5. The average TTN/TN ratio in Futunxi (39.15%) was slightly higher than that in the Jianxi (32.76%) and the Shaxi (35.26%). Meanwhile, the TTN concentration in sediments in the Futunxi Basin (548.18 mg·kg
−1) was higher than that of the Jianxi (351.19 mg·kg
−1) and Shaxi (472.19 mg·kg
−1) Basins. Therefore, the biological availability of nitrogen was maximum in the sediments in the Futunxi Basin.
The average concentrations of IEF-N in sediments in the Jianxi, Futunxi and Shaxi Basins were 10.31 mg·kg
−1, 21.76 mg·kg
−1 and 33.94 mg·kg
−1, respectively. Meanwhile, the IEF-N/TTN ratios in the Jianxi, Futunxi and Shaxi Basins were 2.85%, 4.01% and 6.93%, respectively. Both the IEF-N concentrations and IEF-N/TTN ratios were sorted from high to low in the following areas: Shaxi > Futunxi > Jianxi. Previous studies have shown that IEF-N in sediments may be an indicator of nitrogen mobilities and their availability for plant uptake [
12,
18]. Indeed, IEF-N accounted for over 50% of nitrogen released from the sediment to water [
25]. Therefore, nitrogen in sediments was readily released in the Shaxi River Basin.
WAEF is carbonate-bound nitrogen, and its release capacity is only inferior to that of IEF-N. The production and distribution of WAEF are mainly affected by the carbonate content and pH of soil [
18]. In an acidic environment (low pH), WAEF is readily transferred from sediment to interstitial water, resulting in a decreased content in the sediment. The WAEF-N/TTN ratios in these Jianxi, Futunxi and Shaxi sediments were 15.59%, 15.35% and 17.58%, respectively. Therefore, the distribution of the WAEF-N/TTN ratio was relatively stable.
SAEF-N, also known as ferromanganese oxidized nitrogen, is primarily Fe/Mn oxides-bound nitrogen. The content and distribution of SAEF-N are mainly related to the redox potential and the content of metal minerals in the deposition environment. Under reduction conditions, SAEF-N is readily released from the sediments in the interstitial water [
12]. In addition, the SAEF-N/TTN ratios in sediments (average = 20.60–27.15% in each basin) were significantly larger than that in the first two components. The contents of SAEF-N in sub-basins ranged from 72.33 to 148.64 mg·kg
−1.
SOEF-N is organic sulfide-bound nitrogen, in which nitrogen is primarily bound to non-degradable macromolecule organic matter or sulfide. SOEF-N exhibits stable properties [
25]. Previous studies have shown that SOEF-N has the minimum TTN strength but high concentrations. The contribution of SOEF-N to the release of nitrogen from the sediment to the water body is only inferior to that of IEF-N [
12,
18,
25]. The concentrations of SOEF-N in sediments were ordered from high to low as follows: Futunxi (290.70 mg·kg
−1) > Shaxi (232.20 mg·kg
−1) > Jianxi (214.17 mg·kg
−1). In addition, the SOEF-N/TTN ratio was ordered from high to low as follows: Jianxi (60.96%) > Futunxi (53.49%) > Shaxi (48.91%).
In summary, the concentrations of the bioavailable nitrogen contents in sediments in the upper reaches of the Minjiang River were in the order of SOEF-N > SAEF-N > WAEF-N > IEF-N. Among them, the content of SOEF-N was above 50% of the total bioavailable nitrogen, and considered as the dominant component of bioavailable nitrogen.
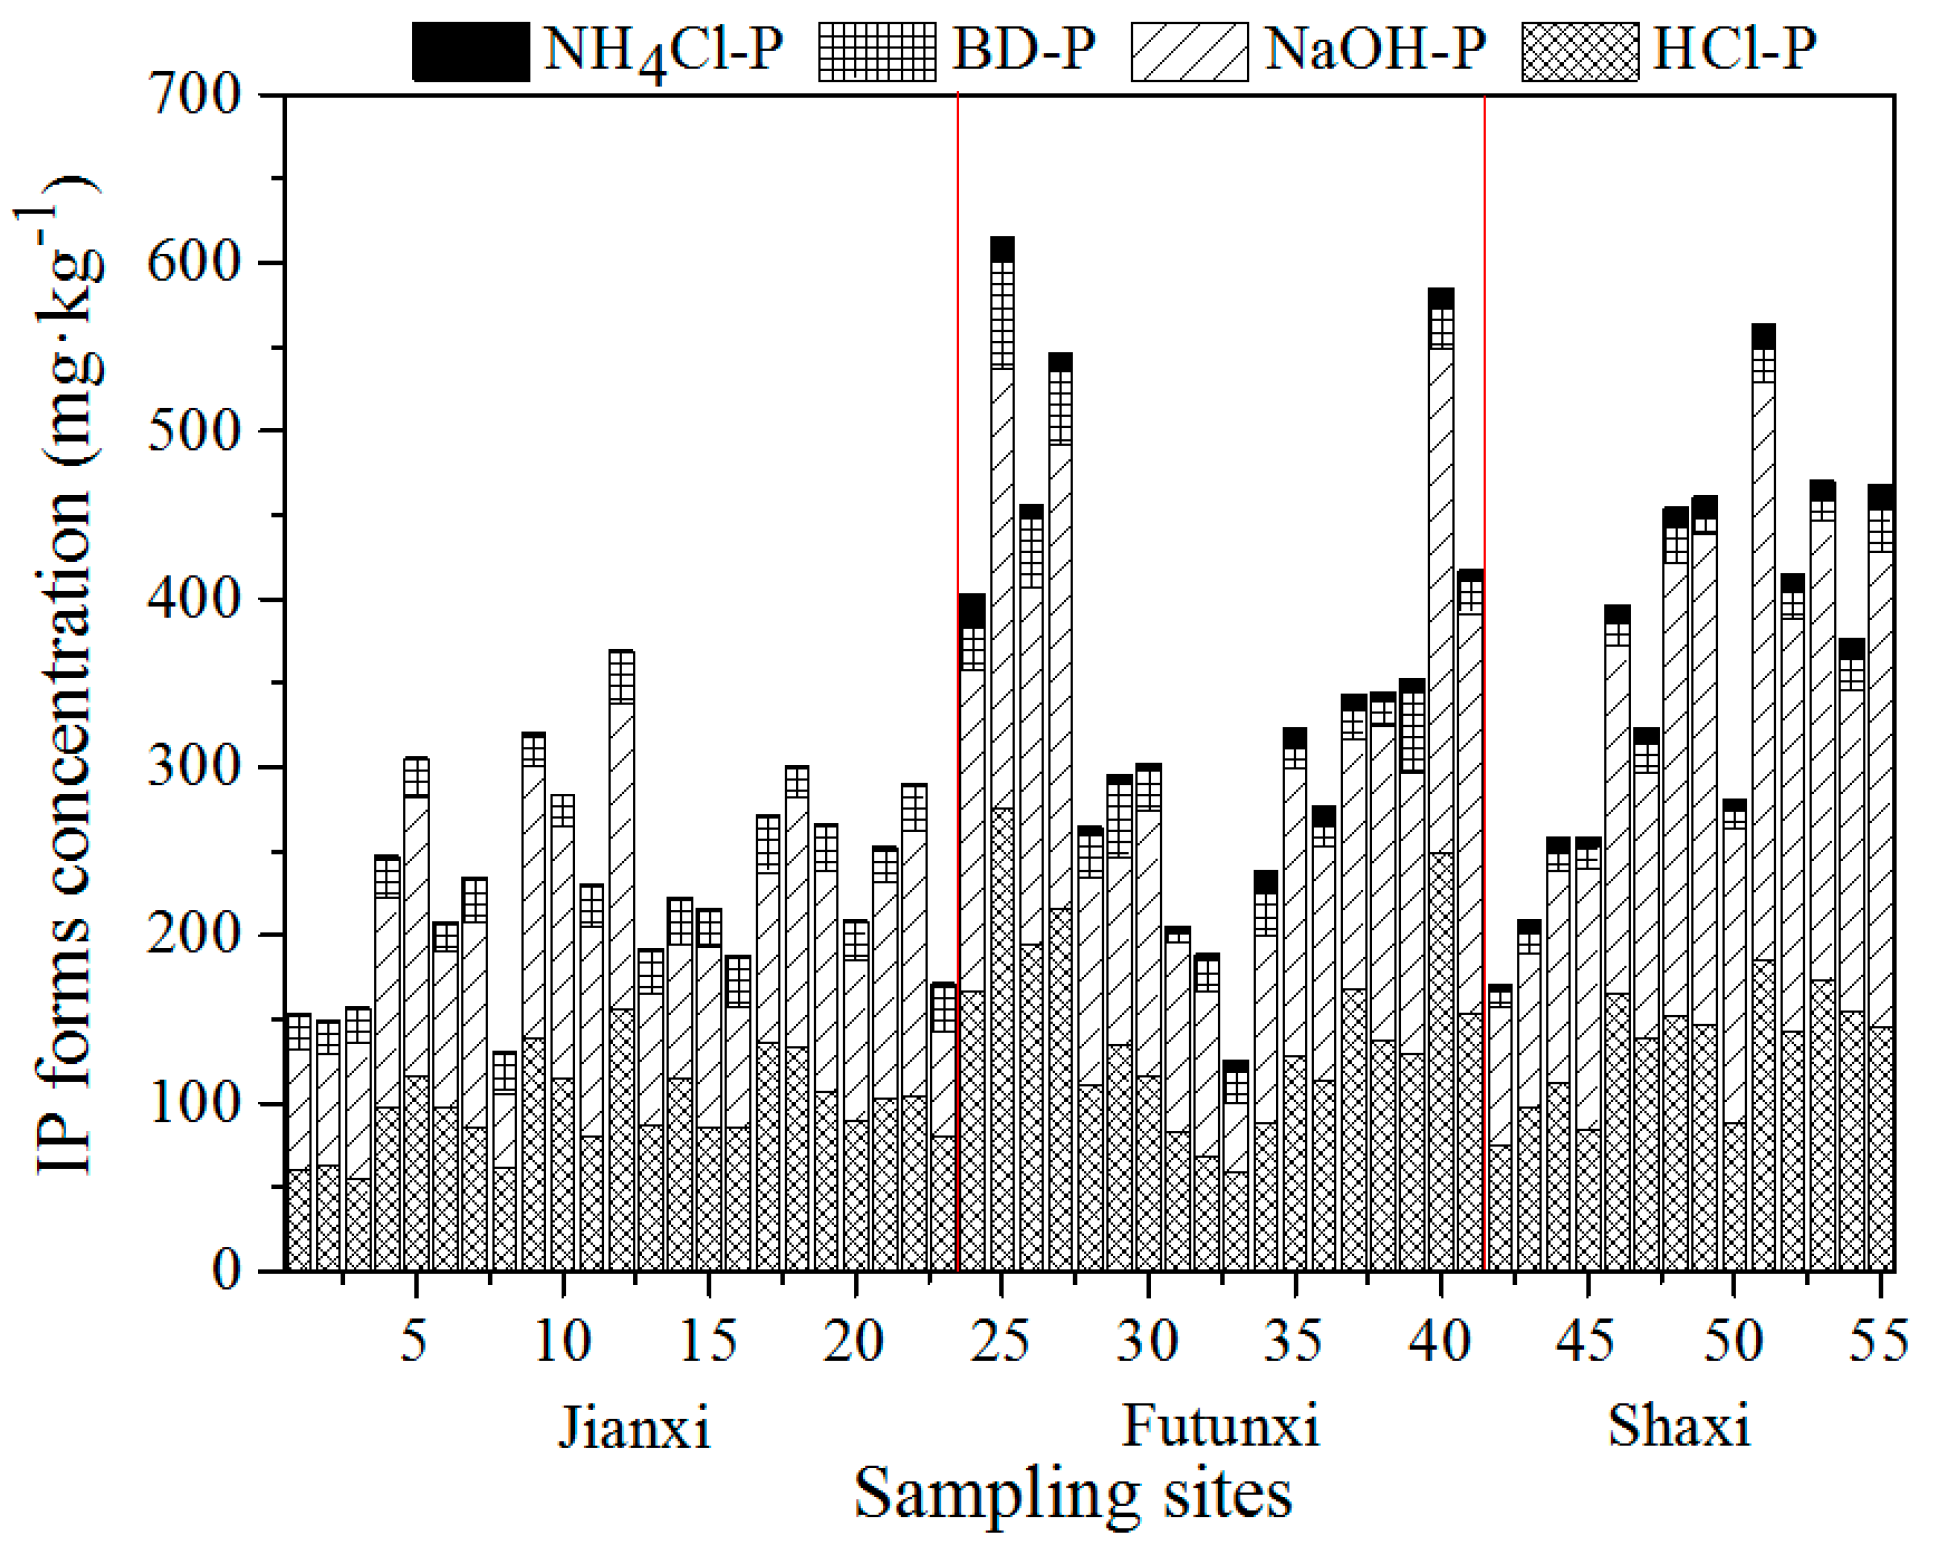
The composition of inorganic phosphorus (IP) in the sediments of the upper reaches of the Minjiang River is shown in
Figure 6. As observed, the composition and concentration distributions of phosphorus were highly heterogeneous among different sediments. The overall IP concentration ranged from 125.81 mg·kg
−1 to 615.40 mg·kg
−1, accounting for 42.80% to 89.26% of the overall TP content.
Among all samples, Samples No. 25 and No. 40, which were located in the suburb of Guangze County and Shunchang County, respectively, had the highest IP concentrations. These areas consisted of forestland, farmland, bamboo forest and residential areas. Samples No. 33 and No. 42, which were located near woodland and grassland and weaker human activities in Jianning County and Ninghua Country, respectively, had the lowest IP concentrations. These results further illustrate that land use type had a significant effect upon the accumulation of IP in sediments in the River Basin. Indeed, the IP accumulation in these sediments is positively related to human activities [
13,
19].
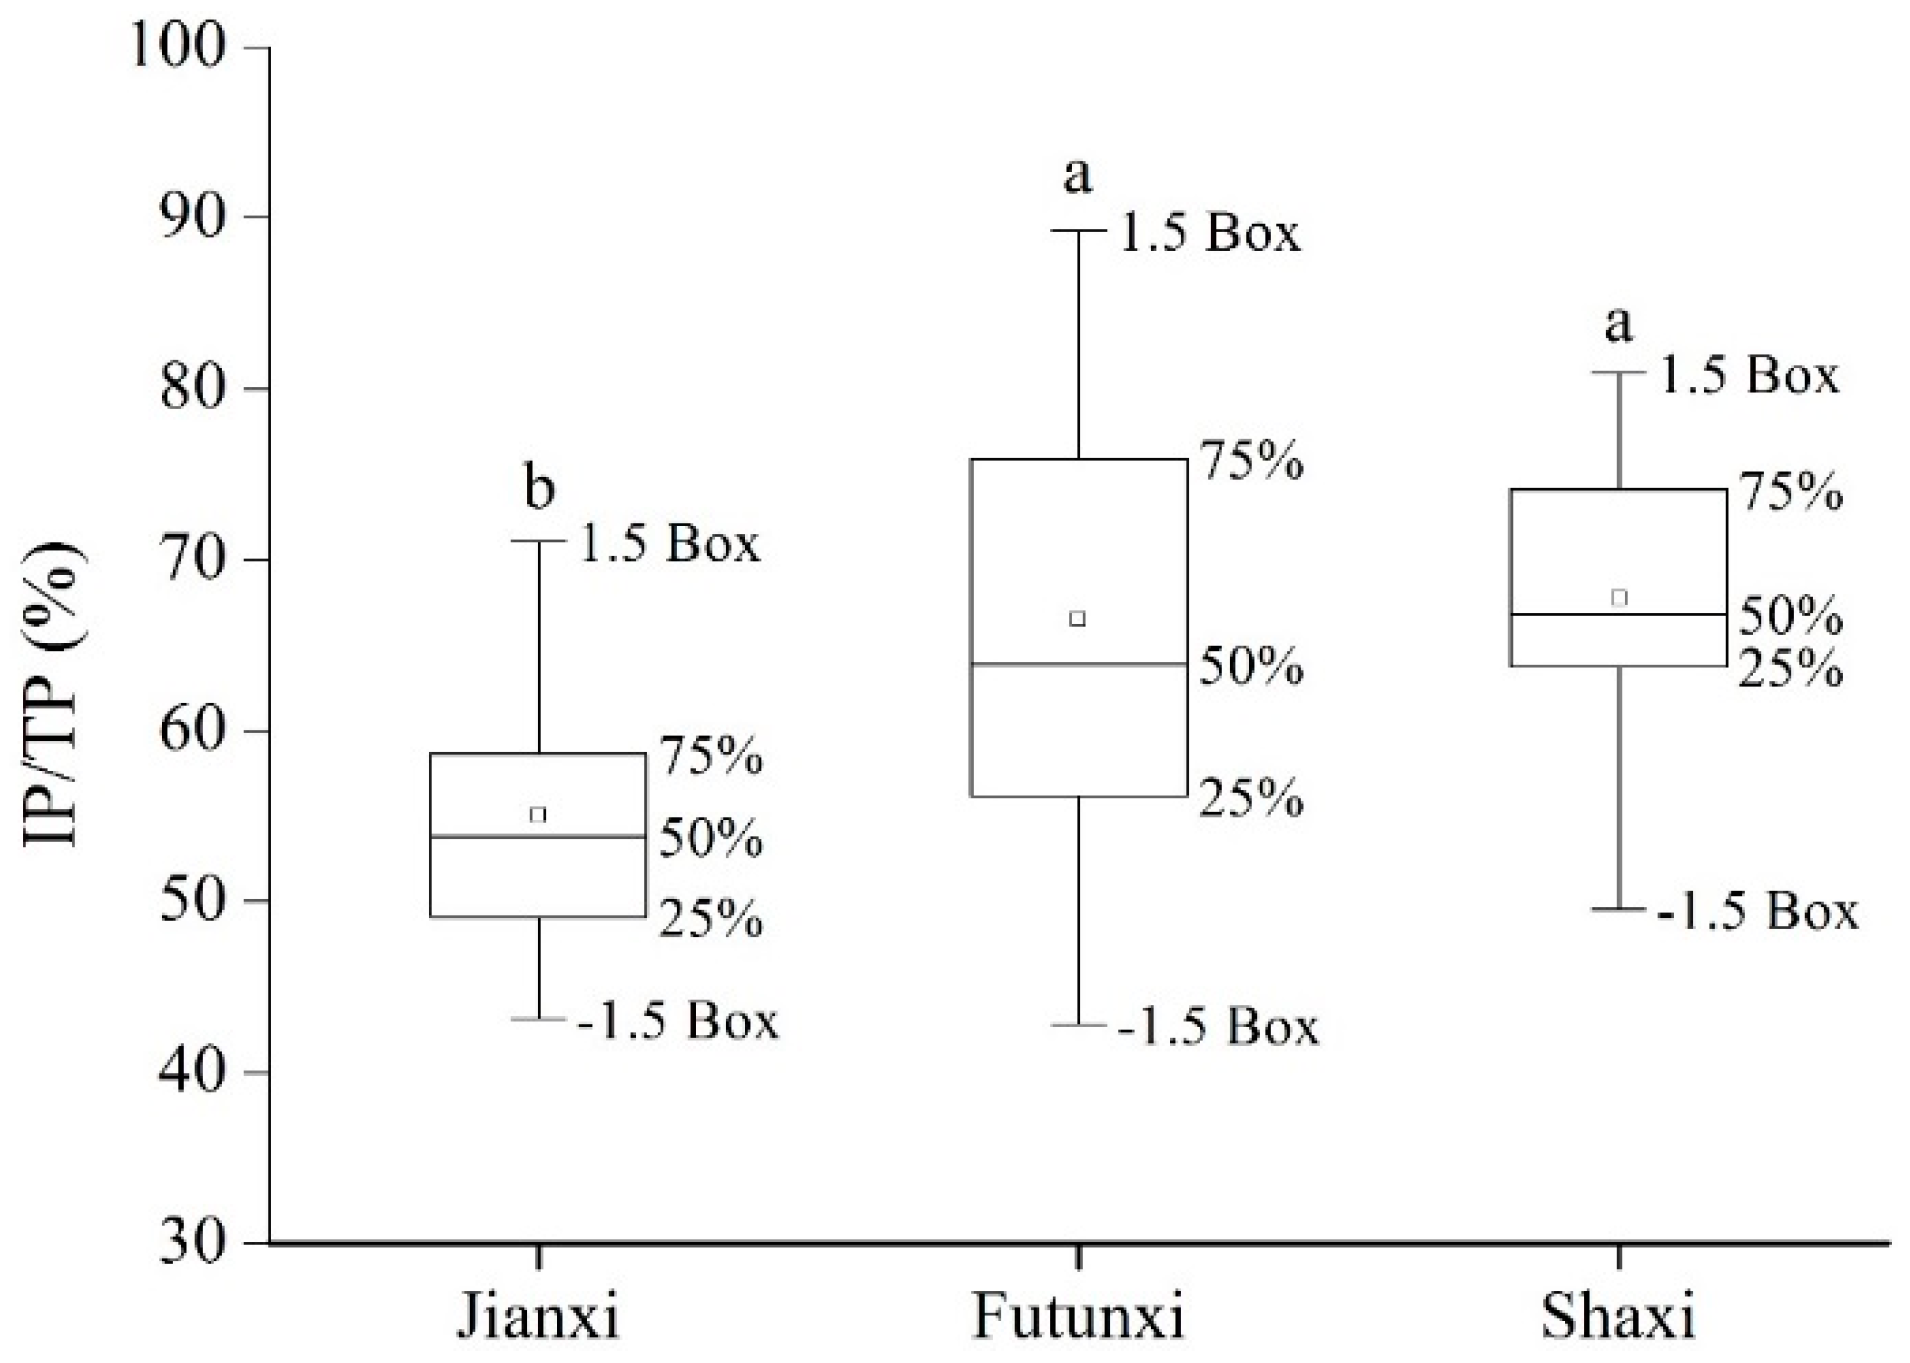
The IP/TP ratios (
Figure 7) of the sediments in Jianxi, Futunxi and Shaxi were 55.06%, 66.53% and 67.75%, respectively. Meanwhile, the concentrations of IP (
Figure 8) in these same sediments in Jianxi, Futunxi and Shaxi were 233.42 mg·kg
−1, 349.00 mg·kg
−1 and 364.54 mg·kg
−1, respectively.
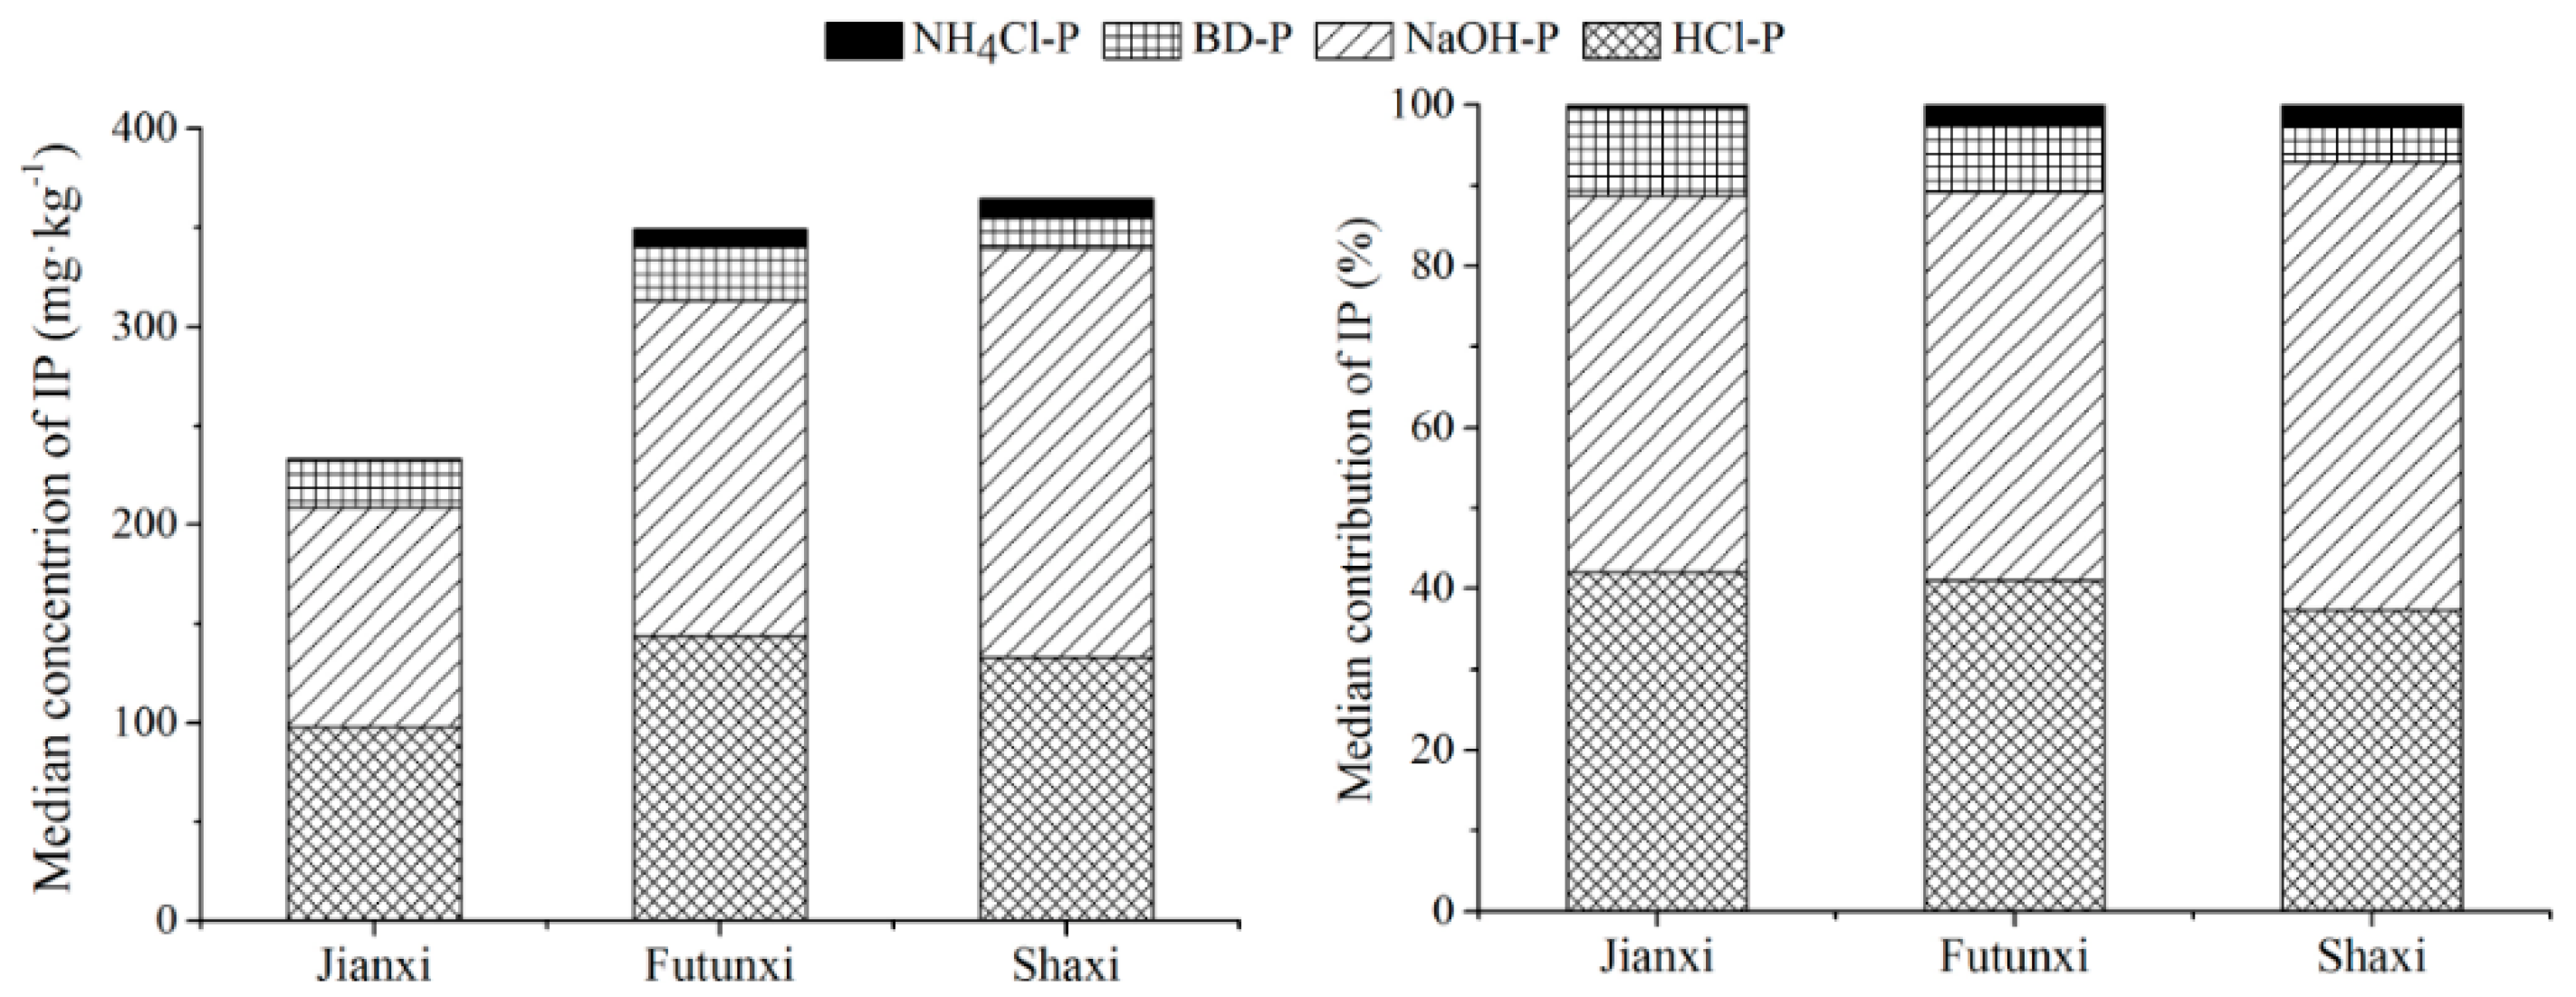
As shown in
Figure 8, the concentrations of NH
4Cl-P (9.73 mg·kg
−1) and NH
4Cl-P /IP (2.68%) in sediments in the Shaxi Basin were higher than those in Futunxi (8.58 mg·kg
−1, 2.63%) and Jianxi (1.14 mg·kg
−1, 0.52%). The concentrations of TP, IP and NH
4Cl-P, which was a highly active component of IP with loose adsorbed phosphorus [
19], were the maximum in sediments in the Shaxi Basin. Therefore, among all sediments in this study, the release potential of P in sediments in Shaxi Basin was the highest.
BD-P is redox-sensitive phosphorus consisting of phosphorus bound to iron hydroxides and manganese compounds. BD-P tends to have good mobility and bioavailability [
13]. The average concentrations of BD-P in sediments in the Jianxi, Futunxi and Shaxi Basins were 23.52 mg·kg
−1, 27.20 mg·kg
−1 and 15.25 mg·kg
−1, respectively. The BD-P/IP ratios of sediments in Jianxi, Futunxi and Shaxi Basins were 10.75%, 8.09% and 4.38%, respectively.
NaOH-P and HCl-P are the primary components of IP in sediments. NaOH-P refers to phosphorus bound with aluminum and iron oxides, and is the main component of bioavailable phosphorus [
13,
19]. HCl-P is the most stable form of inorganic phosphorus, and is barely utilized by organisms. HCl-P consists of natural phosphorus, clastic apatite phosphorus, phosphorus combined with carbonate, and phosphorus produced by the hydrolysis of organic phosphorus. The NaOH-P/IP ratios in the sediments ranged between 32.88–63.30%. The average NaOH-P/IP ratios of Jianxi, Futunxi and Shaxi were 46.68%, 48.21% and 55.51%, respectively, which were significantly higher than the HCl-P/IP ratios (ranged between 31.09–51.55% with the averages of 42.05%, 41.06% and 37.43%, respectively). Previous studies have shown that NaOH-P and HCl-P were the main IP components in the sediments of rivers and lakes in China, although their contents may vary with locations. In southern China, granite and sandstone are the main parent rocks, resulting in high contents of NaOH-P; in northern China, limestone is abundant, and the content of HCl-P is usually higher than that of NaOH-P [
26,
27].
In summary, the average content of bioavailable phosphorus (BAP = NH4Cl-P + BD-P + NaOH-P) in the sediments of the upper reaches of the Minjiang River was 195.88 mg·kg−1, accounting for 64.85% of the total inorganic phosphorus. The average concentrations of BAP and the BAP/IP ratios in sediments in the Shaxi Basin were 231.69 mg·kg−1 and 62.57%, respectively, which were significantly higher than that in Jianxi (135.61 mg·kg−1, 57.95%) and Futunxi (205.23 mg·kg−1, 58.94%). In summary, in the Shaxi Basin, the average concentrations of TP and BAP were the highest, and the ratio of BAP/IP in sediments was the largest. Therefore, the sediments in the Shaxi Basin exhibited highest risks of phosphorus release.


 ,
, 

