Article

Household Energy and Water Practices Change Post-Occupancy in an Australian Low-Carbon Development

by
Jessica K. Breadsell
*,
Joshua J. Byrne
and
Gregory M. Morrison
Sustainability Policy Institute, School of Design and the Built Environment, Curtin University, Perth 6102, Australia
*
Author to whom correspondence should be addressed.
Sustainability 2019, 11(20), 5559; https://doi.org/10.3390/su11205559
Submission received: 18 September 2019 / Revised: 3 October 2019 / Accepted: 5 October 2019 / Published: 9 October 2019
(This article belongs to the Section Energy Sustainability)

Abstract

:
This research comprises a longitudinal study of a cohort of residents moving into a low-carbon development and their pre- and post-occupancy household practices that consume energy and water. They are the early adopters of living in low-carbon households and provide valuable insight into the influence of design and technology on household practices. Household energy and water consumption levels are measured and normalised to the metropolitan average to discuss the influence of design and technology on use. Heating, cooling and showering practices consume the largest proportion of household energy and water use and so the changes to thermal comfort and personal hygiene practices are examined along with a consideration of the influence of lifestyle and family composition on cooling practices. Household water and energy use decreases due to technology and design influences post-occupancy. However, the personal practice history of residents influences water and energy consumption. Changes to the meaning element of personal hygiene practices show how these are interlocked and unlikely to change in their duration when there are other demanding practices to be undertaken.

1. Introduction

Improvements in the household efficiency of energy and water use are an appropriate response to the environmental and climate emergency [1] and the United Nations Sustainable Development Goals [2]. Cooling, heating and personal showering are the most resource-intensive practices in many countries around the world, including in Australian homes [3,4]. However, there are dynamic social influences on innovative design and technology practices that can be unforeseen and disrupt these objectives, particularly in households [5,6]. Globally, low-carbon, energy- and water-efficient houses are considered an effective way to reduce household energy and water consumption and associated greenhouse gas emissions. However, there is still a gap between the anticipated and measured performance outcomes [7]. Paired with the need for higher urban density, particularly in cities across Australia, these houses are being built in low-carbon developments or precincts that also foster community living [8,9,10,11,12]. Pre-occupancy and post-occupancy studies are important to examine how residents engage with the design and technology of these low-carbon developments [13]. Resident’s resource use is heavily influenced by their social, home and work routines and these must be considered when designing a low-carbon development and influencing resource use in the home to ensure an efficient home is built [14,15,16,17,18,19,20,21,22,23,24,25].
Despite a growing body of literature and industry practices that support building low-carbon houses, it is estimated that on average 20% of the expected energy savings in households are not achieved due to occupant practices [7,26]. In Germany, household energy use studies collated by [27] found that for households designed for low-energy use or through passive design, the measured energy use was above the expected output. The lack of building sector knowledge and strict regulations regarding passive house design has been suggested as reasons for this occurring. Research from [28] found that indirect rebound effects are most likely to occur in the home, particularly with the prevalence of large domestic appliances and air conditioners. The non-technical measures of household behaviour or practices that can reduce or prevent the rebound effect occurring have been analysed to a lesser extent [29]. Studies have found that the behavioural and social practice effects of occupants is underestimated when assessing the energy consumption of energy-efficient households [27,29]. Therefore, further research on household resource practices is required if these effects are to be addressed [30]. Of the multitude of household practices that are performed each day, thermal comfort and personal hygiene practices use the largest proportion of total energy and water used in Australian households [3,31]. Therefore, this paper assesses household and individual practices for energy and water, pre- and post-occupancy in a low-carbon development in Australia.

2. Social Practice Theory

This paper focuses on the practices of thermal comfort and personal hygiene through quantitative and qualitative information collected through monitoring and sensing. A practice is the unit of analysis in social practice theory, which is the study of everyday practices, the mundane actions that make up people’s lives, such as cooking, cleaning, showering and staying warm [32,33,34,35,36]. People do not use resources such as water or energy directly, but rather with the objective of achieving a desired outcome [37]. This research uses the three element model of analysis as outlined in [38] and based on [39]’s work: meaning, technology and skills. The meaning is the understandings, assumptions and values associated with the practice; the technology is the artefacts that are used in the practice and the skills are the knowledge and competences necessary to execute the practice. These elements are interconnected and a change in one element can change the practice and its’ resource consumption [40]. When practices form bundles together through interlocking, this is termed a system of practice [41]. When multiple systems of practices exist in the space of the home, this is termed a Home System of Practice (HSOP). The reproduction of practices and their proximity in space and/or time influences their degree of interlocking and subsequent energy or water demand [15,38,42,43]. Some previous research has found that practices using water and energy such as showering, washing and thermal comfort using air conditioning occurs at particular times [15,24,38,44]. Energy consumption practices performed in the 17:00 to 21:00 time-slot contribute to the peak energy demand [45]. With the rise of renewable energy, there is now an uneven temporal distribution of domestic energy demand, whereby domestic routines are not able to utilise the renewable energy generated during the day unless there is storage available, and are instead continuing to be reliant on grid-supplied energy often generated by fossil fuels [46]. Influences on practices performed by individuals can be done through changing an element of the practice or by influencing the individual through their inter-personal networks [47]. Dis-interlocking practices through automation may be efficient to enable lasting reductions in energy, water and resource use in the home [38]. This is often a one-off change, allowing a set and forget mentality to drive the practice in future, thereby reducing the need for human intervention.
When people move into a new home, the space in which the HSOP is located changes. This can alter the meaning, technology and skills related to resident’s practice, even though the outcome of the practice (e.g., getting clean, eating food or staying warm) might remain the same. Consequently, this study examines resident’s HSOP pre- and post-occupancy in a low-carbon development to investigate how their energy and water practices change with this move.

3. Methods

3.1. Research Design

This research is based on a pre- and post-occupancy evaluation of household practices in a low-carbon development. Post-occupancy evaluation is a recognised method of studying residents of buildings and households to understand their experiences and resource use [13,18,48]. The residents of low-carbon and similar homes (passive houses, low-energy houses, net zero energy houses) are considered to have specific lifestyles, user behaviours, practices and views which, as early adopters of this technology, can be studied to improve the viability of the technology and design to the wider population [12]. With an increase in low-carbon homes around Australia, the study of these residents is vital in understanding how these buildings are integrated into society in the future. Therefore, this research will centre on a low-carbon development in Perth, Western Australia. Post-occupancy evaluation of homes in Europe has focused on studies of passive house residents, concluding that residents are generally more thermally comfortable than in their previous dwelling [48]. Post-occupancy evaluations of low-energy buildings in Australia have focused on resident’s comfort and interaction with technologies in the dwelling [8,10,12,49]. These studies have found that many residents of a low-carbon development have little or no experience of the new technologies and how to effectively use them to remain comfortable in their homes [11]. However, individual user experiences are highly variable [9]. A pre-occupancy study was included in this research to enable a longitudinal study as a complement to the post-occupancy evaluation and examine any changes occurring in the low-carbon development.
In this paper, a low-carbon development is defined as a group of households that form part of a development with design performance requirements beyond the Australian National Construction Code, e.g., 7+ star Nationwide House Energy Rating Scheme (NatHERS) thermal performance and inclusion of a solar Photovoltaic (PV)system [50]. The low-carbon development studied in this research is called the WGV Development, located in the suburb of White Gum Valley. WGV consists of multiple dwelling types, stand-alone houses, semi-detached houses and apartments. The WGV development is located in Perth, Western Australia, specifically in the City of Fremantle suburb of White Gum Valley. This area has regular sea breezes most afternoons which assist in cooling the dwellings during warm weather. The average temperature is between 10 and 27.3 °C [51]. The homes are designed for a Mediterranean climate, with sustainability features that include passive solar design features that enhance airflow and sunlight levels to assist the regulation of thermal temperature. Approximately 1 in 4 stand-alone houses in Perth have private bores for garden irrigation, while the remainder rely on the utility water supply for this purpose, sourced from desalination plants (48%), groundwater (40%) or dams (10%) [52,53]. Some homes may also have rainwater tanks. At WGV, all lots are serviced by a community bore for irrigation, and all detached lots have rainwater tanks connected to toilets and washing machines [54].

3.2. Project Participants

A cohort study of 14 individual residents of 13 homes for the basis for this research with data collected both pre- and post-occupancy in the low-carbon development. A detailed description of WGV can be found in [55]. However, for this paper it is relevant to note that the residents studied have moved into a variety of dwelling typologies. Table 1 outlines the resident’s occupations and these cohorts. One cohort (six residents studied) consists of owner occupiers of apartments sold at market rates in a commercial development named Evermore. Another cohort (five residents studied) consists of Sustainable Housing for Artists and Creatives (SHAC), who are leasing apartments and two studio spaces from a local social housing provider, with rental payment concessions received from the Australian Government. The third cohort (three residents studied) consists of owner occupiers of two semi-detached units, while the final resident studied is an owner occupier of a stand-alone (detached) house.

3.3. Mixed Methods

Mixed methods were employed pre- and post-occupancy for data collection [56,57]. The data collection focused on the themes of energy, water, waste, food, transport and social network practices. This paper will address the practices relating to energy and water. A semi-structured interview was undertaken to gain an overview of the different ways the participants regulate their thermal comfort. Questions in the semi-structured interview ask residents how they keep thermally comfortable, the routines of their daily lives and how these have changed since moving to the low-carbon development. The use of interviews allowed for an in-depth and personal exploration of resident practices, along with follow up questions to explore themes that emerge. Interviews are a common data collection method. However, they can be prone to issues of recall or participants responding to what they think the interviewer wants to know [58,59]. To complement the interviews and overcome some of these issues, three other methods were included: workbooks, diaries and cultural probes. A workbook was completed over two weeks, allowing residents to respond to short-answer questions about their resource use along with 5-point and 7-point Likert scale survey questions. An example of a short answer question is: do you think there is a relationship between your energy consumption and your feeling of comfort at home? An example of a 5-point Likert scale question is: How often do you wear more clothes instead of turning on more heating? Very often, often, sometimes, rarely, very rarely. An example of a 7-point Likert scale question is: How often has your family used a fan since moving in to WGV?: every day, a few times a week, approximately once a week, a few times a month, once a month, less than once a month, never. Personal hygiene practices were provided through a personal hygiene diary during this time which noted time, duration and meaning for the practice. Finally, short answer questions were asked through text messages, based on the cultural probe methodology [60,61,62], during the workbook completion phase such as “how have you been keeping warm today?”
Interviewees were self-selected through an open invitation sent to households who had already purchased property in the low-carbon development or were intending to become a tenant through SHAC (n = 27). The original sample size was 16 individuals in 15 homes for the pre-occupancy data collection. However, one household decided to rent out their apartment and another chose to leave the study. Their results were removed from this paper. Pre-occupancy interviews were conducted between April and June 2017 for SHAC residents and between December 2017 and March 2018 for Evermore and single house residents. Post-occupancy interviews were conducted between December 2018 and March 2019 for all residents. This extended period of time for data collection pre-occupancy was to allow for more residents to join the study. However, there is a bias towards those who would reside in the development in 2018 and 2019 due to the research time constraints.
Collecting quantitative data in the pre-occupancy dwellings was more limited than in the post-occupancy evaluation. Before residents moved into the WGV development, the only quantitative data available to the researchers were electricity, gas (combined to form the energy value) and water bills. These were requested for the previous year. However, there was a lot of variety in the bills provided due to residents not keeping them or only being provided with a portion of the water bill from landlords. The data available from each household is shown in Appendix A, and the energy and water figures for pre- and post-occupancy household values are taken from these. The quantitative data collection in the post-occupancy evaluation was more streamlined and extensive. Household levels of electricity and water consumption levels were provided once the residents moved into the dwellings. These were at 5 min intervals for all participating households except for Evermore residents which were at 15 min intervals due to the programming parameters of that building’s data logging equipment. The water consumption data was also divided into source (rainwater or mains water) for the semi-detached house and stand-alone house dwellings studied, which featured dual plumbing. The apartments do not feature this and only have mains water consumption. Over a 3-month period, the households also contained a temperature and relative humidity sensor logging at 5 min intervals.

3.4. Data Analysis

This paper focuses on the energy and water results collected through quantitative and qualitative data methods. Data was analysed at the household level to be able to account for some residents not moving into the low-carbon development in the same house (i.e., children not moving in with their parents post-occupancy). This influences the energy and water consumption levels of the household as a whole and may have some influence on the HSOP, which will be discussed. Data was analysed through a comparison of the energy and water use changes pre- and post-occupancy and by normalising this to the Perth metropolitan average. The pre-occupancy data is limited due to residents not having access to a year’s worth of complete bills. However, all post-occupancy energy use has been collected. As all the dwellings use bore water for irrigation, a daily landscaping contribution was added to the household total. For the semi-detached and stand-alone households, this figure was provided by monitoring data. For the apartment households, a daily landscaping contribution was arrived at by dividing the total outdoor water use by the number of apartments in the dwelling. Data on personal hygiene practices was provided through a personal hygiene diary which noted time, duration and meaning for the practice. These results were graphically presented to reveal trends in total shower times and averages. Meanings were grouped into themes, based on the reason given by the resident in the diary. The Likert scale data was analysed through a graphical representation of the results to view trends, which were then compared with the qualitative data. The qualitative data was analysed through the thematic analysis of interviews, short answer questions, and text probes. Thermal comfort practices were discussed in the interviews, as well as through text probes. This information was analysed through thematic analysis to identify the 43 overarching themes and different approaches to performing the practices. These themes related to practices that use energy and water and include comfort, convenience, affordability, freshness, habit, routines, lighting and blinds.

4. Results and Discussion

4.1. Overall Change in Energy and Water Use at the Household Level

This section explores the pre- and post-occupancy energy and water use at the household level. The data collected is summarised in Appendix A.

4.1.1. Energy Use

This section explores the changes in energy use per household pre- and post-occupancy as shown in Table 2, which also normalises the change in energy use to one against the metropolitan average. The average Perth metropolitan energy use is 20 kWh/household/day for households with electricity and gas. This is a figure from 2013. However, a more up-to-date figure was not available at the time of writing [63,64]. At pre-occupancy, almost all households were below this average. This may be attributed to the personal efforts of residents to minimise energy-consuming activities and to rely on non-auxiliary heating and cooling practices to stay thermally comfortable. These include using blankets, hot water bottles and layers of clothing to stay warm or naturally ventilating the home through opening windows and doors and removing clothing or having a cold drink to stay cool. The households that were above the average (households C and N) had either a high number of occupants, particularly young adults who were reported as being less conscious of their energy use (households C) or had a number of old and inefficient appliances (e.g., refrigerator, freezer, tumble dryer and air conditioner) and the residents would often be awake during the night, using electricity then, instead of during the day. This shows that pre-occupancy, the households were already mostly below the metropolitan average, and any changes post-occupancy would presumably increase this figure.
The change in pre- and post-occupancy energy use has been normalised to one against the metropolitan average. This allows us to compare the changes in each household. While post occupancy, all households are under the metropolitan average energy use, not all households actually reduced their energy use. More than half of the households with available pre- and post-occupancy data actually increased their energy use. This is due to two households coming from extremely low consuming households previously (household B and O) and two residents who increased the amount of time they now spend at home once they have moved to WGV (household H and J). Changes in energy use can be partly attributed to design features, particularly for residents of household B, who are located on the 2nd and 3rd floor of the apartment block, and report difficulties in naturally ventilating their home. Household O also has a student who is at home using energy most of the day. This highlights the importance of understanding resident’s daily routines and practices, as will be discussed in regards to their individual system of practice and HSOP in Section 4.2. Residents who have moved from low thermally comfortable dwellings where auxiliary heating and cooling was required to stay comfortable are now not as reliant on auxiliary systems. SHAC residents who have changed their work practices and work from home have a related increase in energy use. This has not occurred in all the SHAC dwellings however, even though all residents now work at least part-time from home. Households H and J undertake energy-intensive art practices, featuring photography, sewing and painting, which have high lighting requirements. Household D still has a young adult son at home during most of the day and night, who often invites friends around to participate in energy-intensive activities (gaming, leaving the fans and lights on). The installation of energy-efficient lights in SHAC reduces some of this energy use, but it is still close to the metropolitan average. These results show that changes to household energy consumption have occurred post-occupancy.

4.1.2. Water Use

This section examines resident’s household water use pre- and post-occupancy as outlined in Table 3, which also shows the change normalised to one to show the change relative to the metropolitan average. The average Perth metropolitan water use/household/day is 622L, based on 2010 data [3]. Household’s pre-occupancy water usage was mostly above the metropolitan average. All dwellings that were above the average water use had large gardens that were watered frequently and/or had two or more residents. The latter led to increased use of the washing machine and shower facilities (household D, L and G). Households H and L also reported having baths or long showers (approximately 15 minutes in length), increasing the water usage of these households. Post-occupancy, all the households are now below the metropolitan average. This reduction is attributed to design features, namely low-flow fixtures, no baths and reduced garden spaces post-occupancy that require watering.
Post-occupancy, household J was the only household to remain above the Perth metropolitan average water use (Table 3). This is surprising in that there is a female resident who is environmentally conscious of her water use although the high level can be attributed to watering a large pot plant collection on her balcony and inside. There were two households that increased their water consumption post-occupancy (households B and F). Household B’s slight increase may be due to the fact that pre-occupancy, the household used rainwater in some inside fixtures and on the garden, the values of which were not captured in the pre-occupancy data. Post-occupancy, this household retained some of the pot-plant collection that requires watering. For household F, their WGV dwelling features an extensive fruit and vegetable garden that is used as their main source of food. This requires a large amount of water to establish, even though some of this was over the winter rainy season; rain can be unreliable in Perth, even in winter. This increase however does include the use of groundwater on the garden (via the WGV community bore), as opposed to mains water usage in the majority of Perth gardens. These results show that changes to the household water consumption have occurred post-occupancy.

4.2. Changes to Individual Practices and the Home System of Practice

This section will explore the practices that residents undertake in their daily lives that also consume energy and water. Section 4.2.1 will focus on personal hygiene practices and how the meaning related to the practice influences the duration of the practice and corresponding water use. Section 4.2.2 examines the various technologies residents use to stay thermally comfortable pre- and post-occupancy in their homes. The average usage of these technologies and the influences on design that impact the resident’s comfort in the low-carbon development is also discussed. Finally, Section 4.2.3 examines the cooling practices of three households and their lifestyles and routines, highlighting the relevance of understanding the HSOP in energy demand.

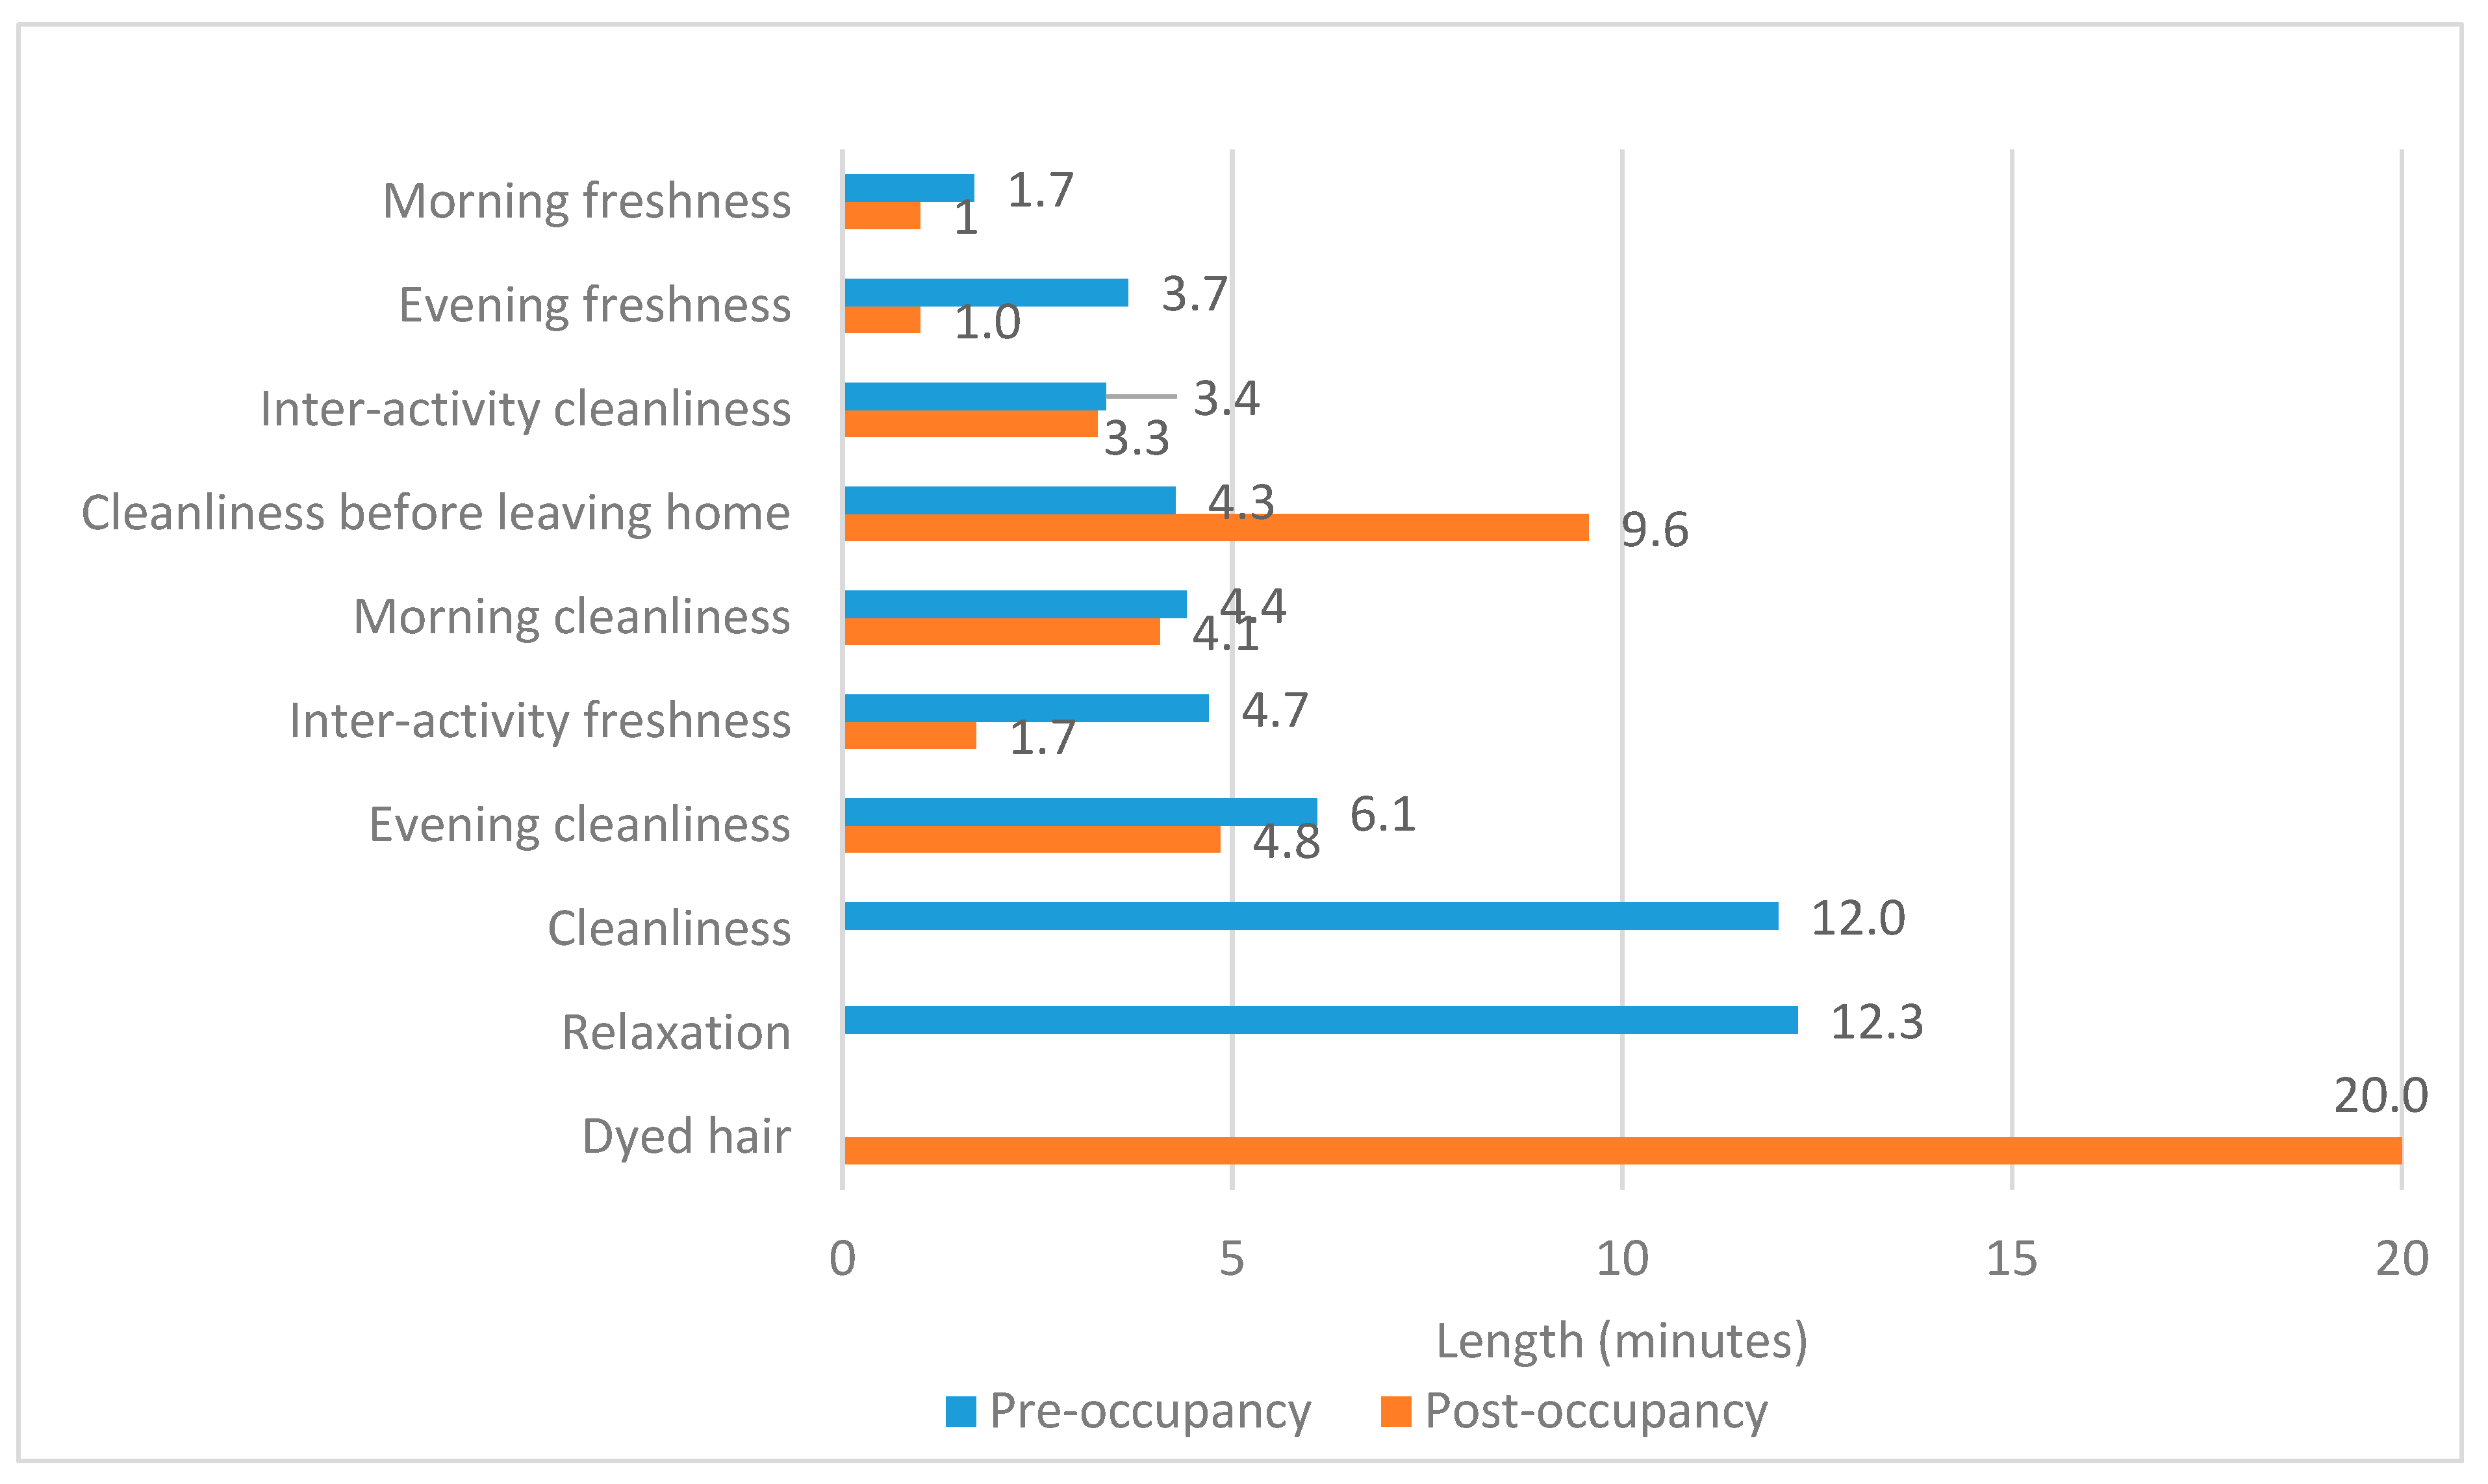
4.2.1. Personal Hygiene Practices

Water for personal hygiene practices using showers is the largest water use inside the household [3]. Previous research on personal hygiene has been conducted by [34,65,66,67,68]. In examining the personal hygiene practices of residents in this research, a focus was taken on the meaning of performing the practice, as done previously in [38,43,44,57]. Personal hygiene practices were usually performed by showering, with a few residents also having infrequent towel washes. Multiple meanings of showering affect the duration. This has been shown previously in [43,57] and is again shown here in Figure 1 and Figure 2. Figure 1 shows the changes to personal hygiene practice duration pre- and post-occupancy. The average practice duration pre-occupancy was 6 minutes, while the average practice duration post-occupancy is 4.4 minutes. This can be compared to previous results for shower duration by Australian residents with an average between 6 minutes and 8 minutes [65]. The duration for all meanings decreased post-occupancy, except for cleanliness before leaving the home. This may be due to some residents not leaving their home as frequently in the low-carbon development due to working from home and therefore spending more time cleaning themselves when they do. The smallest change in meaning duration was for inter-activity cleanliness. Morning cleanliness also had only a small decrease in average duration. This highlights the interlocking of practices in resident’s lives and how this meaning for personal hygiene practices remains dependent on the timing of other practices and is not dependent on the practice itself. Unexpectedly, the relaxation meaning was not reported by the residents post-occupancy. This may be related to the change in technology, as most of the relaxation practices were undertaken via a bath pre-occupancy and bathtubs were not present post-occupancy or choosing other ways to relax, such as swimming in the ocean instead. The cleanliness meaning was also able to be categorised into either evening or morning for all residents post-occupancy due to more detailed completion of the personal hygiene diary by residents. These results highlight the influence that meaning has on personal hygiene practices and subsequent water use in the household.
Figure 2 shows the variation in the duration of showers post-occupancy for the 12 residents who provided this information through their personal hygiene diaries. Most showers are performed for either morning or evening cleanliness. There is generally a preference for either a morning or evening shower by the residents and not both. The showers that are taken for freshness are the shortest showers, while those situated between activities are also short. This relates to the interlocking of practices occurring in the home, whereby there are other practices requiring the residents’ attention and they only have a set amount of time available for showering. When there are less practices to perform during the day, residents will have longer showers. Cleanliness showers that occur before leaving the home for resident N are the longest showers as this resident reports that he rarely leaves the home and therefore spends more time on personal hygiene when he does. This is in line with the findings that the frequency of showering is dependent on practices such as work in resident’s lives [57]. The resident in household D had a particularly long shower when she was dying her hair, which required her to turn the water on and off multiple times and make sure her hair was thoroughly washed. This is in contrast to her other showers, and the practice of dying her hair was not undertaken often. These results highlight the variations that can occur in personal hygiene practices for individuals dependent upon the meaning.

4.2.2. Ambient Heating and Cooling Practices

This section will discuss the ambient heating and cooling practices of the household’s pre- and post-occupancy. Heating and cooling practices demand the largest amount of energy in household practices [31]. This section will focus on the technologies and skills needed by the residents to stay thermally comfortable and how this changes post-occupancy in WGV. It will also examine the indoor temperatures over the monitoring period and discuss comments raised by residents on how the performance of their heating and cooling practices has been influenced by the design of the dwellings.
Table 4 outlines the different mechanical technologies used in heating and cooling practices by household’s pre- and post-occupancy, in addition to the use of clothing, blankets, hot water bottles or ice packs. Pre-occupancy, all homes practiced adaptive thermal comfort practices where residents take actions to restore or maintain their thermal comfort instead of relying on auxiliary heating or cooling. This includes opening and closing windows and doors, adding and removing clothing, using fans and taking hot or cold showers [49]. Post-occupancy, residents have reported less use of auxiliary heating and cooling in their homes, with adaptive thermal comfort practices being sufficient. Some households have had to learn new skills in their thermal comfort practices when the technology available has changed. Evermore residents have switched to the use of a reverse cycle air conditioner for heating, which was also used for cooling by some. However, most of the Evermore residents report being thermally comfortable in the homes through winter and rarely using the reverse cycle air conditioner. In the houses, the two semi-detached houses (household F and M) have underfloor hydraulic heating, which was mostly adequate to keep them comfortably warm. However, this was a new technology and required them to learn new skills for the practice. Household G in the stand-alone house changed to a reverse cycle air conditioner for heating purposes and this was used throughout the winter, mostly in the afternoon and evenings. SHAC residents had the least changes to the technology used in their thermal comfort practices. As air conditioners or reverse cycle air conditioners were not included in the design of the apartments, the majority of residents have continued with the use of portable electric oil heaters (column heaters) and fans to stay comfortable, not requiring a change in skills to perform these practices. These results highlight the importance of understanding the technologies used within a practice before attempting to alter these.
Figure 3 shows the self-reported frequency of the use of heating and cooling systems by household’s post-occupancy in WGV. Evermore residents prefer the use of blinds and cross ventilation to keep a cool temperature in the apartments, with 80% reporting that they never use their heating and cooling. The use of ceiling fans or floor fans was reported across the day and the night and varied in frequency depending on how comfortable the resident was. The reverse cycle air conditioning systems were used by a retiree in Evermore, a shift worker in a house and a full-time worker in a house who has reported that he wants to be at a comfortable temperature to stay healthy and work productively at home. SHAC households do not have any air conditioning in their apartments for use in cooling or heating, which was a deliberate design decision by the developer and owner. Households all have ceiling fans in the living and bedroom areas, which are used as required, along with cross ventilation practices. These results highlight the differences in the use of technology by various residents.
In relation to heating, the only resident who reported using a heater in Evermore was a retiree who is home most of the day and night and uses the reverse cycle air conditioner system. In the houses, a shift worker will use the heating in the reverse cycle air conditioner system a few times a month, while the underfloor hydraulic heating was used periodically in the semi-detached houses. The use of a stand-alone heater was reported most frequently by the SHAC residents. Some households, particularly those in apartments where winter solar gain is partially obstructed by trees or other buildings, have reported being quite cold in SHAC. The use of a heater across all the dwellings was during the morning and evenings, unless the resident was home, then it occurred during the day also.
Households who reported the use of auxiliary heating or cooling with visitors in their home pre-occupancy [43] now report that this is unnecessary because the thermal comfort of the dwelling is considered suitable, except for those who would normally use it for their own comfort. This has implications for considering the influence of social and societal norms when considering household energy use [69].
The measured range of temperatures in the households living areas over a 3-month period from December 2018 to February 2019 is shown in Figure 4. The thermal comfort range for living rooms in dwellings is considered to be between 20 and 25 °C, as compliant with the Australian National Construction Code [70]. All dwellings recorded temperatures above 25 °C, while six dwellings recorded temperatures under 20 °C in their living areas. The lowest minimum outdoor temperature recorded during the monitoring period was 11.3 °C and the highest maximum outdoor temperature was 39 °C. It should be noted however that these temperatures were recorded during the Perth summer. Indoor temperatures in winter may fall below the recommended 20 °C in some dwellings. The largest range of temperatures experienced in a dwelling was 22.3 °C in household B during the monitoring period from December to February. This may be due to the fact that this apartment is located on the 2nd and 3rd story of the Evermore apartment complex and the 3rd floor does not have any adjourning apartments to assist in temperature regulation. It is also believed that the residents may have moved the sensor from its original position on the 2nd floor during monitoring. However, the range of temperatures in a similarly designed apartment, household C, indicates that these apartments, possibly due to their design and location on the 2nd and 3rd floor, feature a large range of temperatures. The dwelling with the smallest range of temperatures recorded was household O in the Evermore apartment complex. This apartment is located on the ground floor with a ground coupled slab which aides in thermal stability. It is also located between other apartments so is protected from extreme morning and afternoon sun by the neighbouring buildings. In relation to household practices, the occupants of households B and O pre-occupancy shared the same dwelling pre-occupancy and reported similar thermal comfort practices. This highlights the influence that design has on the temperatures of a home, regardless of occupant practices.
Additionally, there is only a 2.2 °C difference in the average range of indoor temperatures recorded across all the dwellings and all fall within the recommended range of 20 and 25 °C, except household H which has an average of 25.6 °C. This suggests that the design of the dwellings is sufficient to provide thermally comfortable temperatures. When residents were asked how often they felt thermally uncomfortable in their WGV dwellings, 75% or above answered that for less than once a month they feel too hot or too cold. This indicates that their adaptive thermal comfort practices, auxiliary technological use as needed and the design of the dwellings are mostly adequate for their perceived comfort, supporting the range of temperatures recorded.
There were some comments made by residents on certain design aspects that have hindered their thermal comfort, particularly in Evermore. Due to the location of the two apartment buildings with a common area in between, a wind tunnel is created between the apartments. Paired with the strong westerly breezes that are common in the afternoon in this location, some residents choose not to open their windows facing into the common area due to the noise created by the wind. This prevents cooling cross ventilation practices being fully employed and may be influencing the use of auxiliary cooling practices instead. In addition to this, the windows in all apartments above the ground floor are restricted from other than partial opening due to building requirements. While this is for safety reasons, this hinders the flow of sufficient air through the windows to adequately cool the apartments, particularly at night. Some residents have taken out the restrictors in the windows to allow for an increased breeze to come through, although this compromises the safety regulations. This is because they are more comfortable having windows open instead of using fans or an air conditioner for their cooling practices.
These results outline the importance of understanding the technology that residents use in their practices and how this changes when they move house. Some residents had to learn new skills to be thermally comfortable, particularly residents in households F and M, who had never used underfloor hydraulic heating previously. There were some equipment failures with the heating during the winter of 2018, which impacted how the residents remained comfortable. They reported reverting to the practices they performed pre-occupancy to stay warm without the use of a heater, including extra layers of clothes and the use of additional blankets. The change in these practices influences household energy demand patterns, which are important for the design of energy-efficient homes that rely on renewable energy.

4.2.3. Influence of Lifestyle and the HSOP on Cooling Practices

This section will examine the cooling practices of the three houses in the low-carbon development to highlight the influence of household variability in cooling practices in relation to the HSOP. Previous research has examined the connections between lifestyle and family composition and energy use [15,17]. The thermal comfort range for dwellings living areas is considered to be between 20 and 25 °C, as compliant with the Australian National Construction Code [70]. Figure 5 and Figure 6 show energy usage in households F, G and M during the hottest weekday and weekend day of the year during the monitoring period with complete data. These households were chosen because they are not apartments, which had some incomplete monitoring data. Households F and M are semi-detached houses and household G is a stand-alone house. Sunday 20 January had an outside minimum temperature of 21.8 °C and a maximum of 37.7 °C, while Thursday 7 February had an outside minimum temperature of 21 °C and a maximum of 36 °C. A hotter day occurred on Saturday 22 December 2018 (min 24.3 °C, max 39 °C). However, not all households had complete monitoring data for that day.
On Sunday 20 January, the energy use shows that all the households are using energy through the day. In all the households, there are peaks in the morning when the residents wake up, between 11.00 and 13.00 when they would be preparing lunch and completing household chores and then again in the evening around 17:00–19:00 when preparing dinner. Household G has the air conditioning on during the day due to the high energy use from 09:00–18:00. This is supported by the indoor temperature sensor which records the temperature to be between 23.5 and 24.5 °C during this time and 25°C or above outside of these times.
The energy use profile during a weekday, Thursday 7 February 2019 is markedly different for households F and M which consist of full-time, off-site (Monday to Friday) workers. There are small peaks in the morning between 05:00 and 07:00 when the residents wake up and prepare for work, then low energy use until the evening between 18:00 and 21:00 when the residents are returning home, preparing dinner and going to bed. In contrast, household G, which consists of a shift-worker and full-time student/part-time casual worker were home during the day and use energy throughout. There were similar peaks between 06:30 and 08:30 and 10:00 and 13:00 and then the air conditioner is switched on from 13:30 and 19:00. There is then an evening peak until 22:00 at night when the residents go to bed. The temperature in household G increases steadily from 25 to 29 °C during the morning before the air conditioner is turned on from 13:30 to 22:00, at 25 °C, when the temperature begins to rise again.
This data clearly shows the relationship between time of day, the HSOP and energy use. The HSOP recognises the interlocking of individual resident’s practices in the space of the home influencing the practices of others and resource consumption [38,43]. In this example, the households where residents are out of the house on weekdays have low-energy use, with higher levels of consumption during the early morning and evening when the residents are home. This contrasts to the household with a resident home during the day due to differing work conditions, who is utilising energy through their practice of staying thermally comfortable. On a weekday where all the residents of the households are home and practices such as cleaning and washing are being undertaken, the energy use profiles of the households feature more peaks throughout the day.

5. Research Insights and Conclusions

This research provides insight from a pre- and post-occupancy longitudinal study of low-carbon development residents and with a focus on tracking the pre-occupancy practices of residents. However, as this research has shown, an understanding of pre-occupancy practices allows an assessment of how resident practices change post-occupancy when interacting with the design and technological elements of a low-carbon development. There were distinct changes in practice occurring when the technology changes in households. Lower household water consumption levels are primarily due to low flow fixtures and a smaller garden to water. Energy-efficient lights were also installed to reduce operational running costs of the home. The changes in the technology used to heat and cool the home also influence the household energy use. Reverse cycle air conditioners have less energy demand when running on the heating setting than gas or electric oil heaters when used to heat a large space [31]. Along with a change in technology used in the practice, a change in the skills of the resident performing the practice are also required. This was highlighted through the personal hygiene practices of residents. Those who had previously had access to a bath and used this for cleanliness and relaxation, post-occupancy had to rely on a shower to perform this task instead. Some residents then changed their practice for relaxation to a visit to the beach. The HSOP influence on household energy consumption patterns was outlined over two of the hottest weekdays and weekends of the monitoring period for three households with different routines. The marked difference in energy use based on time of day and the practices being performed enable an understanding of the increase in renewable energy and battery storage options. The HSOP and energy consumption patterns will often remain the same, regardless of where the energy is sourced from, which will be a consideration for builders and designers of low-carbon development and energy-efficient homes and technology.
As with any research, there are limitations to this study, although the authors have tried to minimise them where possible. The limited sample size may have affected the wider implications of the study. Residents who had not moved in to the low-carbon development by the beginning of 2019 were unable to participate. Future research might include a larger sample size of residents in a low-carbon development to see how these early adopters interact with the design and technology.
The use of household level data was chosen to be able to assess the influence of the house as a system, in relation to the social practice theory development of a HSOP. Without intensive monitoring of the residents, accurate individual energy and water use is difficult to estimate. The authors did originally divide the household level data by the number of occupants in the household, but this resulted in discrepancies with the qualitative findings reported by residents. For instance, household C had three adults pre-occupancy—two teenage sons and their mother. The individual data showed high consumption levels per individual. However, the interview revealed that the mother had low-energy and water consumption levels, while the sons would have long showers, use the tumble dryer, use their computers extensively and leave the lights on. This highlights the intra home heterogeneity in the performance of practices.
There were a number of households pre-occupancy who did not have access to their energy or water consumption data, or the data they provided was only for a few months a year. The authors chose not to use this incomplete data as it does not provide an accurate reflection of household energy and water consumption levels. This has reduced the households with available pre-occupancy data and influenced the extent to which the authors could comment on the possible impact of rebound effects. Future studies might aim to obtain more detailed energy and water data both pre- and post-occupancy to allow for this area of research to be explored. This would allow for the statistical analysis of changes in energy and water consumption to be undertaken with confidence. It may also provide an opportunity to consider other methods of analysis such as multi-criteria analysis [71,72] or the model of recursive cultural adaptation [73,74].
This study supported the previous literature finding that the meaning of a shower influences its duration. Changes to the meaning of a personal hygiene practice shows how practices are interlocked with others, and unlikely to change in duration when there are other demanding practices to be undertaken. The consumption of energy and water is reduced mostly by virtue of the design and appliances installed in the home. The influence of personal practices of thermal comfort still remains though, as does the influence of work routines on time of day energy and water use. However, changes to energy and water related practices post-occupancy in low-carbon developments were not as predicted. The design of the home and personal practice history influence the resident’s practices for water and energy. Pre- and post-occupancy studies of low-carbon development residents are critical for understanding how technology is being used. This research has highlighted the personal influences on routine energy and water consumption along with the changes that can occur through design and technology alterations. These results can be beneficial to architects designing homes, technology companies, and energy and water utilities and those associated with striving to reduce household resource consumption.

Author Contributions

Conceptualization, J.K.B., J.J.B. and G.M; methodology, J.K.B., J.J.B. and G.M.; software, J.K.B. and J.J.B.; validation, J.K.B., J.J.B. and G.M.M.; formal analysis, J.K.B.; investigation, J.K.B. and J.J.B.; resources, J.K.B. and J.J.B.; data curation, J.K. B. and J.J..; writing—original draft preparation, J.K.B.; writing—review and editing, J.K.B., J.J.B. and G.M.M.; visualization, J.K.B.; supervision, J.J.B and G.M.M.; project administration, J.K.B., J.J.B. and G.M.M.; funding acquisition, J.J.B. and G.M.M.

Funding

This research is funded by the CRC (Project number NP 2006 for Low Carbon Living Ltd supported by the Cooperative Research Centres program, an Australian Government initiative). All subjects gave their informed consent for inclusion before they participated in the study. The study was conducted in accordance with the Declaration of Helsinki, and the protocol was approved by the Ethics Committee of Curtin University (HRE2016-0222).

Acknowledgments

The authors would like to thank Balance Services Group for assistance with the data download and all the stakeholders involved in the WGV Precinct project, particularly LandCorp and the City of Fremantle. The authors thank participants from WGV for their patience and involvement in this research.

Conflicts of Interest

The authors declare no conflict of interest.

Appendix A

Table A1. Table showing the pre- and post-occupancy energy and water data available for the households that is used in Section 4.1.
WGV DevelopmentHousePre-Occupancy Energy DataPost-Occupancy Energy DataPre-Occupancy Water DataPost-Occupancy Water Data
EvermoreANASpring and SummerNASpring and Summer
B1 yr inc gasSpring and Summer1 yrSpring and Summer
C1 yr inc gasSpring and Summer1 yrSpring and Summer
INASpring and SummerNASpring and Summer
O1 yr inc gasSpring and Summer1 yrSpring and Summer
SHACDNA1 yrSummer1 yr
H1 yr1 yrWinter and Summer1 yr
J1 yr1 yrNA1 yr
LNASummer, Autumn, WinterSpring, Summer, AutumnSummer, Autumn, Winter
NSpring and Summer1 yrAutumn1 yr
Semi-Detached HouseF1 yr inc gasSummerSummer and AutumnSpring and Summer
MNASummerNASpring and Summer
HouseGNASpring and Summer1 yrFebruary

References

  1. BBC News UN Chief Makes Antarctica Visit. Available online: http://news.bbc.co.uk/go/pr/fr/-/2/hi/science/nature/7088435.stm (accessed on 22 July 2019).
  2. United Nations Sustainable Development Goals. Available online: https://sustainabledevelopment.un.org/ (accessed on 22 July 2019).
  3. Water Corporation. Perth Residential Water Use Study 2008/2009; Water Corporation: Perth, Australia, 2010. [Google Scholar]
  4. DEWHA. Energy Use in the Australian Residential Sector 1986–2020; Australian Government: Canberra, Australia, 2008.
  5. Azevedo, I.M.L. Consumer End-Use Energy Efficiency and Rebound Effects. Annu. Rev. Environ. Resour. 2014, 39, 393–418. [Google Scholar] [CrossRef] [Green Version]
  6. Buhl, J.; von Geibler, J.; Echternacht, L.; Linder, M. Rebound effects in Living Labs: Opportunities for monitoring and mitigating re-spending and time use effects in user integrated innovation design. J. Clean. Prod. 2017, 151, 592–602. [Google Scholar] [CrossRef]
  7. Watson, K.J. Understanding the role of building management in the low-energy performance of passive sustainable design: Practices of natural ventilation in a UK office building. Indoor Built Environ. 2015, 24, 999–1009. [Google Scholar] [CrossRef]
  8. Berry, S.; Davidson, K. Zero energy homes—Are they economically viable? Energy Policy 2015, 85, 12–21. [Google Scholar] [CrossRef]
  9. Berry, S.; Moore, T.; Sherriff, G.; Whaley, D. Low-Energy Housing: Are We Asking the Right Questions? In Proceedings of the 10th International Conference in Sustainability of Energy and Buildings (SEB’18); Kaparaju, P., Howlett, R.J., Littlewood, J.R., Ekanyake, C., Vlacic, L., Eds.; Springer: Cham, Switzerland, 2019; pp. 445–452. [Google Scholar]
  10. Sherriff, G.; Moore, T.; Berry, S.; Ambrose, A.; Goodchild, B.; Maye-banbury, A. Coping with extremes, creating comfort: User experiences of ‘ low-energy ’ homes in Australia. Energy Res. Soc. Sci. 2019, 51, 44–54. [Google Scholar] [CrossRef]
  11. Whaley, D.; Berry, S.; Moore, T.; Sherriff, G.; O’Leary, T. Resident’s Issues and Interactions with Grid-Connected Photovoltaic Energy System in High-Performing Low-Energy Dwellings: A User’s Perspective. In Proceedings of the 10th International Conference in Sustainability of Energy and Buildings (SEB’18); Kaparaju, P., Howlett, R.J., Littlewood, J.R., Ekanyaka, C., Vlacic, L., Eds.; Springer: Cham, Switzerland, 2019; pp. 413–424. [Google Scholar]
  12. Berry, S.; Whaley, D.; Davidson, K.; Saman, W. Near zero energy homes—What do users think? Energy Policy 2014, 73, 127–137. [Google Scholar] [CrossRef]
  13. Meir, I.A.; Garb, Y.; Jiao, D.; Cicelsky, A. Post-occupancy evaluation: An inevitable step toward sustainability. Adv. Build. Energy Res. 2009, 3, 189–219. [Google Scholar] [CrossRef]
  14. Hampton, S. An ethnography of energy demand and working from home: Exploring the affective dimensions of social practice in the United Kingdom. Energy Res. Soc. Sci. 2017, 28, 1–10. [Google Scholar] [CrossRef]
  15. Torriti, J. Understanding the timing of energy demand through time use data: Time of the day dependence of social practices and energy demand. Energy Res. Soc. Sci. 2017, 25, 37–47. [Google Scholar] [CrossRef]
  16. Wittenberg, I.; Matthies, E. Solar policy and practice in Germany: How do residential households with solar panels use electricity? Energy Res. Soc. Sci. 2016, 21, 199–211. [Google Scholar] [CrossRef]
  17. Nicholls, L.; Strengers, Y. Peak demand and the “family peak” period in Australia: Understanding practice (in)flexibility in households with children. Energy Res. Soc. Sci. 2015, 9, 116–124. [Google Scholar] [CrossRef]
  18. Van Der Grijp, N.; Van Der Woerd, F.; Gaiddon, B.; Hummelshøj, R.; Larsson, M.; Osunmuyiwa, O.; Rooth, R. Demonstration projects of Nearly Zero Energy Buildings: Lessons from end- user experiences in Amsterdam, Helsingborg, and Lyon. Energy Res. Soc. Sci. 2019, 49, 10–15. [Google Scholar] [CrossRef]
  19. Strengers, Y.; Nicholls, L. Convenience and energy consumption in the smart home of the future: Industry visions from Australia and beyond. Energy Res. Soc. Sci. 2017, 32, 86–93. [Google Scholar] [CrossRef]
  20. Maréchal, K.; Holzemer, L. Getting a (sustainable) grip on energy consumption: The importance of household dynamics and “habitual practices”. Energy Res. Soc. Sci. 2015, 10, 228–239. [Google Scholar]
  21. Walker, G. The dynamics of energy demand: Change, rhythm and synchronicity. Energy Res. Soc. Sci. 2014, 1, 49–55. [Google Scholar] [CrossRef]
  22. Hess, A.K.; Samuel, R.; Burger, P. Informing a social practice theory framework with social-psychological factors for analyzing routinized energy consumption: A multivariate analysis of three practices. Energy Res. Soc. Sci. 2018, 46, 183–193. [Google Scholar] [CrossRef] [Green Version]
  23. Ambrose, A.; Goodchild, B.; O’Flaherty, F. Understanding the user in low energy housing: A comparison of positivist and phenomenological approaches. Energy Res. Soc. Sci. 2017, 34, 163–171. [Google Scholar] [CrossRef]
  24. Friis, F.; Haunstrup Christensen, T. The challenge of time shifting energy demand practices: Insights from Denmark. Energy Res. Soc. Sci. 2016, 19, 124–133. [Google Scholar] [CrossRef]
  25. Stern, P.C. Individual and household interactions with energy systems: Toward integrated understanding. Energy Res. Soc. Sci. 2014, 1, 41–48. [Google Scholar] [CrossRef]
  26. Gram-Hanssen, K. New needs for better understanding of household’s energy consumption- behaviour, lifestyle or practices? Archit. Eng. Des. Manag. 2014, 10, 91–107. [Google Scholar] [CrossRef]
  27. Sunikka-Blank, M.; Galvin, R. Introducing the prebound effect: The gap between performance and actual energy consumption. Build. Res. Inf. 2012, 40, 260–273. [Google Scholar] [CrossRef]
  28. Yu, B.Y.; Zhang, J.Y.; Fujiwara, A. Rebound effects caused by the improvement of vehicle energy efficiency: An analysis based on a SP-off-RP survey. Transp. Res. Part D-Transport Environ. 2013, 24, 62–68. [Google Scholar] [CrossRef]
  29. Gram-Hanssen, K. Efficient technologies or user behaviour, which is the more important when reducing households’ energy consumption? Energy Effic. 2013, 6, 447–457. [Google Scholar] [CrossRef]
  30. Gram-Hanssen, K. Standby consumption in households analyzed with a practice theory approach. J. Ind. Ecol. 2010, 14, 150–165. [Google Scholar] [CrossRef]
  31. Australian Government Heating and Cooling. Available online: http://www.yourhome.gov.au/energy/heating-and-cooling (accessed on 22 July 2019).
  32. Schatzki, T. Social Practices: A Wittgensteinian Approach to Human Activity and the Social; Cambridge University Press: New York, NY, USA, 1996. [Google Scholar]
  33. Reckwitz, A. Towards a Theory of Social Practices: A Development in Culturalist Theorizing. Eur. J. Soc. Theory 2002, 5, 243–263. [Google Scholar] [CrossRef]
  34. Shove, E. Comfort, Cleanliness and Convenience; Berg Publisher: Oxford, UK, 2003. [Google Scholar]
  35. Warde, A. Consumption and Theories of Practice. J. Consum. Cult. 2005, 5, 131–153. [Google Scholar] [CrossRef]
  36. Røpke, I. New technology in everyday life: Social processes and environmental impact. Ecol. Econ. 2001, 38, 403–422. [Google Scholar] [CrossRef]
  37. Shove, E.; Chappells, H.; Lutzenhiser, L. Comfort in a Lower Carbon Society; Routledge: London, UK; New York, NY, USA, 2010. [Google Scholar]
  38. Eon, C.; Breadsell, J.K.; Morrison, G.M.; Byrne, J. The home as a system of practice and its implications for energy and water metabolism. Sustain. Prod. Consum. 2018, 13, 48–59. [Google Scholar] [CrossRef] [Green Version]
  39. Shove, E.; Pantzar, M.; Watson, M. The Dynamics of Social Practice: Everyday Life and How It Changes; SAGE Publications: London, UK, 2012. [Google Scholar]
  40. Macrorie, R.; Foulds, C.; Hargreaves, T. Governing and Governed by Practices: Exploring interventions in low-carbon housing policy and practice. In Social Practices, Intervention and Sustainability: Beyond Behaviour Change; Strengers, Y., Maller, C., Eds.; Routledge: Oxford, UK; New York, NY, USA, 2015; pp. 95–111. [Google Scholar]
  41. Watson, M. How theories of practice can inform transition to a decarbonised transport system. J. Transp. Geogr. 2012, 24, 488–496. [Google Scholar] [CrossRef] [Green Version]
  42. Spurling, N.; Mcmeekin, A.; Shove, E.; Southerton, D.; Welch, D. Interventions in Practice: Re-Framing Policy Approaches to Consumer Behaviour; Sustainable Practices Research Group: Swindon, UK, 2013. [Google Scholar]
  43. Breadsell, J.; Eon, C.; Morrison, G.M.; Kashima, Y. Interlocking practices and their influence in the home. Environ. Plan. B Urban Anal. City Sci. 2019, 46, 1405–1421. [Google Scholar] [CrossRef]
  44. Eon, C.; Liu, X.; Morrison, G.M.; Byrne, J. Influencing energy and water use within a home system of practice. Energy Build. 2018, 158, 848–860. [Google Scholar] [CrossRef]
  45. Smale, R.; van Vliet, B.; Spaargaren, G. When social practices meet smart grids: Flexibility, grid management, and domestic consumption in The Netherlands. Energy Res. Soc. Sci. 2017, 34, 132–140. [Google Scholar] [CrossRef]
  46. Anderson, B. Laundry, energy and time: Insights from 20 years of time-use diary data in the United Kingdom. Energy Res. Soc. Sci. 2016, 22, 125–136. [Google Scholar] [CrossRef] [Green Version]
  47. Spurling, N.; McMeekin, A. Interventions in Practices: Sustainable mobility policies in England. In Social Practices, Intervention and Sustainability: Beyond Behaviour Change; Strengers, Y., Maller, C., Eds.; Routledge: Oxford, UK; New York, NY, USA, 2015; pp. 78–94. [Google Scholar]
  48. Mlecnik, E.; Schütze, T.; Jansen, S.J.T.; De Vries, G.; Visscher, H.J.; Van Hal, A. End-user experiences in nearly zero-energy houses. Energy Build. 2012, 49, 471–478. [Google Scholar] [CrossRef]
  49. Moore, T.; Ridley, I.; Strengers, Y.; Maller, C.; Horne, R. Dwelling performance and adaptive summer comfort in low-income Australian households. Build. Res. Inf. 2017, 45, 443–456. [Google Scholar] [CrossRef]
  50. Department of the Environment and Energy Nationwide House Energy Rating Scheme (NatHERS). Administrative and Governance Arrangements; Australian Government: Canberra, Australia, 2015.
  51. Bureau of Meteorology Climate Statistics for Australian Locations. Available online: http://www.bom.gov.au/climate/averages/tables/cw_009083.shtml (accessed on 27 June 2019).
  52. Water Corporation Groundwater. Available online: https://www.watercorporation.com.au/water-supply/our-water-sources/groundwater (accessed on 4 July 2019).
  53. Water Corporation Our Water Sources. Available online: https://www.watercorporation.com.au/water-supply/our-water-sources (accessed on 2 July 2019).
  54. Byrne, J.; Green, M.; Dallas, S. WSUD Implementation in a Precinct Residential Development: Perth Case Study. In Approaches to Water Sensitive Urban Design: Potential, Design, Ecological Health, Urban Greening, Economics, Policies and Community Perceptions; Sharma, A.K., Gardner, T., Begbie, D., Eds.; Elsevier: Amsterdam, The Netherlands, 2019; pp. 541–559. [Google Scholar]
  55. Wiktorowicz, J.; Babaeff, T.; Breadsell, J.; Byrne, J.; Eggleston, J.; Newman, P. WGV: An Australian Urban Precinct Case Study to Demonstrate the 1.5C Agenda including Multiple SDGs. Urban Plan. 2018, 3, 64–81. [Google Scholar] [CrossRef]
  56. Liedtke, C.; Baedeker, C.; Hasselkuß, M.; Rohn, H.; Grinewitschus, V. User-integrated innovation in Sustainable LivingLabs: An experimental infrastructure for researching and developing sustainable product service systems. J. Clean. Prod. 2015, 97, 106–116. [Google Scholar] [CrossRef]
  57. Browne, A.; Meed, W.; Anderson, B.; Pullinger, M. Method as intervention: Intervening in practice through quantitative and mixed methodologies. In Social Practices, Intervention and Sustainability: Beyond Behaviour Change; Strengers, Y., Maller, C., Eds.; Routledge: Oxford, UK; New York, NY, USA, 2015; pp. 179–195. [Google Scholar]
  58. Romero, N.; Al Mahmud, A.; Beella, S.; Keyson, D.V. Towards an Integrated Methodology to Design Sustainable Living Practices. In Proceedings of the Ambient Intelligence: 4th International Joint Conference, AmI 2013, Dublin, Ireland, 3–5 December 2013; Augusto, J.C., Wichert, R., Collier, R., Keyson, D., Salah, A.A., Tan, A.-H., Eds.; Springer International Publishing: Cham, Switzerland, 2013; pp. 299–304. [Google Scholar]
  59. Hollstein, B. Qualitative Approaches. In The SAGE Handbook of Social Network Analysis; Scott, J., Carrington, P., Eds.; SAGE Publications: London, UK, 2011; pp. 404–416. [Google Scholar]
  60. Sanders, E.B.N.; Stappers, P.J. Probes, toolkits and prototypes: Three approaches to making in codesigning. CoDesign 2014, 10, 5–14. [Google Scholar] [CrossRef]
  61. Gaver, B.; Dunne, T.; Pacenti, E. Design: Cultural Probes. Interactions 1999, 6, 21–29. [Google Scholar] [CrossRef]
  62. Thoring, K.; Luippold, C.; Mueller, R.M. Opening the Cultural Probes Box: A Critical Reflection and Analysis of the Cultural Probes Method. In Proceedings of the 5th International Congress of International Association of Societies of Design Research, Tokyo, Japan, 26–30 August 2013; pp. 222–233. [Google Scholar]
  63. Australian Energy Market Commission. 2017 Residential Electricity Price Trends: Report 2017; Australian Energy Market Commission: Sydney, Australia, 2017.
  64. Living Smart Participant Handbook. Available online: https://www.livingsmart.org.au/wp-content/uploads/2013/08/ParticipantHandbook-LivingSmart-SinglePages1.pdf (accessed on 14 August 2019).
  65. Rathnayaka, K.; Malano, H.; Maheepala, S.; George, B.; Nawarathna, B.; Arora, M.; Roberts, P. Seasonal Demand Dynamics of Residential Water End-Uses. Water 2015, 7, 202–216. [Google Scholar] [CrossRef] [Green Version]
  66. Pink, S.; Mackley, K.L. Social science, design and everyday life: Refiguring showering through anthropological ethnography. J. Des. Res. 2015, 13, 278–292. [Google Scholar] [CrossRef]
  67. Hand, M.; Shove, E.; Southerton, D. Explaining Showering: A Discussion of the Material, Conventional, and Temporal Dimensions of Practice. Sociol. Res. Online 2005, 10, 1–13. [Google Scholar] [CrossRef]
  68. Kuijer, L.; De Jong, A.; van Eijk, D. Practices as a Unit of Design: An Exploration of Theoretical Guidelines in a Study on Bathing. ACM Trans. Comput. Interact. 2013, 20, 21. [Google Scholar] [CrossRef]
  69. O’Brien, L.V.; Meis, J.; Anderson, R.C.; Rizio, S.M.; Ambrose, M.; Bruce, G.; Critchley, C.R.; Dudgeon, P.; Newton, P.; Robins, G.; et al. Low Carbon Readiness Index: A short measure to predict private low carbon behaviour. J. Environ. Psychol. 2018, 57, 34–44. [Google Scholar] [CrossRef]
  70. NatHERS National Administrator. Nationwide House Energy Rating Scheme (NatHERS)—Software Accreditation Protocol; Department of Environment and Energy: Canberra, Australia, 2012.
  71. Nesticò, A.; Sica, F. The sustainability of urban renewal projects: A model for economic multi-criteria analysis. J. Prop. Investig. Financ. 2017, 35, 397–409. [Google Scholar] [CrossRef]
  72. Nesticò, A.; Guarini, M.R.; Morano, P.; Sica, F. An economic analysis algorithm for urban forestry projects. Sustainability 2019, 11, 314. [Google Scholar] [CrossRef]
  73. Boldero, J.M.; Binder, G. Can psychological and practice theory approaches to environmental sustainability be integrated? Environ. Plan. A 2013, 45, 2535–2538. [Google Scholar] [CrossRef]
  74. Binder, G. Theory(izing)/practice: The model of recursive cultural adaptation. Plan. Theory 2012, 11, 221–241. [Google Scholar] [CrossRef]
Figure 1. Average length of personal hygiene practices pre- and post-occupancy based on meaning.
Sustainability 11 05559 g001
Figure 2. Meaning of personal hygiene practices by resident and length post-occupancy in WGV.
Sustainability 11 05559 g002
Figure 3. Frequency of the use of heating and cooling systems by households post-occupancy.
Sustainability 11 05559 g003
Figure 4. Minimum, maximum and average indoor temperatures in each dwelling’s living area. House L in a SHAC apartment was excluded due to residents moving out of the dwelling during the data collection period. House M in a semi-detached house was excluded due to equipment malfunction.
Sustainability 11 05559 g004
Figure 5. Household energy use (kWh) on Sunday 20 January 2019, the hottest weekend day during monitoring.
Sustainability 11 05559 g005
Figure 6. Household energy use (kWh) on Thursday 7 February 2019, the hottest weekday during monitoring.
Sustainability 11 05559 g006
Table 1. Resident’s occupation, house and development at WGV.
DwellingHouseOccupancy Lifestyle
Evermore ApartmentsAWorks full-time off-site
BWorks 4 days a week off-site; daughter is a student who is at home most days
CWorks 4 days a week off-site
IRetiree
OWorks full-time off-site; son is a student who is at home most days
Sustainable Housing for Artists and Creatives (SHAC) ApartmentsDWorks part-time off-site, part-time on site; son works part-time off site
HWorks part-time off-site, part-time on-site
JWorks part-time off-site
LWorks part-time off-site, part-time on-site; has a 5-year-old who is a part-time school student
NWorks part-time on-site
Semi-Detached HouseFBoth residents work full-time off-site
Semi-Detached HouseMBoth residents work full-time off-site
Detached HouseGShift work full-time off-site; daughter is a student who is at home most days
Table 2. Household energy use pre- and post-occupancy and normalised to the Perth metropolitan average use (20 kWh/day). NA values are due to no or inadequate energy bill data provided by the resident.
WGV DevelopmentHousePre-Occupancy Energy/Household/Day (kWh)Post-Occupancy Energy/Household/Day (kWh)Change Normalised to Metro Average
Evermore ApartmentsANA4.44NA
B5.546.61−0.05
C29.257.021.11
INA5.90NA
O5.545.88−0.02
SHAC ApartmentsDNA14.080.45
H7.379.46−0.10
J7.218.52−0.07
LNA6.79NA
N21.165.670.77
Semi-Detached HouseF11.936.720.26
HouseGNA12.30NA
Semi-Detached HouseMNA4.88NA
Table 3. Household water use pre- and post-occupancy and normalised to the Perth metropolitan average use (622L/household/day). NA values due to no or inadequate water bill data provided by the resident.
WGV DevelopmentHousePre-Occupancy Water Use/Household/Day (L)Post-Occupancy Water/Household/Day (L)Change Normalised to Metro Average
Evermore ApartmentsANA131.40NA
B210.01233.48−0.04
C409.65133.350.44
INA114.78NA
O210.01109.510.16
SHAC ApartmentsD2186.44371.902.92
H817.21516.000.48
JNA657.39NA
L1873.26110.142.83
N508.47230.590.45
Semi-Detached HouseF295.85359.53−0.10
HouseG959.39511.950.72
Semi-Detached HouseMNA359.53NA
Table 4. Technology used in heating and cooling practices of households pre- and post-occupancy in WGV, additional to layers of clothing, blankets, hot water bottles or ice packs (AC = air conditioning and RC AC = reverse cycle air conditioning).
WGV DevelopmentHousePre-Occupancy HeatingWGV HeatingPre-Occupancy CoolingWGV Cooling
Evermore ApartmentsAGas heaterRC ACACStanding fans, RC AC
BHeater, OvenNoneFans, RC ACCeiling fans
CGas heaterRC ACFansCeiling fans, RC AC
IOvenRC ACFans, RC ACRC AC
OHeater, OvenNoneFans, RC ACCeiling fans
SHAC ApartmentsDWood stove, RC ACNoneRC AC, fansFans
HElectric oil heaterElectric oil heaterFansFans
JElectric oil heaterElectric oil heaterFansFans
LFire, Electric oil heaterElectric oil heaterEvaporative AC, fansFans
NElectric oil heaterElectric oil heaterFans, RC ACFans
Semi-Detached HouseFElectric heaterUnderfloor hydraulic heatingFansRC AC, Fans
HouseGElectric heaterRC ACFans, ACRC AC, Fans
Semi-Detached HouseMNoneUnderfloor hydraulic heatingFansFans, RC AC

