Article

Carbon Emissions of China’s Cement Packaging: Life Cycle Assessment

1
Center for Energy and Environmental Policy Research, Beijing Institute of Technology, Beijing 100081, China
2
School of Management and Economics, Beijing Institute of Technology, Beijing 100081, China
3
Beijing Key Laboratory of Energy Economics and Environmental Management, Beijing 100081, China
4
Sustainable Development Research Institute for Economy and Society of Beijing, Beijing 100081, China
*
Author to whom correspondence should be addressed.
Sustainability 2019, 11(20), 5554; https://doi.org/10.3390/su11205554
Submission received: 14 August 2019 / Revised: 4 October 2019 / Accepted: 5 October 2019 / Published: 9 October 2019

Abstract

:
China is the largest producer of cement in the world. With this tremendous production of cement, the extensively used cement packaging embodies significant carbon dioxide emissions. However, this has scarcely been investigated. This paper presents the first investigation into three types of cement packaging in China using the life cycle assessment methodology. The carbon dioxide emissions in each production phase of cement packaging were calculated and compared to the emissions in the western, middle, and eastern regions in China. The results show that in the production phase, the consumption of electricity accounted for the highest proportion of total carbon dioxide emissions (23.39–35.14%), followed by the consumption of polypropylene-based material (23.39%). From a packaging perspective, laminated plastic woven bags emitted the most carbon dioxide (0.637 kg/bag), followed by paper–plastic composite bags (0.536 kg/bag) and paper bags (0.022 kg/bag). In regional terms, the western region emitted the most carbon dioxide (3.06 million tons) compared with the eastern (2.01 million tons) and middle (1.81 million tons) regions due to the low bulk rate. Our findings indicate that using paper–plastic composite bags instead of laminated plastic woven bags and using recycled materials instead of new materials in certain production phases can considerably reduce the environmental impacts of cement packaging. The government should encourage the use of non-coal energy power generation for the production phase. Further improvements could focus on the use of bulk cement instead of packaged cement.

1. Introduction

Global climate change due to human activities has received considerable attention all over the world [1,2,3]. The Intergovernmental Panel on Climate Change (IPCC), in its fifth assessment report, stated that the impact of humans on the climate system is obvious and constantly increasing, and various effects have been observed on all continents. The IPCC also argued to limit the increase in the global temperature below 2 °C with significant and sustained reductions in greenhouse gas (GHG) emissions [4]. The carbon footprint, as a quantitative expression of GHG emissions from activities, aids in emission management. It is conceptually viewed as a global warming potential (GWP) indicator and is a tool to guide relevant emission cuts and verifications [5]. By quantifying the emissions of a specific product or process, the main sources of the emission can be identified, providing an opportunity for environmental efficiency improvements and cost reductions. Since the late 1980s, China has become the largest developing country in the world and has undergone significant changes in terms of industrialization and urbanization [6]. Fast development is often accompanied by environmental and social problems. Due to the processes of industrialization and urbanization, China has become a huge consumer of energy and the biggest emitter of GHGs, such as CO2 [7].
Cement manufacturing is an energy-intensive industry, consuming approximately 12–15% of the total energy consumption of a country [8]. Additionally, it is one of the largest anthropogenic CO2 emitters, accounting for 5–7% of total anthropogenic CO2 emissions [9]. From 1985 onward, China’s cement production has ranked first in the world [10], accounting for 57.28% of world production in 2018 [11]. However, this large industry in China is facing challenges due to low profit, excessive production capacity [12], and heavy pollution on the environment [13]. The large-scale CO2 emissions associated with the increase in cement production has raised concerns regarding its environmental impact. Prior research has concentrated on sustainable development strategies for the cement industry on the improvement of the clinker production process, energy reduction and carbo dioxide emission reduction. For the clinker production perspective, the introduction of modified low-energy clinkers as well as the modern clinker cooler can reduce the energy requirement and increase the energy efficiency [14,15]. Furthermore, the clinker process can be more sustainable by laying the foundation for recycling or reducing the waste heat loss [16]. For the energy reduction perspective, efficient kiln drivers, heat recovery for power generation, the use of high-pressure grinding rolls and vertical roller mills can bring effective energy reduction during cement production [15,17]. For the carbon emission reduction perspective, the increased use of bio-fuels as a substitute for traditional fuels, CO2 capture and storage technology and the use of blended cement (clinker is substituted with other materials) instead of traditional cement can reduce CO2 emissions [10,17,18]. Controlling capacity use is also a good method for CO2 reduction [9]. Currently, the carbon emissions in the cement industry stem mainly from the burning of the clinker (calcination of calcareous raw material and combustion of fossil fuels), which is responsible for 90–95% of all CO2 emissions during cement production [19]. Thus, carbon emission reduction in the cement industry mainly relies on the improvement of clinkers or clinker substitution technologies [20,21]. However, efforts by traditional industries, especially in developing countries, are approaching the limits of what they can do. The new clinker technology is not practical, especially for present-day China. The technology to develop new calcination methods to abandon traditional clinkers is not yet mature, and the cement industry may lose its advantages of low cost and the ease of production when this new technology is introduced.
Many methods for carbon emission reduction in the cement industry have been applied, but little is known about packaging in the industry. Packaging is an indispensable part of both the intermediate and final products in industrial production. However, prior studies mainly focused on the carbon emissions of single raw packaging materials, such as polypropylene (PP) and polyethylene (PE). The lack of research into the relevance and combination of these materials (packaging) poses challenges for carbon emission reduction in packaging. The peak cement production is predicted to occur in 2015–2020 [22]. After 2020, the consumption is expected to be stable at approximately 0.8 billion tons every year [23]. With the large amount of cement use, the volume of carbon emissions embodied in the use of packaging is tremendous, and solving this issue has been problematic.
Previous studies have attached importance to the carbon emissions of packaging. Some researchers have proven that the environmental impact of packaging is substantial and serious. For example, Robertson et al. assessed the carbon emissions of kiwifruit packaging from New Zealand to Japan and Germany using life cycle assessment (LCA) methodology, and estimated the carbon footprint of kiwifruit packaging and transport to range from 0.33 to 0.67 kg CO2 per kilogram depending on the pack type and market [24]. Liu et al. investigated the carbon emissions of beer packaging during the whole life cycle, including the production from the raw material, packaging process, transportation, consumption, and recycling using a mixed LCA methodology. The result showed that the total carbon emissions of each glass brewage packaging vessel is 489.867 g across the whole life cycle, and the production process accounts for 74.3% of the total carbon emissions [25]. Wang introduced LCA modeling to assess the carbon emission of AI-PE-Pa complex packaging and the result showed that more than 80% of GHG emissions of the AI-PE-Pa complex packaging were from the production of paper, aluminum foil, and plastic [26]. Choi et al. measured the carbon footprint of packaging films made from LDPE, PLA, and PLA/PBAT blends with three waste scenarios using LCA methodology [27].
In 2016, China’s cement production reached 2.397 billion tons, decreasing to 2.316 billion tons in 2017 [
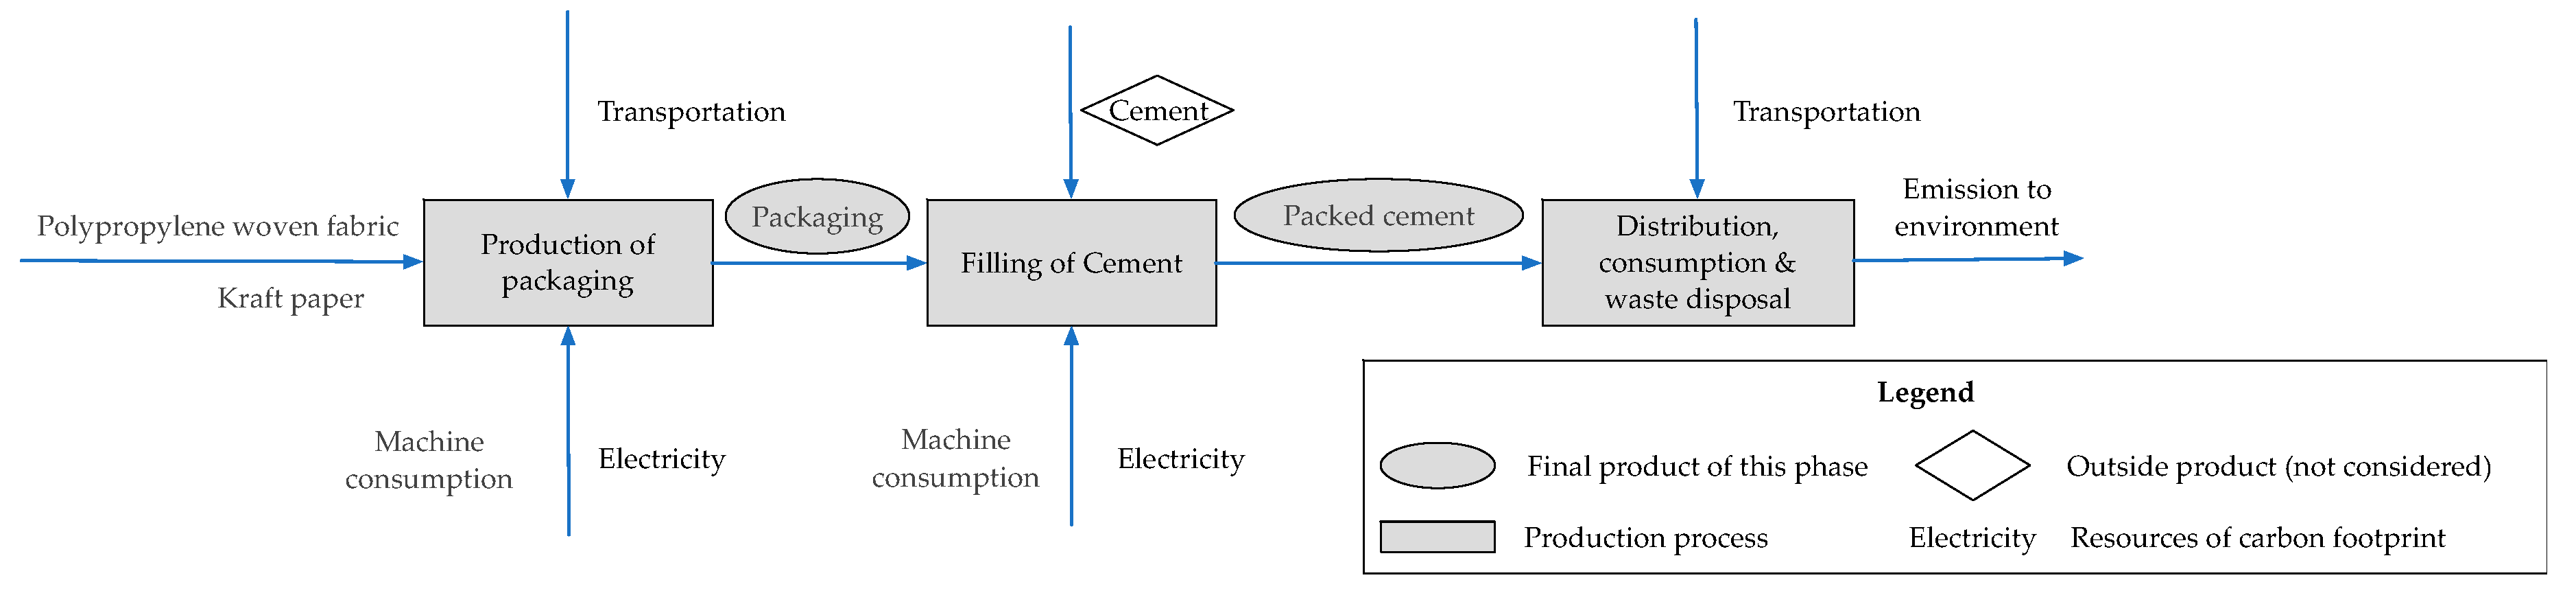
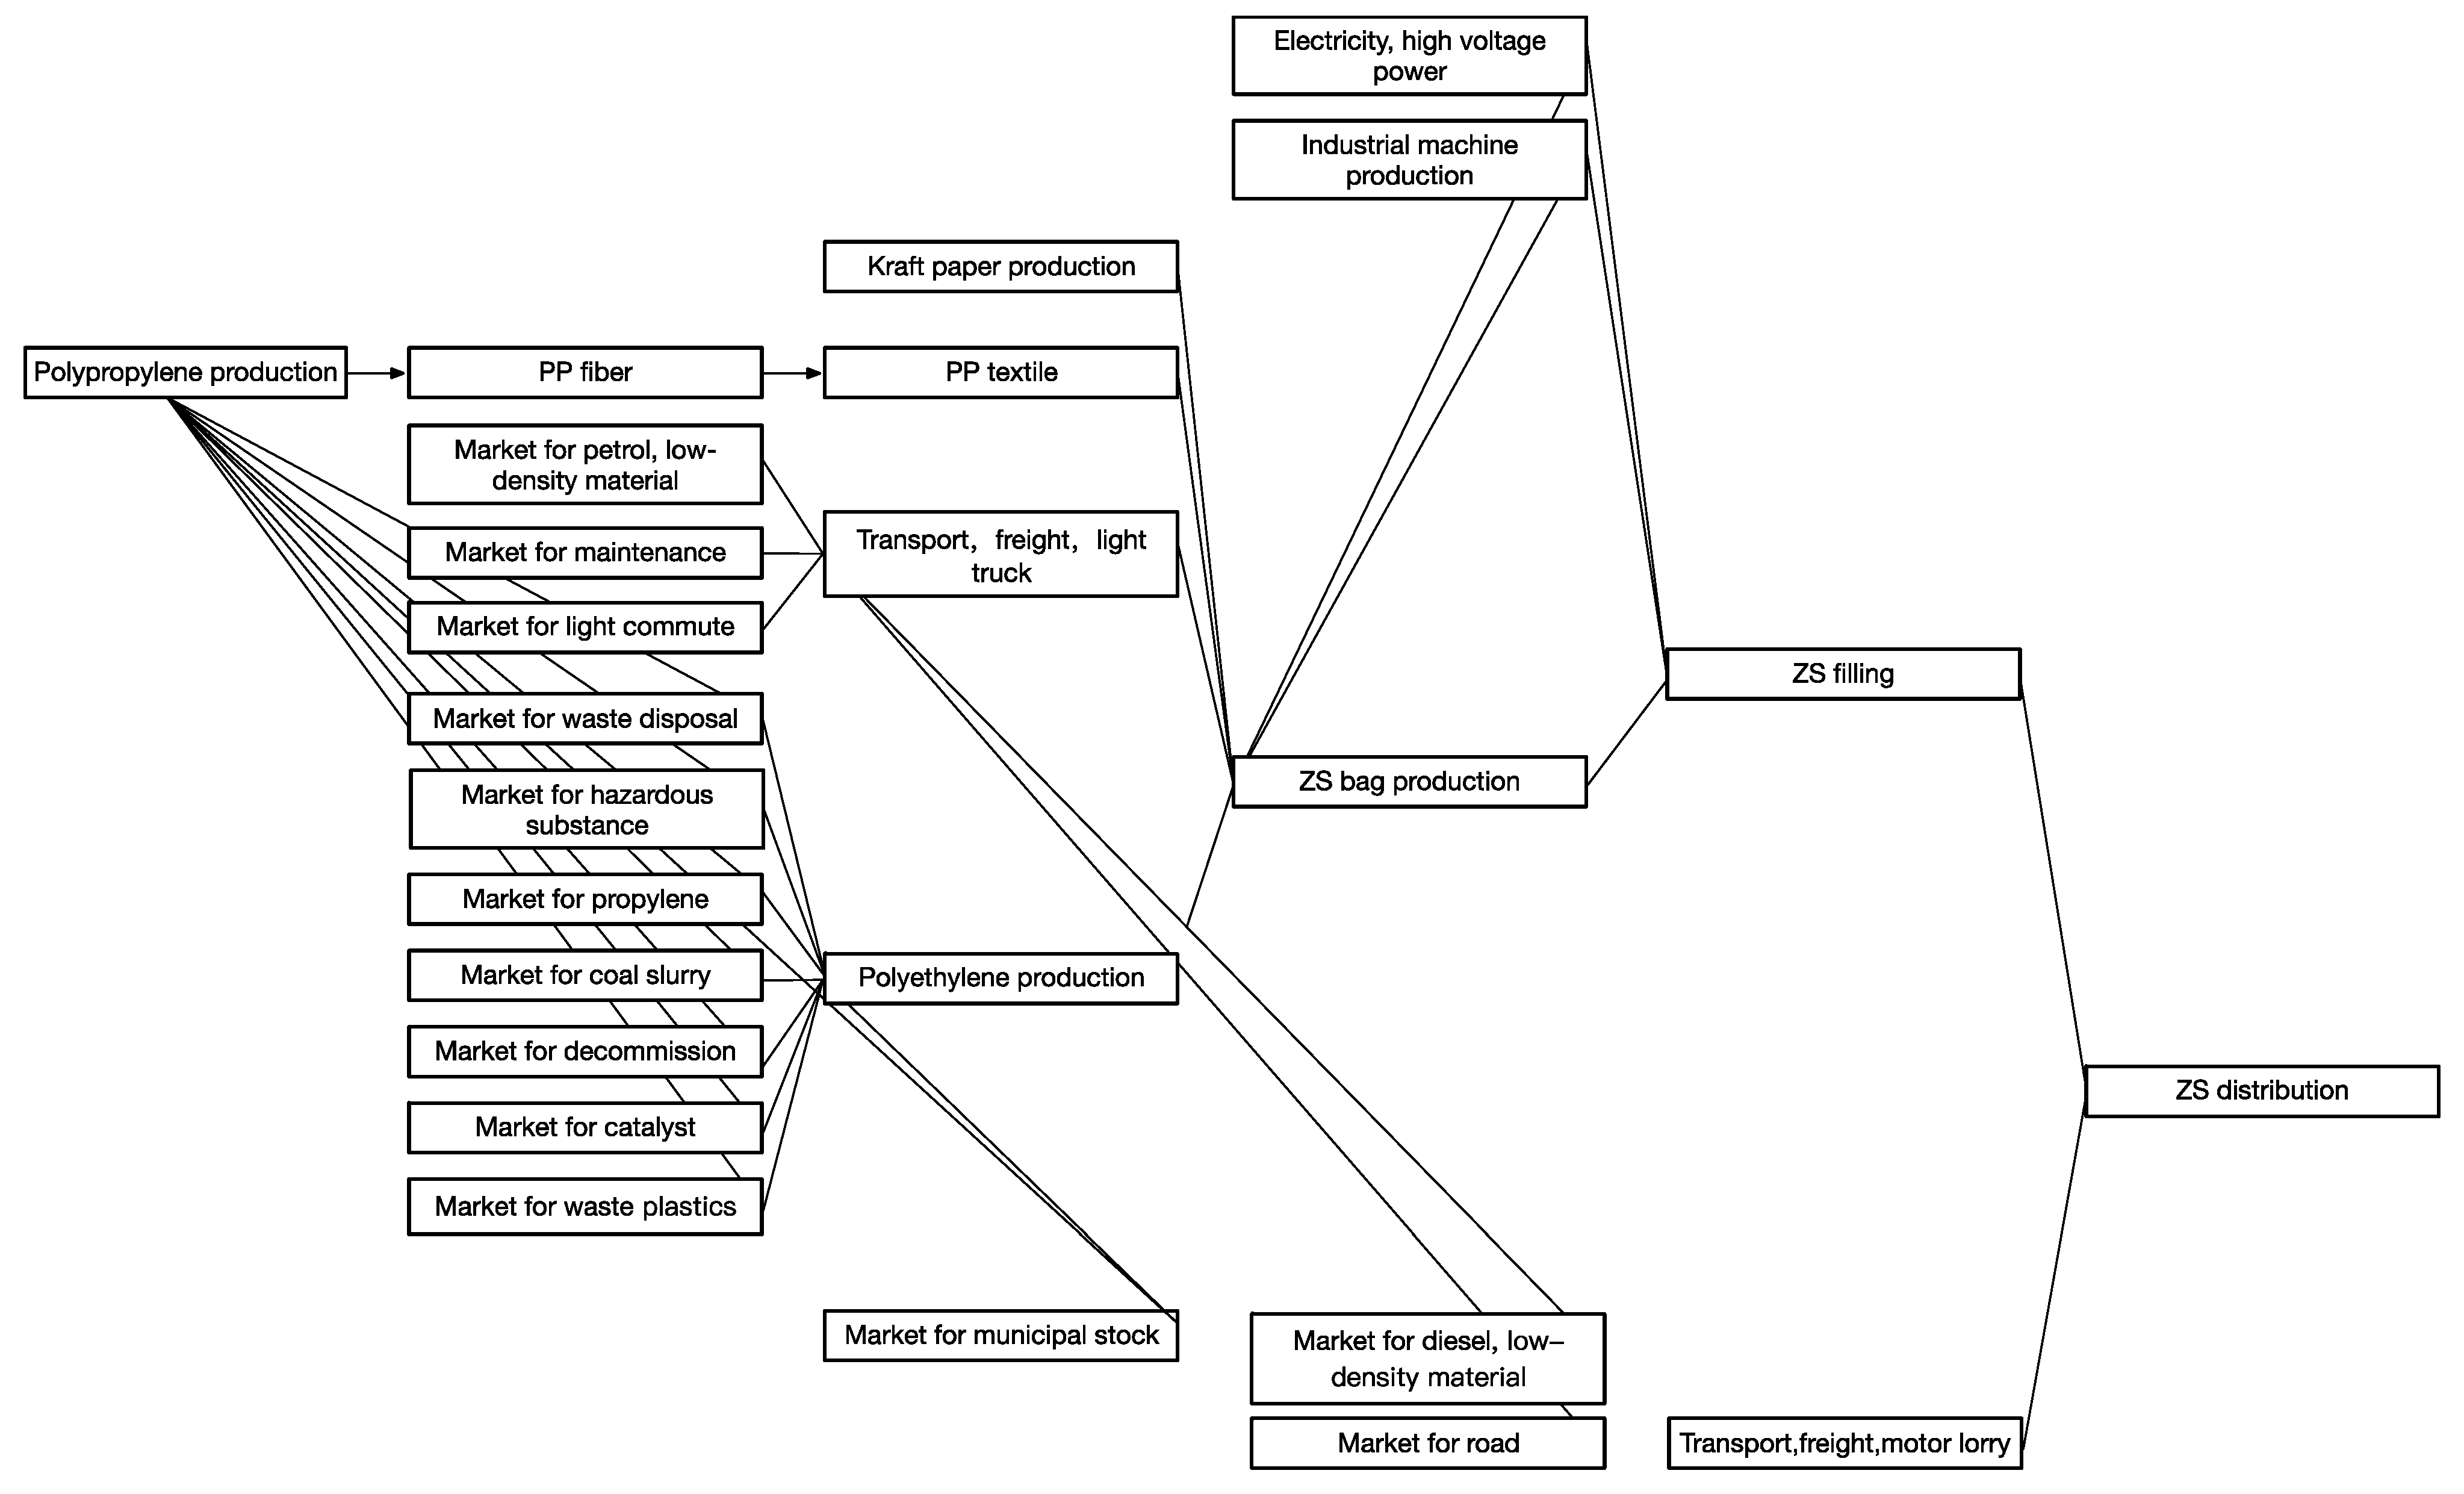
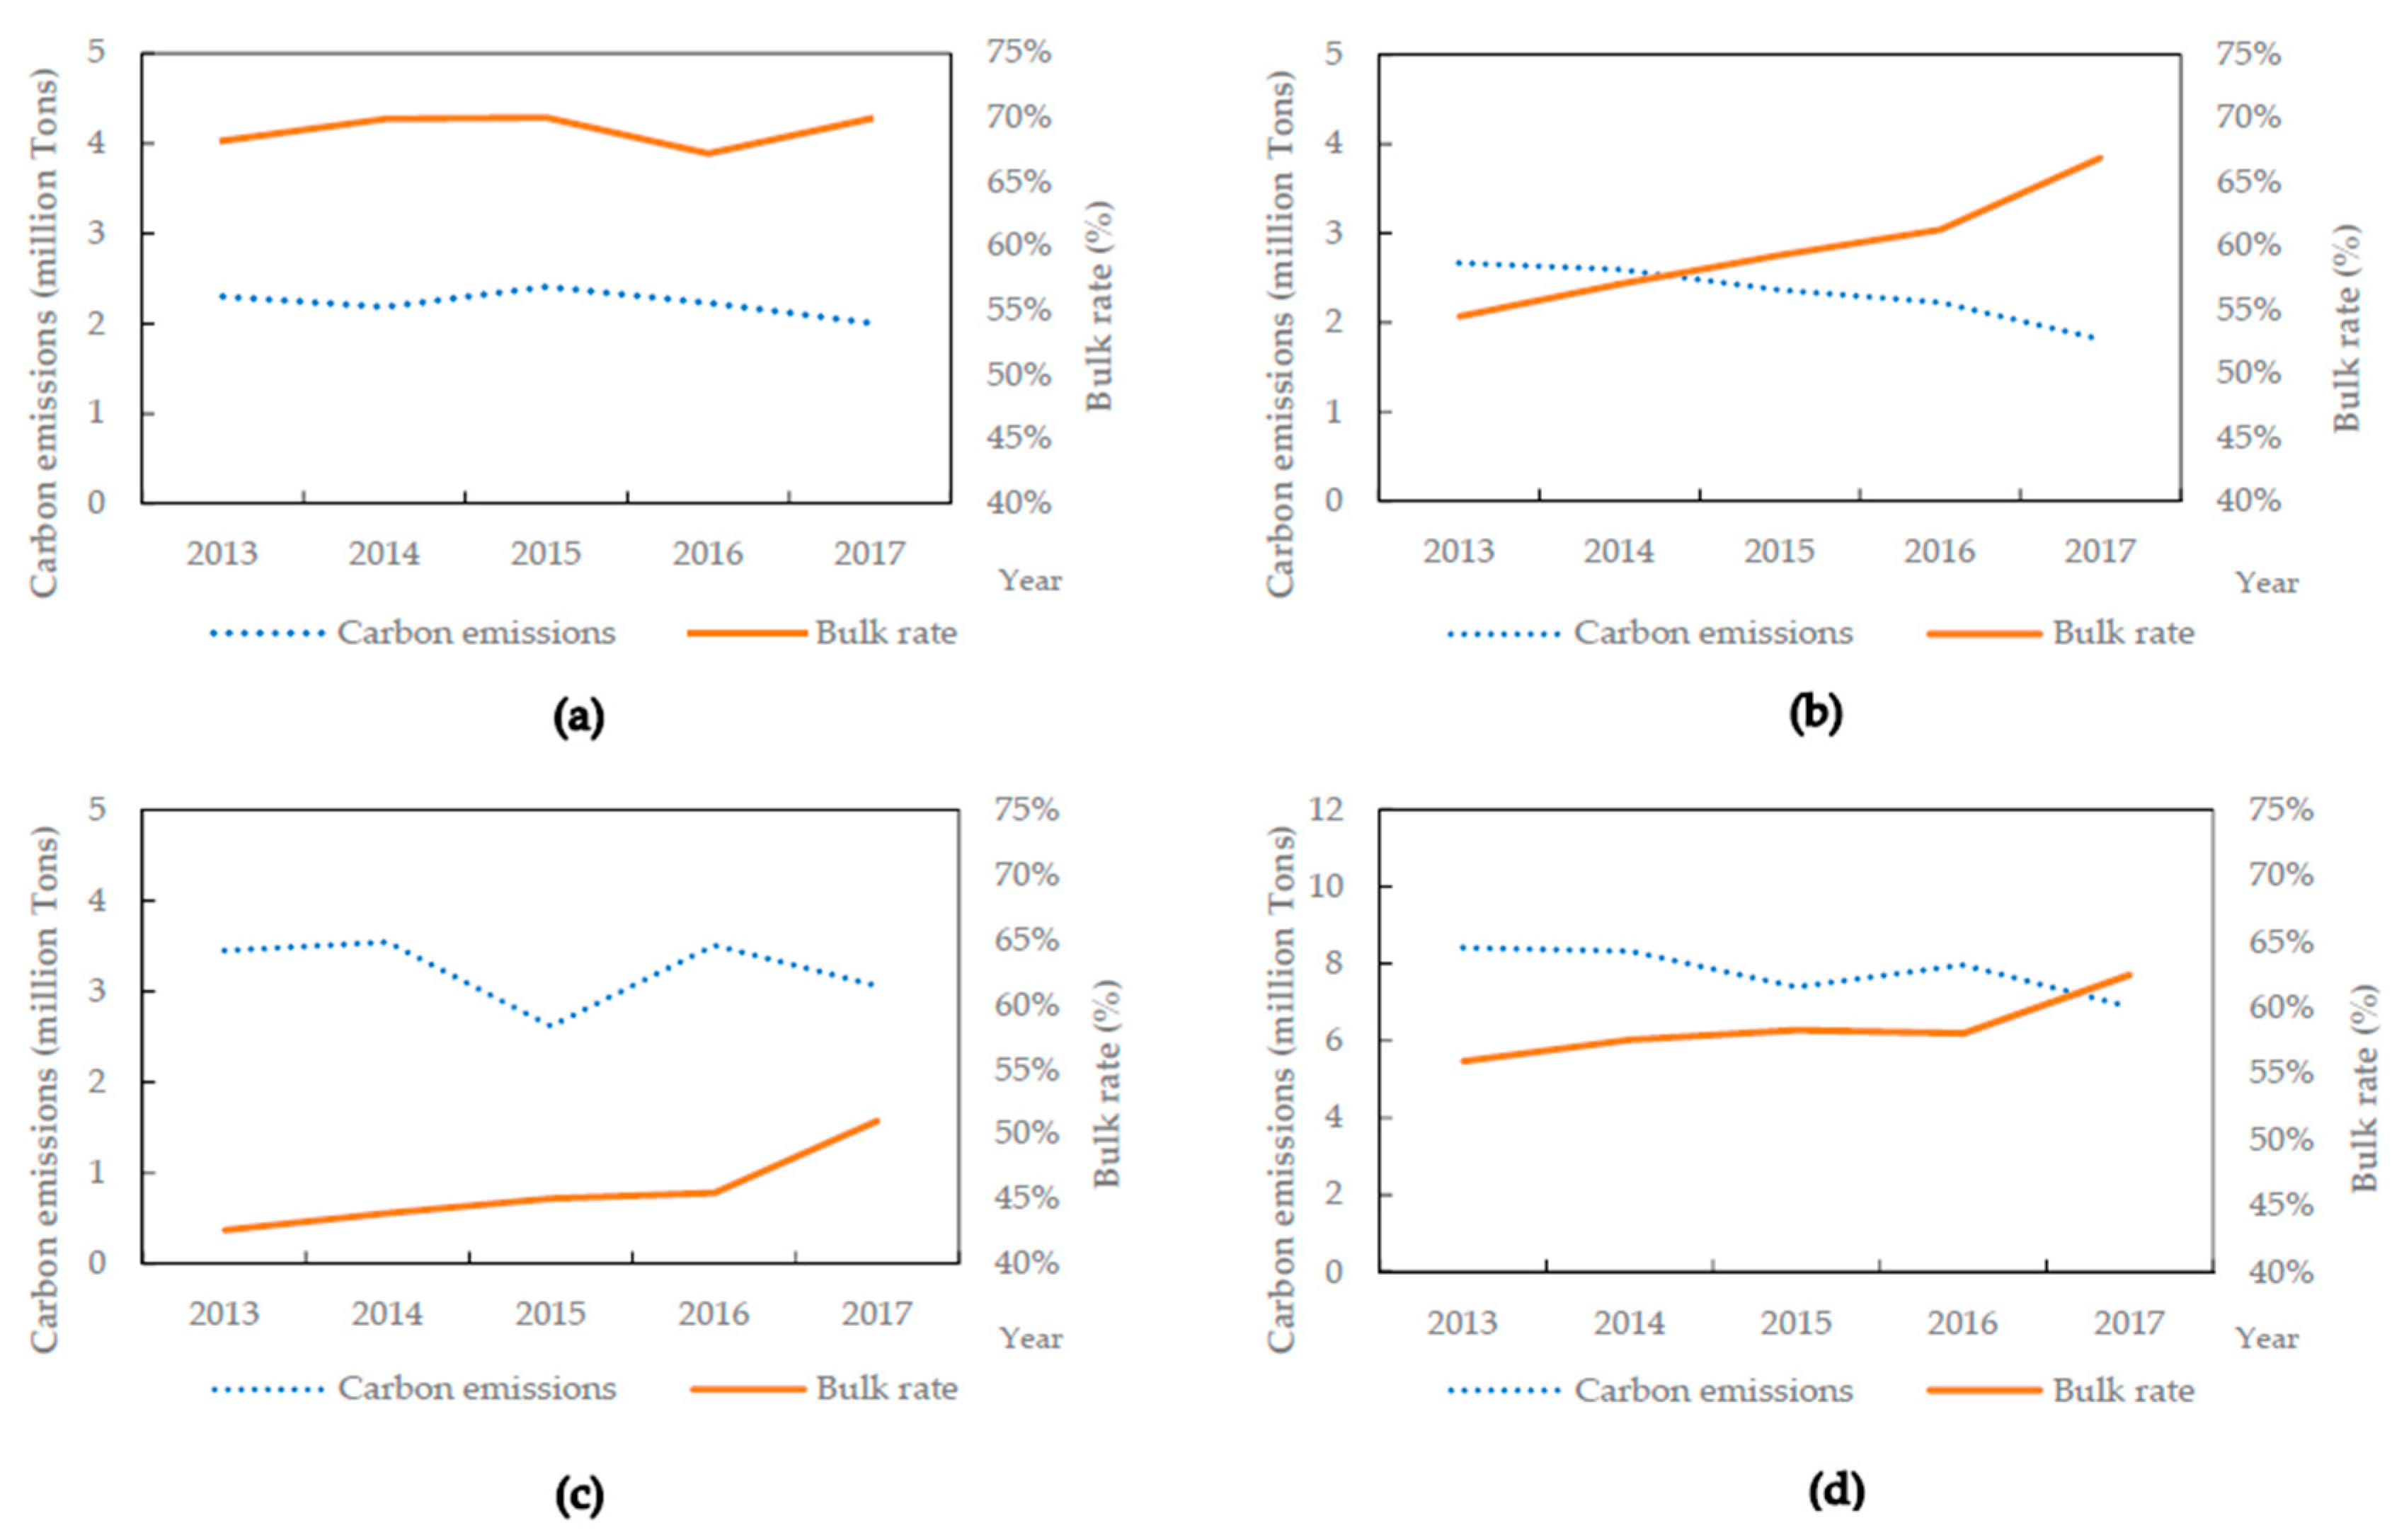
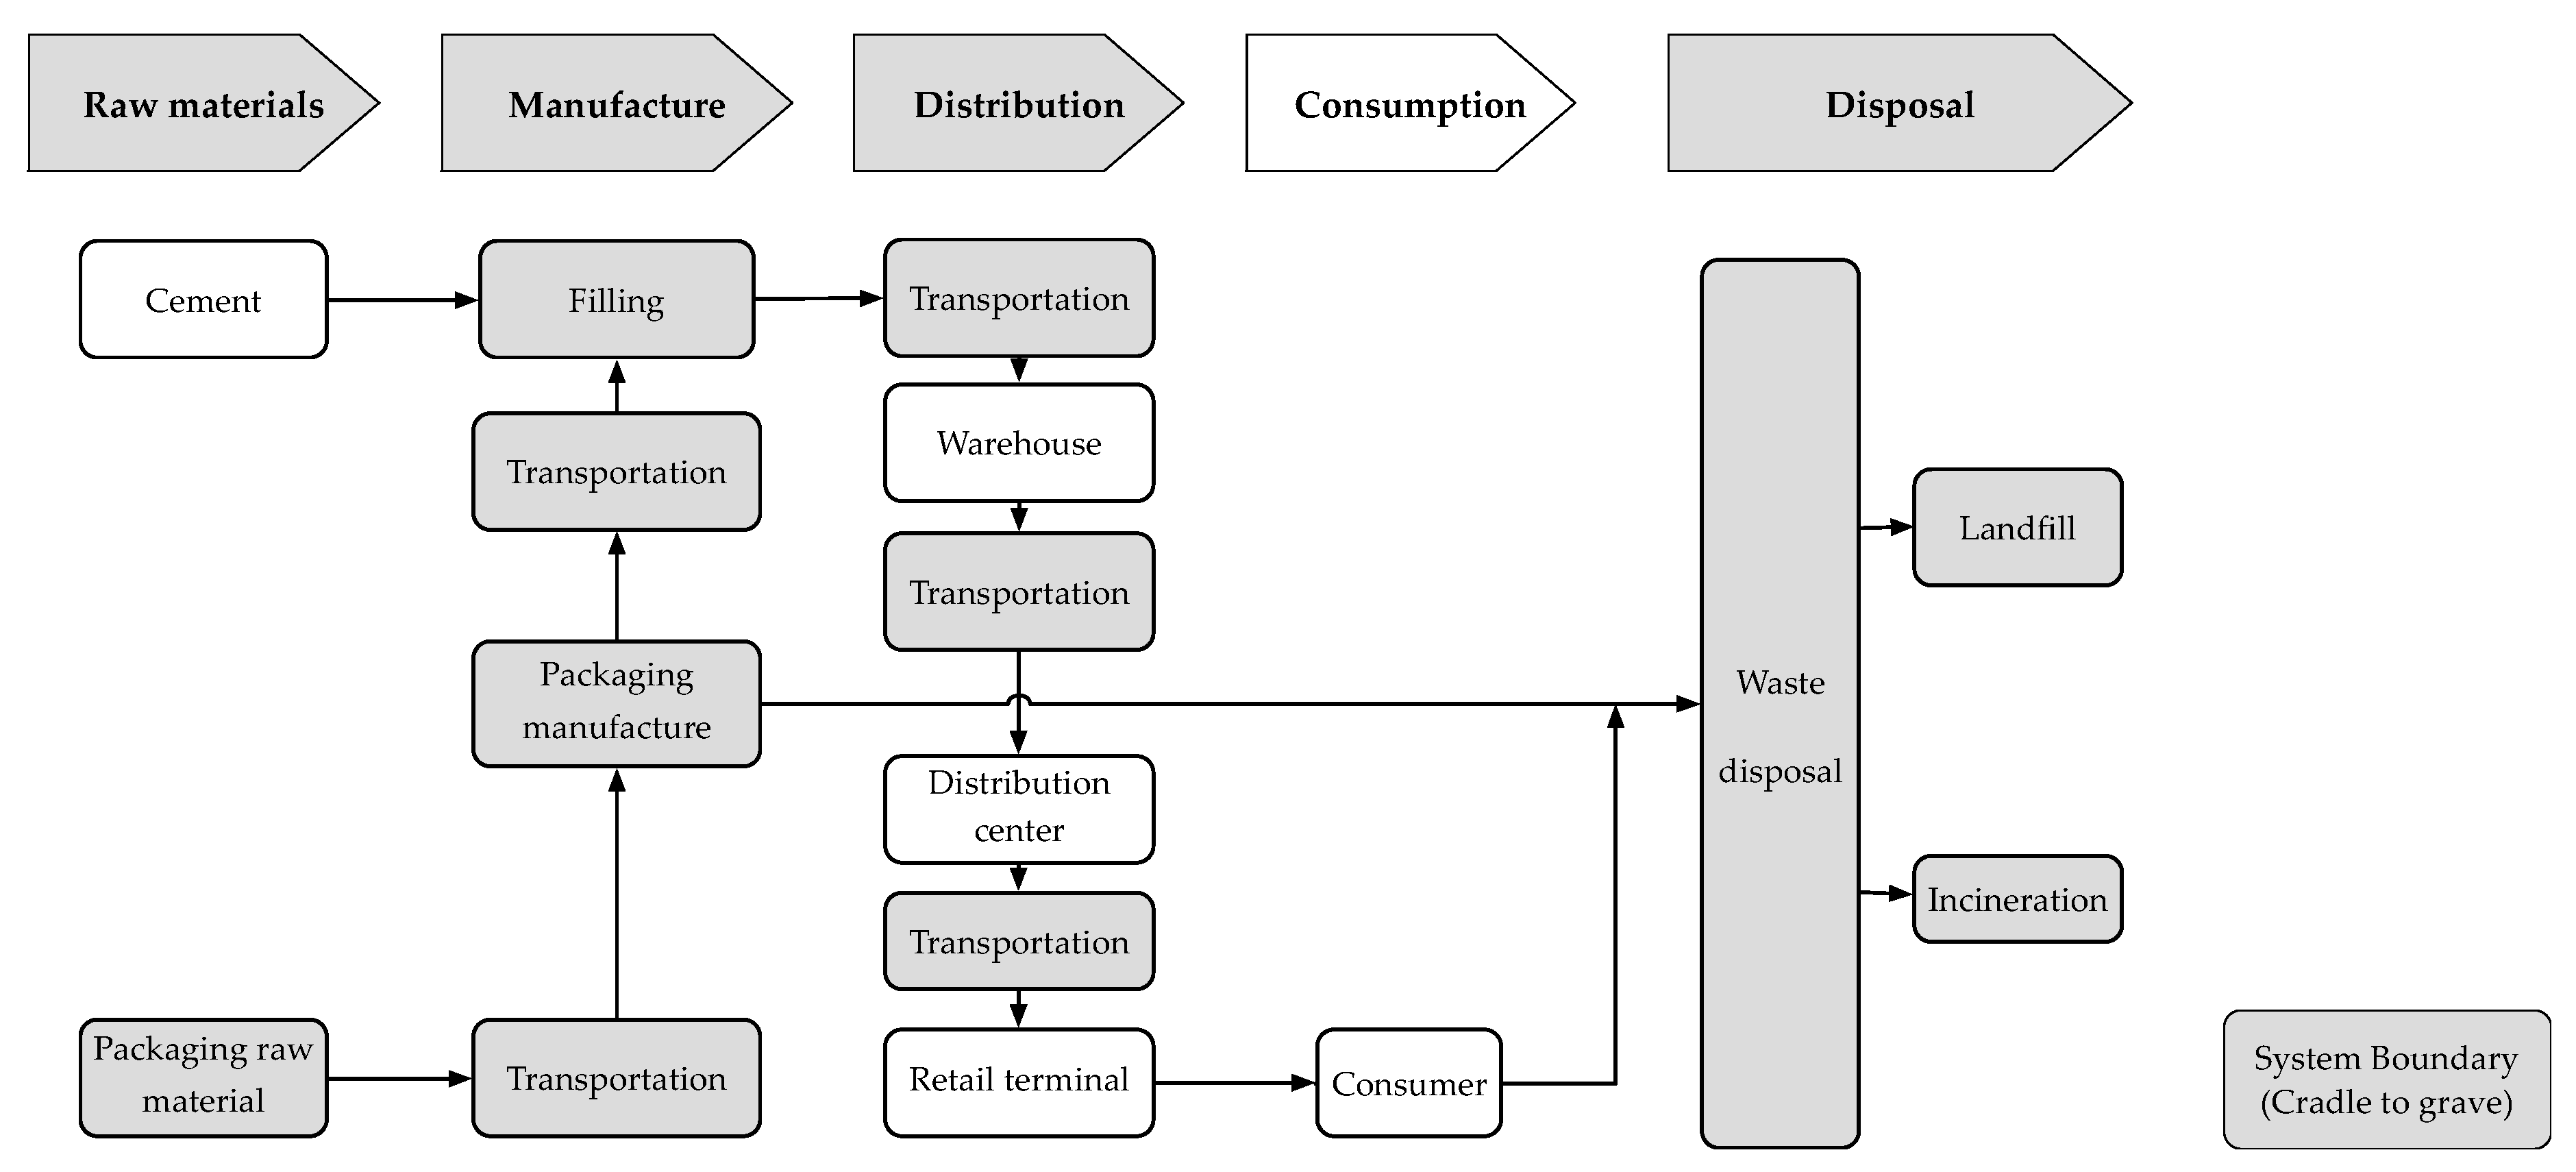
28]. Apart from the 1.448 billion tons of bulk cement that did not require packaging, 17.369 billion bags were needed in 2017, assuming that the other 0.868 billion tons of the cement were packed at 50 kg/bag. The cement industry is producing high amounts pollution and is unable to renovate the current clinker technology. Thus, this paper proposes a new carbon emission reduction measurement for cement manufacturers to realize low carbon development and reduce carbon emissions in cement packaging. The purpose of this study was to quantify the carbon emissions of cement packaging using the life cycle assessment approach. Using inventory analysis, the carbon emitted into the environment from the material consumption, energy consumption, and waste disposal in cement packaging were determined. By defining three kinds of popularly-used packaging, the carbon emissions of different types of packaging and suggestions provided for cement manufacturers were determined. By comparing the carbon emissions of different regions in China with different bulk rates, the relationship between the bulk rate and carbon emissions of cement packaging was clarified. Based on the results, some countermeasures are proposed for emissions reduction in China’s cement packaging industry.

2. Materials and Methods

The main methods for measuring embodied carbon emission are the input–output analysis (IOA) and life cycle assessment (LCA) [29]. This study uses LCA methodology to estimate the carbon emission of cement packaging produced and used in China. The LCA approach is bottom up and it is more convenient to use LCA methodology for the circumstances of calculating the embodied carbon emission of a certain product or small entities as it separates the emission sources into different categories. LCA methodology evaluates the environmental impacts of a product from the cradle to the grave. It considers the entire life of a product including the raw material, energy, material production, manufacturing, the use and end-of-life treatment, and final disposal, providing an effective approach to investigate the potential environmental burden. LCA covers all the energy and resources required in all phases of the life cycle to estimate the emissions to the environment resulting from pollutants and provides opportunities for environmental management [30,31]. Initial attempts have used LCA to determine the carbon footprint of the passenger car series [32], Si and CdTe photovoltaic modules [33], lighting systems and road pavements [34], as well as a highly diverse vegetable multi-cropping system [35].

2.1. Goal and Scope

The main goal of this study was to quantify the carbon footprint of three kinds of the most commonly used cement packaging produced and consumed in China. The carbon emissions of different packaging and different production phases using LCA were compared. The scope of this study was the emissions over the entire life cycle of cement packaging.

2.1.1. Functional Unit

The functional unit used in this study is defined as a packaging of 50 kg standard cement. Cement in this research was packaged in accordance with the national standard GB9774-2010, sacks for packing cement [36]. According to the material used, packaging can be divided into paper bags, laminated plastic woven bags, and paper–plastic composite bags, and can also be divided into sticking-mouth bottom bags and bottom-seamed bags according to the production process. The most commonly used cement packaging types in China are paper bags, laminated plastic woven bags, and paper–plastic composite bags [37]. This study is based on these three types of packaging. The basic production processes of each packaging type are as follows:
(1)
Paper bag: made from unbleached Kraft paper;
(2)
Laminated plastic woven bags: A PP woven fabric is used as a base material, and the PP granules are melted and coated with the surface of base material forming a two-in-one material packaging bag;
(3)
Paper–plastic composite bag: The outside is composed of refined white Kraft paper or yellow Kraft paper, and the inside is composed of plastic woven cloth with melted PP or PE plastic granules at high temperature and high pressure. Finally, Kraft paper and plastic woven fabric are combined to form a three-in-one bag.

2.1.2. System Boundary

The system boundary is described in Figure 1. The cradle-to-grave includes four stages: raw material, manufacture, distribution and final disposal. The raw material stage included the manufacturing of raw material for packaging. The manufacturing phase produced cement packaging as well as filling of cement. The distribution part included transportation to the warehouse, distribution center, retail terminal and then to the consumer. In the disposal stage, landfill and incineration are considered as main waste treatments.
According to the limits of our research and the data availability, the packaging life cycle process was divided into three main phases: packaging production, cement filling and distribution, consumption and waste disposal of packaging. The emissions at each phase were calculated from the emissions corresponding to the input and output of the process, which do not include the emissions of the cement itself, as shown in Figure 2. Finally, the PP and PE, Kraft paper, machine consumption in the production of packaging and filling of cement, electricity consumption in the production of packaging and filling of cement, the transportation of raw material and final production, final disposal are the main study items in this research.
The measurement of the product’s carbon footprint was based on a life cycle approach to assess potential GHG emissions and was conducted according to IPCC2007. The corresponding life cycle accounting guidelines, ISO 14040 [30] and ISO 14044 [31], were used to assess the impact of global climate change for a time horizon of 100 years.

2.1.3. Assumptions and Data

The data were obtained from relevant national standards, local standards, technical parameters of industrial equipment, and statistical values from the professional database of Gabi education software (version 6.0) and the ecoinvent3_1_cutoff database [38] which are commonly used in life cycle assessment. Some industrial data were replaced by the current world average or the value for the same technical level in China due to the inability to obtain actual measured values or missing statistical values.
Since some data did not include accurate measurements, some assumptions were necessary:
(1)
All electricity used is from the grid. The carbon emissions data were taken as the national average of electricity emissions;
(2)
Transportation data are the average for diesel vehicles using Euro 3 emission standards;
(3)
All materials are not recycled. The recycled materials used are from the recycling market, and the cement packaging is not part of the recycling procedure, i.e., there is no recycling loop for the material itself;
(4)
During the iteration of calculation, if mutual use exists between the two products, the limit value is calculated using a fixed consumption ratio;
(5)
The relevant general and special mechanical equipment has a service life of 25 years. The life cycle of the production equipment is calculated on the average of the non-specific equipment instead of calculations by specific mechanical equipment;
(6)
The amount of packed cement is calculated by excluding the bulk cement in total cement production. The total amount of bulk cement is obtained according to the proportion of bulk cement in each region, then the total amount of required packaging with 50 kg cement/bag can be obtained; and
(7)
The final treatment of cement packaging is incineration. The transportation of waste is neglected. All materials and the energy consumption of the disposal process are not included in the model.

2.2. Inventory Analysis

This study divided cement packaging into paper bags, laminated plastic woven bags, and paper–plastic composite bags based on the material or production process. OpenLCA v1.4 beta software [39] was used as the analysis tool. According to the production process in Figure 2, the model structure of the paper–plastic composite bag is shown in Figure 3.

2.2.1. Material Consumption

The most-consumed raw materials in cement packaging production are PP, PE and Kraft paper. According to the available data, PP and PE granules are obtained from the market, then processed into plastic woven fabrics, and finally used in the production of packaging. The electricity consumed in processing is obtained from the electricity market.
According to the local standard DB33/803 [40], plastic woven bags have a mass per unit area of 90 g/m2. The GB9774-2010 [36] standard specifies the physical properties of materials. The mass per unit area of the fresh material is ≥65 g/m2 for paper–plastic composite bags, ≥71 g/m2 for laminated plastic woven bags, and ≥6 g/m2 for laminated materials in laminated plastic woven bags. The quality requirement for mass per unit area of standard products in the national standard is 38.46%. The mass per unit area of each constituent material was obtained according to this ratio. The mass ratio of various materials of paper–plastic composite bags was calculated according to patent CN104313713A [41] i.e., PP: 80–85% and PE: 3–5%. The area of material of various packaging bags was calculated on the basis of the design requirements of the cement packaging according to the GB9774-2010 standard [36]. The consumption of the material and the corresponding unit area quality are shown in Table 1.
The technical standard for a Kraft paper bag is GB/T 7968-1996 [42]. Kraft paper is obtained from the market and used in paper bags and laminated plastic woven bags at 64.62 g and 59.06 g per bag, respectively (Table 2).
As shown in Table 2, both PP and PE granules are consumed in the production of the laminated plastic woven bags and paper–plastic composite bags. The woven fabric base material and coating material of the laminated plastic woven bags are all derived from the PP granules, the woven fabric base of the paper–plastic composite bag is derived from PP granules, and the coating material is derived from PE granules. According to the design requirements of bottom-seamed bags, the PP base material consumption is 73.83 g for the laminated plastic woven bags and 59.06 g for the paper–plastic composite bag, and the consumption of the melting material and coating material is 6.48 g and 3.51 g, respectively, without consideration of loss from the intermediate procedures.
Losses occur in the general and special machines used for the production of PP flat yarn, PP woven fabric spinning, etc. Assuming that the depreciation period of the machine is 25 years, the machine quality loss in each phase is 1.33 × 10⁻⁶ kg based on the average of the quality consumption and Ecoinvent database. The corresponding carbon emission data were obtained from Ecoinvent.

2.2.2. Manufacturing

Production Input and Output

The input materials vary for different cement packaging types during the manufacturing phase. According to the previous assumptions and data, the input material of the paper bag is unbleached Kraft paper, electricity, and the packaging production machine, and the output is a standard paper sticking-mouth bottom bag. The input material of the laminated plastic woven bag is PP woven fabric base material, PP coating material, electricity, and the packaging production machine, and the output is a standard bottom-seamed laminated plastic woven bag. The input of the paper–plastic composite bag is unbleached Kraft paper, PP woven fabric base material, PE coating material, electricity, and the packaging production machine, and the output is a standard paper–plastic composite bag (Table 2).

Consumption of Electricity

Electricity in all regions of China is not directly supplied by electricity producers to consumers. Cement manufacturers can only accept the supply of electricity passively. Therefore, the carbon emissions of the energy consumed can only be taken from the average carbon emissions of domestic electricity. The figures of the electrical carbon emissions for this article were derived from the professional database of Gabi. According to the local standard of Zhejiang province (DB33/803—2013) [40], the quota of electricity consumption per comparable unit production for plastic woven sack is required to be not more than 1700 KWh/t. This study used the highest limit of the standard and calculated the power consumption of a single standard cement bag based on the material quality of a single bag. The electricity consumption of a paper bag is 0.120 KWh, 0.137 KWh for laminated plastic woven bag, and 0.124 KWh for a paper–plastic composite bag (Table 2).

Transportation of Raw Material

Given the similarity of the competition in the chemical, paper making, and the cement industries, the transportation distance of the packaging materials is 400 km on average. The packaging materials (Kraft paper, PE, etc.) are low-density materials, and the transportation is conducted by light trucks (Table 2).

2.2.3. Filling and Distribution

Electricity Consumption in Filling Phase

Differences exist between the size, operational principles and efficiency of the cement packer in different manufacturers. Three rotary packers were selected to represent the current national filling level and the average filling power consumption was calculated according to its parameters. The parameters are shown in Table 3.
The arithmetic mean of the three rotary packers were calculated according to the above parameters to obtain a power consumption of 0.018 KWh in the filling process of one pack of cement (Table 2).

Transportation of Production

The cement market in China is highly regional. In the eastern coastal areas, for example, the East China Plain, the sales radius of cement products can be more than 500 km. However, for the mountainous areas of the central and western regions, the sales radius of cement products is generally approximately 250–300 km (railway transportation can extend to 500 km), and the suitable radius should be in the regional market, which is within 200 km [43]. The transportation to the cement filling site is ignored after the cement packaging bag is completed. The Euro 3 emission standard was adopted for the transportation process and 16–32 ton diesel vehicles. The corresponding emission levels of the vehicle were obtained from the Ecoinvent database. The traffic volume used here is the product of the weight of the packaging and the transportation distance which excluded the weight of the cement.

2.2.4. Waste Management

After the consumption of the cement, the packaging is disposed via natural degradation (landfill) or incineration. Kraft paper degrades naturally, whereas PP and PE cannot. Given the lack of data regarding CO2 emissions during the disposal of PP and PE, the theoretical unit mass emission factor for disposal of PP and PE is 3.1429 g based on the carbon content. The energy consumption related to CO2 emissions for Kraft paper was calculated using the calculation methodology and carbon emission coefficients adopted by the IPCC report. The emission factor of unit mass is 1.4954 g. The emissions of each single packaging are shown in Table 4.

3. Results

The analysis results of paper bags, laminated plastic woven bags and paper–plastic composite bags are shown in Supplementary Materials.

3.1. Life Cycle Impact Assessment (LCIA) on Cement Packaging Carbon Footprint

The life cycle impact assessment (LCIA) was carried out to study the carbon footprint based on the IPCC2007 method using OpenLCA v1.4 beta software. The IPCC2007 method is used to assess the impact on globe warming of varies GHG created by IPCC. The results include GWP 20a, GWP 100a and GWP 500a, indicating the impact in the short, middle and long term, respectively. The final results in this study are expressed as GWP for a time horizon of 100 years, i.e., GWP 100 in the form of kg CO2 equivalent to assess the impact in a middle term.
In real conditions, cement packaging is generally discarded after being consumed. Kraft paper is naturally degradable, but the plastic cannot degrade during the evaluation period. Therefore, in the calculation of the greenhouse effect, the combusted plastic was considered.

3.1.1. LCIA on Packaging Level

The GWP results of the three kinds of investigated packaging are shown in Figure 4. The laminated plastic woven bag is the biggest emitter compared with paper bags and paper–plastic composite bags. The laminated plastic woven bag had a GWP value approximately 30 times higher than the paper bag. The paper bag is the most environment-friendly packaging. For laminated plastic woven bag and paper–plastic composite bag, the GWP of the electricity consumption, coal mine operation and transportation are almost the same. However, the waste management of the laminated plastic woven bag and production of PP granules are much higher than the paper–plastic composite bag. The main component of laminated plastic woven bags is PP. Laminated plastic woven bags are directly discarded after being used. Under thorough manual treatment, the CO2 emission of a fully-disposed laminated plastic woven bag is 0.241 kg CO2 eq, with 0.2215 kg from the base material and 0.0194 kg from the coating material. The CO2 emissions generated by the complete decomposition far exceed the emissions during each production phase.
The total carbon dioxide emissions of paper bags, laminated plastic woven bags, and paper–plastic composite bags are shown in Table 5, Table 6 and Table 7, respectively.
The GWP 100 of a paper bag is 0.022 kg CO2 eq/bag. The carbon footprint is mainly derived from the production phase, including the consumption of electricity (combustion of hard coal and the mining of hard coal for generation of electricity), and the production of Kraft paper. The discharge of light trucks for raw material and heavy vehicles for the final product also take a large proportion. The waste disposal of a paper bag is natural degradation, i.e., landfill, which emits 0.003 kg CO2. The paper bag seems to be the most environment-friendly cement packaging.
The GWP 100 of a laminated plastic woven bag is 0.637 kg CO2 eq/bag on the condition that it is incinerated manually instead of being thrown away without any treatment. As indicated in Table 6, the main sources of the carbon footprint are waste disposal (emissions to environment by incineration), the production of PP material and electricity consumption. The laminated plastic woven bag consumes the most PP granules as well as PP coating material compared with paper bag and paper-plastic composite bag. This made the laminated plastic woven bag the most environment-unfriendly packaging.
The GWP 100 of the paper-plastic composite bag is 0.536 kg CO2 eq/bag on the condition that it is incinerated manually instead of being thrown away without any treatment. As indicated in Table 7, the carbon footprint is mainly derived from the production phase including the production of PP and electricity consumption. Additionally, the waste management also takes a large proportion of the total carbon dioxide emission, with 0.177 kg, 0.51 g and 0.0028 kg from PP, PE, and Kraft paper, respectively. However, the total is less than the laminated plastic woven bag. The paper-plastic composite bag can be a good choice with the consideration of both environmental sustainability and economic applicability which is discussed later.

3.1.2. LCIA of Production Level

According to the packaging bag manufacturing process, the main process source and material source of the carbon footprint can be specified, which can indicate the measures necessary for achieving carbon emission reduction. The amounts of the carbon emissions at each phase and their proportion in the production phase are shown in Table 8 and Table 9.
From Table 9, the carbon footprint of the production is mainly derived from the following phases: The two phases of electricity consumption (production of packaging and filling), the discharge of packaging materials, and the emissions from the use of light trucks during the transportation of raw material for packaging.

3.2. Carbon Footprint of China’s Cement Packaging

3.2.1. Packaging Carbon Footprint in Regions of China—Laminated Plastic Woven Bags

In 2017, China’s cement production was 2.316 billion tons. Other than the 1.448 billion tons of bulk cement without packaging, 17.36 billion bags were needed in 2017 assuming that the other 0.868 billion tons of the cement were packed at 50 kg/bag. On the condition that all the packaging is disposed by landfill or incineration, the carbon footprint of a single packaging is between 0.022 kg CO2 eq (paper bag)–0.637 kg CO2 eq (laminated plastic woven bag), the maximum carbon emission of cement packaging in 2017 will be up to 11.06 million tons.
The average transportation distance in the eastern region is 250 km and 150 km in the central and western regions. The average bulk rates of cement in the eastern, middle, and western regions were 69.94%, 66.91%, and 51.04% in 2017, respectively. This section outlines the calculation of the carbon footprint of China’s cement packaging using the most widely used laminated plastic woven bag.
Packed cement is transported by heavy-duty vehicles with a large carbon footprint, however, most emissions during this are due to the cement rather than packaging. Whereas the carbon footprint of this part is not negligible relative to the life cycle of the packaging, for the transportation distance of 150 km (middle and western regions), the CO2 emission was 1.66 g per paper bag, 2.06 g per laminated plastic woven bag, and 1.87 g per paper–plastic composite bag. For the transportation distance of 250 km (eastern region), the CO2 emission of the different packaging types in the transportation were 2.77 g, 3.43 g and 3.12 g, respectively. Therefore, the carbon footprint of the packaging in the middle and western regions was 0.39649 kg CO2 eq, and the carbon footprint of the packaging in the eastern region was 0.397 kg CO2 eq.
As shown in Table 10, China’s cement packaging carbon footprint totaled 6.88 million tons CO2 eq in 2017: 3.06 million tons in the west, 2.01 million tons in the east, and 1.81 million tons in the central region.

3.2.2. Changes in Packaging Carbon Emissions and Bulk Rate of Cement

From 2013 to 2017, the total production of cement in China decreased from 2.41 billion tons to 2.316 billion tons with the bulk rate increasing from 55.94% to 62.50%. The carbon emissions of cement packaging declined from 10.43 million tons to 8.53 million tons over these five years.
Figure 5 shows that the bulk rate increased while the carbon emissions declined. As shown in Figure 5a, the eastern region had the smallest carbon footprint due to the highest bulk rate. This may be the result of advanced economic development and the flatter terrain. Conversely, changes in the carbon footprint in the eastern region were the smoothest compared with the middle and western regions from 2013 to 2017. In Figure 5b, the reduction in the carbon footprint was the largest in the middle region due to the fastest increase in the bulk rate. The economic development level of the middle region in China can be categorized as medium, and the large amount of construction production consumes a large amount of cement. With the improvement in cement production technology and packaging technology, as well as the increase in the bulk rate, the amount of carbon emissions decreases year by year. In Figure 5c, the western region contributed the most to the total carbon emissions with the lowest bulk rate. This could be the result of a massive need for cement and the long transportation distance in mountainous terrain. The western region has the potential to reduce carbon emissions by improving packaging technology and increasing bulk rates.

4. Discussion

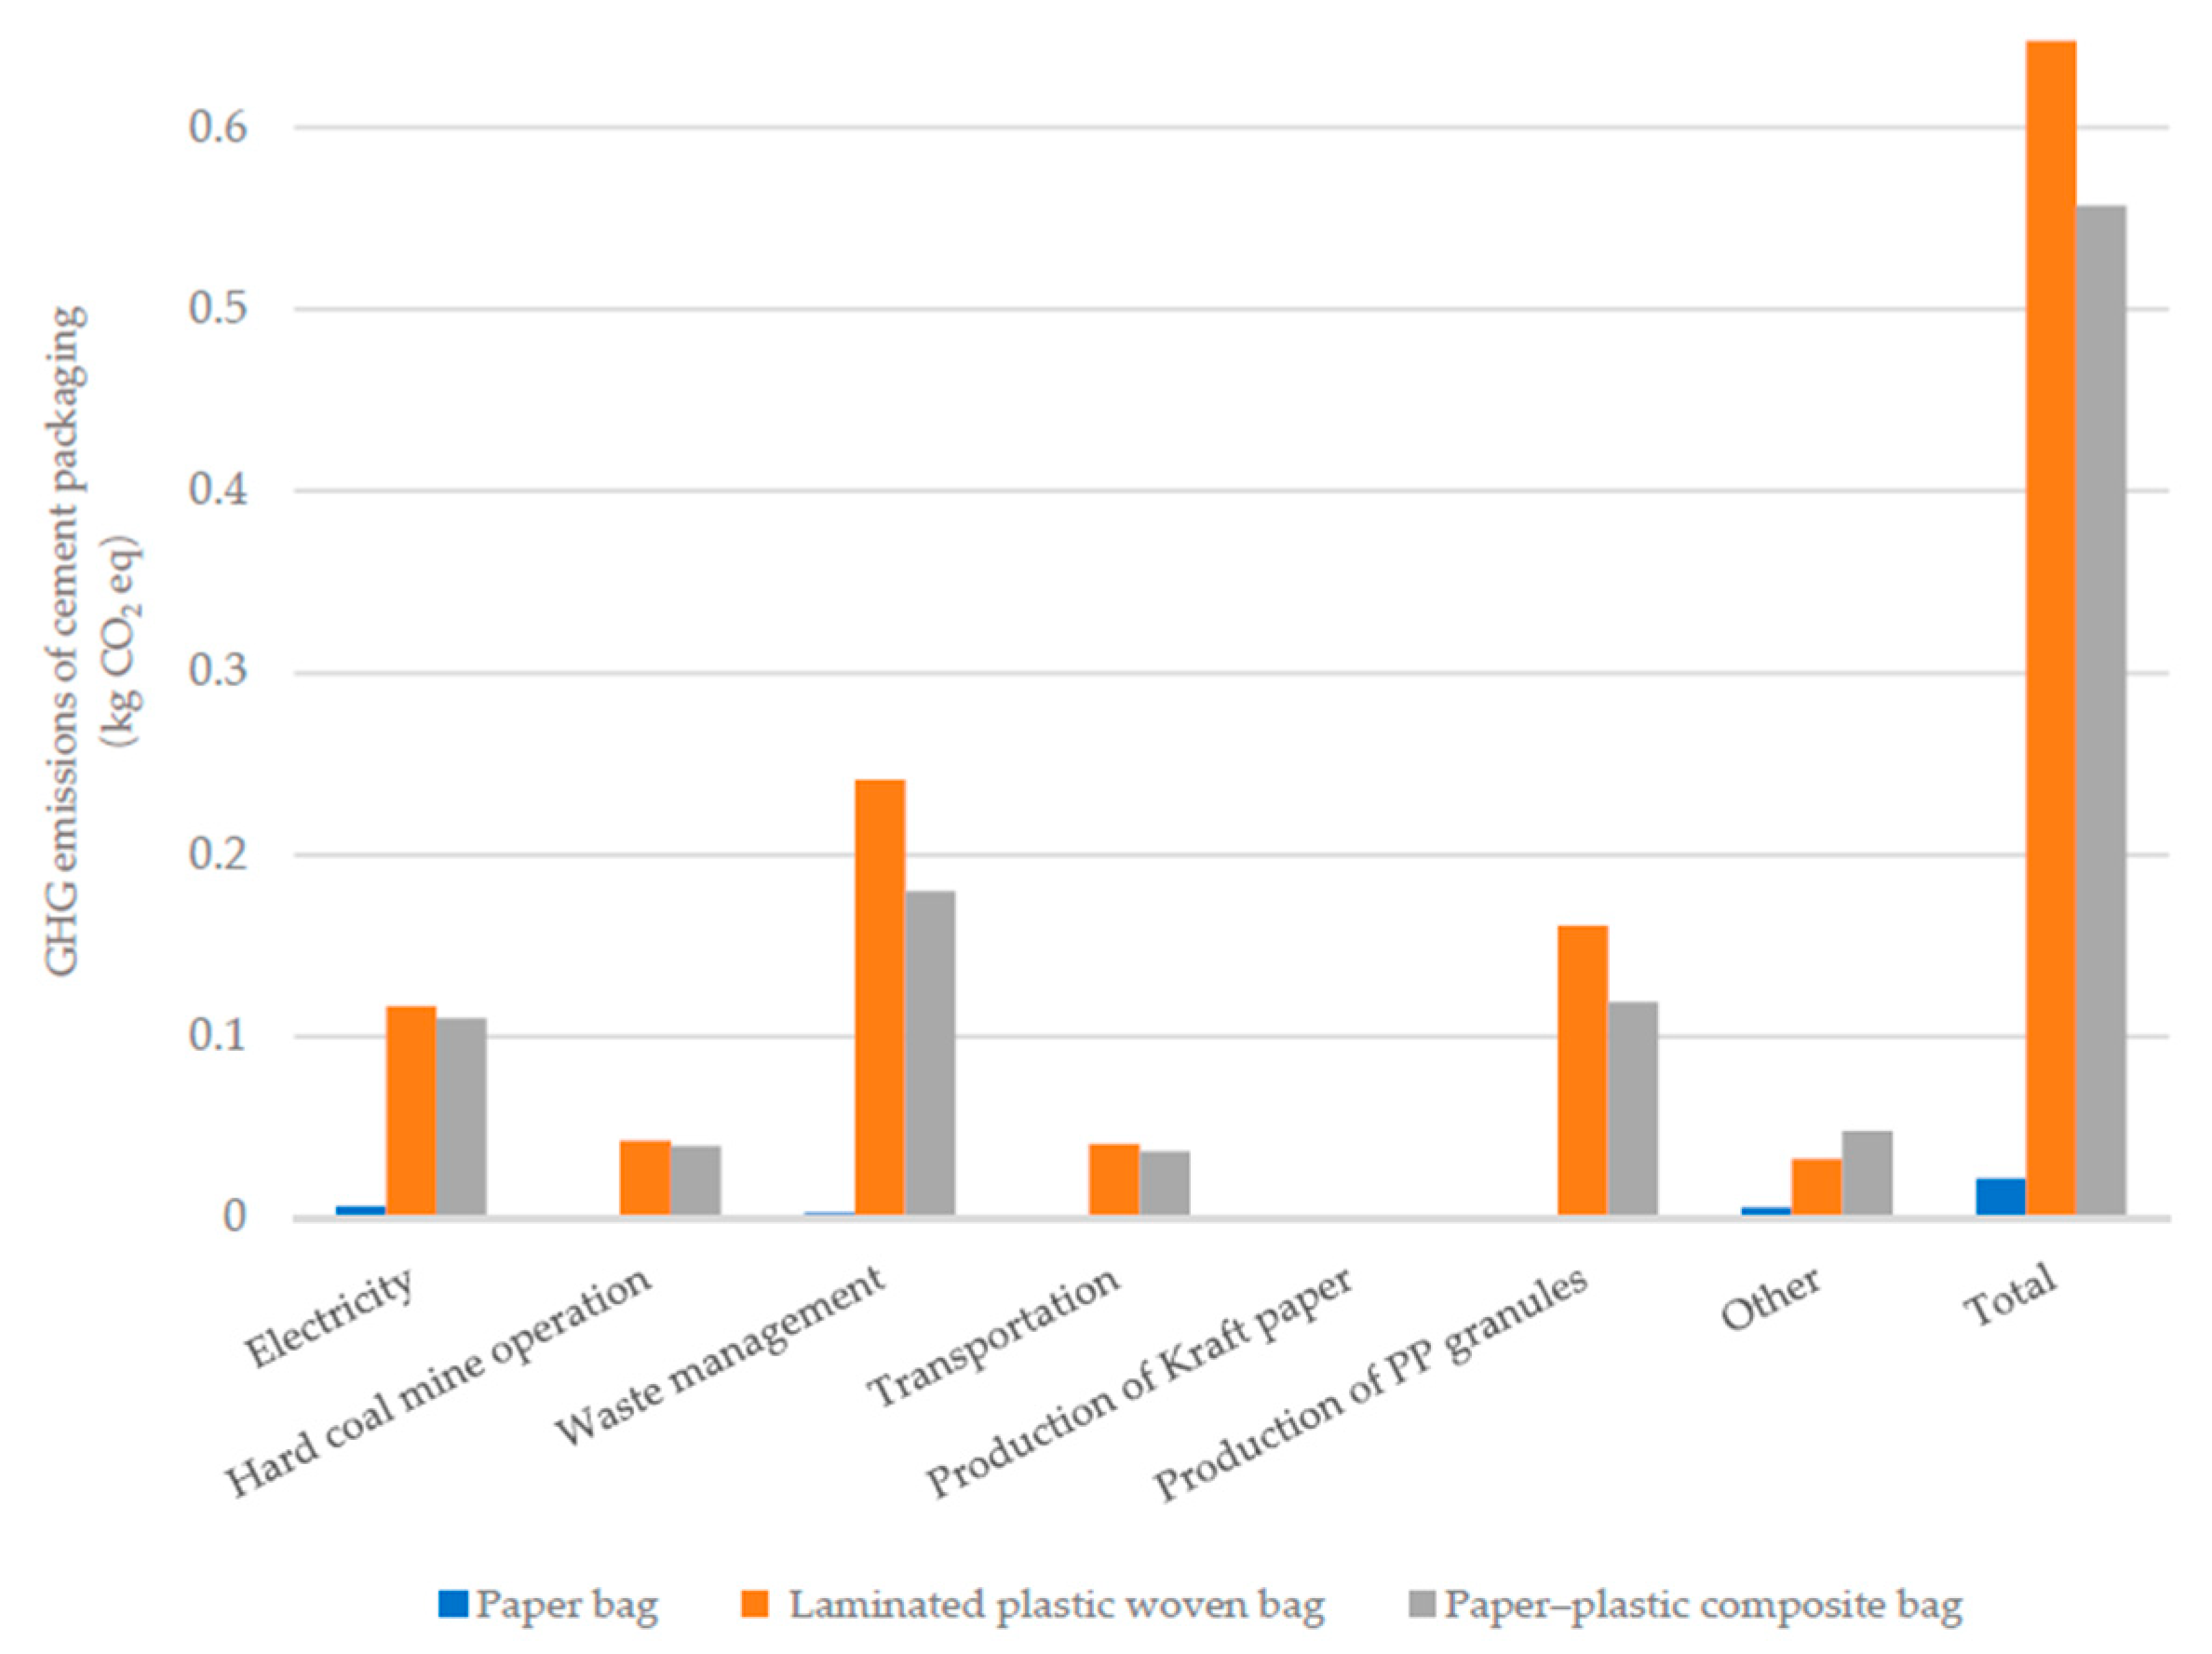
This study estimated the carbon emissions from China’s cement packaging to propose suggestions for cement manufacturers in China to reduce carbon emissions. The results showed that carbon emissions are largely emitted from laminated plastic woven bags. The consumption of electricity and PP accounts for the largest proportion of total carbon emissions in the production phase. Our results provide evidence to support countermeasures for carbon emissions in China’s cement industry.

4.1. Carbon Emissions Reduction Measures in Packaging Choices

A reduction in the use of laminated plastic woven bags would markedly reduce carbon emissions. From an economy perspective, the most widely used cement bags in practice are laminated plastic woven bags. By separately comparing each cement packaging type within the production chain, this study found that using paper–plastic composite bags instead of the laminated plastic woven bags would significantly reduce the total carbon emissions of cement packaging.
Paper–plastic composite bags consume more types of raw material compared with laminated plastic woven bags but consume less material. The carbon footprint is 10.92% lower than that of laminated plastic woven bags. Therefore, using a paper–plastic composite bag can significantly reduce the carbon footprint of the packaging. The physical strength of the paper bag is not as good as the other two bags, resulting in a higher loss rate in transportation. Thus, the paper bags is not considered as an option.

4.2. Carbon Emission Reduction Measures in Use of Recycled Material

Recycled materials can be used during bag production, but the strength of the recycled materials is not as good as those produced with new materials.
According to the GB9774-2010 requirements [36], under the premise of consistent mechanical properties, the mass per unit area of fresh materials in paper–plastic composite bags and laminated plastic woven bags are ≥65 g/m2 and ≥71 g/m2, and the requirements for recycled materials are ≥71 g/m2 and ≥77 g/m2, respectively. When calculating the carbon footprint of the recycled material, it is assumed that the recycled material stems from the cement packaging and is calculated using the same method as for cement packaging. The recycled material is only recycled once. The weight of the recycled material increases by 9.84% as required by the national standard. The carbon footprint of packaging materials and transportation also increases by 9.84%. The carbon footprint of a paper bag using recycled material is 0.00282 kg CO2 eq. The carbon footprint of transportation during recycling is relatively low and the data of the energy consumption of related machine during recycling is not available. Therefore, the actual carbon footprint is expected to be higher as the carbon footprint is not incorporated in the recycling process. The carbon footprint of the new Kraft paper used in paper bags is 0.00563 kg CO2 eq, and the carbon footprint of the raw materials is reduced according to this ratio. That is, the carbon footprint of each packaging type decreases by 47.44% based on the raw materials. The carbon footprint of the raw material of the laminated plastic woven bag is 0.162 kg CO2 eq, and 0.141 kg CO2 eq for the raw material of paper–plastic composite bags. In the production phase, the carbon footprints is expected to decrease significantly by 15.85%, 20.59%, and 20.03% for paper, laminated plastic woven, and paper–plastic composite bags, respectively.
Assuming that the material is completely recycled and the recycled material is only recycled once, the data in Table 11 is obtained, which shows the carbon footprint of packaging using recycled material and the emissions reduction over the whole life cycle.

4.3. Carbon Emission Reduction Measures in the Electricity Consumption

The carbon emissions from electricity consumption stem mainly from coal combustion for generating electricity and energy consumption in coal mining, accounting for 43.6–54.4% over the whole life cycle. A large proportion of carbon emissions for industrial products and processes usually originates from electricity consumption, such as the cobalt extraction process [44] and aluminum production [45]. The current method of power generation is mainly coal. An increase in the proportion of nuclear power and water power generation and a decrease in the proportion of coal generation could reduce the carbon emissions of cement packaging. Furthermore, this study recommends that the government should provide subsidies or preferential policies to coal production enterprises that adopt energy-saving technologies.

4.4. Carbon Emission Reduction Measures in Using Bulk Cement

Due to cement’s characteristics, it is usually transported with packaging. However, this leads to a massive consumption of cement packaging, resulting in carbon emissions and energy consumption. China has encouraged the use of bulk cement since the 1950s. The government has published a restrictive bagging policy and encourages bulk policy as the main policy to encourage the use of bulk cement and has formulated a series of policy documents to accelerate the development of bulk cement in China. A significant issue is improving the bulk cement transportation method. Using modern logistics means improving the traditional transportation methods, and constructing a modern logistics system could help promote the development of bulk cement. Furthermore, research and development of the corresponding technologies and production equipment, loading, unloading, restoring, transporting, and use of bulk cement is required. Finally, the production of bulk cement should be industrialized and intensive.
To sum up, if cement manufacturers choose paper-plastic composite bag with the use of recycled material, the carbon emission reduction of a single bag is 0.281 kg CO2 eq. In 2017, using the paper-plastic composite bag with recycled material instead of the laminated plastic woven bag can reduce carbon emissions with 4.88 million tons CO2 eq.

5. Conclusions

This paper used LCA methodology to assess the whole life cycle carbon emission of three kinds of widely used cement packaging in China, defining the goal and scope of this assessment, building a complete system and conducting a rigorous inventory analysis of the standard cement packaging used in China. Several results were obtained from this investigation: Firstly, the most widely used laminated plastic woven bag emits the most carbon dioxide followed by paper–plastic composite bags and paper bags; secondly, for a production perspective, electricity consumption accounts for the highest proportion of total carbon emissions. Using new energy such as nuclear power and water power could reduce the carbon emissions of cement packaging significantly. Finally, using recycled material in certain production phases and preferring paper–plastic composite bags simultaneously can reduce the carbon emissions of China’s cement packaging.
This investigation, however, has some limitations that need addressing in future. First, the economic considerations of paper–plastic composite bags were disregarded. Although the paper–plastic composite bag is more environmentally friendly, it might be more expensive than laminated plastic woven bags. The damp-proof characteristic of paper–plastic composite bags is lower than laminated plastic woven bags. Thus, the economic applicability and environmental protection must be balanced. Second, this study was limited to only considering the CO2 emissions of the packaging. Other important impact categories should be considered when comparing these three kinds of packaging, for example, the water footprint. The authors will conduct a more comparable and comprehensive investigation in the future.

Supplementary Materials

The following are available online at https://www.mdpi.com/2071-1050/11/20/5554/s1, Table S1: Paper-plastic composite bag_analysis_result, Table S2: paper bag_analysis_result, Table S3: Laminated plastic woven bag_analysis_result.

Author Contributions

Conceptualization, X.M. and B.L.; methodology, X.M., C.L. and B.L.; software, B.L.; formal analysis, C.L. and B.L.; investigation, C.L. and B.L.; writing—original Chinese draft preparation, B.L. and C.L.; writing—English review and editing, C.L.; supervision, X.M.; funding acquisition, X.M.

Funding

This study is supported by the National Natural Science Foundation of China (NSFC) (Reference Nos. 71573015, 71303019 and 71521002), the National Key Research and Development Program of China (2016YFA0602801).

Conflicts of Interest

The authors declare no conflicts of interest.

References

  1. Gustavsson, L.; Joelsson, A.; Sathre, R. Life Cycle Primary Energy Use and Carbon Emission of an Eight-Storey Wood-Framed Apartment Building. Energy Build. 2010, 42, 230–242. [Google Scholar] [CrossRef]
  2. Work, C. Climate Change and Conflict: Global Insecurity and the Road Less Traveled. Geoforum 2019, 102, 222–225. [Google Scholar] [CrossRef]
  3. Zhang, X.-B.; Xu, J. Optimal Policies for Climate Change: A Joint Consideration of CO2 and Methane. Appl. Energy 2018, 211, 1021–1029. [Google Scholar] [CrossRef]
  4. Intergovernmental Panel on Climate Change (IPCC). Climate Change 2013, Fifth Assessment Report, The Physical Science Basis; Cambridge University Press: New York, NY, USA, 2013. [Google Scholar]
  5. Pandey, D.; Agrawal, M.; Pandey, J.S. Carbon Footprint: Current Methods of Estimation. Environ. Monit. Assess. 2011, 178, 135–160. [Google Scholar] [CrossRef] [PubMed]
  6. Zhang, K.H. Urbanization and Industrial Development in China. In China’s Urbanization and Socioeconomic Impact; Tang, Z., Ed.; Springer: Singapore, 2017; pp. 21–35. [Google Scholar] [CrossRef]
  7. Feng, K.; Hubacek, K. Carbon Implications of China’s Urbanization. Energy Ecol. Environ. 2016, 1, 39–44. [Google Scholar] [CrossRef]
  8. Madlool, N.A.; Saidur, R.; Hossain, M.S.; Rahim, N.A. A Critical Review on Energy Use and Savings in the Cement Industries. Renew. Sustain. Energy Rev. 2011, 15, 2042–2060. [Google Scholar] [CrossRef]
  9. Wei, J.; Cen, K. Empirical Assessing Cement CO2 Emissions Based on China’s Economic and Social Development during 2001–2030. Sci. Total Environ. 2019, 653, 200–211. [Google Scholar] [CrossRef]
  10. Wei, J. Analysis of Chinese cement production and CO2 emission. Environ. Sci. Technol. 2015, 38, 80–86. [Google Scholar] [CrossRef]
  11. U.S. Geological Survey. Mineral Commodity Summaries 2019; U.S. Geological Survey: Reston, VA, USA; 200p. [CrossRef]
  12. Cui, Y. The status quo and future of China’s cement industry. Bulk Cem. 2018, 192, 20–28. (In Chinese) [Google Scholar]
  13. Liu, J.; Zhang, S.; Wagner, F. Exploring the Driving Forces of Energy Consumption and Environmental Pollution in China’s Cement Industry at the Provincial Level. J. Clean. Prod. 2018, 184, 274–285. [Google Scholar] [CrossRef]
  14. Damtoft, J.S.; Lukasik, J.; Herfort, D.; Sorrentino, D.; Gartner, E.M. Sustainable Development and Climate Change Initiatives. Cem. Concr. Res. 2008, 38, 115–127. [Google Scholar] [CrossRef]
  15. Fellaou, S.; Bounahmidi, T. Evaluation of Energy Efficiency Opportunities of a Typical Moroccan Cement Plant: Part I. Energy Analysis. Appl. Therm. Eng. 2017, 115, 1161–1172. [Google Scholar] [CrossRef]
  16. Wu, W.-N.; Liu, X.-Y.; Hu, Z.; Zhang, R.; Lu, X.-Y. Improving the Sustainability of Cement Clinker Calcination Process by Assessing the Heat Loss through Kiln Shell and Its Influencing Factors: A Case Study in China. J. Clean. Prod. 2019, 224, 132–141. [Google Scholar] [CrossRef]
  17. Schneider, M.; Romer, M.; Tschudin, M.; Bolio, H. Sustainable Cement Production—Present and Future. Cem. Concr. Res. 2011, 41, 642–650. [Google Scholar] [CrossRef]
  18. An, J.; Middleton, R.S.; Li, Y. Environmental Performance Analysis of Cement Production with CO2 Capture and Storage Technology in a Life-Cycle Perspective. Sustainability 2019, 11, 2626. [Google Scholar] [CrossRef]
  19. Mikulčić, H.; Vujanović, M.; Duić, N. Reducing the CO2 Emissions in Croatian Cement Industry. Appl. Energy 2013, 101, 41–48. [Google Scholar] [CrossRef]
  20. Cao, Z.; Shen, L.; Zhao, J.; Liu, L.; Zhong, S.; Yang, Y. Modeling the Dynamic Mechanism between Cement CO2 Emissions and Clinker Quality to Realize Low-Carbon Cement. Resour. Conserv. Recycl. 2016, 113, 116–126. [Google Scholar] [CrossRef]
  21. Jokar, Z.; Mokhtar, A. Policy Making in the Cement Industry for CO2 Mitigation on the Pathway of Sustainable Development—A System Dynamics Approach. J. Clean. Prod. 2018, 201, 142–155. [Google Scholar] [CrossRef]
  22. Shi, W.; Cui, Y.; Wu, Y. Research on China’s Cement Demand Forecasting. China Build. Mater. 2011, 1, 100–105. (In Chinese) [Google Scholar]
  23. Xu, R. Current Status and Prospects of Carbon Dioxide Emissions from China’s Cement Industry; Annual Symposia on Chinese Cement Technology: Guangzhou, China, 2012; pp. 124–128. (In Chinese) [Google Scholar]
  24. Robertson, K.; Garnham, M.; Symes, W. Life Cycle Carbon Footprint of the Packaging and Transport of New Zealand Kiwifruit. Int. J. Life Cycle Assess. 2014, 19, 1693–1704. [Google Scholar] [CrossRef]
  25. Liu, X.; Fu, Y.; Xu, W.; Meng, L. Study on the Carbon Footprint of Beer Package. J. Beijing Inst. Graph. Commun. 2011, 19, 23–25. (In Chinese) [Google Scholar] [CrossRef]
  26. Wang, Z.; Wang, H.; Huang, N.; Fan, C. Carbon footprint assessment and certification of AI-PE-Pa complex package. Res. Environ. Sci. 2012, 25, 712–716. (In Chinese) [Google Scholar]
  27. Choi, B.; Yoo, S.; Park, S. Carbon Footprint of Packaging Films Made from LDPE, PLA, and PLA/PBAT Blends in South Korea. Sustainability 2018, 10, 2369. [Google Scholar] [CrossRef]
  28. Ministry of Commerce of the PRC, Department of Circulation Industry Development. China Bulk-Cement Association of Popularization & Development. National Bulk Cement Green Industry Development Report (2012–2018); China Bulk-cement Association of Popularization & Development: Beijing, China, 2012. Available online: http://chinabca.com (accessed on 14 November 2018). (In Chinese)
  29. JI, J.; Ma, X. Review of Carbon Footprint: Definitions and Accounting Methods. Ecol. Econ. 2011, 4, 76–80. (In Chinese) [Google Scholar]
  30. Environmental Management-Life Cycle Assessment-Principles and Framework (ISO 14040); International Standards Organization (ISO): Geneva, Switzerland, 2006.
  31. Environmental Management-Life Cycle Assessment-Requirements and Guidelines (ISO 14044); International Standards Organization (ISO): Geneva, Switzerland, 2006.
  32. Danilecki, K.; Mrozik, M.; Smurawski, P. Changes in the Environmental Profile of a Popular Passenger Car over the Last 30 Years—Results of a Simplified LCA Study. J. Clean. Prod. 2017, 141, 208–218. [Google Scholar] [CrossRef]
  33. Vellini, M.; Gambini, M.; Prattella, V. Environmental Impacts of PV Technology throughout the Life Cycle: Importance of the End-of-Life Management for Si-Panels and CdTe-Panels. Energy 2017, 138, 1099–1111. [Google Scholar] [CrossRef]
  34. Cantisani, G.; Di Mascio, P.; Moretti, L. Comparative Life Cycle Assessment of Lighting Systems and Road Pavements in an Italian Twin-Tube Road Tunnel. Sustainability 2018, 10, 4165. [Google Scholar] [CrossRef]
  35. Li, L.; Wu, W.; Giller, P.; O’Halloran, J.; Liang, L.; Peng, P.; Zhao, G. Life Cycle Assessment of a Highly Diverse Vegetable Multi-Cropping System in Fengqiu County, China. Sustainability 2018, 10, 983. [Google Scholar] [CrossRef]
  36. State Administration for Market Regulation. National Standardization Administration. GB 9774-2010: Sacks for Packing Cement; CHINESE GB Standards: Beijing, China, 2010; Available online: http://www.doc88.com/p-3435557918400.html (accessed on 14 September 2017). (In Chinese)
  37. Jiang, L.; Zhang, D.; Bai, X.; Yan, B.; Liu, C. Study on practical damp proof character of common packing bag of cement. Cement 2002, 4, 10–11. [Google Scholar] [CrossRef]
  38. Wernet, G.; Bauer, C.; Steubing, B.; Reinhard, J.; Moreno-Ruiz, E.; Weidema, B. The Ecoinvent Database Version 3 (Part I): Overview and Methodology. Int. J. Life Cycle Assess. 2016, 21, 1218–1230. [Google Scholar] [CrossRef]
  39. Ciroth, A. ICT for Environment in Life Cycle Applications OpenLCA—A New Open Source Software for Life Cycle Assessment. Int. J. Life Cycle Assess. 2007, 12, 209–210. [Google Scholar] [CrossRef]
  40. Quality and Technical Supervision of Zhejiang Province. DB33/803: The Quota & Calculation Method of Electricity Consumption per Comparable Unit Production for Plastic Woven Sack; Zhejiang Bureau of Technical Supervision: Zhejiang, China, 2013; Available online: https://wenku.baidu.com/view/9ae56e652f60ddccda38a0ff.html (accessed on 14 September 2017). (In Chinese)
  41. Wang, H.; Mei, W. Method for Preparing High-Strength Paper-Plastic Composite Bag. CN104313713A, 28 January 2015. [Google Scholar]
  42. The Quality and Technology Supervision Bureau. GB/T 7968-1996: Bag Paper; The Quality and Technology Supervision Bureau: Beijing, China, 1996; Available online: http://www.doc88.com/p-5844404970029.html (accessed on 14 September 2017). (In Chinese)
  43. Cheng, C.; Zhou, X.; Guo, G. Annual Report of Cement Industry 2014; Lianhe Credit Information Service Co., Ltd.: Beijing, China, 2014; Available online: http://www.lhcis.com/news/398.html (accessed on 14 September 2017). (In Chinese)
  44. Farjana, S.H.; Huda, N.; Mahmud, M.A.P. Life Cycle Assessment of Cobalt Extraction Process. J. Sustain. Min. 2019, 18, 150–161. [Google Scholar] [CrossRef]
  45. Peng, T.; Ou, X.; Yan, X.; Wang, G. Life-Cycle Analysis of Energy Consumption and GHG Emissions of Aluminium Production in China. Energy Procedia 2019, 158, 3937–3943. [Google Scholar] [CrossRef]
Figure 1. System boundary of this study.
Sustainability 11 05554 g001
Figure 2. Inputs and outputs in the cement packaging production process.
Sustainability 11 05554 g002
Figure 3. Carbon footprint structure of paper–plastic composite bag.
Sustainability 11 05554 g003
Figure 4. Global warming potential (GWP 100) value of three kinds of cement packaging as contributed by different aspects of their life cycle.
Sustainability 11 05554 g004
Figure 5. Changes in bulk rate and carbon emissions of cement packaging from 2013–2017: (a)changes in eastern regions; (b) changes in middle regions; (c) changes in western regions; (d) changes in whole China.
Sustainability 11 05554 g005
Table 1. Characteristics of packaging in this study.
Packaging TypeMaterialArea (m2)Mass per Unit Area (Weight) (g/m2)
Paper–plastic composite bagPP(polypropylene)0.8272.0
Kraft paper0.7813.5
Coating0.784.5
Laminated plastic woven bagsPP0.8290.0
Coating0.788.3
Paper bagKraft paper0.7290.0
Table 2. Inventory analysis of input and output of cement packaging.
PackagingMaterial/Energy/OthersUnitNumberSource
InputPaper bagKraft paperg/bag64.62GB/T 7968-1996
ElectricityKWh/bag0.120Professional database of Gabi
Machine *kg/bag1.33 × 10−6Ecoinvent
Laminated plastic woven bagsPP woven fabric base materialg/bag73.83GB9774-2010
PP coating materialg/bag6.48GB9774-2010
ElectricityKWh/bag0.137Professional database of Gabi
MachineKg/bag1.33 × 10−6Ecoinvent
Paper–plastic composite bagKraft paperg/bag59.06GB/T 7968-1996
PP woven fabric base materialg/bag59.06GB9774-2010
PE(polyethylene) coating materialg/bag3.51GB9774-2010
ElectricityKWh/bag0.124Professional database of Gabi
Machinekg/bag1.33 × 10−6Ecoinvent
Transportation of raw materials (light truck)km/bag400Similar to chemical industry
Electricity in filling phaseKWh/bag0.018Industrial standard
OutputPaper bagStandard paper bagpiece1
Laminated plastic woven bagsLaminated plastic woven bagpiece1
Paper–plastic composite bagPaper–plastic composite bagpiece1
CO2 emittedkg
Others
* Loss of machine quality.
Table 3. Power parameters of the different kinds of cement packer.
ParameterUnitBHYW * 8BHYW10BHYW12
Amount of discharge spoutPiece81012
Packing capacityBags/h1800–24002400–26002600–3000
Unit weightkg505050
Capacity of filling motorkw4 kw × 84 kw × 104 kw × 12
Gross capacity of installedkw33.542.250.2
* BHYW is a series of rotary packer for cement filling. The number behind BHYW is the amount of discharge spouts in this packer.
Table 4. CO2 emission of different packaging when disposed completely (g).
PackagingPPKraft PaperCoating MaterialTotal
Paper–plastic composite bag185.6315.7511.03212.40
Laminated plastic woven bag232.03 20.37252.40
Paper bag 96.63 96.63
Table 5. Total carbon emission of a paper bag (kg CO2 eq).
ProcessInputCO2 OutputProportion
ProductionKraft paper5.36 × 10−324.36%
Electricity7.73 × 10−335.14%
Light truck3.29 × 10−314.95%
Machinery3.06 × 10−60.01%
Total0.016
FillingElectricity1.26 × 10−35.73%
Transportation1.66 × 10−37.55%
Total0.003
LandfillPackaging0.00313.64%
Overall Total 0.022100.00%
Table 6. Total carbon emission of a laminated plastic woven bag (kg CO2 eq).
ProcessInputCO2 OutputProportion
ProductionPP base0.14923.39%
PP coating0.0132.04%
Electricity0.14923.39%
Light truck0.0639.89%
Machinery3.06 × 10−6
Total0.374
FillingElectricity0.0203.14%
Transportation0.0020.31%
Total0.022
IncinerationPackaging0.24137.83%
Overall Total 0.637100.00%
Table 7. Total carbon emission of a paper–plastic composite bag (kg CO2 eq).
ProcessInputCO2 OutputProportion
ProductionKraft paper0.0142.61%
PP base0.12022.39%
PE coating0.0071.31%
Electricity0.13525.19%
Light truck0.05810.82%
Machinery3.06 × 10−6
Total0.334
FillingElectricity0.023.73%
Transportation0.0020.37%
Total0.022
IncinerationPP0.17733.02%
PE
Kraft paper0.00280.52%
Overall Total 0.536100.00%
Table 8. Distribution of the carbon footprint of each production process (kg CO2 eq).
PackagingProduction of Packaging
Kraft PaperPP BaseCoating MaterialElectricityMachineLight Truck
Paper bag0.005 0.0083.06 × 10−60.003
Laminated plastic woven bag 0.1490.013 (PP)0.1493.06 × 10−60.063
Paper–plastic composite bag0.0140.120.007 (PE)0.1353.06 × 10−60.058
PackagingFillingTransportation of productWaste disposal
ElectricityMachine Kraft paperPP granules*PE granules
Paper bag0.0013.06 × 10−60.0020.003
Laminated plastic woven bag0.023.06 × 10−60.002 0.241*
Paper–plastic composite bag0.023.06 × 10−60.0020.0028 0.177
* The italic font in “Waste disposal” is an item that does not naturally degrade.
Table 9. The proportion of the carbon footprint of each process in the total carbon footprint.
PackagingProduction of Packaging
Kraft PaperPP BaseCoating MaterialElectricityMachineLight Truck
Paper bag24.36% 35.14%0.01%14.95%
Laminated plastic woven bag 23.39%2.04%23.39%0.00%9.89%
Paper–plastic composite bag2.61%22.39%1.31%25.19%0.00%10.82%
PackagingFillingTransportation of productWaste disposal
ElectricityMachineKraft paperPP granulesPE granules
Paper bag5.73%0.01%7.55%13.64%
Laminated plastic woven bag3.14%0.00%0.31% 37.83%
Paper–plastic composite bag3.73%0.00%0.37%0.52%33.02%
The italic font in “Waste disposal” is an item that does not naturally degrade.
Table 10. Carbon footprint of China’s cement packaging in three regions in 2017.
RegionProduction of CementBulk RateBulk CementPacked CementQuantity of PackagingCarbon Footprint of Single Packaging (kg CO2 eq)Carbon Footprint of Packaging (Million Tons CO2 eq)
(Billion Tons)(Billion Tons)(Billion Tons)(Billion Pieces)
East8.4269.94%5.892.535.060.3972.01
Central6.9266.91%4.632.294.580.3961.81
West7.8351.04%3.963.877.730.3963.06
Total23.16 14.488.6917.37 6.88
Table 11. The emissions reduction when using recycled material in cement packaging.
PackagingCarbon Footprint of New Material (kg CO2 eq)Carbon Footprint of Recycled Material (kg CO2 eq)Emission Reduction (kg CO2 eq)Emission Reduction Rate
Paper bag0.0220.0160.00327.27%
Laminated plastic woven bag0.3960.3190.07719.44%
Paper–plastic composite bag0.3560.2890.06718.82%

