Article

How Does High-Speed Rail Affect Tourism? A Case Study of the Capital Region of China

1
Department of Tourism Management, School of Economics and Management, Beijing Jiaotong University, Beijing 100044, China
2
Department of Civil, Architectural and Environmental Engineering, University of Naples Federico II, 80125 Naples, Italy
3
Special Projects, The Alan Turing Institute, London NW1 2DB, UK
4
The Ada Lovelace Institute, Nuffield Foundation, London WC1B 3JS, UK
*
Author to whom correspondence should be addressed.
Sustainability 2019, 11(2), 472; https://doi.org/10.3390/su11020472
Submission received: 17 December 2018 / Revised: 8 January 2019 / Accepted: 10 January 2019 / Published: 17 January 2019
(This article belongs to the Special Issue High Speed Rail and Tourism)

Abstract

:
The objective of this study is to analyze the tourism spatial interaction that defines two scenarios, i.e., the actual one with the current high-speed rail (HSR) network, and the future one with an extension of the HSR network, considering as a case study the Capital region of China. The impact of HSR on the spatial distribution characteristics is investigated. The main outcome of this study is that the extension of the HSR network in the future scenario will significantly increase the total tourism spatial interaction and will reduce the spatial difference. What this paper adds to the current knowledge about HSR and tourism is that smaller cities, such as Tangshan, Zhangjiakou, and Chengde, connected via HSR to core cities will benefit the most from the HSR network’s operation. Those cities should take the HSR network as a development opportunity to enhance their attractiveness and strengthen their marketing to achieve sustainable tourism competitiveness. The study found that effects can also be registered on larger cities, but they are smaller. So, larger cities, such as Beijing and Tianjin, should reassess their attractiveness to the tourist market and take corresponding countermeasures. The findings of this study can be used by tourism management authorities to develop short-term and long-term plans.

1. Introduction

High-speed rail (HSR) and tourism are closely related economic activities because improved mobility is perceived to facilitate behavioral changes in tourists [1]. HSR has become a hot topic for researchers in related fields, such as tourism and transportation, since more and more research papers on the topics of HSR networks and tourism are being published. Previous studies have examined the impact of HSR on tourism development from different angles, such as a national spatial structure [2], medium-sized regional cities in France and Spain [3,4,5], metropolitan areas, including Madrid, Paris, and Rome [6,7,8], and medium- and long-distance HSR on the areas along the HSR corridor [9,10,11,12], demonstrating that HSR networks have a “corridor” effect on the tourism spatial distribution, help medium-sized cities to develop urban tourism, facilitate the development of small suburban cities as special subcenters of the metropolitan area, and have a significant effect on tourists’ choice to visit other smaller cities close to a Metropolitan area. Studies have shown that an HSR system has no influence on the choice of Madrid and Rome, but has an effect on the choice of Paris, as a tourist destination.
Delaplace [13] pointed out that a city’s size appears to be an important determinant of the impacts of HSR on tourism. A proof of this assertion needs to use a region with cities of different sizes as an analysis case. Case studies have been carried out in France, Spain, and China as shown above; however, none of them examines the impact of an HSR network that connects cites of all different sizes in an area on the tourism spatial structure. An HSR network that connects multilevel cities in one area with several lines and nodes fosters cooperation and competition among them and makes the area a destination network. Such HSR and destination networks will be found in more countries in the future with the development of HSR projects. For this reason, understanding the impacts of HSR networks on a destination network with multilevel cities is very important both theoretically and practically.
This paper contributes to the existing literature on HSR and tourism management by filling this gap and developing an analysis of multilevel cities in one area with an HSR network. Specifically, it investigates HSR’s influence on the tourism spatial structure of the Capital area of China through the specification of a spatial interaction model. The Capital area of China has been chosen because of the different sizes of the cities, and because some of them are served by HSR and others are not. Specifically, this study attempts to understand the impact that HSR can have on cities of different sizes. The spatial interaction model was chosen for two main reasons. First, distance (the actual distance or travel time) is an important independent variable in the model. HSR will change the travel time in a region, and the model can examine the HSR network’s influence. Secondly, a city’s size is also an independent variable in this model and can be measured by population. This study’s objective is to determine whether an HSR network exerts different influences on cities of different sizes in one region. We consider the differences in spatial interaction between two scenarios, i.e., one with an existing HSR network and the other with a planned HSR network. We also investigate the question of how destination management organizations in different cities should respond to HSR impacts.
Data were collected from the official statistical reports on HSR and tourism. The model developed by Wilson [14,15] was adapted and used to estimate the tourism spatial interaction (TSI). A Coefficient of Variation (CV) was used to compare the changes in tourism at the regional level in the two scenarios.
The paper is organized as follows. The second section reviews the international literature. The third section presents the TSI model. The fourth section describes the impacts of HSR networks in 2017 and 2022 for the case study of China. The fifth and final section reports the findings and conclusions.

2. Literature Review

The international literature has given an increasing amount of attention to the important role of HSR in tourism development. To date, studies have proved that HSR investment has a positive influence on tourism. The operation of an HSR network improves access to tourist destinations [4,9,10,16,17,18,19]. An HSR service modifies the link between tourists and accessibility [13,14,15,16,17,18] because of the decrease in traveling time. There is a general consensus that an increase in a tourist destination’s accessibility usually leads to an increase in demand for tourism [20], and is a critical factor in the overall number of tourists a destination receives. A survey developed in China showed that passengers with a higher education and income level were more likely to choose high-speed rail (HSR) as their mode of long-distance tour transportation [21]. As a result, many studies report that one consequence of HSR is an increase in tourists [5,16,17,22,23,24]. The tourist market in France, Spain, China, and Japan has grown as a consequence of HSR [5,9,10,18,22]. The operation of the HSR network between Barcelona (Spain) and Perpignan (France) has led to an enlarging of the day-trip market of Barcelona, with the number of excursionists from Languedoc-Roussillon amounting to 723,200, and the main travel purposes of the excursionists being: shopping (60%), holidays (20%), and visits to family or friends (9%) [18]. A case study of China shows that HSR can increase the amount of international tourism [23,25]. A study from Spain demonstrates that while ridership and length are not really significant for international tourism, HSR plays a clear and positive role in the increase in both the number of foreign tourist arrivals and revenues, and is highly significant with a positive sign, but neither ridership nor the length and existence of an HSR network are significant for domestic tourism [26]. HSR systems have a positive impact on the promotion of urban tourism and fostering business tourism development. Bazin et al. [17] performed a qualitative analysis to assess the impact of HSR on urban and business tourism in French cities close to Paris. They showed that this kind of tourism might be fostered by HSR for the reasons of avoiding driving fatigue, traffic congestion, and parking difficulties, cheaper travel, and a more comfortable travelling experience.
However, in some cases, the impact of HSR on the growth of tourism has not been as positive as expected [27,28]. Intercontinental tourists are less likely to be affected by HSR because they normally travel by plane, although HSR may increase international tourists’ visits to nearby countries and cities once they reach their destination [8,9]. Research has found that HSR may cause a reduction in demand for overnight stays [29] and a reduction in the length of stay [16,17,30]. Survey data between 1980 and 1985 on the Paris-Lyon Line, which was started in 1981, show a decrease in the length of stay in Dijon, Lyon, and Valence Perrache [29]. Additionally, a study in Le Mons of France showed that the average length of stay decreased from 2–3 days to 1.5 days a few years after the arrival of the TGV service. In the different administrative districts connected by the same HSR line, some of them have a substantial correlation with the HSR line’s opening, and some do not [12]. The phenomenon of the “double-edged sword” is also important for the analysis of the impact of HSR on tourism development in Spain. The substitution effect of HSR on aviation has reduced the number of immigrants in Madrid, which has indirectly brought about negative effects on inbound tourism. On the other hand, it has promoted domestic tourism; however, the effect is very weak. Therefore, the network effect of HSR is not positive on the tourism market [27], and the characteristics of tourists that choose HSR in different tourist cities are completely different [31].
From a regional tourism development perspective, the introduction of an HSR service has the potential to generate a number of effects, including: a structuring effect [18]; agglomeration [18]; a corridor effect [2]; and centralizing effects [32]. A “structuring effect” occurs where the introduction of a new transport system assists local actors to maximize the utility of pre-existing structures and relationships or encourages policy-makers to adopt complimentary policies that utilize HSR as a change agent [18]. For example, the introduction of HSR may lead to a reduction in travel costs that may induce spatial changes as businesses, such as hotels, relocate to take advantage of the new HSR service. In this regard, Masson and Petiot [18] argue that, in instances where transport costs fall, an agglomeration effect can be observed where ‘firms agglomerate at a larger scale into a smaller number of locations servicing an extensive hinterland’. Moreover, HSR may generate changes in the spatial distribution of an industry [33]. Plassard [32] observed that a centralizing effect occurred in France, where Paris has become the center of the star-shaped TGV network. In China’s case, the opening of high-speed railways has improved the inter-regional accessibility balance and increased accessibility from high-speed railway sites to non-site cities, while the national transport accessibility level still forms a new pattern of “corridors” and “islands” centered on high-speed rail lines and sites, which might lead to a new spatial inequity [34].
In previous studies, there is evidence for both a positive and a negative influence from HSR on tourism. Gutiérrez et al. [35] reported that the characteristics of tourists choosing HSR in different tourist cities are completely different. The literature shows that a city’s size, a city’s location in the HSR network, and the location of HSR stations might be the factors that determine the impacts of HSR on tourism. HSR may have a centralization effect where economic activity is drawn towards the big city nodes of the rail network, usually at the expense of smaller cities and towns [36]. Ureña et al. (2009) argue that such large intermediate cities served by HSR, such as Lille, Zaragoza, or even Cordoba, are likely to see a growth in urban and business tourism [5]. An analysis conducted on TGV’s influence on the small- and medium-sized cities in Northern, Atlantic, and Eastern Europe showed that, even with the improvement in the accessibility, the increase in tourists due to the TGV is minimal [31]. Research on the two medium-sized and intermediate cities Cuenca and Toledo in Spain showed that infrastructure is necessary but not sufficient for tourism, and its effectiveness depends on many accompanying conditions, such as the collective strategies of local stakeholders and HSR stations being located peripherally to cities [37]. Studies in France have shown that there is no tourism development growth in smaller cities [37]. A database of 124 municipalities during the 2005–2012 period was built [28] to study the effects of the introduction of new HSR corridors on the number of visitors and their total and average stay at several end-line and intermediate cities as compared to similar counterparts not having such an infrastructure, and it was found that these effects are generally extremely weak or just restricted to larger cities [27]. Intermediate cities only benefit from HSR if they have well-developed tourism amenities [10].
A summary of studies related to cities’ size and location in the HSR network is given in Table 1.

3. Methodology

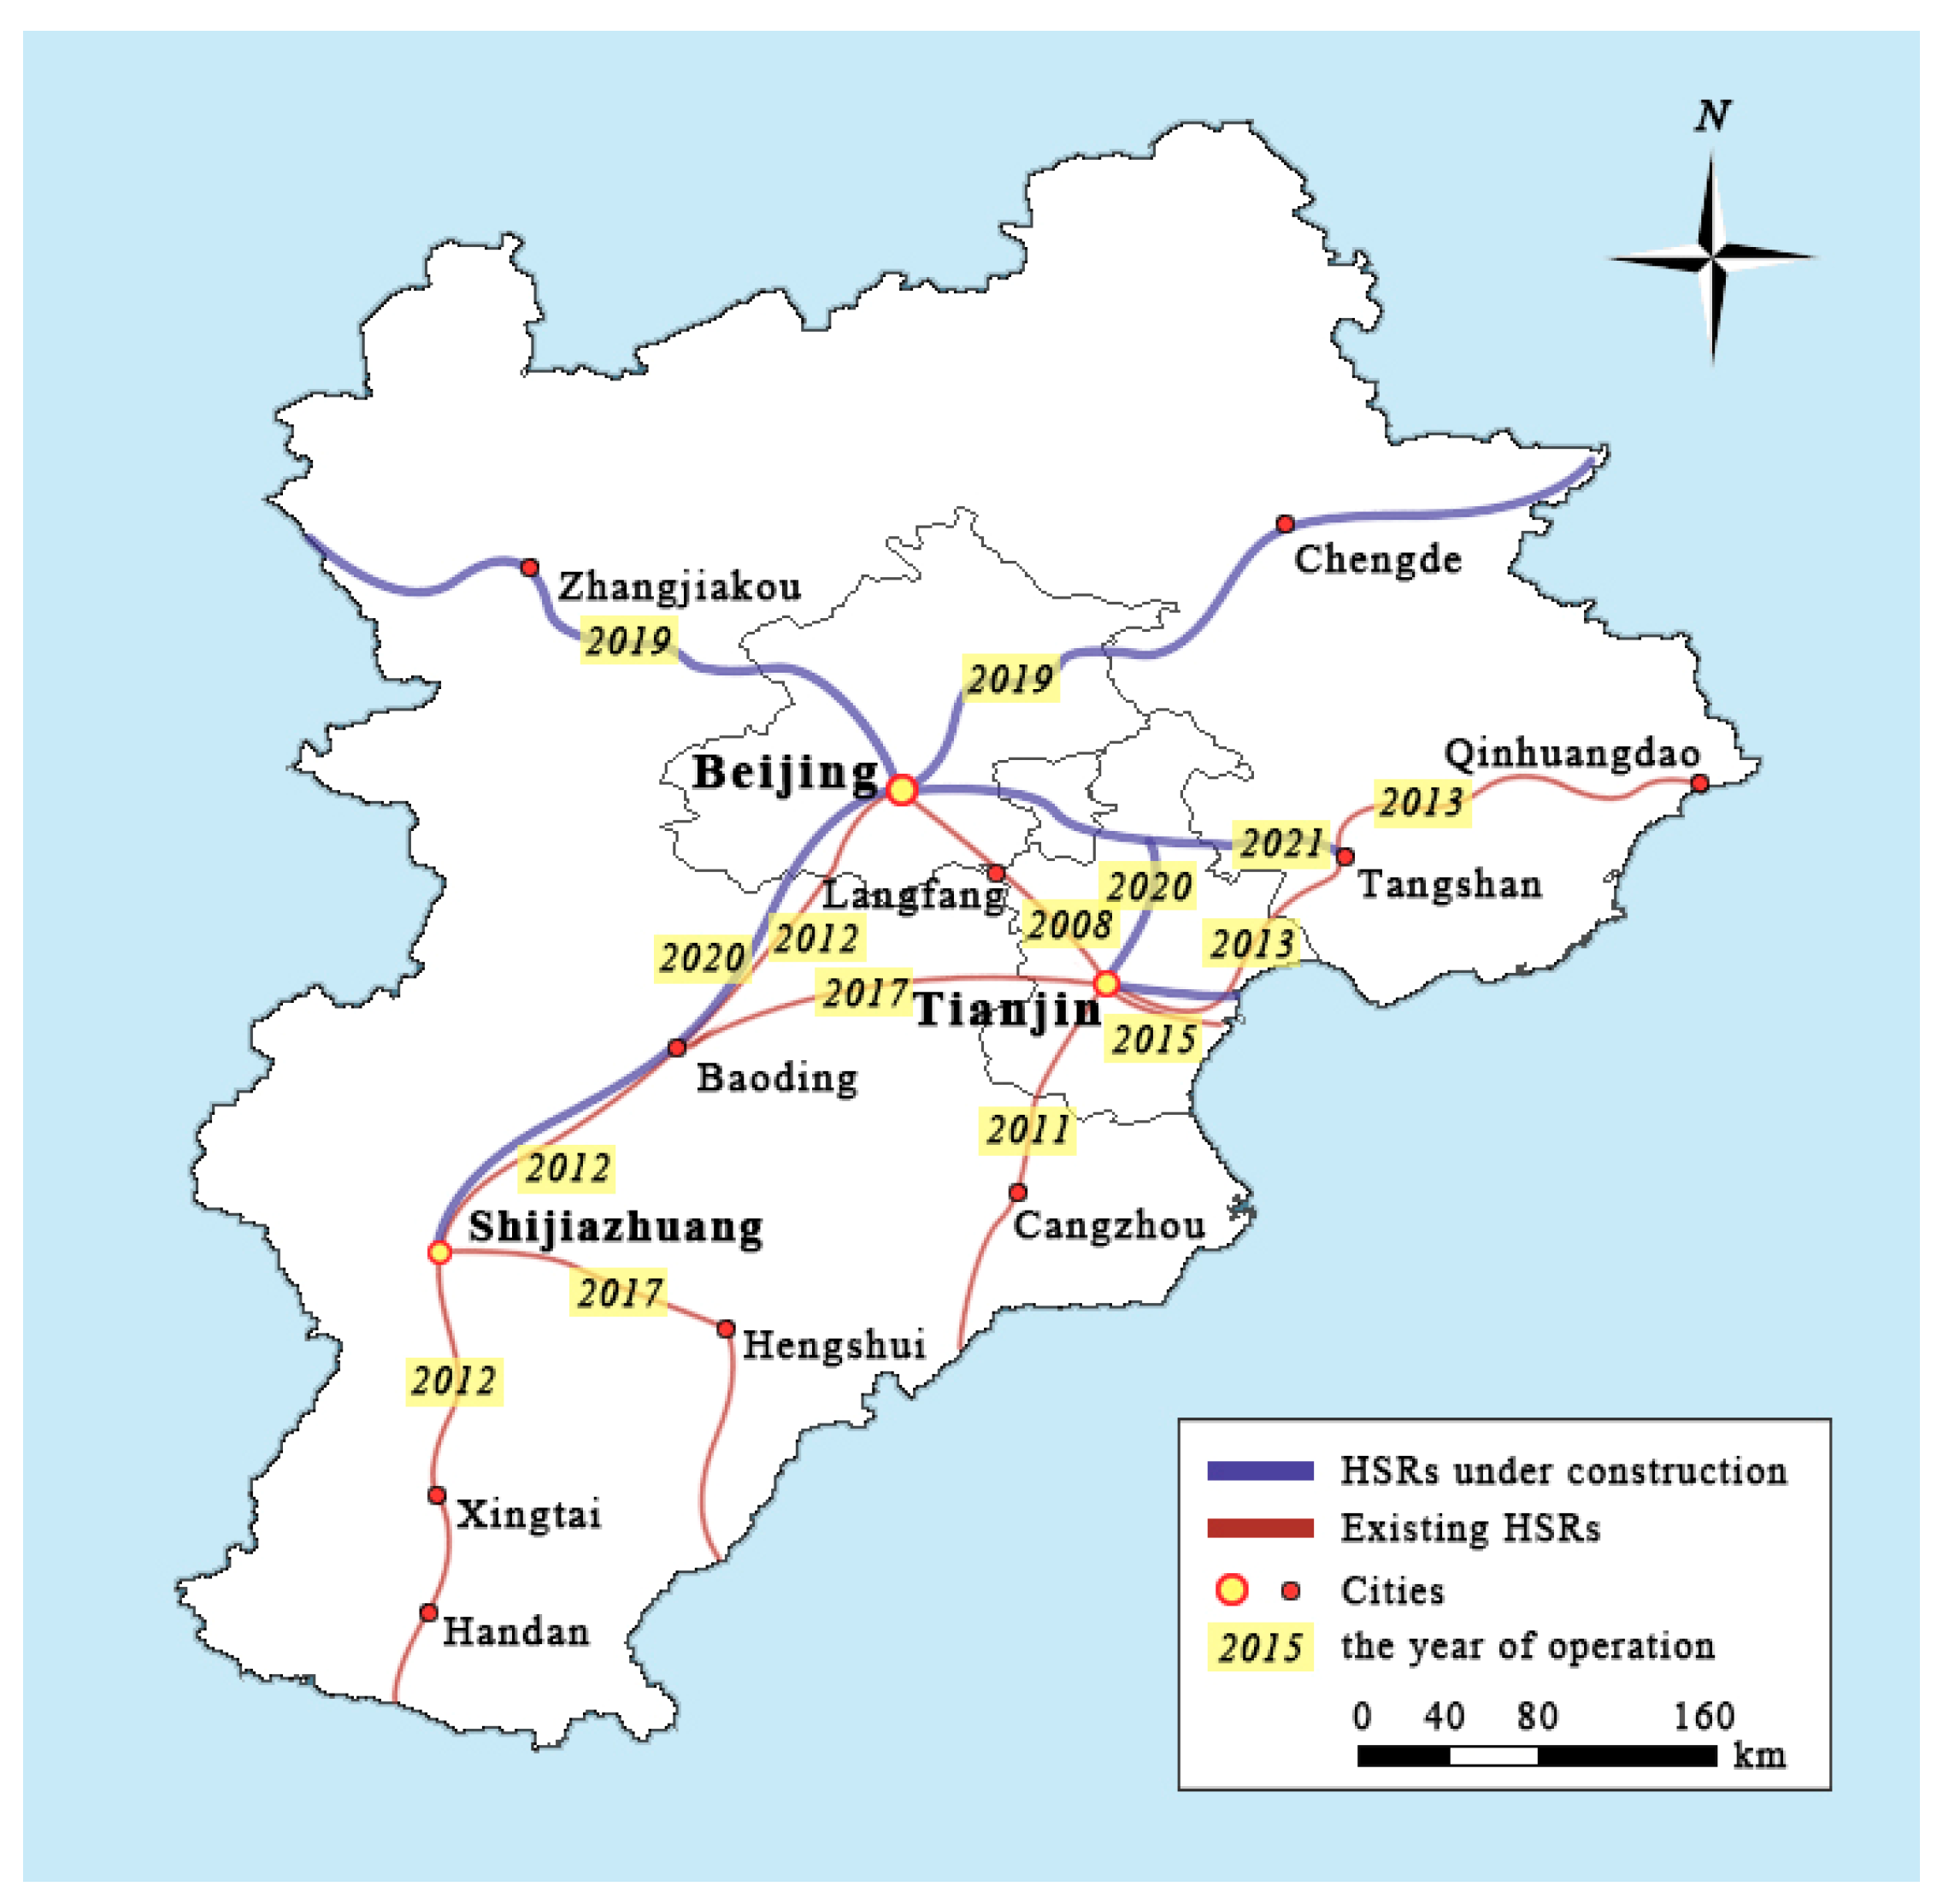
3.1. Research Context

The Capital area in China (named the Jingjinji Area, see Figure 1) has experienced rapid growth in recent decades, and is one of the most highly urbanized regions of China. The Jingjinji Area has 2 large cities (Beijing and Tianjin), 1 capital city (Shijiazhuang City in the Hebei Province), and 10 other cities (Chengde, Zhangjiakou, Qinhuangdao, Tangshan, Langfang, Baoding, Zhangzhou, Hengshui, Xingtai, and Handan). This region has always been an important tourist attraction in China. There are 10 world heritage sites in this area, occupying nearly 20% of the whole country. In 2017, the area received a total of 8.9 million inbound tourists and 1.05 billion domestic tourists.
Because of the growth in economic activity in this area and the population density, traffic congestion has become a serious problem. At present, six HSR lines connect 11 cities in this area, and there will be 10 HSR lines by the end of 2021 that link all 13 cities. The HSR characteristics are shown in Table 2 and Figure 1.
An HSR network with 10 lines and 13 nodes that covers a distance of 2272 km will be developed by the end of the year 2021. Two 0.5-h commuting circles around Beijing, Tianjin, Shijiazhuang, and Baoding will undoubtedly be able to foster tourism development. When major investments in the transportation system are carried out, the intensity and direction of the interaction of tourism between cities will also undergo major changes. Therefore, strategies should be adopted to support the regional tourism industry.
In order to provide a measure of the size of cities, population has been chosen as the indicator. In an HSR network, there are three types of city: core, intermediate, and end-line. Based on the map of the HSR network in the Capital Area of China, we define cities with over five lines as core cities, cities with more than two lines as intermediate cities, and cities with only one line as end-line cities. The size and the category of each city are reported in Table 3.
Based on the literature, we adopted six hypotheses in the context of our case study:
Hypothesis 1 (H1).
The HSR network has a positive effect on large and core cities.
Hypothesis 2 (H2).
The HSR network has a positive effect on large and intermediate cities.
Hypothesis 3 (H3).
The HSR network has a weak and insufficient effect on medium and intermediate cities.
Hypothesis 4 (H4).
The HSR network has a weak and insufficient effect on medium and end-line cities.
Hypothesis 5 (H5).
The HSR network has a weak and insufficient effect on small and intermediate cities.
Hypothesis 6 (H6).
The HSR network has a weak and insufficient effect on small and end-line cities.

3.2. Research Design

Spatial interaction is the movement of people, freight, or information between an origin and a destination, and the gravity, potential, and retail models are the main models in the current literature on spatial interaction analysis [38]. Tourism spatial interaction (TSI) is a key feature of a tourism industry’s development, where the tourism flow Tij [39,40,41,42,43,44] between two regions (i and j) is a function of the characteristics of the regions themselves (i.e., of an origin i and a destination j); (Xi and Xj) are the attraction factors and/or the disutility factors, such as distance, where the disutility factors act as a proxy of the transportation costs. Gravity models are used to describe the TSI [45,46,47,48]. Marrocu and Paci [49] reported results from an econometric study of tourism flows for 107 Italian provinces based on origin–destination (OD) spatial interaction model. Paturlli et al. [50] chose a gravity model to examine the effects of World Heritage Sites on the domestic tourism in Italy. Morley et al. [51] proposed an improved gravity model for tourism flows that considers the individual utility theory and showed the suitability of the gravity model in the context of tourism.
The progress in transportation technology that HSR represents has affected tourism interactions by improving the connections between regional tourist destinations and therefore their accessibility, which in turn has reshaped the spatial structure of regional tourism. The use of spatial interaction models to examine HSR’s influence on tourism development has not yet been applied in the tourism literature. In this paper, we have chosen a revised gravity model to explain and measure the impacts of HSR on TSI. Li et al. [14] present a model based on Alan Wilson’s model [15] with three important coefficients and results based on data from China. The model formulation used here is:
T jk = KP j C j α A k exp ( β r jk ) .
The accessibility from origin j is
X j = k A k exp ( β r jk )
to a set of destinations, k ; P j C j α is the tourism potential for destination k from origin j ; P j is the population and C j is the average income in a given origin j ; r jk is the distance (or travel time) between j and k ; α is the income coefficient; β is a coefficient that represents the significance of distance or a travel cost; and K is a constant.
Since the paper’s objective is to examine the influence of HSR on TSI, we would have preferred the increase in tourist trips to be an extra term on the PjCj factor; e.g., accessibility to tourist destinations to a power, and then to use an origin-constrained model. In our case, it has to be unconstrained to allow for an increase in trips as a result of the rjk’s reduction. So, K, P, and C in Equation (1) are all assumed to be fixed between times. Li et al. [14] used historical data to estimate the three constants. The result of α as the income coefficient in China is 0.64. β was estimated using the “integral method on tourist amount” (IMTA), and was found to be equal to 0.0337. K was estimated using data from the whole country with the result of 1.89.
Therefore, it follows that the equation for the Capital Area of China, using these results, is:
T jk = 1.89 A k P j C j 0.64 exp ( 0.0337 r jk ) .
Because K, P, C, and A are constant, the growth between time periods (1) and (2) is:
T jk ( 1 ) T jk ( 2 ) = exp ( β r jk ) ( 1 ) exp ( β r jk ) ( 2 )
TSI j = X j ( 1 ) X j ( 2 ) .
In China, the Tourism Administration evaluates tourist attractions and ranks them using different levels. There are five levels of attraction: AAAAA, AAAA, AAA, AA, and A. The more As an attraction has, the higher its level of tourism development. The A k has been measured using this rank. The population, income, and A-level Scenic Spots can be found in the Annual Statistical Bulletin of Economic and Social Development for each city. The shortest travel time was chosen to measure the distance between j and k , since the physical distance has been replaced by the temporal distance because of the progress in transportation technology [52] and ‘the shrinking continent’ [53]. The travel time between two cities can be found on the website of 12,306, which is the official ticketing website of the Chinese railway.
A comparison was performed between the two TSI indices in the two scenarios, i.e., the current one with the existing HSR network and the future one in which the extension to the HSR network is taken into account. Considering that the HSR network will be completed by the end of 2021, we have decided to choose the year 2022 for the future scenario. The predicted travel time that was proposed in the project has been considered. The population, the income, and the number of Scenic Spots cannot simply be linearly predicted by the year 2022; therefore, we have assumed that there will be no significant changes in the coming years.
The Coefficient of Variation (CV) is a standardized measure of the dispersion of a probability distribution or a frequency distribution, and is used in this paper to compare the changes in regional tourism levels in the two scenarios. This index is expressed as follows:
CV = σ μ
where σ is the standard deviation of TSI and μ is the mean value. The larger the CV value is, the greater the difference between the TSIs of the cities, which also means that a greater gap exists in the whole area. Microsoft Excel 2013 was used to calculate the TSIs and CVs.

4. Results

4.1. Decrease in Travel Time

The construction of the HSR network has reduced the overall travel time in the Capital Area. In 2017, the total travel time was 557.5 h and 21 min, and in 2022 it will be reduced to 337 h and 17 min, a reduction of nearly 40% (see Table 4). The travel time has been significantly changed in Chengde and Zhangjiakou, where the decrease is 54.5 h and 46 h, respectively.

4.2. TSI Variation

With the extension of the HSR network, the TSI values across the region increase. In 2017, the total TSI was 151,246.63; in 2022, the total value will increase up to 181,954.35, with a percentage change of 20.3%. The increase in TSI means that the tourism industry in the cities in this area will grow. Beijing, Tianjin, and Shijiazhuang are the top three cities in the rank in both the origin and destination lists in both 2017 and 2022. From the origin perspective, Beijing will become the top origin city in the Capital area in 2022 thanks to the extension to the HSR network, replacing Tianjin in 2017. The rank of Tangshan, Zhangjiakou, and Chengde will increase to 3, 3, and 2, respectively, while that of Qinhuangdao and Hengshui will decrease to 2. From the destination perspective, the rank of Tangshan, Zhangjiakou, and Chengde will increase to 3, 5, and 4, respectively, while that of Xingtai, Qimhuangdao, and Cangzhou will decrease to 2. Hengshui will become the last city in the rank in both the origin and destination lists (see Table 4).
According to Table 4, H1 is partly supported because we observed a large amount of TSI growth in Beijing, but a small amount of growth in Tianjin. H2 is not supported because Baoding and Shijiazhuang will have weak TSI growth in 2022. H3 is partly supported because we observed different effects from the two cities. Tangshan has a huge amount of growth, while Xingtai has little. H4 and H5 are supported by the small changes in TSIs in Handan, Cangzhou, and Langfang. We can find complex evidence for H6. Hengshui has a small change in TSIs, which is positive evidence for H6. Zhangjiakou and Chengde have a huge amount of TSI growth, which is negative evidence for H6. Qinhuangdao has some growth, which is positive evidence for H6.

4.3. Cities’ Roles

We can define one city’s role as an origin or a destination by comparing the TSI values. If the TSI value as an origin is larger than the TSI value as a destination, then we will understand that this city is more like an origin; otherwise, it is a destination. In such a context, the four cities of Beijing, Tianjin, Chengde, and Qinhuangdao received more interactions as destinations than as origins (see Table 5) in 2017, indicating that they played more of a destination role in the Capital Area. The other nine cities played more of an origin role in 2017. For the HSR network extension by 2022, Zhangjiakou’s role as a destination is stronger than its role as an origin. At the same time, the TSI value generated by Qinhuangdao as an origin is larger than the TSI value generated by it as a destination. It has been shown that that the HSR network has changed the role of Zhangjiakou from an origin into a destination and the role of Qinhuangdao from a destination into an origin, strengthening the roles of Beijing and Chengde as destinations, and highlighting the role of Tangshan as an origin city, since the difference in 2022 will increase significantly.
The data in Table 5 support H2, H4, and H5, and partly support H1 and H3. Table 5 provides negative evidence for H6. Of the four small and end-line cities, Hengshui is the only one that experiences a weak effect from the HSR network. The other three cities (Qinhuangdao, Zhangjiakou, and Chengde) experience a huge effect from the expansion of the HSR network in this area.

4.4. A Downward Trend for the HSR Network

After the construction of the HSR network in the year 2022, the TSI coefficient value for this area shows a decreasing trend. Indeed, the TSI values will decrease from 0.99 in 2017 to 0.90 in 2022 from the origin perspective, and will decrease from 1.76 in 2017 to 1.72 in 2022 from the destination perspective (see Table 4). This downward trend means that, although there are still spatial differences in the TSIs between the cities in this area, these differences are gradually decreasing, and this area is developing in a more balanced and coordinated direction.
We should pay more attention to Tangshan and Chengde, since the CV values in 2022 will increase from both the origin and destination perspectives, which means that the TSI values between the two cities and other cities will have a more unbalanced distribution due to the HSR network. At the same time, the HSR network will balance the spatial difference from Beijing and Zhangjiakou to other cities, since the CV values of those two cities in 2017 and 2022 will decrease significantly.

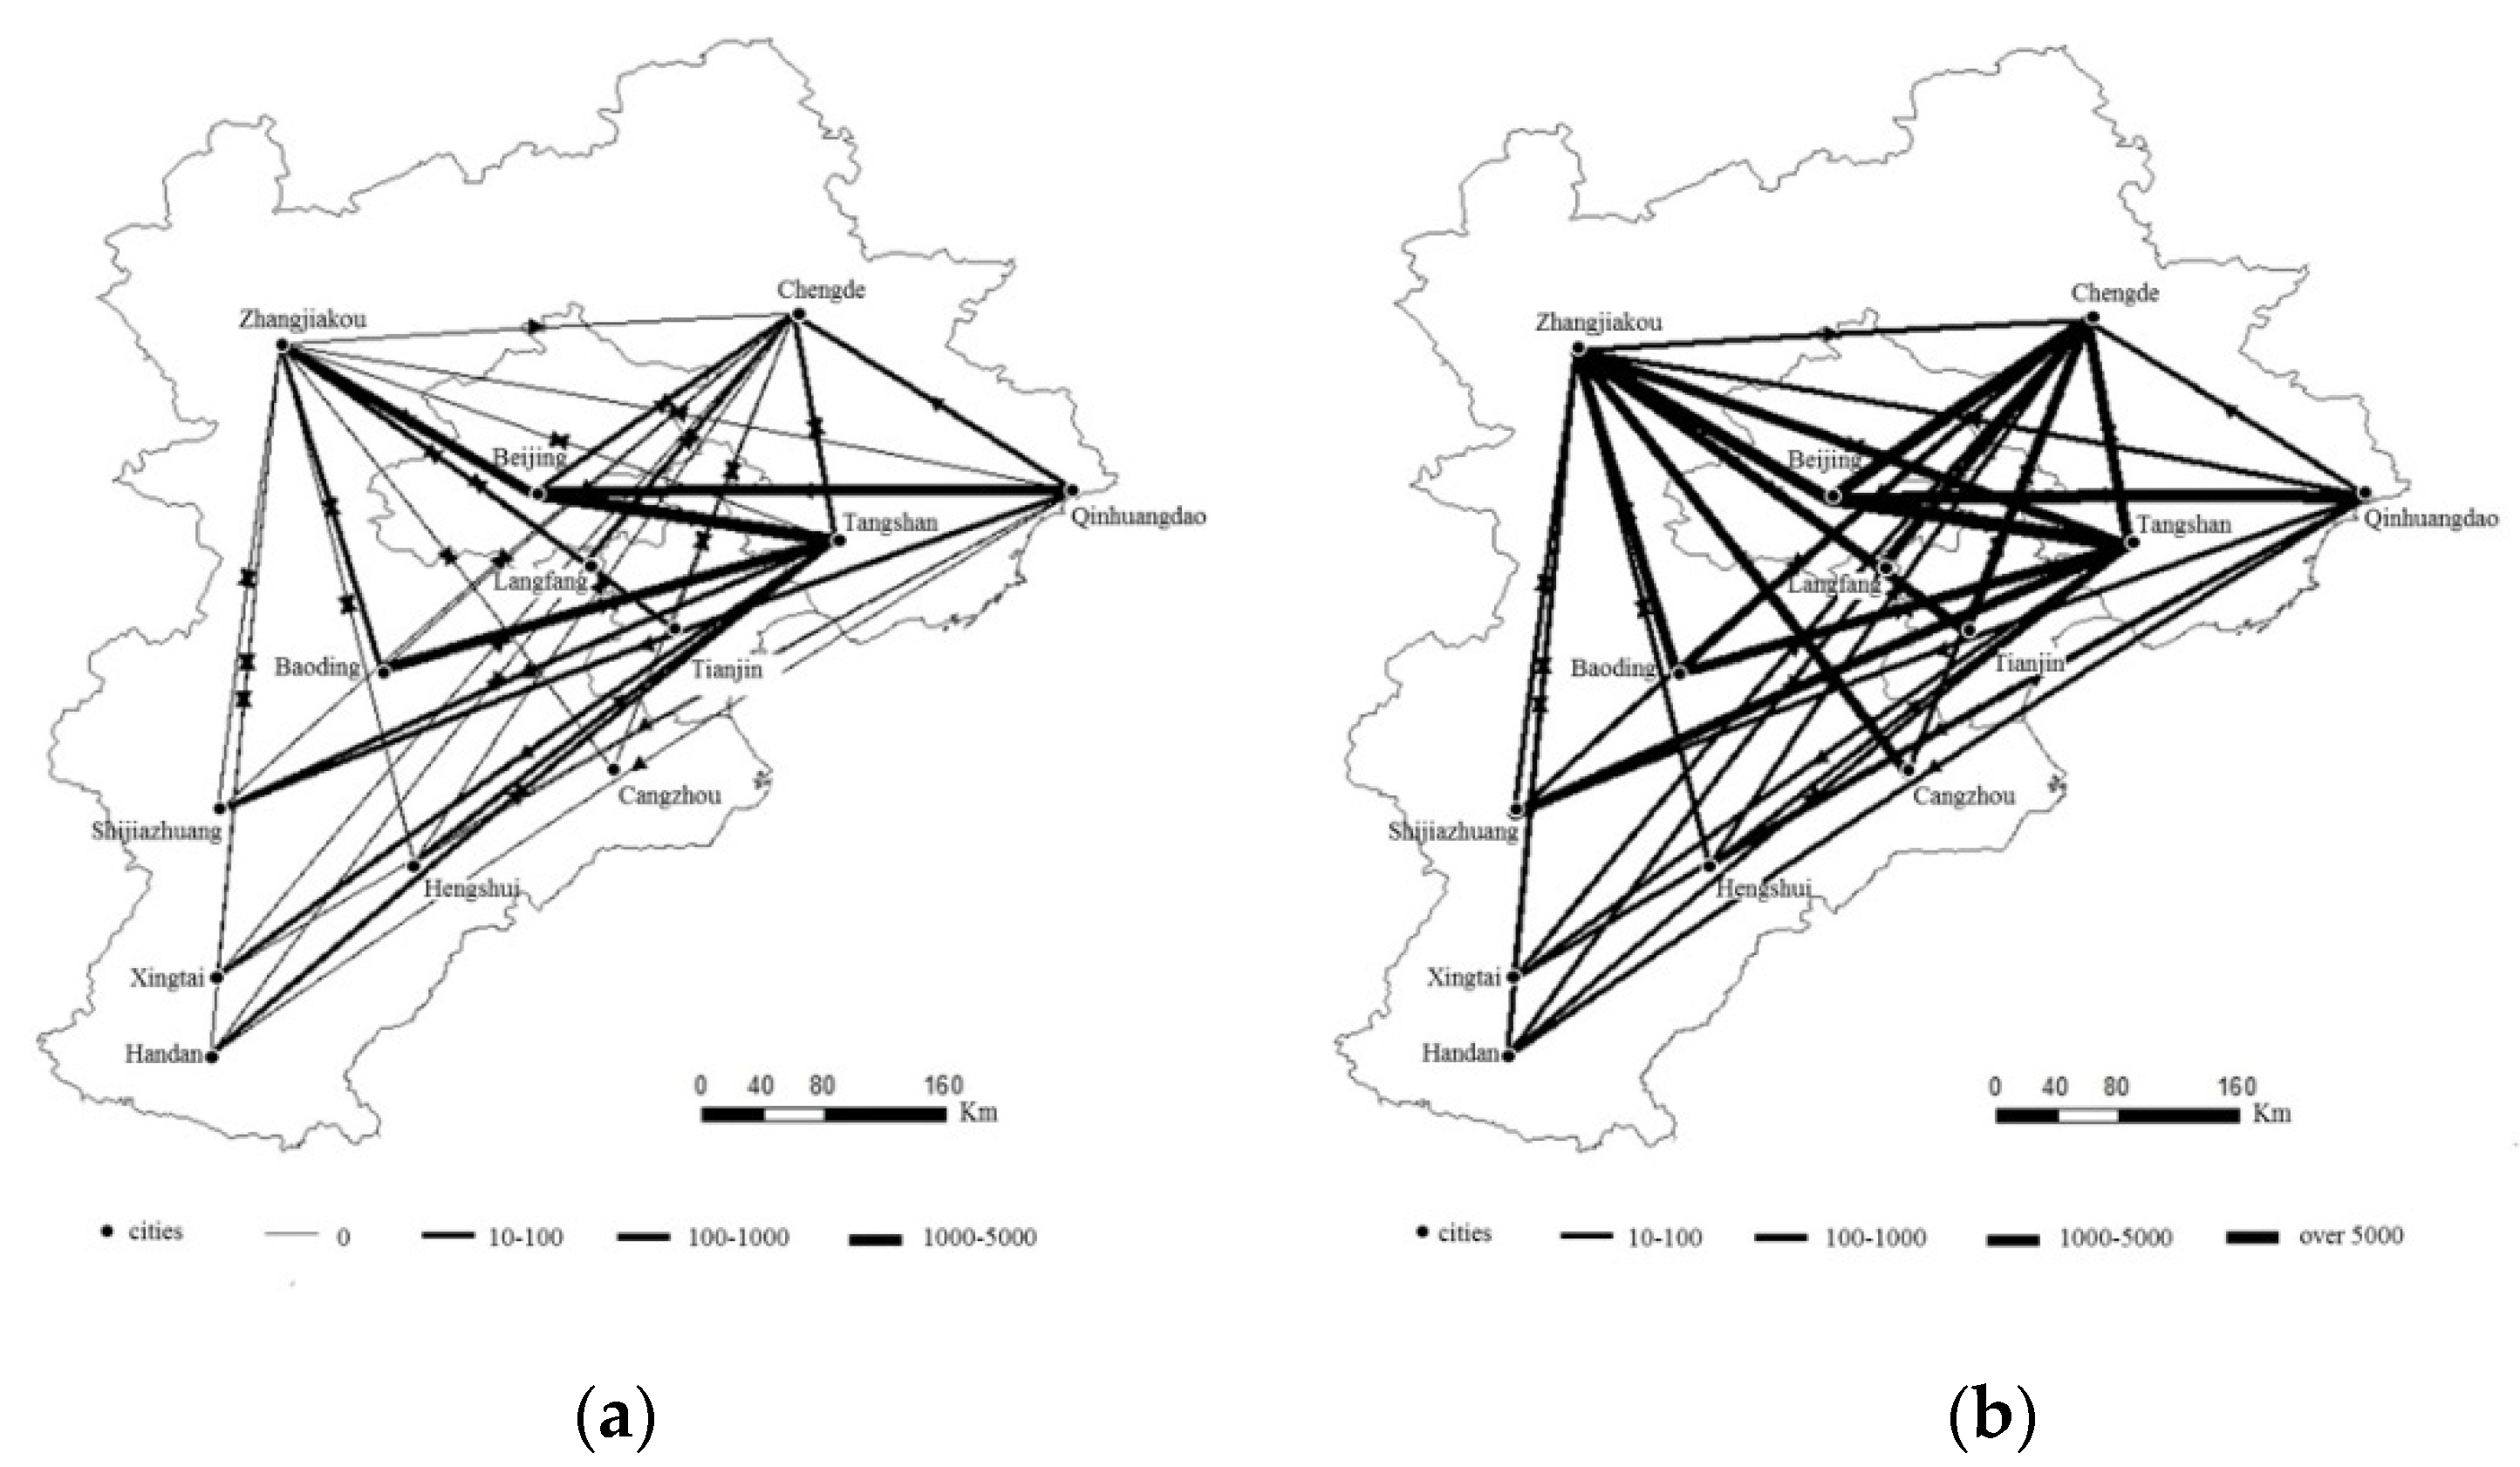
4.5. Tourist Flow Change after the HSR Network Extension in Both Intensity and Direction

We can learn about the changes in tourist flow intensity between two cities by comparing the TSIs between them in 2017 and 2022 (see Figure 2 and Table 6). In all of these pairs of cities, the TSI values of both directions between Beijing and Chengde in 2022 increase by 1000 times w.r.t. the year 2017. The TSIs on the dual direction of Tianjin and Zhangjiakou, the dual direction of Tianjin and Chengde, the single direction from Tangshan to Chengde, the dual direction of Zhangjiakou and Tangshan, the dual direction of Zhangjiakou and Baoding, and the single direction from Langfang to Chengde increase more than 100 times. This change is due to the extension of the HSR network.
We can learn which cities constitute another city’s origins from the TSI matrix (Table 6). Consider Chengde as example. In 2017, Qinhuangdao, Beijing, Tangshan, and Cangzhou were the four origins for Chengde. In 2022, all of the other 12 cities become origins for Chengde, with Beijing, Tianjin, Tangshan, Langfang, and Shijiazhuang being the top five origins. For Beijing in 2022, Tangshan becomes the main origin, followed by Tianjin. In Zhangjiakou’s origin list, there are only four cities, which are Beijing, Langfang, Tianjin, and Baoding in 2017. In 2022, all of the other 12 cities are on the list, with the top five being Beijing, Tianjin, Tangshan, Langfang, and Baoding.

5. Discussion and Conclusions

The objective of this study is to examine how the HSR network generates significant impacts on tourism spatial interaction between cities. Data were based on the economic and tourism development of 13 cities in the Capital Area of China. The findings indicate that the impact of HSR can be different depending on the size of the destination city. This aspect has not been developed in the previous international literature. The article has implications for HSR and tourism development research as well as for the tourism development strategies employed by multilevel city destinations connected to a HSR network.
With an HSR network, the travel time in the area shrinks significantly, and, consequently, the TSI values increase everywhere. We found that the small cities, and even the end-line cities, will benefit significantly from HSR. These results contrast in part with the results of Bazin et al. [31], who, after observing the tourism development in France, pointed out that there was no tourism development growth in smaller cities. Another aspect that our results highlight is that small cities connected directly to core cities benefit more from the HSR network than those connected to non-core cities. Chengde will be connected to the core city of Beijing with the Jing-Cheng HSR, and will have a more convenient connection with other cities. The TSI values of Chengde in 2022 increase by 500 times w.r.t. 2017. Zhangjiakou will be connected to Beijing with the Jing-Zhang HSR, and the TSI value in 2022 increases 100 times w.r.t. 2017. Qinhuangdao is less influenced by the HSR network, since it is connected directly to Tangshan, which is a medium-sized city. Hengshui is a small and end-line city that does not benefit at all from the HSR network mainly because of its link with Shijiazhuang, which is a non-core city.
The findings of this study partly support the work of Albalate et al. [54], where the impacts of HSR were found to be limited for larger cities. Indeed, this study shows that larger cities, such as Beijing, Tianjin, Shijiazhuang, and Baoding, will not experience significant changes after the HSR network’s extension. All of the CV values of the larger cities decrease. For the medium-sized cities, this paper extends the work of Bazin et al. [31] by examining the effect of HSR on different medium-sized cities, and partly supports the work of Verela et al. [37] in which HSR was shown to have a weak effect on medium-sized and intermediate cities.
We have also found that the HSR network will change the role or characteristics of the cities, which has not been examined in the international literature to date. The HSR network in the Capital Area of China will change the role of both Zhangjiakou and Qinhuangdao. This result can be deduced from the difference between the TSI value as an origin and the TSI value as a destination. In the Zhangjiakou case, the city of Zhangjiakou was an origin city in 2017, since the TSI value as an origin was larger than the TSI value as a destination. In 2022, when the HSR network will have been extended, the TSI value as a destination becomes larger than that as an origin. Therefore, Zhangjiakou will become a destination with the HSR network extension. The situation is the opposite in the case of Qinhuangdao. Specifically, in 2017, the TSI value as a destination is higher than that as an origin, while in 2022 the situation is the opposite and Qinhuangdao will become an origin.
This study’s findings also suggest that an HSR network has a positive impact on tourist destination choice [6,8,55,56,57]. We found that an HSR network will increase the number of destination choices, because in our study we observed that most of the cities would have a greater number of destinations after the implementation of the HSR network.
Plassard observed that a time/space compression effect might generate a centralizing effect as occurred in France, where Paris has become the center of the star-shaped TGV network [32]. Therefore HSR may reinforce an agglomeration effect on the tourism industry [18]. In our findings, the TSI and CV values of the whole Capital Area became smaller from both the origin and destination perspectives in 2022 w.r.t. 2017, meaning that the difference between the cities in the Capital Area will decrease in 2022 after the HSR network’s extension. The difference in the results between the existing literature and our paper lies in the different case study. The Plassard case study considered the HSR network around Paris. In our study, the Capital Area’s HSR has a reticulated structure, and this HSR network helps the whole area to develop in a more coordinated manner.
The results of this study indicate that the HSR network will strengthen the tourism spatial interactions in the Capital Area of China, which means that there will be closer economic and tourism connections between the cities. From a demand perspective, destinations have been able to identify changes in tourist preferences after the introduction of the HSR network, such as staying for a shorter duration at the destination [17,58,59], more business tourism development [17,60], and a higher probability of coming back to the destination [16]. Destinations should launch strategies to respond to such changes. Therefore, tourism products that focus more on special cuisine, shopping, and entertainment should be explored. In response to the business tourism opportunities, there might be more business hotels and conference centers at the destinations.
Based on this research, it is clear that the destination marketing and management organizations of the 13 cities in the Capital Area will need to encourage investments in order to promote overnight stays; this is especially true for the local authorities in the three cities of Zhangjiakou, Qinhuangdao, and Hengshui. Zhangjiakou will become the main destination in this area, and receive a flow of tourists from Beijing, Tianjin, and Tangshan, which are the main origin cities in this area because of the high population and the strong economic development. Zhangjiakou will host the 2022 Winter Olympics, and the HSR line between Beijing and Zhangjiakou has been built for this event. Zhangjiakou has excellent ice and snow sporting attractions; however, the city still needs to think about a diversified tourism products plan to achieve sustainable competitiveness after the Olympics. Qinhuangdao will become an origin city in 2022 if no extra effort is made to market and promote it to other cities. Qinhuangdao should invest more in the development of attractions, since it is a city that is located by the sea and has a long history with seaside resorts in the North of China. A more urgent evolution for Hengshui is required, since the TSI values from both the origin and destination perspectives will be the smallest ones in the whole area, which means that the lowest tourism connection will exist between it and the other cities. In order to develop tourism in Hengshui, the tourism authority should encourage more investment in attractions; otherwise, the city will excluded from the HSR era. The second implication from this paper is that the transportation systems in the Capital area should be enhanced to take advantage of new information technology solutions and algorithms [61] to provide a more solid foundation for regional tourism development.
The model adopted in this paper reflects the impact of the increase in trips as a function of accessibility. The obtained results are based on an unconstrained model. The case study reported in this paper deals with six differently sized categories of cities, and more cities with other characteristics, such as their location in the HSR network, need to be taken into consideration in the context of large and end-line cities, medium-sized and core cities, and small and core cities in future work.

Author Contributions

P.Y. developed the research framework, collected and analyzed the data, explained the results, and drafted the paper. F.P. supervised the study and edited the manuscript. A.W. provided comments on the revised spatial interaction model and edited at a late stage.

Funding

This research was funded by the BEIJING SOCIAL SCIENCE FUND, grant number “18GLB037”.

Acknowledgments

The authors would like to express their gratitude to Yang Hanyan for her excellent mapping work.

Conflicts of Interest

The authors declare no conflict of interest.

References

  1. Sun, Y.Y.; Lin, Z.W. Move fast, travel slow: The influence of high-speed rail on tourism in Taiwan. J. Sustain. Tour. 2018, 26, 433–450. [Google Scholar] [CrossRef]
  2. Wang, D.; Niu, Y.; Qian, J. Evolution and optimization of China’s urban tourism spatial structure: A high speed rail perspective. Tour. Manag. 2018, 64, 218–232. [Google Scholar] [CrossRef]
  3. Bazin, S.; Beckerich, C.; Delaplace, M.; Masson, S. L’arrivée de la LGV en Champagne-Ardenne et la nécessaire réorganisation des rapports de proximité. Cah. Sci. Transp. 2006, 49, 51–76. [Google Scholar] [CrossRef]
  4. Coronado, J.M.; Garmendia, M.; Moyano, A.; Ureña, J.M. Assessing Spanish HSR network utility for same-day tourism. Rech. Transp. Sécur. 2013, 29, 161–175. [Google Scholar] [CrossRef]
  5. Ureña, J.M.; Menerault, P.; Garmendia, M. The high-speed rail challenge for big intermediate cities: A national, regional and local perspective. Cities 2009, 26, 266–279. [Google Scholar] [CrossRef]
  6. Delaplace, M.; Pagliara, F.; Perrin, J.; Mermet, S. Can High Speed Rail foster the choice of destination for tourism purpose? Soc. Behav. Sci. 2014, 111, 166–175. [Google Scholar] [CrossRef]
  7. Garmendia, M.; Romero, V.; Ureña, J.M.; Coronado, J.M.; Vickerman, R. High-speed rail opportunities around metropolitan regions: Madrid and London. J. Infrastruct. Syst. 2012, 18, 305–313. [Google Scholar] [CrossRef]
  8. Pagliara, F.; La Pietra, A.; Gomez, J.; Vassallo, J.M. High Speed Rail and the tourism market: Evidence from the Madrid case study. Transp. Policy 2015, 37, 187–194. [Google Scholar] [CrossRef] [Green Version]
  9. Chen, Z.; Haynes, K.E. Impact of high-speed rail on international tourism demand in China. Appl. Econ. Lett. 2015, 22, 57–60. [Google Scholar] [CrossRef]
  10. Wang, D.; Chen, T.; Li, L.; Zhang, Y. Enlightenment and research of tourism impact on high-speed rail. Sci. Geol. Sin. 2012, 32, 322–328. [Google Scholar] [CrossRef]
  11. Wang, D.; Qian, J.; Chen, T.; Zhao, M.; Zhang, Y. Influence of the high-speed rail on the spatial pattern of regional tourism–taken Beijing–Shanghai high-speed rail of China as example. Asia Pac. J. Tour. Res. 2014, 19, 890–912. [Google Scholar] [CrossRef]
  12. Yan, Y.Q.; Zhang, H.Q.; Ye, B.H. Assessing the impacts of the high-speed train on tourism demand in China. Tour. Econom. 2004, 20, 157–169. [Google Scholar] [CrossRef]
  13. Delaplace, M. TGV, développement local et taille des villes: Une analyse en termes d’innovation de services. Rev. Écon. Rég. Urbaine 2012, 2, 265–290. [Google Scholar] [CrossRef]
  14. Li, S.; Wang, Z.; Zhong, Z. Gravity model for tourism spatial interaction: Basic form, parameter estimation, and applications. Acta Geol. Sin. 2012, 67, 129–147. [Google Scholar] [CrossRef]
  15. Wilson, A.G. A statistical theory of spatial distribution models. Transp. Res. 1967, 1, 253–269. [Google Scholar] [CrossRef] [Green Version]
  16. Delaplace, M.; Bazin, S.; Pagliara, F.; Sposaro, A. High Speed Railway System and the Tourism Market: Between Accessibility, Image and Coordination Tool. In Proceedings of the 54th European Regional Science Association Congress, Saint-Petersburg, Russia, 26–29 August 2014. [Google Scholar]
  17. Bazin, S.; Beckerich, C.; Delaplace, M. High speed railway, service innovations and urban and business tourisms development. In Economics and Management of Tourism: Trends and Recent Developments; Sarmento, M., Matias, A., Collecçao, M., Eds.; Universidade Luisiada Editora: Lisboa, Portugal, 2011; pp. 115–141. [Google Scholar]
  18. Masson, S.; Petiot, R. Can the high speed rail reinforce tourism attractiveness? The case of the high speed rail between Perpignan (France) and Barcelona (Spain). Technovation 2009, 29, 611–617. [Google Scholar] [CrossRef]
  19. Jiang, H.B.; Liu, J.G.; Jiang, J.L. An analysis of the accessibility of China’s tourist attractions under the impact of High-speed railway. Tour. Trib. 2014, 29, 58–67. [Google Scholar] [CrossRef]
  20. Della Corte, V.; Sciarelli, M.; Cascella, C.; Del Gaudio, G. Customer satisfaction in tourist destination: The case of tourism offer in the city of Naples. J. Invest. Manag. 2013, 4, 39–50. [Google Scholar] [CrossRef]
  21. Wang, Y.; Yan, X.D.; Xue, Q.W. Influencing Mechanism of Potential Factors on Passengers’ Long-Distance Travel Mode Choices Based on Structural Equation Modeling. Sustainability 2017, 9, 1943. [Google Scholar] [CrossRef]
  22. Sands, B. The development effects of high-speed rail stations and implications for Japan. Built Environ. 1993, 19, 257–284. Available online: https://www.jstor.org/stable/23288581 (accessed on 15 January 2019).
  23. Chen, Z.; Haynes, K.E. Chinese Railway in the Era of High-Speed; Emerald Group Publishing Limited: Bingley, UK, 2015; pp. 165–261. ISBN 1784419850. [Google Scholar]
  24. Kurihara, T.; Wu, L.L. The Impact of High Speed Rail on Tourism Development: A Case Study of Japan. Open. Transp. J. 2016, 9 (Supp. 1), 35–44. [Google Scholar] [CrossRef]
  25. Chen, Z.; Haynes, K.E. Tourism industry and high speed rail, is there a linkage: Evidence from China’s High Speed Rail development. In Proceedings of the ASRDLF 2012 Conference Special Session on High Speed Rail, Tourism and Territories, Belfort, France, 9–11 July 2012. [Google Scholar] [CrossRef]
  26. Campa, J.L.; López-Lambas, M.E. High speed rail effects on tourism: Spanish empirical evidence derived from China’s modelling experience. J. Transp Geogr. 2016, 57, 44–54. [Google Scholar] [CrossRef]
  27. Albalate, D.; Fageda, X. High speed rail and tourism: Empirical evidence from Spain. Transp. Res. Part A Policy Pract. 2016, 85, 174–185. [Google Scholar] [CrossRef] [Green Version]
  28. Albalate, D.; Campos, J.; Jiménez, J.L. Tourism and high-speed rail in Spain: Does the AVE increase local visitors? Ann. Tour. Res. 2017, 65, 71–82. [Google Scholar] [CrossRef]
  29. Bonnafous, A. The regional impact of the TGV. Transportation 1972, 14, 127–137. [Google Scholar] [CrossRef]
  30. Chen, C.L. Reshaping Chinese space-economy through high-speed trains: Opportunities and challenges. J. Transp. Geogr. 2012, 22, 312–316. [Google Scholar] [CrossRef]
  31. Bazin, S.; Beckerich, C.; Delaplace, M. Desserte TGV et villes petites et moyennes. Une illustration par le cas du tourisme à Arras, Auray, Charleville-Mézières et Saverne. Cah. Sci. Transp. 2013, 63, 33–61. [Google Scholar]
  32. Plassard, F. Le train à grande vitesse et le réseau des villes. Transports 1991, 345, 14–23. [Google Scholar]
  33. Chen, C.L.; Hall, P. The impacts of high-speed trains on British economic geography: A study of the UK’s InterCity 125/225 and its effects. J. Transp. Geogr. 2011, 19, 689–704. [Google Scholar] [CrossRef]
  34. Yang, J.; Gao, A.D.; Li, X.M.; Huang, T. Study of the Impact of a High-Speed Railway Opening on China’s Accessibility Pattern and Spatial Equality. Sustainability 2018, 10, 2943. [Google Scholar] [CrossRef]
  35. Gutiérrez, A.; Ortuño, A. High speed rail and coastal tourism: Identifying passenger profiles and travel behaviour. PLoS ONE 2017, 12, e0179682. [Google Scholar] [CrossRef] [PubMed]
  36. Givoni, M.; Banister, D. Airline and railway integration. Transp. Policy 2006, 13, 386–397. [Google Scholar] [CrossRef]
  37. Varela, C.V.; Navarro, J.M.M. High-speed railway and tourism: Is there an impact on intermediate cities? Evidence from two case studies in Castilla-Lamancha (Spain). J. Urban Reg. Anal. 2016, 8, 133–158. [Google Scholar]
  38. Rodrigue, J.P.; Comtois, C.; Slack, B. The Geography of Transport Systems, 4th ed.; Routledge: London, UK, 2016; pp. 380–385. ISBN 978-1138669574. [Google Scholar]
  39. Armstrong. GWG. International tourism: Coming or going: The methodological problems of forecasting. Futures 1972, 4, 115–125. [Google Scholar] [CrossRef]
  40. Crampon, L.J.; Tan, K.T. A model of tourism flow into the pacific. Tour. Rev. 1973, 28, 98–104. [Google Scholar] [CrossRef]
  41. Malamud, B. Gravity model calibration of tourist travel to Las Vegas. J. Leis. Res. 1973, 5, 13–33. [Google Scholar] [CrossRef]
  42. McAllister, D.M.; Klett, F.R. A modified gravity model of regional recreation activity with an application to ski trips. J. Leis. Res. 1976, 8, 21–34. [Google Scholar] [CrossRef]
  43. Swart, W.W.; Var, T.; Gearing, C.E. Operations research applications to tourism. Ann. Tour. Res. 1978, 5, 414–428. [Google Scholar] [CrossRef]
  44. Saunders, P.R.; Senter, H.F.; Jarvis, J.P. Forecasting recreation demand in the upper Savannah River Basin. Ann. Tour. Res. 1981, 8, 236–256. [Google Scholar] [CrossRef]
  45. Haynes, K.E.; Fotheringham, A.S. Gravity and Spatial Interaction Model; Sage: Beverly Hills, CA, USA, 1984; pp. 9–13. ISBN 0-8-39-2544-1. [Google Scholar]
  46. Lowe, J.C.; Moryadas, S. The Geography of Movement; Houghton Mifflin: Boston, MA, USA, 1975; pp. 182–188. ISBN 978-0881331004. [Google Scholar]
  47. Roy, J.R.; Thill, J.C. Spatial interaction modeling. Reg. Sci. 2004, 83, 339–361. [Google Scholar] [CrossRef]
  48. Sen, A.; Smith, T.E. Gravity Models of Spatial Interaction Behavior; Springer: Chicago, IL, USA, 2012; pp. 221–353. ISBN 978-3-642-79880-1. [Google Scholar]
  49. Marrocu, E.; Paci, R. Different tourists to different destinations. Evidence from spatial interaction models. Tour. Manag. 2013, 39, 71–83. [Google Scholar] [CrossRef]
  50. Patuelli, R.; Mussoni, M.; Candela, G. The effects of World Heritage Sites on domestic tourism: A spatial interaction model for Italy. J. Geogr. Syst. 2013, 15, 369–402. [Google Scholar] [CrossRef]
  51. Morley, C.; Rosselló, J.; Santana-Gallego, M. Gravity models for tourism demand: Theory and use. Ann. Tour. Res. 2014, 48, 1–10. [Google Scholar] [CrossRef]
  52. Wang, J.; Jiao, J.; Jin, F. Spatial effects of high-speed rails on interurban economic linkages in China. Acta Geol. Sin. 2014, 69, 1833–1846. [Google Scholar] [CrossRef]
  53. Spiekermann, K.; Wegener, M. The shrinking continent: Accessibility, competitiveness, and cohesion. In European Spatial Research and Planning; Faludi, A., Ed.; Lincoln Institute of Land Policy: Cambridge, MA, USA, 2008; pp. 115–140. [Google Scholar]
  54. Albalate, D.; Bel, G.; Fageda, X. Competition and cooperation between high-speed rail and air transportation services in Europe. J. Transp. Geogr. 2015, 42, 166–174. [Google Scholar] [CrossRef]
  55. Pagliara, F.; Delaplace, M.; Vassallo, J.M. High-speed trains and tourists: What is the link? Evidence from the French and Spanish capitals. In WIT Transactions on the Built Environment; Brebbia, C.A., Ed.; WIT Press: Southampton, UK, 2014; Volume 138, pp. 17–27. ISBN 978-1-84564-778-0. [Google Scholar]
  56. Seddighi, H.R.; Theocharous, A.L. A model of tourism destination choice: A theoretical and empirical analysis. Tour. Manag. 2002, 23, 475–487. [Google Scholar] [CrossRef]
  57. Delaplace, M.; Pagliara, F.; La Pietra, A. Does high-speed rail affect destination choice for tourism purpose? Disneyland Paris and Futuroscope case studies. Belgeo 2016, 3, 1–23. [Google Scholar] [CrossRef]
  58. Chen, X. Assessing the impacts of high speed rail development in China’s Yangtze River Delta megaregion. J. Transp. Technol. 2013, 3, 113–122. [Google Scholar] [CrossRef]
  59. Delaplace, M.; Perrin, J. Multiplication des dessertes TGV et Tourismes urbains et d’affaires, Regards croisés sur la Province et l’Ile de France. Rech. Transp. Sécur. 2013, 29, 177–191. [Google Scholar] [CrossRef]
  60. Bazin, S.; Beckerich, C.; Delaplace, M. Valorisation touristique du patrimoine et dessertes TGV: Le cas de quatre villes intermédiaires proches de Paris. Rev. Écon. Rég. Urbaine 2014, 5, 865–884. [Google Scholar]
  61. Veres, P.; Bányai, T.; Illés, B. Intelligent Transportation Systems to Support Production Logistics. In Vehicle and Automotive Engineering. Lecture Notes in Mechanical Engineering; Jármai, K., Bolló, B., Eds.; Springer: Cham, Switzerland, 2017; pp. 245–256. ISBN 978-3-319-51188-7. [Google Scholar]
Figure 1. Existing and planned high-speed Rail networks in the Capital Area of China. Source: http://www.ndrc.gov.cn/zcfb/zcfbtz/201611/t20161128_827844.html.
Sustainability 11 00472 g001
Figure 2. The TSIs between the pairs of cities where changes were found. (a) TSIs in 2017; (b) TSIs in 2022.
Sustainability 11 00472 g002
Table 1. Cities’ characteristics.
City’s CharacterStudy Area and MethodAuthors/YearFindings
LargeU.K., Case StudyGivoni, M., and Baniste/2006Economic activity is drawn towards the big city nodes of the rail network
Large and intermediate Córdoba and Zaragoza in Spain and Lille in France, Case StudyUreña et al./2009Large intermediate cities served by HSR are likely to see growth in urban and business tourism
MediumArras, Auray, Charleville-Mézières et Saverne, Case StudyBazin S. et al./2013;The increase in tourists due to TGV is minimal
Medium and intermediate Castilla-Lamancha (Spain), Case StudyVarela C. et al./2016Infrastructure is necessary but not sufficient for tourism
SmallArras, Auray, Charleville-Mézières et Saverne, Case StudyBazin S. et al./2013The increase in tourists due to TGV is minimal
Small and End-lineTwelve provincial capital cities and more than 30 other medium-sized and smaller towns in Spain, DiD ModelAlbalate. D. et al./2017Effects are generally extremely weak
Small and IntermediateTwelve provincial capital cities and more than 30 other medium-sized and smaller towns in Spain, DiD Model
Castilla-Lamancha (Spain), Case Study
Albalate. D. et al./2017
Varela C. et al./2016
Effects are generally extremely weak; Infrastructure is necessary but not sufficient for tourism
Table 2. HSR in The Capital Area of China.
HSROperation TimeSpeed (km/h)Distance (km)Travelling Time (min)
Beijing–TianjinAugust 200835012734
Beijing–CangzhouJune 201135022052
Beijing–Shijiazhuang–HandanDecember 2012350281 (Beijing–Shijiazhuang)
165 (Shijiazhuang–Handan)
67 (Beijing–Shijiazhuang)
38 (Shijiazhuang–Handan)
Tianjin–QinhuangdaoDecember 201335026170
Tianjin–BaodingDecember 201525015865
Shijiazhuang–HengshuiDecember 201725011046
Beijing–Chengde201935018560
Beijing–Zhangjiakou201935017450
Beijing–Shijiazhuang202035029770
Beijing–Tangshan202135014530
Source: Statistical Report from China Railway.
Table 3. The size and category of cities in the study area.
CityPopulation *Category
Beijing21.7large and core city
Tianjin15.56large and core city
Baoding11.05large and intermediate city
Shijiazhuang10.87large and intermediate city
Handan9.51medium and end-line city
Xingtai7.89medium and intermediate city
Tangshan7.89medium and intermediate city
Cangzhou7.77medium and end-line city
Langfang4.74small and intermediate city
Hengshui4.53small and end-line city
Zhangjiakou4.43small and end-line city
Chengde3.8small and end-line city
Qinhuangdao3.11small and end-line city
Source: the official website of the National Bureau of Statistics of China (http://data.stats.gov.cn) * The unit of population is millions.
Table 4. Tourism spatial interactions (TSIs) and coefficients of variation (CVs) in 2017 and 2022.
CityTravel Time *
2017/2022
TSI as Origin
2017/2022
CV
2017/2022
TSI as Destination
2017/2022
CV
2017/2022
Beijing1185/86533,099.23/41,995.912.07/1.5872,455.81/89,492.88 1.32/1.03
Tianjin1592/115933,884.42/34,807.992.62/2.5441,807.56/42,612.51 1.63/1.59
Shijiazhuang2238/127122,671.58/22,817.061.94/1.928014.27/8295.53 1.28/1.21
Tangshan1864/11389692.57/21,557.21 1.92/2.145279.12/10,457.75 1.84/1.91
Qinhuangdao2403/15161073.64/2391.59 1.82/1.972291.37/2334.201.92/1.88
Handan3029/22393683.41/3708.27 1.67/1.653020.56/3033.48 1.90/1.89
Xingtai2666/19864680.15/4704.641.60/1.592439.37/2458.19 1.80/1.78
Baoding1657/117314,249.99/14,796.04 2.45/2.357550.52/7972.09 1.91/1.79
Zhangjiakou4182/134833.34/4311.582.96/2.5232.64/4558.83 2.63/2.08
Chengde4929/16624.98/2569.821.78/2.55.56/2652.92 1.40/2.11
Cangzhou2426/18399790.26/9986.75 2.11/2.061628.47/1657.75 1.78/1.94
Langfang2120/184717,102.67/17,482.68 2.31/2.255907.39/6030.91 2.0/1.95
Hengshui3234/2191806.12/824.79 2.28/2.22394.64/397.31 2.54/2.52
Total33,709/20,234150,353.03/181,954.350.99/0.90150,353.03/181,954.351.76/1.72
* The unit of travel time in this table is minutes.
Table 5. Each City’s Role based on TSIs.
CityThe Difference between TSIs Generated and Received
2017 2022
Beijing−39,356.58−47,496.97
Tianjin−7923.14−7804.52
Shijiazhuang14,657.3114,521.53
Tangshan4413.4411,099.47
Qinhuangdao−1217.7357.39
Handan662.85674.79
Xingtai2240.772246.45
Baoding6699.476823.95
Zhangjiakou0.7−247.24
Chengde−0.58−83.11
Cangzhou8161.798329.00
Langfang11,195.2811,451.77
Hengshui411.48427.48
Table 6. The TSI Matrix in the Capital Area in 2017 and 2022.
DBeijingTianJinShijiazhuangTangshanQinhuangdaoHandanXingTaiBaodingZhangjiakouChengdeCangzhouLangfangHengshuiTotal
O
Beijing-20,89618851107/5771173130156425826/29411/173875932345532,680/41,996
Tianjin27,150-2293268981494912/5820/3445401945333,884/34,808
Shijiazhuang12,9785429-5515112393018340/910/541130522,672/22,817
Tangshan2610/13,606532157/187-12426/134/15164/4220/2921/1737321409693/21,557
Qinhuangdao146/13934454/19442-0/10/2120/302/2581501074/2392
Handan43821016728/181-10802730/90/60003683/3708
Xingtai7191751894811478-4050/150/90004680/4705
Baoding10,6599461960174/44835202219-1/2280/452182314,250/14,796
Zhangjiakou30/33292/5070/460/1400/400/30/41/103-0/420/181/780/1508/4312
Chengde1/19700/3000/911/8320/20/20/610-0/110/460/15/2570
Cangzhou5765315822347000650/1240/73-48979790/9987
Langfang11,268521513166300123/2411/143224-017,103/17,483
Hengshui218115361/90/301360/50/340-806/825
Total71,982/89,49341,808/42,6138014/82965279/10,4582291/23343021/30332439/24587551/7972452/45596/26531628/16585907/6031395/397151,247/181,954
1107/5771 means that the TSI in 2017 is 1107 and the TSI in 2022 is 5771; 316 means that the TSIs in 2017 and 2022 are 316.

