Abstract
Using the organization information processing theory, we explored the process through which the informative support of crowd logistics platforms affects logistics performance. After collecting data from 321 respondents from two crowd logistics companies in China, we proposed and tested the theoretical framework empirically using SEM. To conduct the empirical study, we developed scales for platform’s informative support and the degree of logistics resources-demand match, respectively. The results indicate that a platform’s informative support improves logistics performance via two mediators, i.e., logistics resources-demand match and logistics agility. Moreover, a platform’s ease of use moderates the indirect process through which its informative support promotes logistics performance via logistics resources-demand match. However, a platform’s ease of use has no significant effect on the indirect process of its informative support affecting logistics performance via logistics agility. This paper extends our understanding on how the informative support of crowd logistics platforms predicts logistics performance.
1. Introduction
Crowd logistics is an innovative business model in sharing economy. In crowd logistics, drivers use their own vehicles to provide logistics services as independent contractors, and shippers outsource logistics tasks to a large number of drivers through technology platforms [1]. The crowd logistics platforms integrate enormous logistics tasks, contributing to optimal allocation of logistics resources by providing drivers with informative support. In practice, the positive impacts of crowd logistics on logistics performance have emerged. Taking China as an example, compared with traditional logistics enterprises, the utilization rate of vehicles increased by 50% in some crowd logistics initiatives and logistics costs fell by about 6–8% [2]. Thus, we think that informative support of crowd logistics platforms may predict logistics performance, which is yet to be explored.
Previous studies proposed that crowd logistics platforms; by collecting, processing and sharing much necessary information with drivers about logistics service requests, routing solutions, traffic conditions and so on [3,4,5]; promote the match between demand and supply for logistics resources and empower drivers to undertake logistics tasks [6]. Although substantial studies on the function of crowd logistics platforms have been conducted, some theoretical gaps remain unsolved, as follows.
Firstly, previous studies cannot construct a theoretical underpinning on why and how a platform’s informative support improves logistics performance. In particular, the mechanisms through which a platform’s informative support affects logistics performance are yet to be explored and it remains unclear how the boundary conditions affect the logistics performance. Secondly, rare empirical research has explored the impact of a platform’s informative support on logistics performance. Thirdly, valid and reliable instruments are insufficient for a platform’s informative support. To explore further, this paper proposes a research question:
How does a platform’s informative support influence drivers’ logistics performance?
In response, our study aims to investigate the mechanism through which a platform’s informative support impacts logistics performance. We generate a theoretical framework, which shows that a platform’s informative support influences logistics resource-demand match and logistics agility, further contributing to logistics performance. Moreover, we also contribute to the organization information processing theory literature by outlining a moderator of the process. Specifically, we argue that a platform’s ease of use probably moderates the process. The conceptual framework we have proposed is depicted in Figure 1. To conduct an empirical test on this explanatory theoretical framework, we develop scales for a platform’s informative support and logistics resources-demand match by following the standard procedures suggested by Churchill [7].
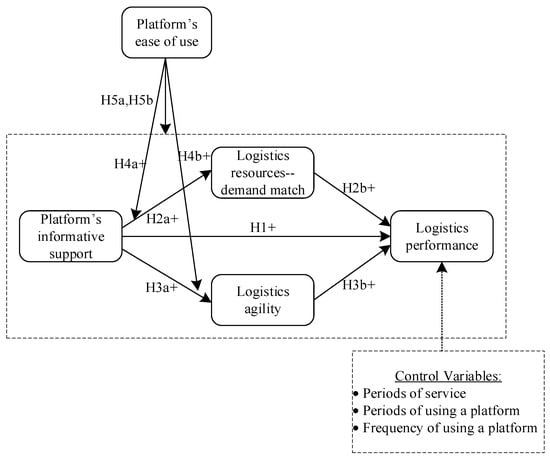
Figure 1.
Theoretical framework.
Our study contributes to the literature in several ways. To our knowledge, it is the first time that a theoretical framework has been constructed to explain the process through which a platform’s informative support casts influence on logistics performance. Based on the organization information processing theory, we improved the understanding of the mechanisms of crowd logistics platforms predicting logistics performance. Secondly, this paper expands the crowd logistics platform literature by figuring out how a platform’s informative support and platform’s ease of use interact to influence logistics performance. This study tests a moderated-mediation model and gives a better understanding of the relationship between a platform’s informative support and logistics performance. Thirdly, we developed scales for a platform’s informative support and logistics resources-demand match before conducting an empirical test. Such a scale development research allows other scholars in this field to use the tested instrument for further studies [8].
This paper is organized as follows. Section 2 introduces the theoretical background. In Section 3, a research framework is developed, along with hypotheses based on organization information processing theory. Thereafter, we present a detailed research methodology section consisting of scale development, data collection, hypotheses testing, and results. Finally, we report and discuss our findings and conclude with theoretical and managerial implications, and directions for future research.
2. Theoretical Backgrounds
2.1. Platform’s Informative Support
Prior to examining the relationship between a platform’s informative support and logistics performance, it is important to provide a unified definition of a platform’s informative support. Extant literature identifies two categories of platform’s informative support.
The first category refers to the information processing mechanism that allows for information collection, data processing and information sharing to coordinate demand and supply for logistics resources [6,9]. In general, with the support of this first category, “a shipper can place a request for a delivery service on the platform and all users located near the task can be notified automatically” [6]. Moreover, a platform helps to assign customers’ service requests to available drivers according to the characteristics of the requests (time, destination, capacity) and the characteristics of drivers (location and capability) [5].
The second category refers to the information processing mechanism that empowers the crowd drivers and helps them to make logistics decisions collectively [3]. Specifically, a platform provides drivers with real-time scheduling and routing by using a GPS system to help drivers “undertake logistics tasks as efficiently as possible” [4]. It can also collect and give quite useful information about the current driving conditions based on a GPS system. For example, drivers can share traffic and other road data through the platform, which uses such information to help drivers change routes and avoid the jam [6]. In all, the second category of platform’s informative support allows for the communication and processing of information to make and adjust logistics solutions [10,11].
Above all, a platform’s informative support can be defined as a type of information processing mechanism, which ensures the objective of matching demand and supply for logistics resources and providing timely logistics solutions. It helps in sharing information about logistics service requests, logistics resources, and delivery schedules [12].
2.2. Organization Information Processing Theory
Organization information processing theory (OIPT) posits that organizations require a lot of information to take decisions [13]. However, there is usually information disconnection between the necessary information and the information available to the organization for decision-making [14]. Such information disconnection leads to uncertainty. To cope with uncertainty, organizations need to organize and use information effectively when executing tasks [15,16]. To do so, organizations must deploy an information processing mechanism that facilitates the collection and processing of information [17]. The concept of fit is another core construct in organization information processing theory [14]. The OIPT posits that organizations will be more effective when there is a match between their information processing requirements and information processing mechanism [15,17,18].
By applying OIPT to the context of crowd logistics, the crowd drivers can be considered as independent organizations that require a lot of information to tackle uncertain tasks. Specifically, as an independent individual, a crowd driver requires necessary information to find suitable logistics service requests and undertake logistics tasks effectively. Thus, the crowd drivers need effective information processing mechanisms to deal with uncertainty. Information processing mechanism can be conceptualized as a mechanism that utilizes information to support decision-making. According to Tushman and Nadler [17], information systems are able to facilitate the process of information processing. Based upon this assumption, other researchers have suggested that information technology is a key aspect of an organization’s information processing mechanism [19]. In this study, we continue this tradition by considering a platform’s informative support as an information processing mechanism provided for the crowd drivers, because it can help them acquire and process information.
3. Hypotheses
3.1. A Platform’s Informative Support and Drivers’ Logistics Performance
Logistics performance means that drivers are capable of delivering goods and services in the quantities and at the precise times required by customers [20] According to previous supply chain studies, IT contributes to reducing operational costs and improving customer service by promoting information sharing [21,22,23]. A platform’s informative support can be considered as a type of information technology. We assume that it also facilitates logistics performance.
On one hand, by using matching algorithms, a platform’s informative support ensures the match between customers’ service requests and drivers’ logistics resources. Furthermore, it provides drivers with abundant information about logistics requests, leading to a decrease in uncertainty when looking through orders. It decreases drivers’ searching costs, contributing to good logistics performance. In addition, when drivers’ logistics orders are matched with their own logistics capabilities, they are able to provide the required service; this, in turn, predicts logistics quality.
On the other hand, a platform’s informative support helps drivers collect and process information from external environment and customers. Without this support, it is difficult for drivers to understand customers’ needs and respond effectively, thus inhibiting speedy delivery [24]. Platforms can also design logistics operation processes for drivers, helping strengthen the control of logistics activities and lead to a higher delivery reliability [25]. Besides, real-time communication with customers supported by platforms also makes sure that the drivers’ services respond to customers effectively, leading to higher satisfaction [24]. Therefore, a platform’s informative support can help enhance drivers’ logistics performance. We thus posit that:
H1:
A platform’s informative support is positively related to drivers’ logistics performance.
3.2. The Mediating Effect of Logistics Resource-Demand Match
Logistics resources-demand match examines the extent to which drivers’ logistics resources meet the demands of shippers [26]. The match between demand and supply for logistics resources has been considered to be the main request from drivers and shippers in the context of crowd logistics. Specifically, drivers need to find logistics requests, while customers need to find logistics services. However, there is no effective communication mechanism between them. The process of drivers searching for service requests online and undertaking logistics tasks offline is full of uncertainty. Thus, there are information requirements from drivers in order to find suitable service requests. Drivers need effective information-processing mechanisms to match with information requirements.
Based on the OIPT view, a platform’s informative support can be treated as a type of information processing mechanism. Particularly, platforms offer customers informative service that helps them issue their logistics service requests to drivers [27]. Platforms then categorize such information according to the characteristics of service requests and construct a multidimensional database. Moreover, platforms provide drivers with fit tasks supported by the technology of machine learning [28]. A match is achieved based on drivers’ availability and customers’ requests [5]. In this way, a platform’s informative support provides drivers with matched logistics service requests, which contributes to an increase in the accuracy and effectiveness of logistics resources-demand match. Thus, we posit that:
H2a:
A platform’s informative support is positively related to logistics resources-demand match.
Logistics resources-demand match means that crowd drivers can, in a short period of time, find logistics service requests that are matched with their preferences. For example, if an order requiring cold chain delivery is assigned to a driver whose vehicle is not set with refrigerated equipment, the loss of perishable products will be high, resulting in loss to the customer. In addition, if a platform provides a driver with an order beyond his delivery scope, it will increase the driver’s bypass distance, leading to unnecessary logistics costs. Therefore, logistics resources-demand match empowers drivers to meet customers’ needs, thus improving customer satisfaction and logistics reliability. In addition, logistics resources-demand match is achieved through a platform’s informative support. It can be seen that a platform’s informative support contributes to the improvement of drivers’ logistics performance by matching the supply and demand for logistics resources. Thus, we posit that:
H2b:
Logistics resources-demand match is positively related to logistics performance.
H2c:
Logistics resources-demand match mediates the relationship between a platform’s informative support and logistics performance.
3.3. The Mediating Effect of Logistics Agility
Logistics agility, in this study, refers to drivers’ ability to rapidly respond to changes in market and customer demand [12]. It is considered to be critical to tackle unanticipated changes deriving from environments and customer needs [29]. Extant studies in supply chain text point out that information-management capabilities lead to agility [30,31], because information integration supported by information-management capabilities enables an organization to achieve rich and real-time information across the supply chain [32]. Such information integration allows an organization to adjust plans rapidly, with minimal resource costs [33].
In the context of crowd logistics, a platform’s informative support can also be considered a type of information management capability. Thus, we think that it leads to logistics agility. Platforms usually equip drivers with GPS systems and help them schedule [4,28]. When customers put forth personalized requirements, platforms can provide drivers with responsive logistics solutions. On the other hand, platforms can also adjust logistics plans by collecting information from external environments. For example, platforms provide drivers with channels to share traffic data, which can be used to adjust delivery solutions, thus increasing response speed to accidents [6]. That is to say, a platform’s informative support provides necessary information to the drivers to deal with non-routine incidents such as traffic accidents, and changes in delivery timelines and destinations [34].
In view of the above research, a platform’s informative support, as part of the information-processing mechanism, will have a positive impact on the improvement of logistics agility. From this, we can draw the following hypothesis:
H3a:
A platform’s informative support is positively related to logistics agility.
In supply chain research, scholars think that supply chain agility is able to contribute to performance by a more effective response to external supply disruptions [35]. In particular, supply chain agility can help affirm master marketplace changes [36,37], thereby reducing the cost of demand uncertainty [38]. Besides, agility also helps to react effectively to a customer’s individual specifications by providing mass customization [39], achieving high customer responsiveness. Following this view, since logistics agility can aid drivers’ efforts to “identify changes from the environment and customers’ needs quickly or neutralize threats from turbulent environments” [40], we can see that logistics agility empowers drivers to adapt to changing environments and ultimately lead to logistics performance [41]. In addition, logistics agility is predicted by real-time information sharing and logistics solutions with the help of a platform’s informative support. It can be seen that a platform’s informative support can improve drivers’ logistics performance by improving logistics agility. Thus, we make the following assumptions:
H3b:
Logistics agility is positively related to logistics performance.
H3c:
Logistics agility mediates the relationship between a platform’s informative support and logistics performance.
3.4. The Moderating Effects of Platform’s Ease of Use
Platform’s ease of use means that using a platform is effortless for users [42]. According to organization information processing theory, we think that the easier a platform is to use, the better the platform’s informative support will be. In particular, if a platform is too difficult to use, a driver may be limited to using only certain functions of the platform, thus missing out on more useful information. The easier a platform is to use, the richer is the information drivers receive, and the stronger drivers’ information processing capabilities will be in dealing with task-related uncertainties. Therefore, we believe that a platform’s ease of use plays a positive role in the relationship between its informative support, and logistics resources-demand match and logistics agility. Thus, we draw the following hypotheses:
H4a:
A platform’s ease of use strengthens the positive relationship between its informative support and logistics resources-demand match, such that the relationship is stronger when the platform is easier to use.
H4b:
A platform’s ease of use strengthens the positive relationship between platform’s informative support and logistics agility such that the relationship is stronger when the platform is easier to use.
We have developed theoretical arguments for the mediating effects of logistics resources-demand match and logistics agility. In addition, we also underpinned the moderating effects of a platform’s ease of use on the relationship between its informative support and logistics resources-demand match as well as its informative support-logistics agility relationship. In particular, the high level of logistics resources-demand match predicts a high level of logistics performance. With informative support provided by a platform that is easier to use, drivers can effortlessly get richer information about logistics service requests and logistics solutions, further predicting a high level of logistics performance. Hence, this suggests a moderated mediation relationship to further posit that:
H5a:
A platform’s ease of use strengthens the indirect effect of its informative support on logistics performance via logistics resources-demand match, such that the indirect effect is stronger when a platform is easier to use.
H5b:
A platform’s ease of use strengthens the indirect effect of its informative support on logistics performance via logistics agility, such that the indirect effect is stronger when a platform is easier to use.
4. Methodology
In this section, we developed scales for platform’s informative support and logistics resources-demand match for further empirical study. Based on the scale development, we conducted a survey using new measures for informative support and logistics resources-demand match and pre-established measures for logistics performance, logistics agility, and the platform’s ease of use.
4.1. Pretest Procedure for PIS And LRDM Scale Development
To develop scales for platform’s informative support (PIS) and logistics resources-demand match (LRDM), we employed several steps to build and test scales [7]. In the first step, we analyzed related literature to specify the concepts of the two constructs and collected existing items to measure similar variables. We mainly refer to several aspects examined by Daugherty, Myers, and Richey [43], Daugherty et al. [44] and Jeffers [45] in measuring information technology and the items proposed by Astakhova, Beal, and Camp [46] and Cable & DeRue [26] in measuring demand-capabilities match. We then conducted in-depth interviews with managers of several crowd logistics companies to further collect information. Before conducting interviews, we randomly chose 25 crowd logistics companies, which were selected by the Chinese government to pilot crowd logistics. These samples have achieved great performance in the development of crowd logistics and could represent the basic characteristics of the objects under study. After we e-mailed an introduction of our study to their managers, respectively, six companies responded and agreed to participate in the interviews. We then e-mailed the managers of these companies a specific study plan and an interview protocol to inform them of the specific interview steps. The interviews were conducted in August 2018. We summarized the information obtained and developed new items that were not mentioned in previous literature. We generated 11 items for PIS and 5 items for LRDM from a thorough investigation of the literature. The items for PIS describes the support provided by the platform that promotes the match of logistics resources with drivers, and provides drivers with delivery schedules. The items for LRDM describes the congruence between logistics service requests and drivers’ capabilities and preferences.
After generation of the initial items, we conducted more interviews. This procedure is recommended when a construct is relatively new in the field and has seen limited to no operationalization [47]. We consulted, in August 2018, academic experts and practitioners (the managers who were interviewed in the first step) who were familiar with crowd logistics platforms to assess the appropriateness of items. We also asked drivers who used logistics platforms to evaluate the initial questionnaire; taking their feedback into consideration, we revised the questionnaire and improved its readability and practicality. According to the feedback, we merged some items and were finally left with 6 items for PIS and 4 for LRDM.
In the final step, we conducted a pretest in a crowd logistics company in China in September 2018 to assess our initial scale with 7 Likert-type scale items by collecting data from drivers who used the crowd logistics platform. After generating initial items, we contacted the managers who were interviewed before and e-mailed them the initial questionnaires to show the specific contents of our survey. One of these companies agreed to support us with data collection. At the start of our survey, we conducted a brief interview with the respondents (i.e., the drivers) to confirm that they had a good knowledge of the platform’s informative support and logistics resources-demand match. We collected a total of 300 questionnaires and deleted questionnaires wherein respondents had selected the same number for all questions. A total of 265 valid questionnaires were obtained.
We conducted reliability and validity analysis in the pretest. First, we tested the reliability of the scale we developed. Generally, Cronbach’s alpha coefficient is used to show the reliability of the scale [48]. Related studies considered 0.7 as the cut-off value of reliability. As shown in Table 1, the Cronbach’s alpha values of the two variables are greater than 0.7. These results suggest that the scales exhibit good reliability.

Table 1.
Scale development-EFA results.
Second, we conducted exploratory factor analysis (EFA) on the two variables in SPSS using principal component analysis and extracted the factors whose eigenvalues are greater than 1.00 [49]. The results showed that the Keyser-Meyer-Olkin (KMO) measure of sampling adequacy of PIS was 0.887 and the χ2 was 765.662 (d.f. = 15, p = 0.000), while that of LRDM was 0.824 and the χ2 was 575.464 (d.f. = 6, p = 0.000). As the KMO measures of the two variables are greater than the benchmark value of 0.6, it suggests that factor analysis can provide reliable factors [50]. By conducting EFA, we also attained the factor loading of each item in the scale. The factor loadings of all items are all greater than the recommended value of 0.50, which suggests convergent validity. These values are provided in Table 1.
Third, we assessed discriminant validity of the constructs. Discriminant validity between two constructs can be measured by constraining the estimated correlation parameter between them to 1.0 and then conducting a chi-square difference test on the results of the two competing models—the constrained and unconstrained ones [51]. A significant chi-square difference shows that discriminant validity between the two constructs is established [52]. The results in Table 2 indicates the discriminant validity between the two constructs.
Table 2.
Test for measurement of discriminant validity.
4.2. Sample and Data Collection
Our sample is from two large crowd logistics companies in China. To conduct a large-scale survey, we contacted the previous interviewed managers who were familiar with our study. We e-mailed them both the final questionnaires and the survey plan to inform them of the specific data collection process, and also promised to offer a study report that would highlight drivers’ perception of platform support, analyze the pros and cons of their own business model, and offer advice based on that data. Two of these companies agreed to help us with the survey. After obtaining the CEOs’ consent, the staff of the information service and logistics business departments helped us conduct the survey. In order to ensure accuracy of data and response rates, we selected drivers who used crowd logistics platforms. It is reasonable to expect that the drivers had good knowledge of platform informative support because they use such platforms frequently.
We sent printed questionnaires to the respondents. Accompanied by staff of the logistics business departments, we visited the logistics distribution centers of the two companies in October 2018 with printed questionnaires for the drivers. At the beginning of the survey, the researchers introduced our research purpose to the respondents and emphasized on the anonymity of this survey. To motivate the drivers to participate in our survey, we gave every driver who completed the questionnaire a reward of 10 RMB. The drivers were asked to complete the questionnaire and return it to the investigator at the earliest. A total of 343 questionnaires were collected in this data survey. We deleted invalid questionnaires and were left with 321 questionnaires. A profile outline of the respondents is given in Table 3.
Table 3.
Profile of respondents.
We tested non-response bias by comparing the answers of early (top 30) and late respondents (last 30). At the 5% significance level, there are no significant differences between the answers of early and late respondents. According to Armstrong & Overton (1977), we believe that there is no non-response bias in our data collection [53].
Given that a single data source (i.e., drivers) responds to the items of our study, we need to check for a possible common method bias. To do so, we used the Harman’s one-factor test [54]. The results showed that there were five factors with eigenvalues greater than 1.0 emerging from the factor analysis, accounting for 80.957% of the variance. The first factor accounted for 32.983% of the variance, lower than the cut-off value of 40%, which indicated that the common method bias was not a serious problem [55].
4.3. Measures
All scales used in this essay are based on scales that are already published, in addition to PIS and LRMD scales. In order to guarantee equivalence in meaning of the scales used in this research, we applied a standard double-back-translation method. We invited two Ph.D. candidates to complete the translation work. One helped us translate the English scale into Chinese, the other translated the Chinese questionnaire back into English to ensure that there were not semantic differences between the two versions. In addition, we consulted several scholars and asked employees in crowd logistics companies to verify the items in the Chinese edition. According to feedback from the people mentioned above, we slightly modified some items in the scale. Unless otherwise stated below, all participants completed a 7-point Likert-type scale (1 = Strongly Disagree, 4 = Neutral, and 7 = Strongly Agree) for all the items. Appendix A shows the items in the questionnaire.
Logistics performance (LP): Logistics performance was measured by 6 items adapted from Zacharia, Nix and Lusch [56]. The respondents were asked to self-evaluate their performance on a Likert scale, ranging from strongly disagree (1) to strongly agree (7). A sample item includes: “Quicker delivery results” and “Improved quality”. The Cronbach’s alpha of the scale in our study was 0.935.
Logistics agility (LA): Logistics agility was measured by the 4 items that increase customization and improve delivery performance, adapted from Swafford, Ghosh and Murthy [46]. This scale has been widely used in measuring logistics agility and was validated in the empirical study [31,57]. The respondents were asked to self-evaluate their performance on a Likert scale ranging from strongly disagree (1) to strongly agree (7). A sample item includes: “Speed in adjusting delivery solutions” and “Speed in improving customer service”. The Cronbach’s alpha of the scale in our study was 0.923.
Platform’s ease of use (PEU): Ease of use was measured by 4 items adapted from Pavlou [42]. This scale has been widely used in measuring ease of use and it was validated in the empirical study [58,59]. Respondents were asked to self-evaluate their performance on a Likert scale ranging from strongly disagree (1) to strongly agree (7). A sample item includes: “I find this platform easy to use” and “I find it easy to locate the information that I need in this platform”. The Cronbach’s alpha of the scale in our study was 0.969.
Control variables: This study considered three control variables, namely, periods of service (PS), periods of using a platform (PUP), and frequency of using a platform (FUP). The longer drivers participate in the logistics industry, the more experienced they are; and the more reliable their logistics services will be, the better the logistics performance will be. According to the OIPT, the longer a driver uses a platform and the more frequently a driver uses a platform; and the more information the platform will get from the driver, the more precise the match between demand and supply will be. From this perspective, these three control variables will have an impact on logistics performance. The periods of service were assessed by the item: “How long have you been engaged in logistics?” on a Likert scale. The periods of using a platform was measured by the item: “How long have you been using the platform” on a Likert scale. The frequency of using a platform was assessed by the item: “How often do you use the platform”.
4.4. The Measurement Model
We employed CFA by using Mplus 7 to assess the reliability and validity of the scales. In CFA, comparative fit index (CFI), Tucker-Lewis index (TLI) and root mean square error of approximation index (RMSEA) are used to assess the measurement model [60]. A model is considered to be satisfactory if χ2/df < 3, CFI > 0.90, RMSEA < 0.08, and TLI > 0.90 [61]. The CFA results indicated that a good fit of the measurement model (χ2/df =1.685, RMSEA = 0.046, SRMR=0.039, CFI = 0.977, TLI=0.973). The CFA results are shown in Table 4.
Table 4.
The fit indexes of the measurement model.
We used factor loadings, composite reliability (CR) of constructs, and average variance extracted (AVE) to test convergent validity. The factor loadings of all items were higher than the suggested value of 0.50, as shown in Table 5 and they are all significant at the level of 0.01, which showed high convergence. As Table 5 shows, the CR values are from 0.925 to 0.970 and the AVE scores range from 0.691 to 0.889. If the CR coefficients are greater than the benchmark of 0.7 and the AVE values are above the suggested value of 0.5, the convergent validity is considered to be supported [62]. We then conducted a chi-square difference test to assess discriminant validity. We employed the chi-square difference test for every two latent variables, as shown in Table 6. The results indicate a significant chi-square difference for each pair of latent variables, which support the discriminant validity for every two constructs.
Table 5.
Summary statistics (convergent validity).
Table 6.
Test for measurement of discriminant validity.
4.5. Descriptive Analysis
Table 7 shows the means, standard deviations of variables in our study. In addition, the square roots of the AVEs for all constructs were greater than the correlations coefficients between constructs, which confirmed the discriminant validity of the measurement model [63].
Table 7.
Means, standard deviation, and correlations.
5. Analysis and Results
5.1. Structural Relationship Model
We used Mplus 7 to calculate the results of the structural equation model (SEM) and present the standardized coefficients (Figure 2). In this study, we included PS, PUP, and FUP as control variables. The results showed a good fit between the structural model and the data (χ2/d.f. = 1.782, RMSEA = 0.049, CFI = 0.968, TLI = 0.964).
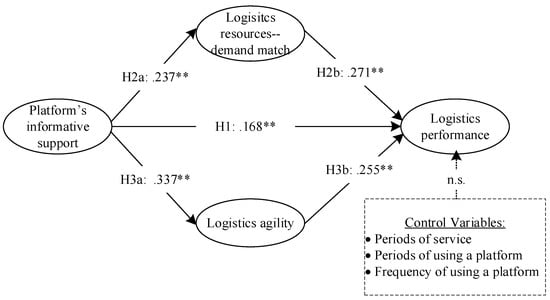
Figure 2.
Results of Structural Relationship Analysis. Note: * p < 0.05, ** p < 0.01, χ2 = 395.624, df = 222, CFI = 0.968, TLI = 0.964, RMSEA = 0.049.
The results shown in Table 8 demonstrated that the hypotheses H1, H2a, H2b, H3a, H3b were supported. The results indicated that PIS had a positive effect on LP (β = 0.168, p < 0.01), as anticipated in H1. PIS was also positively related to LRDM (β = 0.237, p < 0.01) and LA (β = 0.337, p < 0.01), thus supporting H2a and H3a, respectively. Consistent with H2b and H3b, both LRDM (β = 0.271, p < 0.01) and LA (β = 0.255, p < 0.01) were positively related to LP. However, the control variables had no significant effects on the dependent variable, LP.
Table 8.
Results with path coefficients for direct hypotheses testing.
5.2. Mediating Effect Testing
We aimed to explore whether LRDM and LA mediate the relationship between PIS and LP with the method of bootstrapping approach (with n = 5000 bootstrap resamples) proposed by Preacher and Hayes [64]. We employed the bootstrap method instead of the method proposed by Baron and Kenny [65] and Sobel Test [66] because the bootstrap method showed more statistical power and made the test robust [67]. It can be used to examine multiple mediation effects simultaneously and test the overall indirect effects [64]. If zero is not contained in the 95 percent confidence interval, the point estimates of indirect effects are considered significant [68].
The bootstrapping analysis results attained by Mplus 7 are presented in Table 9. The results showed the significant mediating effect of LRDM (β = 0.064) in the relationship between PIS and LP at p < 0.05 with 95% CI = [0.033–0.108], as anticipated in H2c. Moreover, consistent with H3c, the mediating effect of LA (β = 0.086) in the relationship between PIS and LP was also significant at p < 0.05 with 95% CI = [0.044–0.141]. In addition, PIS still showed a significant direct impact on LP (β = 0.168, p < 0.01), which indicated the partial mediating effects of the two mediators [68].
Table 9.
Bootstrapping results for mediation relationship tests.
5.3. Moderating Effect Testing
We performed hierarchical multiple regression analysis using SPSS to test whether PEU moderated the effect of PIS on LRDM and LA. After controlling for the effects of the control variables, we introduced the independent variable PIS, the moderator PEU and the interaction of PIS with PEU into the model, one by one. It was found that the interaction of PIS with PEU had a significant positive effect on LRDM (β = 0.141, p < 0.01), thus supporting H4a. That is to say, the positive relationship between PIS and LRDM is stronger at a high level of PEU, as compared to a lower level. Figure 3 illustrates the interaction effects by using Stone and Hollenbeck’s [69] procedure. In addition, the interaction of PIS with PEU was not significantly related to LA (β = 0.051, p = 0.325). Thus, H4b was rejected. The specific results are shown in Table 10.
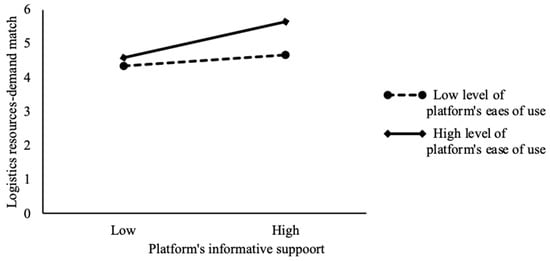
Figure 3.
Moderating Effect of A Platform’s Ease of Use on the Relationship Between PIS and LRDM.
Table 10.
The Moderating Effect of PEU on the Relationship between PIS and LRDM.
Furthermore, results in Table 11 provide empirical tests for our moderated mediation hypotheses H5a and H5b. Table 12 demonstrates that PEU significantly moderates the indirect relationship between PIS and LP via LRDM (β = 0.022,95% CI = [0.008, 0.041]), supporting H5a. However, PEU does not significantly moderate the indirect relationship between PIS and LP via LA (95% CI = [−0.007, 0.025]); thus, H5b was rejected. Specifically, LRDM has a significant mediation effect on the relationship between PIS and LP when PEU is at a high level (i.e., conditional mediation effect = 0.116, 95% CI = [0.065, 0.186]) as compared to a lower level (i.e., conditional mediation effect = 0.005, n.s.). In addition, the conditional mediation effects of PIS on LP via LA have no significant differences at a high level (β = 0.115) as opposed to a lower level (β = 0.075).
Table 11.
Index of Moderated Mediation.
Table 12.
Conditional Indirect Effects at Values of the Moderators.
6. Discussion
Our study provides novel and important insights into the process through which a platform’s informative support influences logistics performance as well as under what conditions such a process is affected. We find that logistics resources-demand match and logistics agility mediate the platform informative support-logistics performance relationship. Furthermore, a platform’s ease of use shows moderating effects. Our results provide empirical support for a theoretical model based on scale development for platform’s informative support and logistics resources-demand match.
6.1. Theoretical Implications
First, a contribution of our study is that we construct a theoretical framework for the platform’s informative support-logistics performance relationship based on organization information processing theory. By conducting case studies, scholars pointed out that crowd logistics platforms assist drivers in providing customers with faster and more flexible logistics services and help save costs [27,28]. However, few studies could explain how crowd logistics platforms contribute to logistics performance. Our study investigated the process through which a crowd logistics platform’s informative support affects logistics performance and conducted an empirical study. The empirical results show that logistics resources-demand match (β = 0.064, 95% CI = [0.033–0.108]) and logistics agility (β = 0.086, 95% CI = [0.044–0.141]) partially mediate the relationship between a platform’s informative support and drivers’ logistics performance. These novel results expand the crowd logistics platforms literature by specifying why and how informative support by platforms influences logistics performance.
Second, a further contribution of our study to the crowd logistics platform literature is that we found a moderator of this process by which a platform’s informative support affects logistics performance. Extant literature only suggested that crowd logistics platforms contributed to logistics performance through case studies [4], but did not specify the boundary conditions that affect the relationship between platform’s informative support and logistics performance. In contrast, this study posits that a platform’s ease of use is the boundary condition, and strengthens the relationship between platform’s informative support and logistics resources-demand match (β = 0.141, p < 0.01). Furthermore, a platform’s ease of use also strengthens the indirect relationship between a platform’s informative support and logistics performance via logistics resources-demand match (β = 0.022, 95% CI = [0.008, 0.041]). In particular, platform’s informative support has a greater influence on logistics resources-demand match at a high level of ease of use as opposed to a lower level. Moreover, platform’s informative support also indirectly predicts more logistics performance at a high level of the platform’s ease of use.
Third, this paper developed scales for the two constructs: platform’s informative support and logistics resources-demand match. Because of the nascent nature of crowd logistics, scholars normally conduct qualitative, instead of quantitative studies. The literature explores the business model of crowd logistics [5,6,70], the basic functions of crowd logistics platforms [28], and the value outcomes of crowd logistics [27]. However, a few of them have conducted empirical studies to explore the relationship between crowd logistics and logistics performance because of a lack of measures. We developed initial items through extant literature and interviews and purified the scales by consulting academic experts and managers of crowd logistics companies. We then received 265 valid responses by conducting surveys, and tested the structure, reliability and validity by performing EFA and CFA. The results showed that we developed 6 items for platform’s informative support and 4 items for logistics resources-demand match. The scale development research contributes to theoretical literature by providing a tested instrument, which allows for in-depth empirical studies on related topics.
6.2. Managerial Implication
The findings of this study provide insights into the design of effective strategies for informative support in order to enhance logistics performance.
Firstly, according to empirical research results, a platform’s informative support can reduce logistics costs and improve logistics efficiency. We have illustrated that the crowd logistics supported by information technology can help drivers reduce costs and contribute to urban transport sustainability. This finding provides insights for practitioners that crowd logistics is a sustainable business model, which provides efficient logistics service for customers.
Secondly, it emphasizes the important role of a platform’s informative support in promoting drivers’ logistics performance. Based on this finding, the development of crowd logistics companies needs to focus on the informative functions. Machine learning algorithm, GPS system, decision support systems, database, and other information support systems are required for platforms to provide drivers with matching orders, effective routing solutions, and information sharing channels.
Thirdly, a platform’s ease of use moderates the relationship between a platform’s informative support and logistics resources-demand match. Based on this finding, the simplification of a platform’s design is another direction that needs to be focused. Crowd logistics companies should take into account users’ experience and perceived utility to make platforms easier to use.
6.3. Limitations and Future Research
First, this article only studies the impact of a platform’s informative support on logistics performance. However, crowd logistics platforms not only provide informative support but also provide feedback systems, secure online payment system, and insurance [70]. These supports control risks and ensure the security of transaction and operational processes [4]. Thus, they play important roles in improving the reliability of logistics services, contributing to logistics performance. Therefore, future research can conduct in-depth research on the mechanisms through which risk control support provided by crowd logistics platforms impact logistics performance.
Second, the data for this study came from the drivers participating in crowd logistics in China. Crowd logistics platforms in other countries may have different functions. This might lead to different influence mechanisms of platform support on logistics performance. Therefore, future research is needed to determine whether the findings reported here are valid in other countries.
Third, considering the difficulty of gathering data from hundreds of managers from crowd logistics companies, our study used drivers who used the crowd logistics platforms to collect data. However, the managers and technicians managing these platforms may have more knowledge of platform support and could give us more accurate and profound data. Future research might be undertaken to collect data from multiple informants, thus enhancing the validity of the findings [24].
7. Conclusions
Grounded in organization information processing theory, we construct and test a model that explains how a platform’s informative support affects logistics performance. After developing scales for platform’s informative support and logistics resources-demand match, we find that logistics resources-demand match and logistics agility can mediate a positive relationship between a platform’s informative support and logistics performance. In addition, a platform’s ease of use plays a moderating role in both the effect of platform’s informative support on logistics resources-demand match and indirectly affects logistics performance. However, the moderating effect of a platform’s ease of use on the positive relationship between a platform’s informative support and logistics agility is not significant. Overall, this paper contributes to the crowd logistics literature by exploring the theoretical mechanisms through which a platform’s informative support predicts logistics performance.
In addition, this paper also indicates that crowd logistics, which is a new business model, predicts logistics performance and contributes to sustainable urban transport. In particular, with platform’s informative support, crowd logistics increases efficiency of vehicle usage and reduces empty mileage, which leads to reduction of emissions and traffic. Furthermore, crowd logistics companies need to focus on platforms’ informative functions to promote the development of crowd logistics and transport sustainability.
Author Contributions
All authors contributed extensively to the study. M.Z. proposed the theoretical model, planned the questionnaire and provided research support. Y.X. contacted the respondents, conducted the survey, and collected data. S.L. analyzed the data and wrote this paper. Both W.W. and S.W. planned the questionnaire, provided research support, guidance and advice throughout the study.
Funding
This work was funded by the Major Program of The National Social Science Fund of China #1, grant number 15ZDA022; Major Program of The Humanity and Social Science Fund of Beijing Jiaotong University#2, grant number 2015jbzd01 and Fundamental Research Funds for The Central Universities#3, grant number 2018YJS057.
Acknowledgments
All authors thank the editor and anonymous reviewers for their constructive comments and suggestions to improve the quality of this paper. The authors thank the interviewees who gave feedback on our scale development process, and the respondents who participated the survey.
Conflicts of Interest
The authors declare no conflict of interest. The funders had no role in the design of the study; in the collection, analyses, or interpretation of data; in the writing of the manuscript, or in the decision to publish the results.
Appendix A
Table A1.
Construct items (items, factor loadings and Cronbach’s alpha).
Table A1.
Construct items (items, factor loadings and Cronbach’s alpha).
| Construct | Item | Factor Loading | Cronbach’s Alpha |
|---|---|---|---|
| Platform’s informative support | 0.930 | ||
| PIS1 | The platform provides me with an access method to locate logistics service requests *. | 0.886 | |
| PIS2 | The platform gathers and categorizes information and constructs an integrated database *. | 0.857 | |
| PIS3 | The platform will assign appropriate logistics service requests for me *. | 0.824 | |
| PIS4 | The platform provides me with delivery solutions *. | 0.828 | |
| PIS5 | The platform provides me with real-time GPS navigation *. | 0.801 | |
| PIS6 | The platform will help me adjust the delivery routes and solutions in case of changes *. | 0.789 | |
| Logistics resources-demand match | 0.943 | ||
| LRDM1 | The platform can help me to find matched logistics service requests *. | 0.931 | |
| LRDM2 | The match is very good between the logistics service requests and my capability *. | 0.912 | |
| LRDM3 | The match is very good between the logistics service requests and my preference *. | 0.882 | |
| LRDM4 | The platform can help me to find matched logistics service requests quickly *. | 0.865 | |
| Logistics agility | 0.923 | ||
| LA1 | Speed in adjusting delivery solutions | 0.794 | |
| LA2 | Speed in improving customer service | 0.888 | |
| LA3 | Speed in improving delivery reliability | 0.912 | |
| LA4 | Speed in improving responsiveness to customers’ needs | 0.881 | |
| Logistics performance | 0.935 | ||
| LP1 | Lower costs | 0.846 | |
| LP2 | Better customer service | 0.839 | |
| LP3 | Quicker delivery results | 0.825 | |
| LP4 | Reduced cycle time or lead time | 0.875 | |
| LP5 | Improved quality | 0.869 | |
| LP6 | Improved value to our customers | 0.789 | |
| Platform’s ease of use | 0.969 | ||
| PEU1 | My interaction with this platform is clear and understandable. | 0.949 | |
| PEU2 | Interacting with this platform does not require a lot of mental effort. | 0.943 | |
| PEU3 | I find this platform easy to use. | 0.945 | |
| PEU4 | I find it easy to locate the information that I need in this platform. | 0.935 |
* refers to the items which have been retained in the process of scale development.
References
- Castillo, V.E.; Bell, J.E.; Rose, W.J.; Rodrigues, A.M. Crowdsourcing Last Mile Delivery: Strategic Implications and Future Research Directions. J. Bus. Logist. 2018, 39, 7–25. [Google Scholar] [CrossRef]
- Ministry of Transport of China. Public Notice of the General Office of the Ministry of Transport on Further Improving the Pilot Work of Non-truck Carriers. 2017. Available online: http://zizhan.mot.gov.cn/zfxxgk/bnssj/dlyss/201711/t20171121_2938673.html (accessed on 10 October 2018).
- Carbone, V.; Rouquet, A.; Roussat, C. Carried Away by the Crowd: What Types of Logistics Characterize Collaborative Consumption? In Proceedings of the 1st International Workshop on Sharing Economy, Copernicus Institute of Sustainable Development, Utrecht, The Netherlands, 4–5 June 2015. [Google Scholar]
- Carbone, V.; Rouquet, A.; Roussat, C. The Rise of Crowd Logistics: A New Way to Co-Create Logistics Value. J. Bus. Logist. 2017, 38, 238–252. [Google Scholar] [CrossRef]
- Sampaio, A.; Savelsbergh, M.; Veelenturf, L.; van Woensel, T. Crowd-based City Logistics. Available online: http://www.optimization-online.org/DB_FILE/2017/11/6346.pdf (accessed on 8 June 2018).
- Mladenow, A.; Bauer, C.; Strauss, C. ‘Crowd Logistics’: The Contribution of Social Crowds in Logistics Activities. Int. J. Web Inf. Syst. 2016, 12, 379–396. [Google Scholar] [CrossRef]
- Churchill, G.A. A Paradigm for Developing Better Measures of Marketing Constructs. J. Mark. Res. 1979, 16, 64–73. [Google Scholar] [CrossRef]
- Straub, D.W. Validating instruments in MIS research. MIS Q. 1989, 13, 147–169. [Google Scholar] [CrossRef]
- Mehmann, J.; Frehe, V.; Teuteberg, F. Crowd Logistics—A Literature Review and Maturity Model. Innov. Strateg. Logist. Supply Chain. 2015, 20, 117–145. [Google Scholar]
- Grover, V.; Malhotra, M. A Framework for Examining the Interface between Operations and Information Systems: Implications for Research in the New Millennium. Decis. Sci. 1999, 30, 901–920. [Google Scholar] [CrossRef]
- Kent, J.L.; Mentzer, J.T. The Effect of Investment in Interorganizational Information Technology in a Retail Supply Chain. J. Bus. Logist. 2011, 24, 155–175. [Google Scholar] [CrossRef]
- Paulraj, A.; Chen, I.J. Strategic buyer-supplier relationships, information technology and external logistics integration. J. Supply Chain Manag. 2007, 43, 2–14. [Google Scholar] [CrossRef]
- Cegielski, C.G.; Jones-Farmer, L.A.; Wu, Y.; Hazen, B.T. Adoption of cloud computing technologies in supply chains: An organizational information processing theory approach. Int. J. Logist. Manag. 2012, 23, 184–211. [Google Scholar] [CrossRef]
- Premkumar, G.; Ramamurthy, K.; Saunders, C.S. Information processing view of organizations: An exploratory examination of fit in the context of interorganizational relationships. J. Manag. Inf. Syst. 2005, 22, 257–294. [Google Scholar] [CrossRef]
- Galbraith, J.R. Designing Complex Organizations; Addison-Wesley Publishing: Boston, MA, USA, 1973. [Google Scholar]
- Galbraith, J. Organization Design: An Information Processing View. Interfaces 1974, 4, 28–36. [Google Scholar] [CrossRef]
- Tushman, M.L.; Nadler, D.A. Information processing as an integrating concept in organizational design. Acad. Manag. Rev. 1978, 3, 613–624. [Google Scholar]
- Daft, R.L.; Lengel, R.H. Organizational information requirements, media richness and structural design. Manag. Sci. 1986, 32, 554–571. [Google Scholar] [CrossRef]
- Melville, N.; Ramirez, R. Information technology innovation diffusion: An information requirements paradigm. Inf. Syst. J. 2008, 18, 247–273. [Google Scholar] [CrossRef]
- Green, K.W.; Whitten, D.; Inman, R.A. The impact of logistics performance on organizational performance in a supply chain context. Supply Chain Manag. 2008, 12, 317–327. [Google Scholar] [CrossRef]
- Premkumar, G.; Ramamurthy, K.; Crum, M. Determinants of EDI adoption in the transportation industry. Eur. J. Inf. Syst. 1997, 6, 107–121. [Google Scholar] [CrossRef]
- Li, G.; Yang, H.J.; Sun, L.Y.; Sohal, A.S. The impact of IT implementation on supply chain integration and performance. Int. J. Prod. Econ. 2009, 120, 125–138. [Google Scholar] [CrossRef]
- Bayraktar, E.; Demirbag, M.; Koh, S.L.; Tatoglu, E.; Zaim, H. A causal analysis of the impact of information systems and supply chain management practices on operational performance: Evidence from manufacturing SMEs in Turkey. Int. J. Prod. Econ. 2009, 122, 133–149. [Google Scholar] [CrossRef]
- Ye, F.; Wang, Z. Effects of information technology alignment and information sharing on supply chain operational performance. Comput. Ind. Eng. 2013, 65, 370–377. [Google Scholar] [CrossRef]
- Rosenzweig, E.D.; Roth, A.V.; Dean, J.W. The influence of an integration strategy on competitive capabilities and business performance: An exploratory study of consumer products manufacturers. J. Oper. Manag. 2003, 21, 437–456. [Google Scholar] [CrossRef]
- Cable, D.M.; DeRue, D.S. The convergent and discriminant validity of subjective fit perceptions. J. Appl. Psychol. 2002, 87, 875–884. [Google Scholar] [CrossRef] [PubMed]
- Buldeo Rai, H.; Verlinde, S.; Merckx, J.; Macharis, C. Crowd logistics: An opportunity for more sustainable urban freight transport? Eurtransp. Res. Rev. 2017, 9, 39. [Google Scholar] [CrossRef]
- Odongo, B. How Crowd Sourcing Is Changing the Face of Last Mile Delivery-Crowd Logistics? Bachelor’s Thesis, JAMK University of Applied Science, Jyväskylä, Finland, 2017. [Google Scholar]
- Sharp, J.M.; Irani, Z.; Desai, S. Working Towards Agile Manufacturing in the UK Industry. Int. J. Prod. Econ. 1999, 62, 155–169. [Google Scholar] [CrossRef]
- Overby, E.; Bharadwaj, A.; Sambamurthy, V. Enterprise agility and the enabling role of information technology. Eur. J. Inf. Syst. 2006, 15, 120–131. [Google Scholar] [CrossRef]
- Swafford, P.M.; Ghosh, S.; Murthy, N. Achieving supply chain agility through IT integration and flexibility. Int. J. Prod. Econ. 2008, 116, 288–297. [Google Scholar] [CrossRef]
- Liu, H.F.; Ke, W.L.; Wei, K.K.; Hua, Z.S. The impact of IT capabilities on firm performance: The mediating roles of absorptive capacity and supply chain agility. Decis. Support. Syst. 2013, 54, 1452–1462. [Google Scholar] [CrossRef]
- Srinivasan, R.; Swink, M. Leveraging supply chain integration through planning comprehensiveness: An organizational information processing theory perspective. Decis. Sci. 2015, 46, 823–861. [Google Scholar] [CrossRef]
- Ellram, L.M.; Cooper, M.C. Supply Chain Management, Partnerships, and the Shipper-Third Party Relationship. Int. J. Logist. Manag. 1990, 1, 1–10. [Google Scholar] [CrossRef]
- Blome, C.; Schoenherr, T.; Rexhausen, D. Antecedents and enablers of supply chain agility and its effect on performance: A dynamic capabilities perspective. Int. J. Prod. Res. 2013, 51, 1295–1318. [Google Scholar] [CrossRef]
- Cao, M.; Zhang, Q. Supply chain collaboration: Impact on collaborative advantage and firm performance. J. Oper. Manag. 2011, 29, 163–180. [Google Scholar] [CrossRef]
- Frohlich, M.T.; Westbrook, R. Demand chain management in manufacturing and services: Web-based integration, drivers and performance. J. Oper. Manag. 2002, 20, 729–745. [Google Scholar] [CrossRef]
- Braunscheidel, M.J.; Suresh, N.C. The organizational antecedents of a firm’s supply chain agility for risk mitigation and response. J. Oper. Manag. 2009, 27, 119–140. [Google Scholar] [CrossRef]
- Sanchez, L.M.; Nagi, R. A review of agile manufacturing systems. Int. J. Prod. Res. 2001, 39, 3561–3600. [Google Scholar] [CrossRef]
- Van Hoek, R.I.; Harrison, A.; Christopher, M. Measuring agile capabilities in the supply chain. Int. J. Oper. Prod. Manag. 2001, 21, 126–147. [Google Scholar] [CrossRef]
- Swafford, P.M.; Ghosh, S.; Murthy, N. The antecedents of supply chain agility of a firm: Scale development and model testing. J. Oper. Manag. 2006, 24, 170–188. [Google Scholar] [CrossRef]
- Pavlou, P.A. Consumer acceptance of electronic commerce: Integrating trust and risk with the technology acceptance model. Int. J. Electron. Commun. 2003, 7, 101–134. [Google Scholar] [CrossRef]
- Daugherty, P.J.; Myers, M.B.; Richey, R.G. Information support for reverse logistics: The influence of relationship commitment. J. Bus. Logist. 2002, 23, 85–106. [Google Scholar] [CrossRef]
- Daugherty, P.J.; Richey, R.G.; Genchev, S.E.; Chen, H. Reverse logistics: Superior performance through focused resource commitments to information technology. Transp. Res. Part E Logist. Transp. Rev. 2005, 41, 77–92. [Google Scholar] [CrossRef]
- Jeffers, P.I. Embracing sustainability: Information technology and the strategic leveraging of operations in third-party logistics. Int. J. Oper. Prod. Manag. 2010, 30, 260–287. [Google Scholar] [CrossRef]
- Astakhova, M.N.; Beal, B.D.; Camp, K.M. A cross-cultural examination of the curvilinear relationship between perceived demands-abilities fit and risk-taking propensity. J. Bus. Res. 2017, 79, 41–51. [Google Scholar] [CrossRef]
- Lawshe, C.H. A quantitative approach to content validity. Pers. Psychol. 1975, 28, 563–575. [Google Scholar] [CrossRef]
- Hull, C.H.; Nie, N.H. SPSS Update; McGraw-Hill: New York, NY, USA, 1981. [Google Scholar]
- Fabrigar, L.R.; Wegener, D.T.; MacCallum, R.C.; Strahan, E.J. Evaluating the use of exploratory factor analysis in psychological research. Psychol. Methods 1999, 4, 272–299. [Google Scholar] [CrossRef]
- Black, S.A.; Porter, L.J. Identification of the critical factors of TQM. Decis. Sci. 1996, 27, 1–21. [Google Scholar] [CrossRef]
- Jöreskog, K.G. Statistical analysis of sets of congeneric tests. Psychometrika 1971, 36, 109–133. [Google Scholar] [CrossRef]
- Bagozzi, R.P.; Lynn, W.P. Representing and testing organizational theories: A holistic construal. Admin. Sci. Q. 1982, 27, 459–489. [Google Scholar] [CrossRef]
- Armstrong, J.S.; Overton, T.S. Estimating nonresponse bias in mail surveys. J. Mark. Res. 1977, 14, 396–402. [Google Scholar] [CrossRef]
- Podsakoff, P.M.; Organ, D.W. Self-reports in Organizational Research: Problems and Prospects. J. Manag. 1986, 12, 531–544. [Google Scholar] [CrossRef]
- Aulakh, P.S.; Gencturk, E.F. International Principal-agent Relationships: Control, Governance and Performance. Ind. Mark. Manag. 2000, 29, 521–538. [Google Scholar] [CrossRef]
- Zacharia, Z.G.; Nix, N.W.; Lusch, R.F. An analysis of supply chain collaborations and their effect on performance outcomes. J. Bus. Logist. 2009, 30, 101–123. [Google Scholar] [CrossRef]
- Um, J. Improving supply chain flexibility and agility through variety management. Int. J. Logist. Manag. 2017, 28, 464–487. [Google Scholar] [CrossRef]
- Venkatesh, V.; Bala, H. Technology acceptance model 3 and a research agenda on interventions. Decis. Sci. 2008, 39, 273–315. [Google Scholar] [CrossRef]
- Venkatesh, V.; Davis, F.D. A theoretical extension of the technology acceptance model: Four longitudinal field studies. Manag. Sci. 2000, 46, 186–204. [Google Scholar] [CrossRef]
- Gerbing, D.W.; Anderson, J.C. An updated paradigm for scale development incorporating unidimensional and its assessment. J. Mark. Res. 1988, 25, 186–192. [Google Scholar] [CrossRef]
- Hu, L.T.; Bentler, P.M. Cutoff criteria for fit indexes in covariance structure analysis: Conventional criteria versus new alternatives. Struct. Equ. Model. 1999, 6, 1–55. [Google Scholar] [CrossRef]
- Hair, J.F.; Black, B.; Babin, B.; Anderson, R.E. Multivariate Data Analysis; Pearson Education Prentice Hall: Englewood, NJ, USA, 2010. [Google Scholar]
- Ambulkar, S.; Blackhurst, J.; Grawe, S. Firm’s resilience to supply chain disruptions: Scale development and empirical examination. J. Oper. Manag. 2015, 33, 111–122. [Google Scholar] [CrossRef]
- Preacher, K.J.; Hayes, A.F. Asymptotic and resampling strategies for assessing and comparing indirect effects in multiple mediator models. Behav. Res. Methods 2008, 40, 879–891. [Google Scholar] [CrossRef]
- Baron, R.M.; Kenny, D.A. The moderator–mediator variable distinction in social psychological research: Conceptual, strategic, and statistical considerations. J. Pers. Soc. Psychol. 1986, 51, 1173–1182. [Google Scholar] [CrossRef]
- Sobel, M.E. Asymptotic confidence intervals for indirect effects in structural equation models. Sociol. Methodol. 1982, 13, 290–312. [Google Scholar] [CrossRef]
- Malhotra, M.K.; Singhal, C.; Shang, G.Z.; Ployhart, R.E. A critical evaluation of alternative methods and paradigms for conducting mediation analysis in operations management research. J. Oper. Manag. 2014, 32, 127–137. [Google Scholar] [CrossRef]
- Zhao, X.S.; Lynch, J.G., Jr.; Chen, Q. Reconsidering Baron and Kenny: Myths and truths about mediation analysis. J. Consum. 2010, 37, 197–206. [Google Scholar] [CrossRef]
- Stone, E.F.; Hollenbeck, J.R. Clarifying some controversial issues surrounding statistical procedures of detecting moderator variables: Empirical evidence and related matters. J. Appl. Psychol. 1998, 74, 3–10. [Google Scholar] [CrossRef]
- Rougès, J.F.; Montreuil, B. Crowdsourcing Delivery: New Interconnected Business Models to Reinvent Delivery. In Proceedings of the 1st International Physical Internet Conference, Québec City, QC, Canada, 28–30 May 2014. [Google Scholar]


© 2019 by the authors. Licensee MDPI, Basel, Switzerland. This article is an open access article distributed under the terms and conditions of the Creative Commons Attribution (CC BY) license (http://creativecommons.org/licenses/by/4.0/).