Article

Quantifying Grazing Intensity Using Remote Sensing in Alpine Meadows on Qinghai-Tibetan Plateau

1
State Key Laboratory of Grassland Agro-ecosystems; Key Laboratory of Grassland Livestock Industry Innovation, Ministry of Agriculture and Rural Affairs; College of Pastoral Agriculture Science and Technology, Lanzhou University, Lanzhou 730020, China
2
The Institute of Rangeland Research, Academy of Animal and Veterinary Sciences, Qinghai University, Xining 810016, China
3
Arid Land Research Center, Tottori University, 1390 Hamasaka, Tottori 680-0001, Japan
4
School of Ecology and Environment, Inner Mongolia University, Hohhot, Inner Mongolia 010021, China
*
Author to whom correspondence should be addressed.
Sustainability 2019, 11(2), 417; https://doi.org/10.3390/su11020417
Submission received: 5 December 2018 / Revised: 8 January 2019 / Accepted: 9 January 2019 / Published: 15 January 2019

Abstract

:
Remote sensing data have been widely used in the study of large-scale vegetation activities, which have important significance in estimating grassland yields, determining grassland carrying capacity, and strengthening the scientific management of grasslands. Remote sensing data are also used for estimating grazing intensity. Unfortunately, the spatial distribution of grazing-induced degradation remains undocumented by field observation, and most previous studies on grazing intensity have been qualitative. In our study, we tried to quantify grazing intensity using remote sensing techniques. To achieve this goal, we conducted field experiments at Gansu Province, China, which included a meadow steppe and a semi-arid region. The correlation between a vegetation index and grazing intensity was simulated, and the results demonstrated that there was a significant negative correlation between NDVI and relative grazing intensity (p < 0.05). The relative grazing intensity increased with a decrease in NDVI, and when the relative grazing intensity reached a certain level, the response of NDVI to relative grazing intensity was no longer sensitive. This study shows that the NDVI model can illustrate the feasibility of using a vegetation index to monitor the grazing intensity of livestock in free-grazing mode. Notably, it is feasible to use the remote sensing vegetation index to obtain the thresholds of livestock grazing intensity.

1. Introduction

Livestock grazing is a dominant form of land use globally, as nearly one-quarter of the earth’s land surface is used for grazing (22%) [1]. The interaction between livestock and grassland is the key ecological process of the grazing ecosystem, and the grass–livestock relationship is often a subject of research. Most studies have shown that moderate grazing can effectively promote grassland productivity and improve biodiversity maintenance, corresponding with the intermediate disturbance hypothesis [2,3]. Thus, plant diversity should be highest at intermediate levels of grazing intensity. However, overgrazing can lead to a large area of grassland degradation, as well as the deterioration of grassland primary productivity and soil’s physical and chemical properties [4]. In recent years, grasslands across the globe have experienced increasing pressure from increasing human populations, reduced areas with increasing livestock numbers, and declining terms of trade for livestock production [5]. Unsustainable livestock farming is considered the greatest driver of land degradation, which is defined as a decrease in productivity [6].
The Qinghai-Tibetan Plateau (QTP, average elevation 4000 m) is the largest plateau in the world, but it is a relatively fragile system [7,8,9]. Alpine meadow is the dominant vegetation type (more than 40%) and provides fundamental sources of livelihood for local residents and ecosystem services for the human population living downstream [10]. The Tibetan Plateau ecosystem is particularly sensitive to global climate change [11], and related research on the plateau ecosystem plays a highly important role in research on global change [12]. Degradation of the alpine grassland has been widely recorded for the QTP over recent decades [13,14,15]. In some areas, the magnitude of degradation has even reached an alarming level [16]. The degradation is not only damaging local herdsmen’s livelihoods, but also threatening the unique flora and fauna of the plateau [17]. Due to long-term over-grazing and other factors, the alpine meadow ecosystems clearly appear to have degraded [18]. In conjunction with this recent degradation, grassland management and optimization, especially for the study of a grazing intensity model, is of great significance.
Grazing intensity refers to the amount of quantitative animal demand for forage placed upon the standing crop forage or forage mass, and to the resulting level of defoliation caused during grazing [19]. Research on grazing intensity mainly focuses on the effects of different grazing intensities on grassland productivity, vegetation community characteristics, and diversity [20,21,22,23,24]. Information on the grazing intensity of grassland is currently mostly derived from field investigations, with the locations of herbivores obtained by the satellite-based global positioning system (GPS) [25]. However, ground-based methods (field investigation) are not practical over extensive geographic areas. Remote sensing data have been widely used in the study of large-scale vegetation activities [26,27,28], which have important significance in realizing grassland yield estimation, determining grassland-carrying capacity, and strengthening the scientific management of grasslands [29]. Remote sensing data are also used for grazing-intensity estimation. Unfortunately, the spatial distribution of grazing-induced degradation remains undocumented by field observation [30]. Most previous studies on grazing intensity have been qualitative or controlled experiments [31,32,33]. If we used a vegetation index to quantify grazing intensity, we could overcome the regional limits of grazing intensity quantification and monitor grazing behaviour in real time and adjust the range of livestock activities, to a certain extent, to ease the pressure of grassland degradation. In addition, we could conduct research on discipline fusion, using satellite remote sensing data analysis on a large scale and implementing vegetation surveys and experimental analysis on a small scale—thus integrating large- and small-scale research—as well as conduct research on remote sensing monitoring technology based on the grass–soil–livestock interaction.
For this reason, we first studied the spatial distribution characteristics of biomass in the study area under different grazing intensities and formulated the following general hypotheses: (1) Grass aboveground biomass stock and grass production are maximized under moderately grazed conditions. Grazing can promote an optimization process, increasing the productivity of defoliated species [34]. In contrast, the total biomass production may increase or be maintained depending on the less-preferred species’ response (i.e., higher abundance or not). This approach is supported by previous studies [35]. In other words, under moderate grazing pressure, the aboveground biomass shows an increasing trend with an increase in grazing intensity. (2) With the strengthening of the grazing intensity, communities’ height, aboveground biomass, Pielou evenness, and index of dominance have increased and then decreased [36]. Finally, (3) a continuous and intensive grazing history reduces total biomass production due to intense and sustained defoliation [35], and the aboveground biomass decreases with increasing grazing intensity, which implies that there is overgrazing. Based on these assumptions, we studied the relationship between the aboveground biomass (2016–2017 field measurement data) and different vegetation indices, and simulated the correlation between each vegetation index and grazing intensity, thus illustrating the feasibility of using a vegetation index to monitor the grazing intensity of livestock in free-grazing mode. The business model of the Qinghai-Tibet Plateau is dominated by herd husbandry; therefore, it is of practical value to carry out a grazing experiment at the scale of herders to promote the sustainable use of alpine grassland ecosystems in the future.

2. Methodology

2.1. Study Area

The study area was located in Maqu County, Gansu Province, China, on the eastern edge of the Qinghai-Tibet plateau (101°52′E, 33°40′N, 3650 m a.s.l. (Above Sea Level)) (Figure 1). The annual average temperature there is 1.2 °C, and the average annual rainfall is approximately 620 mm, which is mainly concentrated in May–September. The annual average sunshine duration is approximately 2580 h. The average annual number of frost days is over 270, and there is no absolute frost-free period, only a warm-cold season. The total area of grassland in the county is 858,700 hm2, accounting for 89.3% of the total land area, and the available grassland area is 830,300 hm2 [37]. The soil is sub-alpine meadow soil. The grassland type is alpine meadow, and vegetation is dominated by Kobresia capillifolia, Poa chalarantha, and Roegneria nutans, among other species. Forage generally turns green in late April and begins to yellow in late August. Historically, yaks (Bos gunense), as the dominant livestock, have played a crucial role in the study area.

2.2. Ground-Measured Data

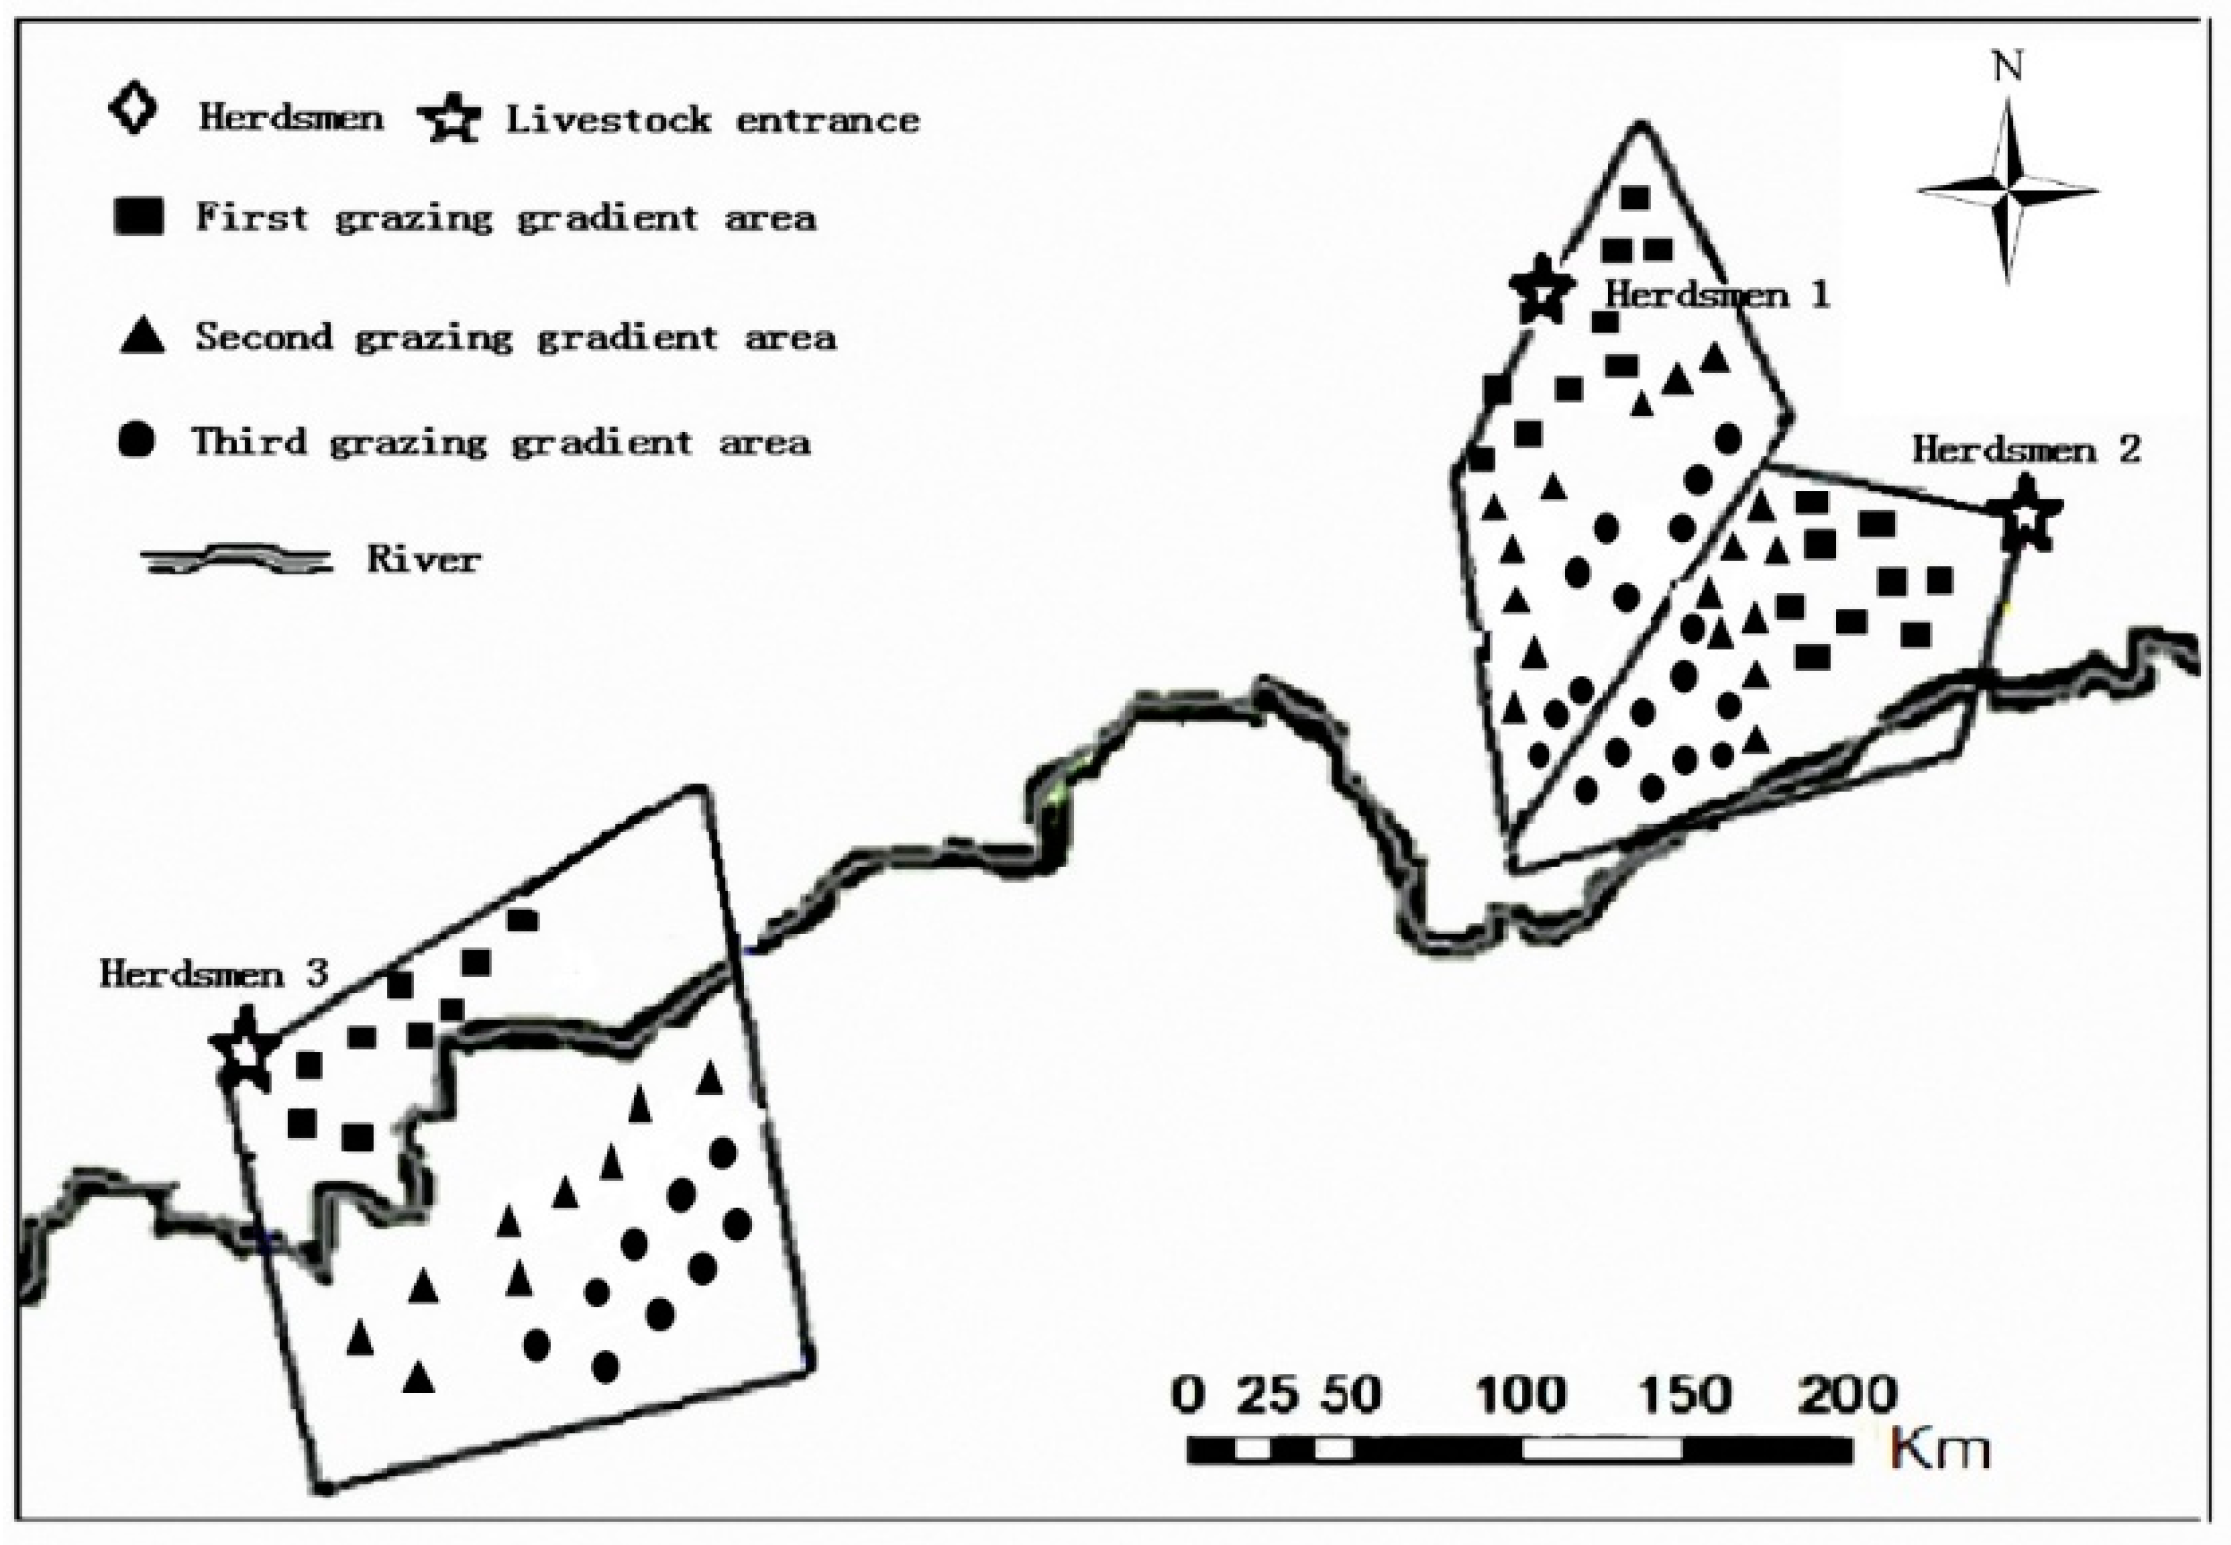
The experimental plots were mainly set up in the pastoral areas of the Aze Animal Husbandry Science and Technology Demonstration Zone. The grasslands belong to three herds of households and are similar in type (alpine meadow), with similar production and utilization patterns (yak grazing); moreover, the grasslands are at the same level of growth. That is, the theoretical edible pasture yields are equal in the grasslands and share the same growth cycle, with no other disturbances besides grazing. According to the number of herding yaks, the grassland area, the distance from the farmer’s shed, the activity route of the yaks’ selective feeding, and the intensity of herding activities during the frequency of stay, a transect sampling design along the grazing gradient was chosen to establish a grazing gradient with increasing distance from a poultry ring. The site surrounding each poultry ring was stratified into three concentric levels. The concentric levels represented the following: the first grazing gradient area (GI), near the entrance to the poultry ring; the second grazing gradient area (GII), located at a medium distance from the entrance to the poultry ring; and the third grazing gradient area (GIII) (Figure 2), located far from the entrance to the poultry ring. In addition, a long-term, non-grazing plot was chosen as a control (CK). Nine sampling plots measuring 0.5 m × 0.5 m were randomly selected in each grazing gradient area, and sampling points were spaced according to the spatial resolution of remote sensing data, enabling precise positioning in remote sensing images. Each sampling point was measured three times and mowed in late June, July, August, and September. During the vegetation survey, the names, coverings, and heights of the main species in the sample area were recorded. Then, the ground was mowed, and the fresh weight was measured and dried at 70 °C until the dry weight was reached.

2.3. Vegetation Index Extraction and Calculation of Relative Grazing Intensity

The normalized vegetation index, which is usually the ratio of the difference between the reflectance in the red (R) and near-infrared (NIR) bands, was used to characterize the quantity distribution and quality of surface vegetation. The enhanced vegetation index (EVI) is an “optimized” vegetation index with improved sensitivity in high-biomass regions and improved vegetation monitoring through a de-coupling of the canopy background signal and a reduction in atmospheric effects. NDVI and EVI were calculated by the following formulas [38,39]:
NDVI = ( NIR R ) / ( NIR + R )
EVI = 2.5 ( NIR R ) / ( NIR + C 1 R C 2 B + L )
To maintain temporal consistency with the data measured on the ground, the 16-day synthesized MOD13Q1 product with a spatial resolution of 250 m from the NASA data centre in late June–September of 2016–2017 was selected to extract NDVI and EVI values.
According to the different grazing gradients, the relative grazing intensities of three herdsmen were calculated according to the following formula:
Relative grazing intensity = number of yaks in each herding family/area of grazing gradient area (concentric area with different radius)
The formula does not indicate the quantified grazing intensity, but rather, the intensity manifestation of grazing. In this study, assuming that each grazing gradient region is a circle with a different radius, the three gradient areas were three concentric circles centered on the ranch entrance. The area of the different gradient is the area of the circle, and it is assumed that the number of yaks in each gradient of the same herder is the same. Although this measure is the same as that in the traditional grazing intensity algorithm—namely, the number of heads of livestock divided by the area of grassland—based on the assumption that the number of yaks in each gradient is the same, only the area is changed. Therefore, the calculation result was set as the relative grazing intensity, which qualitatively indicates the degree of grazing. Selected pastures are grazed year-round, and livestock slaughter or death and other factors lead to changes in the number of livestock; thus, the two years of relative grazing intensity are different (Table 1). A comparison of the relative grazing intensities between the three herders in 2016 and 2017 showed that the overall grazing intensity in 2016 was stronger than that in 2017. In 2017, the number of yaks was reduced because of grazing-livestock slaughter, resulting in a decrease in grazing intensity compared with that in 2016.

2.4. Data Analysis

NDVI and EVI values were extracted from the downloaded images using MODIS (moderate-resolution imaging spectroradiometer) data reprojection software (MRT). The NDVI and EVI values corresponding to each square point were extracted by Arc-Map software, and the model was established with the measured biomass. In the field sampling process, due to the GPS fixed-point error and the errors in the weighing and drying processes (spillover or moisture absorption), outliers should be eliminated before establishing regression models. Excel and SPSS (Statistical Product and Service Solutions) software were used for the statistical analysis of relevance.
The determination coefficient (R2) and mean absolute error (MAE) were used to evaluate the accuracy of models and the interrelationships of the models. R2 and MAE were calculated by the following formulas:
R 2 = [ cov ( x , y ) std ( x ) std ( y ) ] 2
MAE = 1 n i = 1 n | f i y i |
where f i is the estimated value, yi is the ground measured value, n is the sample number, and cov and std represent the covariance and the standard deviation, respectively.

3. Results

3.1. Correlation Analysis of Measured Aboveground Biomass and Relative Grazing Intensity

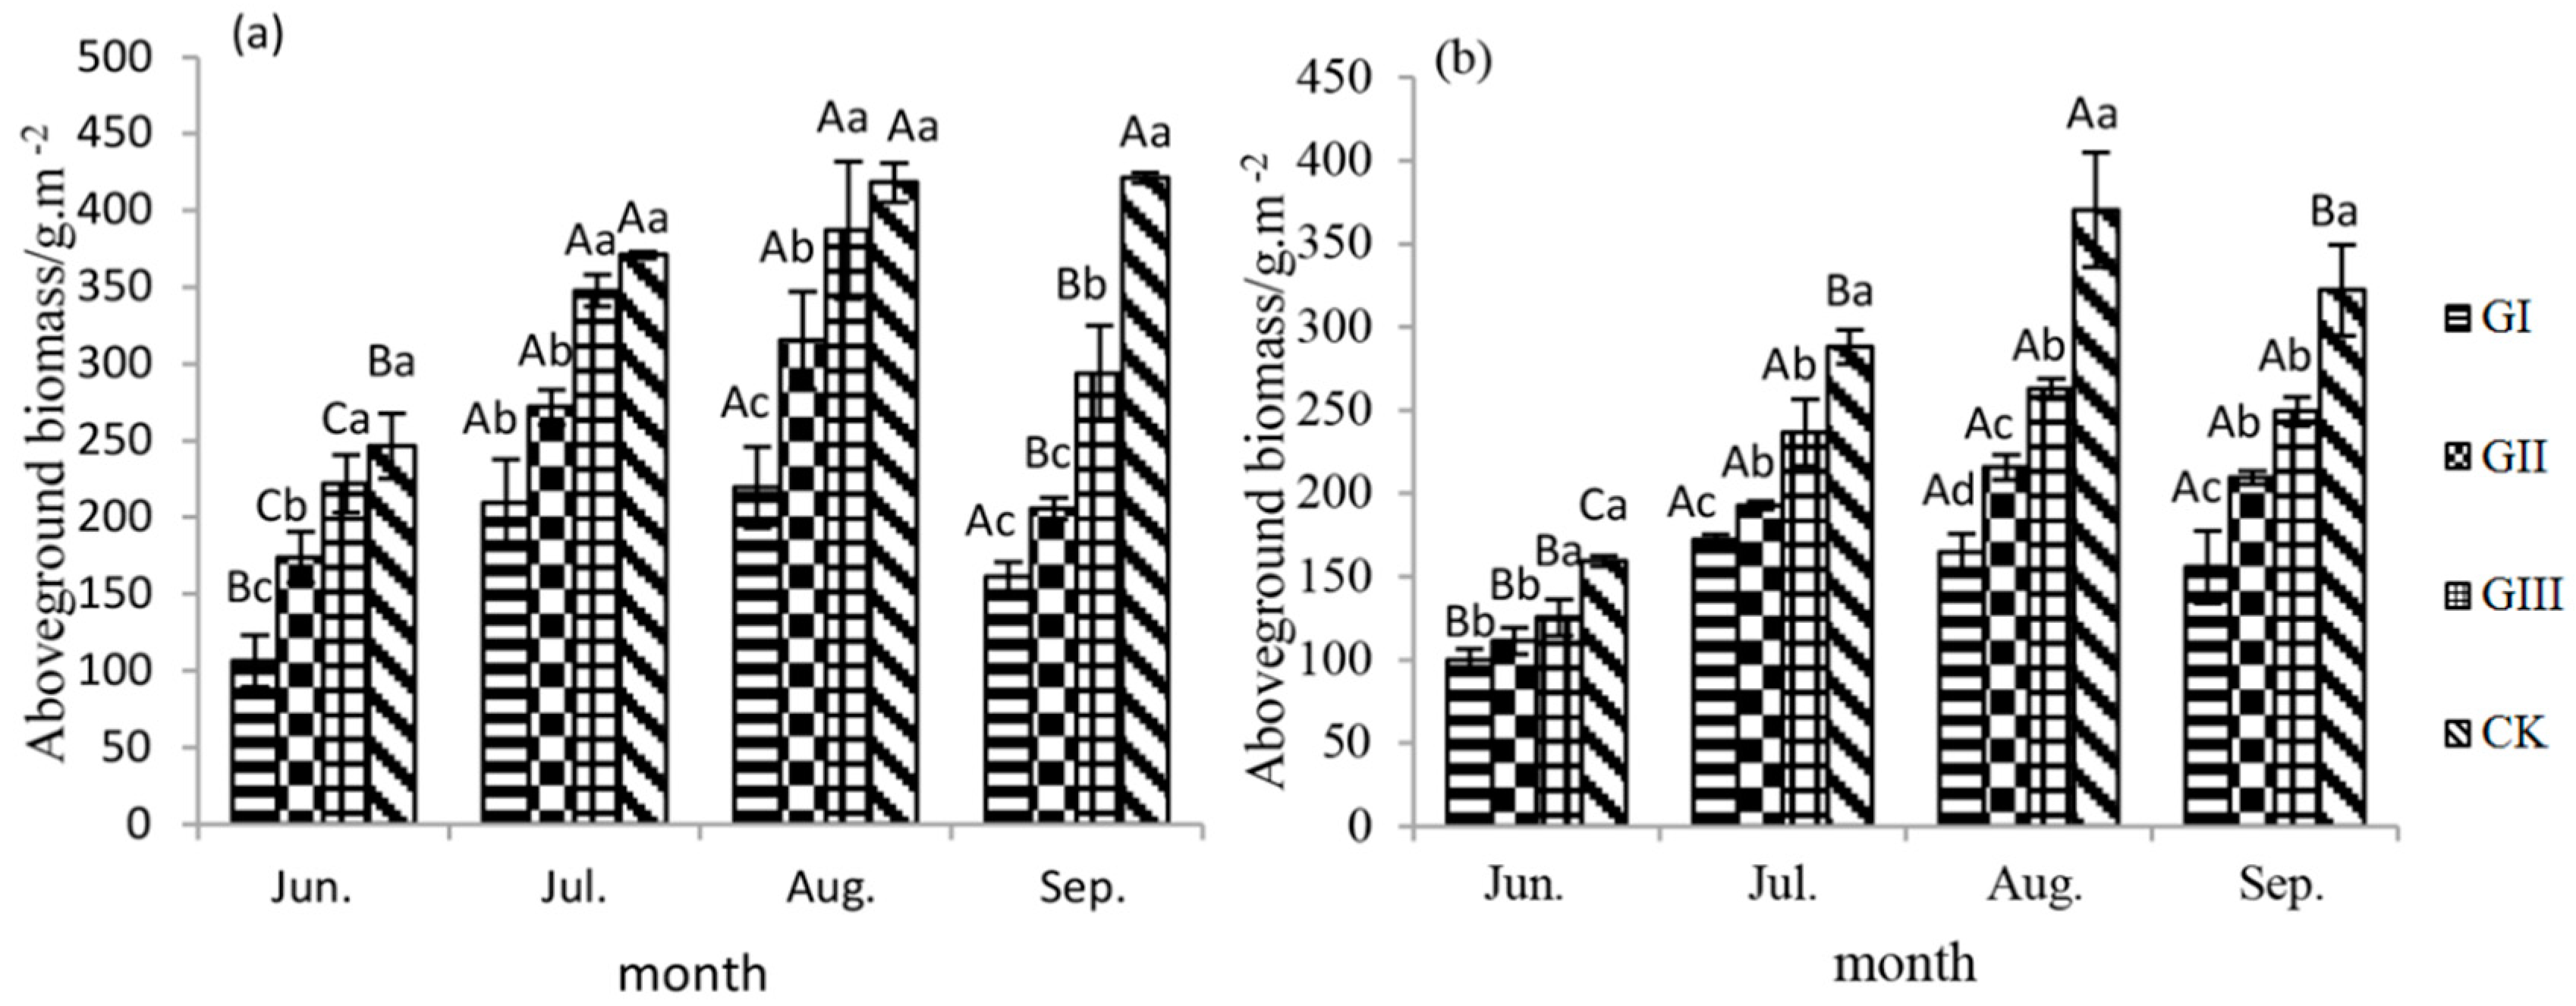
The aboveground biomass decreased with the increase of grazing intensity in 2016–2017 (Figure 3). With the change of the growth rhythm of forage, the aboveground biomass showed a convexity parabola change in June–September, which showed a tendency of increasing first and then decreasing gradually, and reached the highest level in August. In June and August of 2016, there were significant differences in biomass under grazing treatment, except for GIII and CK. Compared with CK, biomass under GI and GII significantly decreased in July 2016 and June 2017. In September, there were significant differences between the grazing treatments, except for GI and GII. In August 2017, biomass decreased significantly with the increase of grazing intensity. In June 2016, biomass was significantly lower than other months at the GI and CK levels (p < 0.05). At the GII and GIII levels, biomass in July and August was significantly higher than in June and September. In June 2017, from GI to GIII, biomass was significantly lower than the other months.
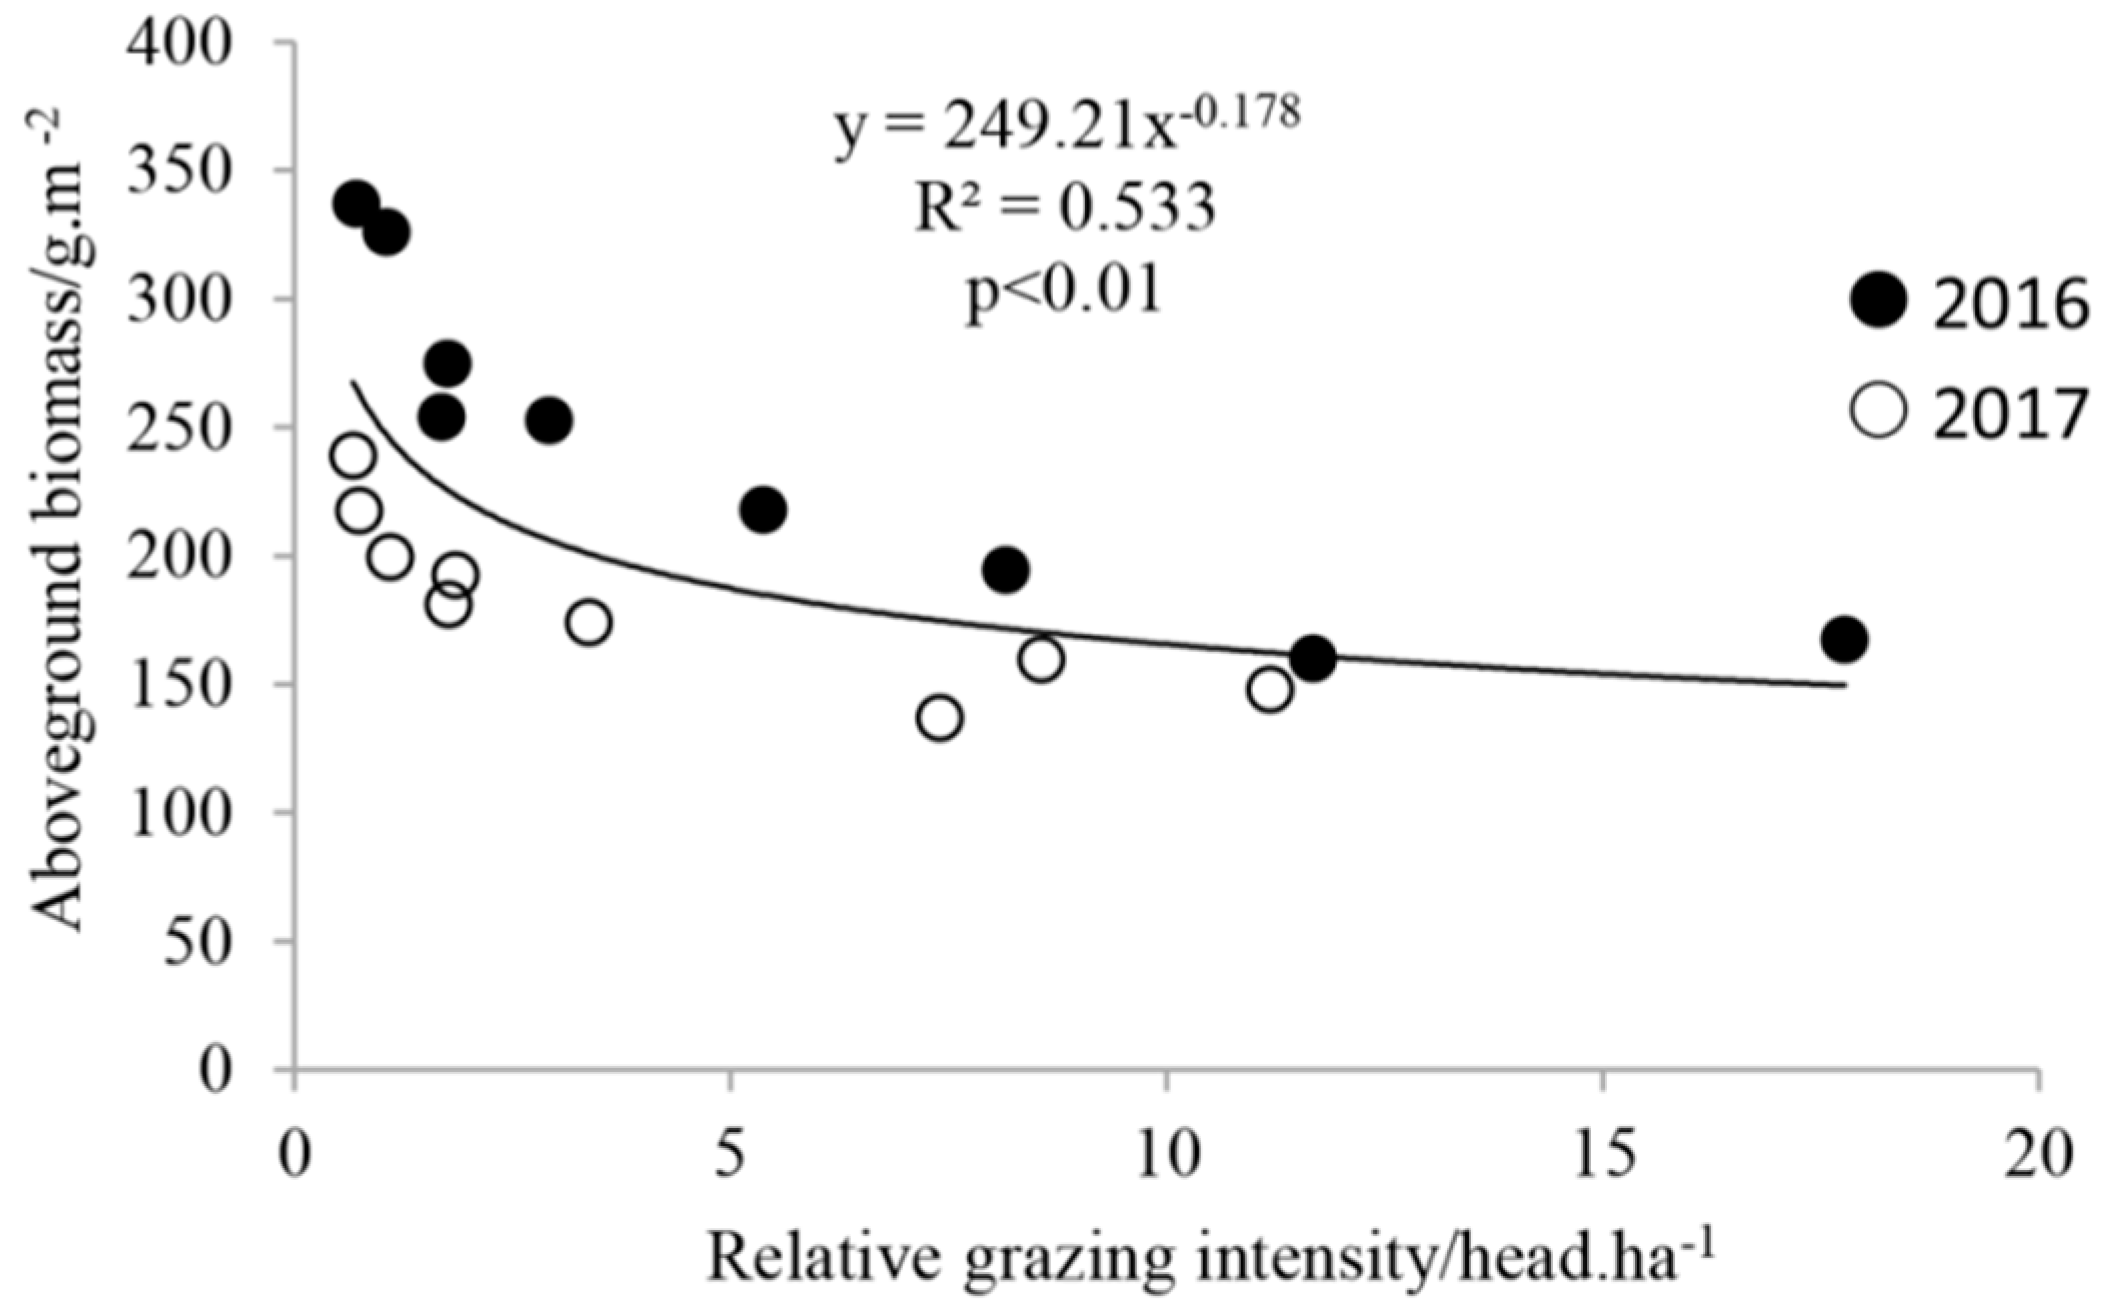
A regression model between aboveground biomass and relative grazing intensity was established for 2016–2017 (Figure 4). A significant negative correlation (p < 0.01) was found between aboveground biomass and grazing intensity—that is, the aboveground biomass decreased with an increase in grazing intensity.

3.2. Correlation Analysis between Vegetation Index and Aboveground Biomass

Several fitting models (i.e., exponential, linear, polynomial, power) between vegetation index and aboveground biomass were established, and the results showed that the linear model had the best effect, so the linear regression models of two vegetation indices (NDVI and EVI) and aboveground biomass in 2016 and 2017 were established (Figure 5a–h). The results showed that the fitting between different vegetation indices and aboveground biomass exhibited the same tendency, as the biomass increased with the vegetation index. All the models satisfied the significant relationship between aboveground biomass and vegetation index (p < 0.01), and the R-squared values of the linear models of the NDVI exponent were all greater than those of the EVI exponential models for 2016 and 2017.

3.3. Correlation Analysis of Relative Grazing Intensity and Vegetation Index

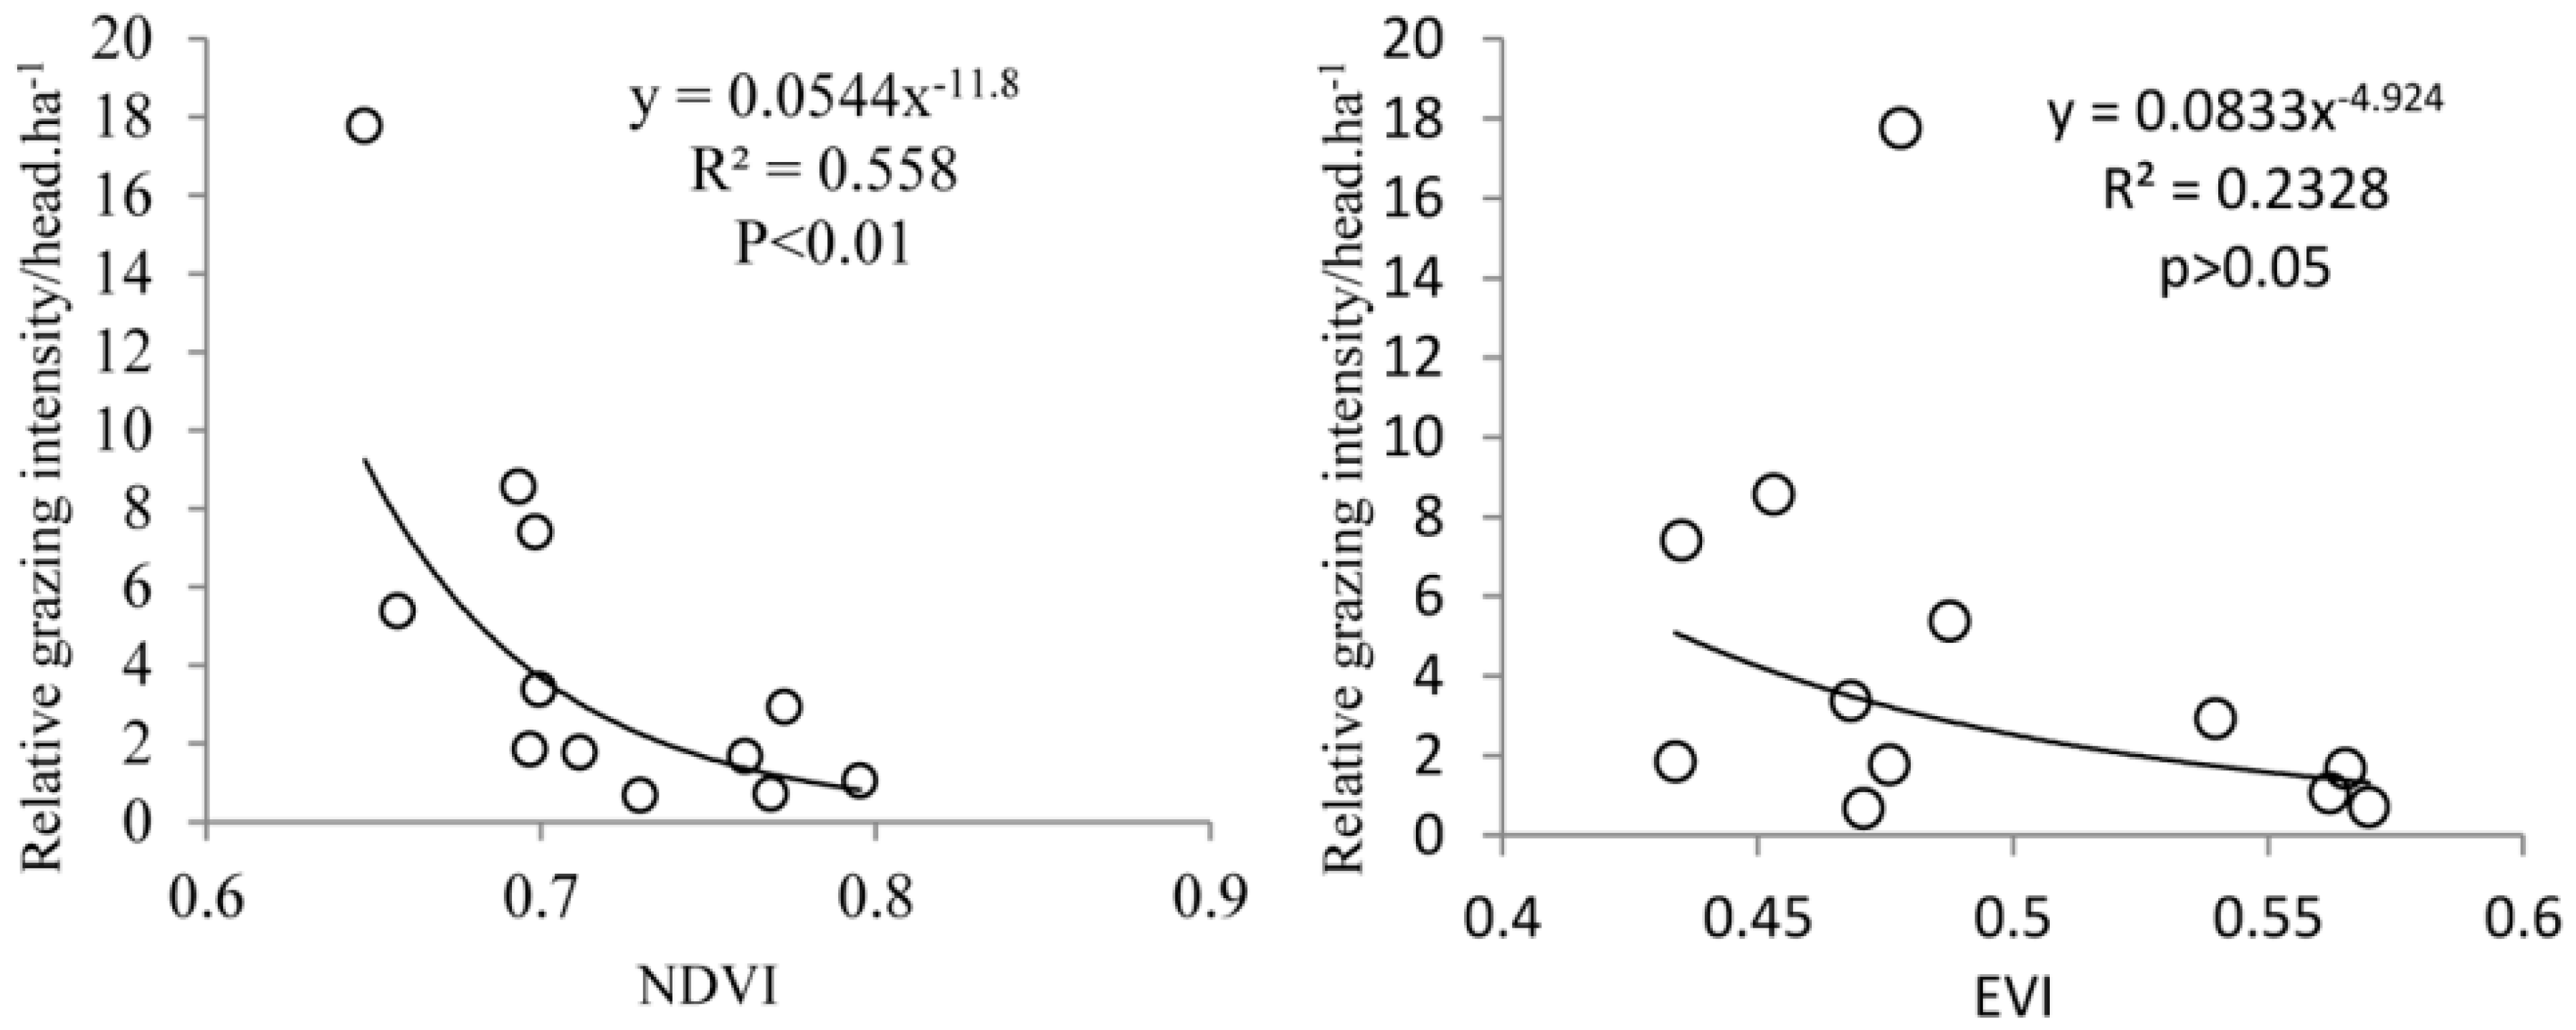
A power regression model was established between the relative grazing intensities and the two vegetation indices on the corresponding gradients (Figure 6), and the results show that there is a significant negative correlation between them. With the decrease in NDVI, the relative grazing intensity increased, and when the relative grazing intensity reached a certain level (approximately 9 head·ha−1), the response of NDVI to the relative grazing intensity was no longer sensitive. The model fitting effect indices, such as the R-squared, mean absolute error, and significance values, were calculated (Table 2). Table 2 shows the simulation effect between the NDVI and relative grazing intensity is better than between the EVI and relative grazing intensity, and that the R-squared and significance values are greater than those of the EVI simulation.

4. Discussion

4.1. Aboveground Biomass under Different Grazing Intensities

A significant negative correlation was observed between total aboveground biomass and grazing intensity (p < 0.01)—namely, the aboveground biomass decreased with an increase in grazing intensity. This finding agrees with previous studies showing that with an increase in grazing intensity, the height, cover, and aboveground biomass exhibit a significant decreasing trend, such as in the Kobresia pima alpine meadow community of the eastern part of the Qinghai-Tibetan Plateau [40] and most grassland regions of northern China [41,42,43,44]. Yan [45] found that grazing has negative effects on grassland biomass, and the grazing effects change with environmental conditions and grazing intensity. In addition, grazing increased the non-grass component of the vegetation, and species richness and diversity increased in the temperate grassland on the Mongolian Plateau. These results provide evidence backing the third hypothesis, as continuous and intensive grazing reduced total biomass production, which suggests a tendency towards overgrazing throughout the present study area.

4.2. Correlation between Different Vegetation Indices and Aboveground Biomass

Different vegetation indices were used to simulate aboveground biomass, and the results showed that the EVI was better than the NDVI for simulating aboveground biomass from June to August in 2016. However, the MODIS-NDVI-based linear model could better simulate aboveground biomass in the Maqu alpine meadow, and the NDVI increased with the aboveground biomass, which was consistent with the trend observed for the NDVI and biomass models for grazing pasture [46,47]. In alpine grasslands of the Tibetan Plateau [48,49] and the Three-River-Source Region, Du [50] demonstrated that the NDVI was more closely related to AGB (aboveground biomass) than was the EVI. Liang [51] also found the NDVI-based AGB model to be the best (46%) among all linear remote sensing models they tested in the pastoral area of the southern Qinghai Province of China. Zhang [52] found that when the biomass is between 370–720 g·m−2, the simulation results of the linear model for yield estimation was very good. In this study, the maximum biomass was 402.76 g·m−2, and the linear model was simulated well by comparison, which is consistent with the previous results.
The comparison of aboveground biomass and vegetation index values in different months showed that the biomass and the vegetation index in September decreased. In general, the forage began to revert to green in May, and the aboveground biomass gradually increased from the beginning of the growing season to the maximum in August, and then entered the non-growing season. The grass began to turn yellow, and the compensatory growth of biomass lagged behind that of grazing; thus, grazing affected its community composition and decreased the biomass of grasses [29]. Therefore, the aboveground biomass decreased in September, but the decrease was not significant. The red band is the main band for the photosynthesis of green plants. In September, yellowing of the aboveground biomass led to weakened photosynthesis and increased reflection in the red band. Therefore, at a certain biomass, the vegetation index in September rapidly declined, and the vegetation index was obviously smaller than that in June, July, and August. When months 6–9 were integrated, two independent parts were observed (obviously separated in September and June–August), and the overall fitting effect was not good. Therefore, September was modelled separately, and the simulation effect was determined to be better. In addition, the correlation coefficient of the model was relatively low, and may have been affected by the soil and climate conditions in the study area. In addition, the spatial resolution of the selected MODIS product data was limited, which also affects the accuracy of the model.

4.3. Correlation between Grazing Intensity and Vegetation Index

The comparison of the regression models between different vegetation indices and relative grazing intensity demonstrated that the simulation effect of the NDVI was better than that of the EVI (Table 2), and the results showed that there was a significant negative correlation between vegetation index and relative grazing intensity (p < 0.05). This result showed that there is a negative correlation between animal density and NDVI in the study area. However, some studies have shown that there is a positive correlation between animal density and NDVI. Ma [53] found that grasshopper density had a significant positive correlation with NDVI under different grazing intensities (p < 0.05). Guo [54] investigated the relationship between pikas’ burrow density and the NDVI and found a significant positive correlation between the two. Pikas’ burrow density is low when the NDVI is less than 0.2, indicating that Plateau pikas avoid dwelling in degraded grassland. Behnke [55] found that if larger water points were associated with more livestock, it is reasonable to assume that larger water points are also associated with increased grazing pressure and higher levels of forage depletion. High NDVI values near water points can examine this relationship and indirectly confirm the positive correlation between NDVI and animal density. However, Mongolian gazelles were shown to prefer an intermediate range of vegetation productivity, presumably facing quality/quantity trade-offs, where areas with a low NDVI are limited by low ingestion rates and areas with a high NDVI are limited by the low digestibility of mature forage [56]. High levels of herbage mass with moderate grazing pressure enable animals to select better-quality diets, and when Mongolian gazelles prefer short or intermediate grasslands, according to an energy-maximizing strategy, higher NDVI values might not indicate better habitat quality for gazelles [57]. Several factors may explain why gazelles did not use areas where the NDVI was higher. For instance, a higher NDVI may not directly reflect a better site for gazelles. For grazing ruminants, the daily energy intake rate will be the highest on intermediate biomass swards, where the grazer can optimize their dry-matter intake rate and energy digestibility [58,59]. The above-mentioned studies all indicate that herbivores tend to choose a higher-productivity environment for feed intake over a wide range of areas. However, the results of our study indicated just the opposite. The NDVI is negatively correlated with the density of livestock, indicating that under limited resources, biomass will be reduced in areas where livestock concentrate their feeding, which implies overgrazing in the study area.
A threshold value of the relative grazing intensity can be found by analyzing the relationship between relative grazing intensity and NDVI. Under this value, while the response of NDVI to relative grazing intensity is no longer sensitive and can be used as a warning value for measuring the intensity of grazing degree, it also can be an important reference value for the reasonable grazing intensity. Of course, this value will vary depending on the study area or other circumstances. We know that the direct harvest estimation of grassland aboveground biomass requires considerable time and labor, as well as a sufficient number of samples to ensure that the samples meet statistical requirements (a limited number of samples leads to limited estimation accuracy) [60]. In addition, the direct harvesting method will destroy vegetation in the survey site. Such destruction will affect the vegetation restoration in certain ecologically fragile areas, and thus, restoration will not be carried out over a large area; moreover, coupled to the activity of livestock is the process of spatial dynamic change. If the correlation between grazing intensity and aboveground biomass is used to determine the threshold of grazing intensity, heavy workloads, as well as spatial constraints, will have a strong effect on the research results. However, compared with traditional methods based on quadrat biomass monitoring, remote sensing estimation is not only more time-efficient but also has incomparable advantages over traditional methods, such as the monitoring of change in unmanned alpine areas [61]. Therefore, it is feasible to use the remote sensing vegetation index to obtain the thresholds of livestock grazing intensity. However, the current study is only a preliminary exploration and there is still a lack of practical application, which will be supplemented in our following study.
Livestock feed species that are not resistant to grazing trampled plants, such as Potentilla anserina, Festuca arundinacea, Elymus nutans, and Poa pratensis, were shown to be greatly affected by grazing disturbance, and could not fully grow and develop; furthermore, their coverage and richness declined [62]. That is, the growth rate of plants was lower than the feeding rate of domestic animals, which may be one of the reasons why the NDVI value decreased with the increase in grazing intensity. In addition, from the perspective of the whole community, grazing significantly reduced the aboveground biomass, mainly due to the reduction in leaf photosynthetic area and the reduction in organic matter accumulation efficiency [63]. Cao [64] selected typical meadow grasslands in different degradation stages as their research object. Through a study of the mineralization ability and supply of nitrogen in the soil and the demand for nitrogen of forage grass, it was found that with an increase in grazing intensity, the supply and demand of soil-forage nutrition were imbalanced, and soil nutrients were biologically fixed and thus rendered ineffective by the excessive absorption of underground roots [43], which is also one of the major causes of biomass reduction and may lead to the decline of the vegetation index in the study area. An NDVI value of zero indicates the presence of rock or bare soil and that NIR and R are approximately equal; positive values indicate the presence of vegetation cover and a positive correlation with coverage. An unfavorable effect of overgrazing on grassland is that livestock excessively feed on the branches and leaves of plants, causing the leaf area of plants to continuously decrease and the photosynthetic capacity to decrease, thereby affecting the plant’s growth and development and reproductive capacity [65] and reducing vegetation coverage [66,67,68]; this result may affect the vegetation index. The threshold NDVI in this study was within a positive range, indicating that the grazing intensity threshold did not result in exposure of the land and avoided the problem of vegetation damage at lower levels due to overestimation of the threshold.

5. Conclusions

A regression model between aboveground biomass and relative grazing intensity shows that the aboveground biomass decreased with an increase in grazing intensity. This result provided evidence backing the third hypothesis, as continuous and intensive grazing reduced total biomass production, which suggests a tendency towards overgrazing throughout the present study area.
This research applied two quantitative models—EVI and NDVI—to simulate the correlation with relative grazing intensity, and found that NDVI could better simulate the correlation and showed a significant negative correlation (p < 0.05), indicating that NDVI can be used to evaluate grazing intensity in the study area. The result in the model indicates that when the relative grazing intensity increased to a certain extent (approximately 9 head ha−1), NDVI was insensitive to it; thus, this grazing intensity value can be used as a warning value for measuring the intensity of grazing degree, and it also has significance for determining the appropriate grazing intensity under free-grazing modes.

Supplementary Materials

Raw data from experiments or models have uploaded in the supplementary materials.

Author Contributions

Formal analysis, Y.C., Q.M.; Funding acquisition, Y.C.; Investigation, L.C.; Methodology, Y.C.; Resources, S.C.; Writing—original draft, Q.M.; Writing—review & editing, F.H., Y.M., A.T. and Y.C.

Funding

Supported by the National Key Research and Development Program of China (No. 2016YFC0501904-02; 2018YF0502302-3), State Key Laboratory of Grassland Agro-ecosystems (No. SKLGAE201709), the Fundamental Research Funds for the Central Universities (lzujbky-2017-53).

Conflicts of Interest

The authors declare no conflicts of interest.

References

  1. Ramankutty, N.; Evan, A.T.; Monfreda, C.; Foley, J.A. Farming the planet:1. Geographic distribution of global agricultural lands in the year 2000. Glob. Biogeochem. Cycles 2008, 22, GB1003. [Google Scholar] [CrossRef]
  2. Grime, J.P. Competitive exclusion in herbaceous vegetation. Nature 1973, 242, 344–347. [Google Scholar] [CrossRef]
  3. Connell, J.H. Diversity in tropical rain forests and coralreefs. Science 1978, 199, 1302–1310. [Google Scholar] [CrossRef] [PubMed]
  4. Baoyinhexige. Effect of grazing on grassland ecosystem. Anim. Husb. Feed Sci. 2013, 34, 71–74. [Google Scholar]
  5. Kemp, D.R.; Michalk, D.L. Sustainable grassland and livestock management. J. Agric. Sci. 2007, 145, 543–564. [Google Scholar] [CrossRef]
  6. Adeel, Z.; Safriel, U.; Niemeijer, D.; White, R. Ecosystems and Human Well-Being: Desertification Synthesis. Millennium Ecosystems Assessment; World Resources Institute: Washington, DC, USA, 2005. [Google Scholar]
  7. Feng, R.; Long, R.; Shang, Z.; Ma, Y.; Dong, S.; Wang, Y. Establishment of Elymus natans, improves soil quality of a heavily degraded alpine meadow in Qinghai-Tibetan Plateau, China. Plant Soil 2010, 327, 403–411. [Google Scholar] [CrossRef]
  8. Chen, H.; Yang, G.; Peng, C.; Zhang, Y.; Zhu, D.; Zhu, Q.; Hu, J.; Wang, M.; Zhan, W.; Zhu, E.; et al. The carbon stock of alpine peatlands on the Qinghai–Tibetan Plateau during the Holocene and their future fate. Quat. Sci. Res. 2014, 95, 151–158. [Google Scholar] [CrossRef] [Green Version]
  9. Zhang, T.; Zhang, Y.; Xu, M.; Zhu, J.; Wimberly, M.C.; Yu, G.; Niu, S.; Xi, Y.; Zhang, X.; Wang, J. Light-intensity grazing improves alpine meadow productivity and adaption to climate change on the Tibetan Plateau. Sci. Rep. 2015, 5, 15949. [Google Scholar] [CrossRef] [PubMed]
  10. Zhang, Y.; Dong, S.; Gao, Q.; Liu, S.; Liang, Y.; Cao, X. Responses of alpine vegetation and soils to the disturbance of plateau pika (Ochotona curzoniae) at burrow level on the Qinghai–Tibetan Plateau of China. Ecol. Eng. 2016, 88, 232–236. [Google Scholar] [CrossRef]
  11. Zhou, H.K.; Zhou, L.; Zhao, X.Q.; Liu, W.; Li, Y.N.; Gu, S.; Zhou, X.M. Study on the stability of alpine meadow ecosystem in Qinghai-Tibet Plateau. Chin. Sci. Bull. 2006, 51, 63–69. [Google Scholar] [CrossRef]
  12. Zhou, H.K.; Zhao, X.Q.; Zhao, L.; Li, Y.N.; Wang, S.P.; Xu, S.X.; Zhou, L. Restoration capability of alpine meadow ecosystem on Qinghai-Tibetan Plateau. Chin. J. Ecol. 2008, 27, 697–704. [Google Scholar]
  13. Harris, R.B. Rangeland degradation on the Qinghai-Tibetan plateau: A review of the evidence of its magnitude and causes. J. Arid Environ. 2010, 74, 1–12. [Google Scholar] [CrossRef]
  14. Wang, P.; Lassoie, J.P.; Morreale, S.J.; Dong, S. A critical review of socioeconomic and natural factors in ecological degradation on the Qinghai-Tibetan Plateau, China. Rangel. J. 2015, 37, 1–9. [Google Scholar] [CrossRef] [Green Version]
  15. Harris, R.B.; Samberg, L.H.; Yeh, E.T.; Smith, A.T.; Wenying, W.; Junbang, W. Rangeland responses to pastoralists’ grazing management on a Tibetan steppe grassland, Qinghai Province, China. Rangel. J. 2016, 38, 1–15. [Google Scholar] [CrossRef]
  16. Li, L.; Fassnacht, F.E.; Storch, I.; Bürgi, M. Land-use regime shift triggered the recent degradation of alpine pastures in Nyanpo Yutse of the eastern Qinghai-Tibetan Plateau. Landsc. Ecol. 2017, 32, 2187–2203. [Google Scholar] [CrossRef]
  17. Arthur, A.D.; Pech, R.P.; Davey, C.; Jie, B.; Zhang, Y.; Lin, H. Livestock grazing, plateau pikas and the conservation of avian biodiversity on the Tibetan plateau. Biol. Conserv. 2008, 141, 1972–1981. [Google Scholar] [CrossRef]
  18. Zhou, H.K.; Zhao, X.Q.; Zhou, L.; Liu, W.; Li, Y.N.; Tang, Y.H. A study on correlations between vegetation degradation and soil degradation in the ‘alpine meadow’ of the Qinghai-Tibetan Plateau. Acta Pratacult. Sci. 2005, 14, 31–40. [Google Scholar]
  19. Yang, Z.; Zhu, Q.; Zhan, W.; Xu, Y.; Zhu, E.; Gao, Y.; Li, S.; Zheng, Q.; Zhu, D.; He, Y.; et al. The linkage between vegetation and soil nutrients and their variation under different grazing intensities in an alpine meadow on the eastern Qinghai-Tibetan Plateau. Ecol. Eng. 2018, 110, 128–136. [Google Scholar] [CrossRef]
  20. Wang, M.J.; Han, G.D.; Cui, G.W.; Zhao, M.L. Effects of grazing intensity on the biodiversity and productivity of meadow steppe. Chin. J. Ecol. 2010, 29, 862–868. [Google Scholar]
  21. Zheng, W.; Dong, Q.M.; Shi-Xiong, L.I.; Hong-Tao, L.I.; Liu, Y.; Yang, S.H. Impact of grazing intensities on community biodiversity and production of Alpine grassland in Qinghai lake region. Acta Agrestia Sin. 2012, 20, 1033–1038. [Google Scholar]
  22. Wang, M.J. Effects of Different Grazing Intensities on Grassland Ecosystem Health of Leymus Chinensis Meadow Steppe; Inner Mongolia Agricultural University: Hohhot, China, 2008. [Google Scholar]
  23. Li, C.G. Influence of grazing on community characteristics of alpine meadow. Guizhou Agric. Sci. 2010, 38, 128–132. [Google Scholar]
  24. Wang, X.T.; Zhang, S.H.; Chen, D.D.; Tan, Y.R.; Sun, D.S.; Du, G.Z. The effects of natural grazing intensity on plant community and soil nutrients in alpine meadow. Acta Agrestia Sin. 2010, 18, 510–516. [Google Scholar]
  25. Cupal, J.J.; Lacy, L.J.; Lindzey, A.F.G. GPS animal tracking system. In Proceedings of the Twelfth International Symposium Biotelemetry, Anrome, Italy, 31 August–5 September 1992. [Google Scholar]
  26. Turker, C.J.; Sellers, P.J. Satellite remote sensing of primary production. Int. J. Remote Sens. 1986, 7, 1395–1416. [Google Scholar] [Green Version]
  27. Schimel, D.S.; Participants, V.E.M.A.P.; Braswell, B.H. Continental scale variability in ecosystem processes: Models, data, and the role of disturbance. Ecol. Monogr. 1997, 67, 251–271. [Google Scholar] [CrossRef]
  28. Moses, A.C.; Andrew, K.S.; Fabio, C.; Sip, V.W.; Istiak, S. Estimation of green grass/herb biomass from airborne hyperspectral imagery using spectral indices and partial least squares regression. Int. J. Appl. Earth Obs. Geoinf. 2007, 9, 414–424. [Google Scholar]
  29. Duan, M.J. Remote Sensing Monitoring of Stipa purpurea Alpine Grassland Biomass under the Grazing Disturbance in Northern Tibet. Master’s Thesis, Chinese Academy of Agricultural Sciences, Beijing, China, 2011. [Google Scholar]
  30. Feng, X.M.; Zhao, Y.S. Grazing intensity monitoring in Northern China steppe: Integrating CENTURY model and MODIS data. Ecol. Indic. 2011, 11, 175–182. [Google Scholar] [CrossRef]
  31. Li, Y.; Wang, W.; Liu, Z.; Jiang, S. Grazing Gradient versus Restoration Succession of Leymus chinensis (Trin.) Tzvel. Grassland in Inner Mongolia. Restor. Ecol. 2008, 16, 572–583. [Google Scholar] [CrossRef]
  32. Liu, A.; Han, J. The study of method about monitoring grazing intensity in Xilingol rangeland using RS data. Chin. J. Grassl. 2007, 2, 70–74. [Google Scholar]
  33. Liu, Y. Research on a Remote Sensed-Based NPP Model and Environment Response for Semiarid Grassland Ecosystem; Institute of Remote Sensing Application Chinese Academy of Sciences: Beijing, China, 2006. [Google Scholar]
  34. McNaughton, S.J. Grazing as an optimization process: Grass-ungulate relationships in the Serengeti. Am. Nat. 1979, 113, 691–703. [Google Scholar] [CrossRef]
  35. Oñatibia, G.R.; Aguiar, M.R. Continuous moderate grazing management promotes biomass production in Patagonian arid rangelands. J. Arid Environ. 2016, 125, 73–79. [Google Scholar] [CrossRef]
  36. Li, W.; Ri, J.; Mu, S. The Influence of Different Grazing Intensity to Typical Grassland Soil Nematodes Communites; Inner Mongolia University: Inner Mongolia, China, 2015. [Google Scholar]
  37. Niu, S.W.; Zeng, M.M.; Liu, Z.G.; Wu, W.H. The Valuation of Ecosystem Services and the Design of Policies on Ecological Management in Maqu County in the Upper Reaches of Yellow River. China Popul. Resour. Environ. 2006, 16, 79–84. [Google Scholar]
  38. Huete, A.R.; Justice, C. MODIS Vegetation Index (MOD13) Algorithm Theoretical Basis Document, version 3; NASA Goddard Space Flight Centre: Greenbelt, MD, USA, 1999. [Google Scholar]
  39. Liu, H.Q.; Huete, A.R. A feedback based modification of the NDVI to minimize canopy background and atmospheric noise. IEEE Trans. Geosci. Remote Sens. 1995, 33, 457–465. [Google Scholar]
  40. Ren, Q.J.; Wu, G.L.; Ren, G.H. Effect of grazing intensity on characteristics of alpine meadow communities in the eastern Qinghai-Tibetan Plateau. Acta Pratacult. Sin. 2009, 18, 256–261. [Google Scholar]
  41. Li, J.L.; Xu, P.; Meng, L.; Wang, J.H. The comprehensive effects of different rotational grazing intensities (DRGI) on the soil, grassland and sheep production in a spring-autumn pasture of sagebruch desert in the northern slope of tianshan mountain. Acta Pratacult. Sin. 1993, 2, 60–65. [Google Scholar]
  42. Zhang, W.H.; Guan, S.Y.; Li, Y.J. Effect of grazing capacity on water content, nutrient and biomass of steppe soil. J. Arid Land Resour. Environ. 2000, 14, 61–64. [Google Scholar]
  43. Fan, G.Y. The Influence of Different Grazing Intensities on the Above-Biomass and Root Distribution Character of Stipa baicalensis Grassland. Master’s Thesis, Gansu Agricultural University, Lanzhou, China, 2010. [Google Scholar]
  44. Wang, Z.; Johnson, D.A.; Rong, Y. Grazing effects on soil characteristics and vegetation of grassland in northern China. Solid Earth Discuss. 2016, 7, 2283–2309. [Google Scholar] [CrossRef]
  45. Yan, L.; Zhou, G.; Zhang, F. Effects of different grazing intensities on grassland production in china: A meta-analysis. PLoS ONE 2013, 8, e81466. [Google Scholar] [CrossRef]
  46. Liu, X.; Chen, Z.; Akiyama, T.; Mo, W.; Fukuo, A. Modeling the spatial pattern of normalized difference vegetation index (NDVI) under a post-nomadic sedentary grazing system. Acta Phytoecol. Sin. 2000, 24, 662–666. [Google Scholar]
  47. Zhao, F.; Wang, Z.; Wang, H.; Wu, H.; Liu, H.; Wang, G.; Zhang, Z. The effects of hyper spectral change on grassland biomass after damage by Callipta-mus abbreviates populations of different densities. Acta Pratacult. Sin. 2015, 24, 195–203. [Google Scholar]
  48. Jiang, Y.; Tao, J.; Huang, Y.; Zhu, J.; Tian, L.; Zhang, Y. The spatial pattern of grassland aboveground biomass on Xizang Plateau and its climatic controls. J. Plant Ecol. 2015, 8, 30–40. [Google Scholar] [CrossRef]
  49. Shen, M.; Tang, Y.; Klein, J.; Zhang, P.; Gu, S.; Shimono, A.; Chen, J. Estimation of aboveground biomass using in situ hyperspectral measurements in five major grassland ecosystems on the Tibetan Plateau. J. Plant Ecol. 2008, 1, 247–257. [Google Scholar] [CrossRef]
  50. Du, Y.E.; Liu, B.K.; Guo, Z.G. Changes of forage biomass of grasslands during the growing season in the Qinghai-Tibetan Plateau based on MODIS data. Pratacult. Sci. 2011, 28, 1117–1123. [Google Scholar]
  51. Liang, T.; Yang, S.; Feng, Q.; Liu, B.; Zhang, R.; Huang, X.; Xie, H. Multi-factor modeling of above-ground biomass in alpine grassland: A case study in the Three-River Headwaters Region, China. Remote Sens. Environ. 2016, 186, 164–172. [Google Scholar] [CrossRef]
  52. Zhang, Y.N.; Niu, J.M.; Zhang, Q.; Yang, Y.; Dong, J.J. A discussion on applications of vegetation index for estimating aboveground biomass of typical steppe. Acta Pratacult. Sin. 2012, 21, 229–238. [Google Scholar]
  53. Ma, J.; Huang, X.; Qin, X.; Ding, Y.; Wang, G.; Cao, G.; Nong, X.; Zhang, Z. The effect of different grazing intensities on hyper spectral remote sensing and locust abundance in typical steppe. Plant Prot. 2017, 43, 6–10, 28. [Google Scholar]
  54. Guo, X.; Yi, S.; Qin, Y.; Chen, J. Habitat environment affects the distribution of plateau pikas: A study based on an unmanned aerial vehicle. Pratacult. Sci. 2017, 34, 1306–1313. [Google Scholar]
  55. Behnke, R.; Robinson, S.; Milnergulland, E.J. Governing open access: Livestock distributions and institutional control in the Karakum Desert of Turkmenistan. Land Use Policy 2016, 52, 103–119. [Google Scholar] [CrossRef]
  56. Mueller, T. In search of forage: Predicting dynamic habitats of Mongolian gazelles using satellite-based estimates of vegetation productivity. J. Appl. Ecol. 2008, 45, 649–658. [Google Scholar] [CrossRef]
  57. Ito, T.Y.; Miura, N.; Lhagvasuren, B.; Enkhbileg, D.; Takatsuki, S.; Tsunekawa, A.; Jiang, Z. Satellite tracking of Mongolian gazelles (Procapra gutturosa) and habitat shifts in their seasonal ranges. J. Zool. 2006, 269, 291–298. [Google Scholar] [CrossRef]
  58. Wilmshurst, J.F.; Fryxell, J.F.; Farm, B.P.; Sinclair, A.R.E.; Henschel, C.P. Spatial distribution of Serengeti wilde beest in relation to resources. Can. J. Zool. 1999, 77, 1223–1232. [Google Scholar] [CrossRef]
  59. Fryxell, J.M. Forage quality and aggregation by large herbivores. Am. Nat. 1991, 138, 478–498. [Google Scholar] [CrossRef]
  60. Liang, W.W. The Study on Simple Estimation Method of Aboveground Biomass of Grassland. Master’s Thesis, Northwest Agriculture and Forestry University, Yangling, China, 2015. [Google Scholar]
  61. Yang, S.X.; Zhang, W.J.; Feng, Q.S.; Meng, B.P.; Gao, J.L.; Liang, T.G. Monitoring of grassland herbage accumulation by remote sensing using MODIS daily surface reflectance data in the Qingnan region. Acta Pratacult. Sin. 2016, 25, 14–26. [Google Scholar]
  62. Zhu, S.H. Study on the Effect of the Plant Community and Soil Nutrient of Alpine Grassland on Yak Grazing Intensity. Master’s Thesis, Gansu Agricultural University, Lanzhou, China, 2006. [Google Scholar]
  63. Tan, H.Y.; Yan, R.R.; Yan, Y.C.; Chen, B.R.; Xin, X.P. The relationship between temperate meadow steppe soil’s biological properties and aboveground vegetation under different grazing intensities. Sci. Agric. Sin. 2014, 47, 4658–4667. [Google Scholar]
  64. Cao, G.M.; Wu, Q.; Li, D.; Hu, Q.W.; Li, Y.M.; Wang, X. Effects of nitrogen supply and demand status of soil and herbage system on vegetation succession and grassland degradation in alpine meadow. Chin. J. Ecol. 2004, 23, 25–28. [Google Scholar]
  65. Xu, Z.X.; Zhao, M.L. Influence of Overgrazing on Soil Erosion of Grassland. Grassl. China 2001, 23, 60–64. [Google Scholar]
  66. Zhang, T.H.; Zhao, H.L.; Ohkuro, T.; Shirato, Y. Soil characteristics and spatial pattern of vegetation after successive grazing in Horpin Sandy Land, Inner Mongolia. J. Arid Land Resour. Environ. 2003, 4, 117–121. [Google Scholar]
  67. Yang, Z.M. Reseach on the Effect of the Plant of Desert Grassland on Different Grazing Intensity. Master’s Thesis, Ningxia University, Yinchuan, China, 2004. [Google Scholar]
  68. Fu, L.; Bo, T.; Du, G.; Zheng, X. Modeling the responses of grassland vegetation coverage to grazing disturbance in an alpine meadow. Ecol. Model. 2012, 247, 221–232. [Google Scholar] [CrossRef]
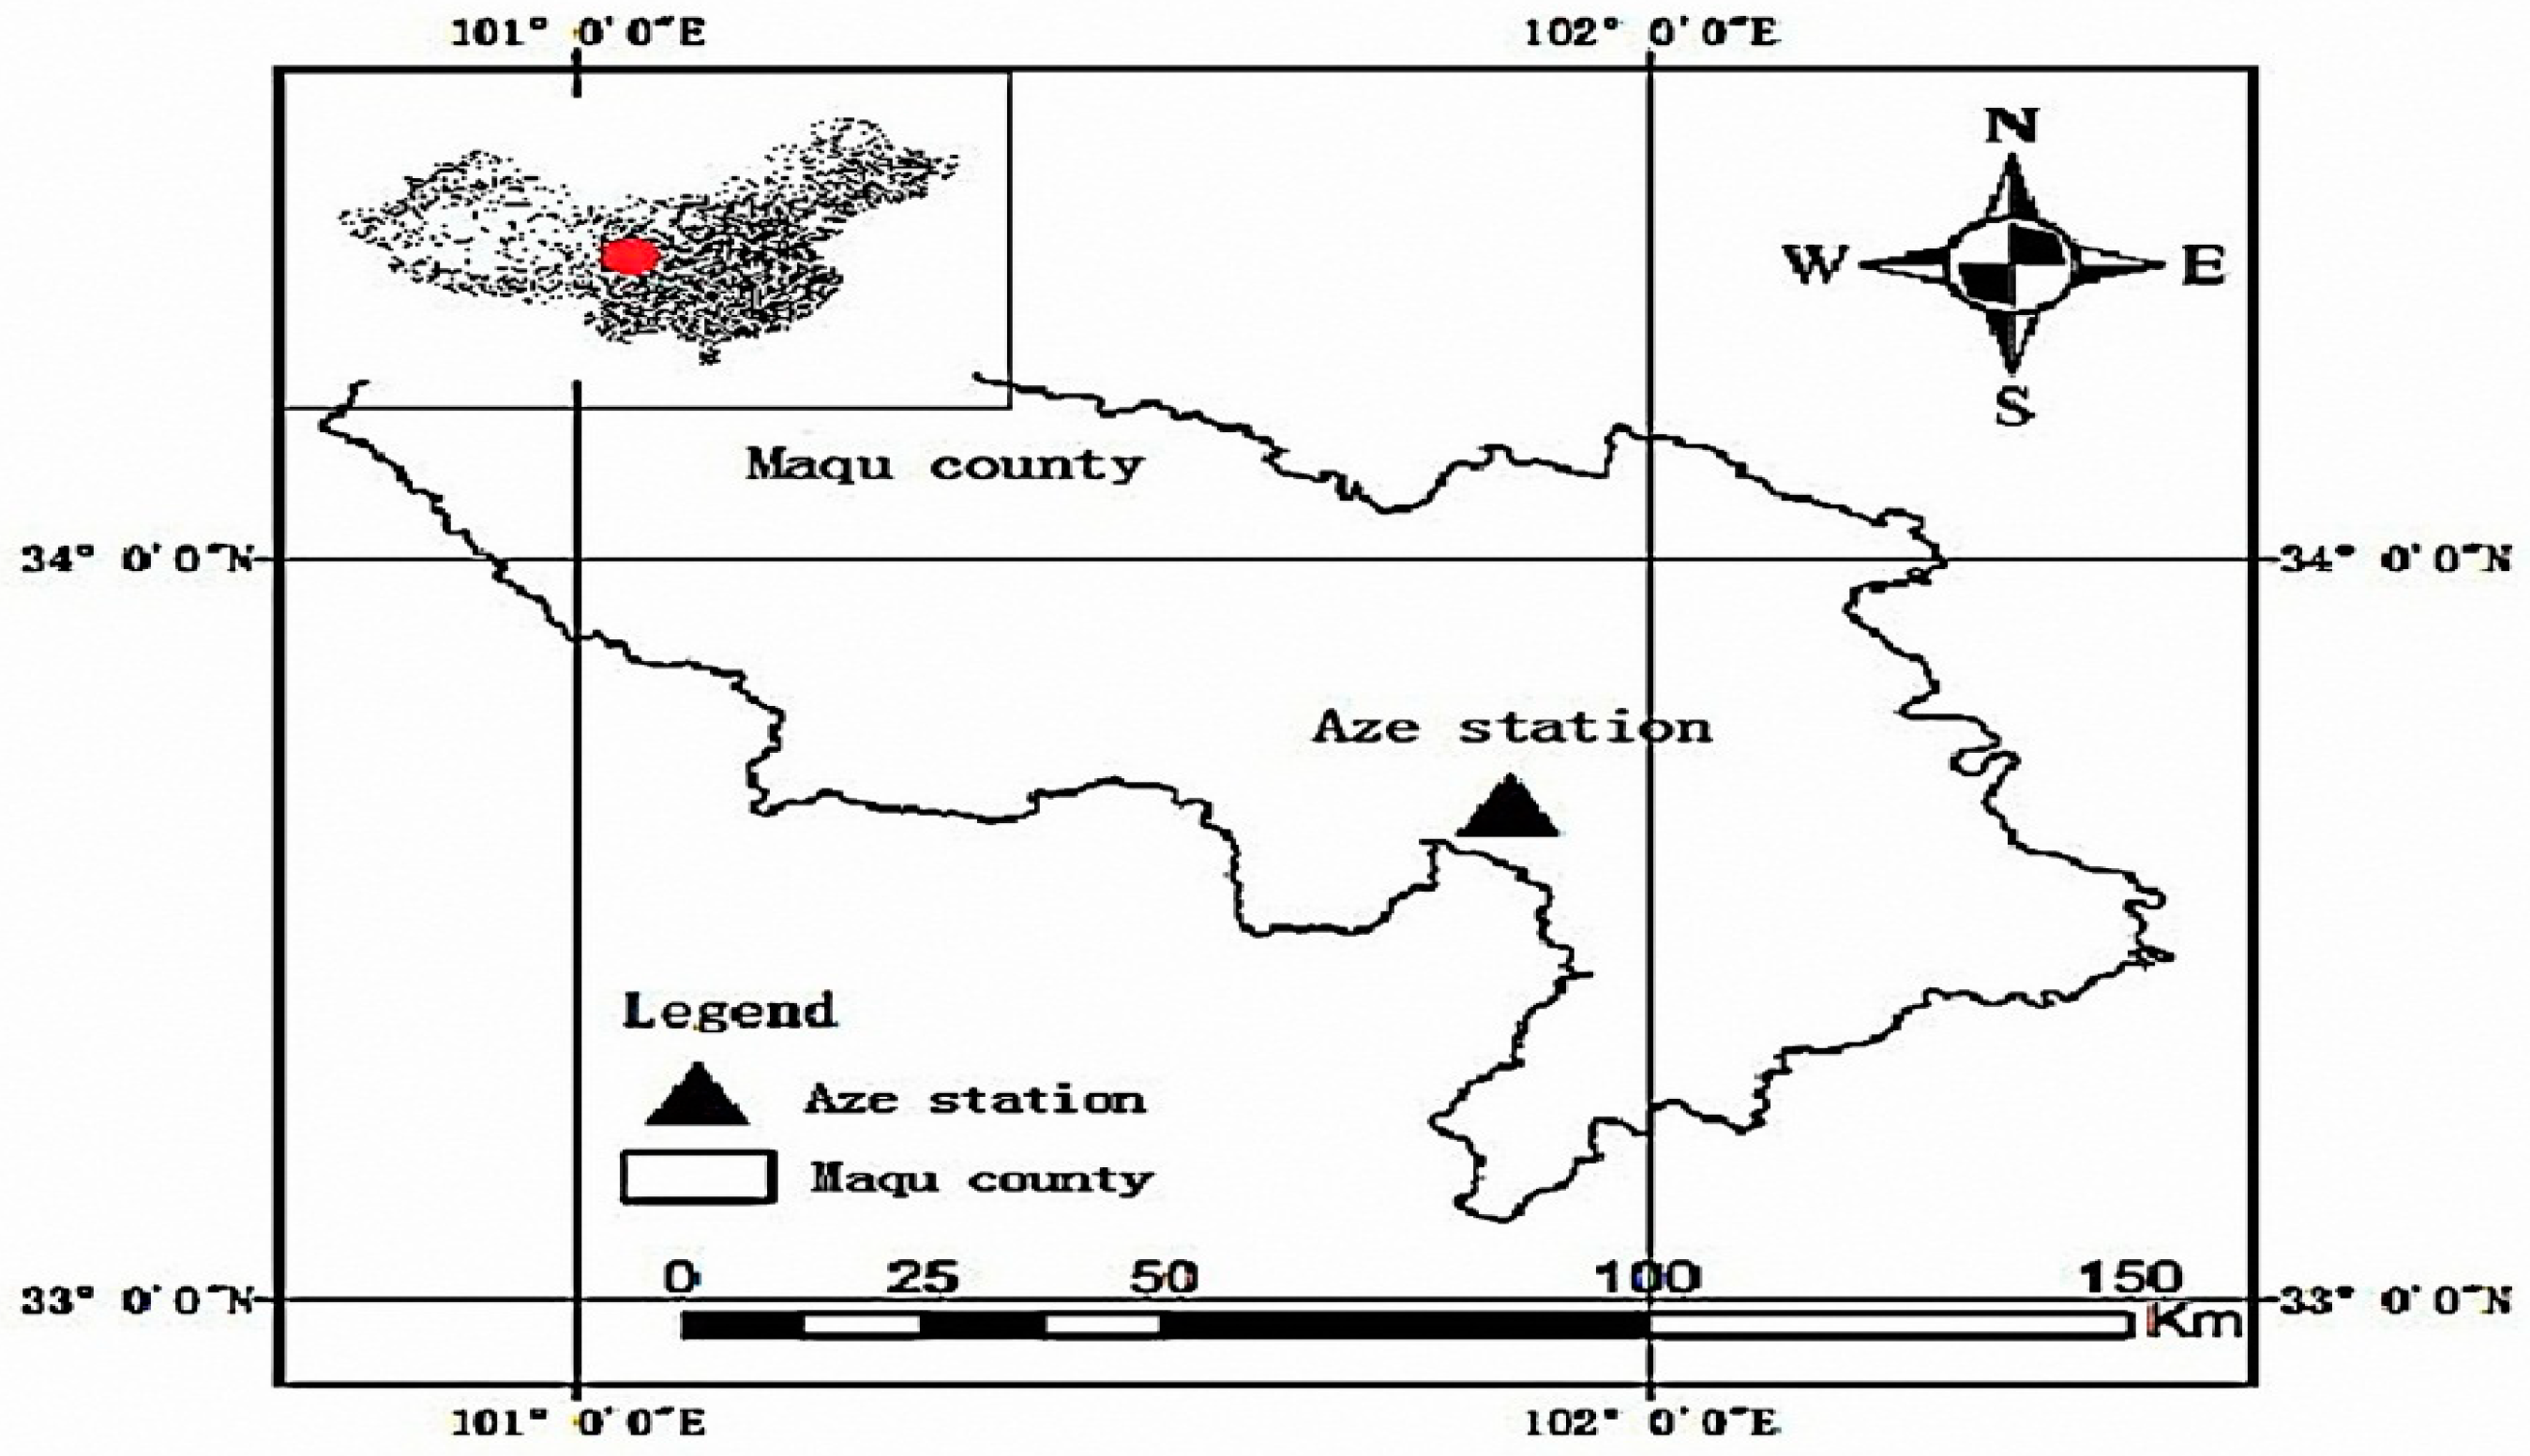
Figure 1. The location of Aze station in Maqu county.
Sustainability 11 00417 g001
Figure 2. Sample plot.
Sustainability 11 00417 g002
Figure 3. Aboveground biomass under different grazing intensity in 2016 (a) and 2017 (b). Note: Capital letters indicate differences between groups, and lowercase letters indicate intra-group differences. Note: Raw data have uploaded in the supplementary materials.
Sustainability 11 00417 g003
Figure 4. The power regression model of aboveground biomass and relative grazing intensity in 2016–2017. Note: Raw data have uploaded in the supplementary materials.
Sustainability 11 00417 g004
Figure 5. Comparison of linear models of aboveground biomass and different vegetation indexes in 2016–2017. (a) Correlation between NDVI and aboveground biomass in June–August 2016; (b) Correlation between EVI and aboveground biomass in June–August 2016; (c) Correlation between NDVI and aboveground biomass in September 2016; (d) Correlation between EVI and aboveground biomass in September 2016; (e) Correlation between NDVI and aboveground biomass in June–August 2017; (f) Correlation between EVI and aboveground biomass in June–August 2017; (g) Correlation between NDVI and aboveground biomass in September 2017; (h) Correlation between EVI and aboveground biomass in September 2017. Note: Raw data have uploaded in the supplementary materials.
Sustainability 11 00417 g005
Figure 6. Comparison of power regression model of relative grazing intensity and different vegetation indexes in 2016–2017. Note: Raw data have uploaded in the supplementary materials.
Sustainability 11 00417 g006
Table 1. The relative grazing intensities of the three surveyed herdsmen from 2016 to 2017.
HerdsmenDistance from the Ring Entrance (m)Relative Grazing Intensity (head·ha−1)
20162017
122017.7711.19
4005.373.38
7001.751.10
22508.158.56
5501.681.77
8500.710.74
330011.687.40
6002.921.85
10001.050.67
Table 2. The results of the relative grazing intensity and two vegetation indices regression models. The R-squared value is the coefficient of determination, MAE is the mean absolute error.
Vegetation IndexModelR-SquaredMAESig.
NDVIy = 0.0544x−11.80.5582.2460.005
EVIy = 0.0833−4.9240.2332.8310.112