Article

Threshold Effect of Tourism Development on Economic Growth Following a Disaster Shock: Evidence from the Wenchuan Earthquake, P.R. China

1
Institute for Disaster Management and Reconstruction, Sichuan University, Chengdu 610207, China
2
Tourism School, Sichuan University, Chengdu 610065, China
*
Author to whom correspondence should be addressed.
Sustainability 2019, 11(2), 371; https://doi.org/10.3390/su11020371
Submission received: 15 November 2018 / Revised: 6 January 2019 / Accepted: 8 January 2019 / Published: 12 January 2019
(This article belongs to the Special Issue Marketing for Sustainable Tourism)

Abstract

:
To examine whether tourism can effectively stimulate economic growth following a disaster shock, we apply a panel threshold regression technique to test the threshold effect of tourism development on economic growth of the 36 Wenchuan earthquake-affected counties in 2008–2016. The empirical results using the panel fixed-effects model show that tourism significantly contributes to economic growth, supporting the validity of the tourism-led growth hypothesis (TLGH) for the disaster-affected destinations. The results of the panel threshold regression model also indicate a threshold effect of tourism development on economic growth, implying that counties with different conditions of tourism specialization and industrial structure experience different impacts on the tourism-growth nexus. Specifically, the estimated coefficients of tourism on economic growth decrease with the levels of tourism specialization and industrial structure exceeding the threshold value. Based on the Tourism Area Life Cycle theory (TALC), we further divide the 36 disaster-stricken counties into six types based on the evolution of tourism specialization: Exploration-stage type, involvement-stage type, transition-stage type, development-stage type, consolidation-stage type, and stagnation-stage type. The empirical findings and managerial implications discussed are generally applicable to policymakers seeking new ways to invigorate the economy in other disaster-affected destinations.

1. Introduction

Over the past years, a large number of disasters, ranging from natural disasters (e.g., floods, hurricane storms, volcanoes, tsunami and earthquakes) to man-made hazards (e.g., financial crises, wars, and terrorist attacks), have caused severe destruction to facilities, economies and ecological environments of the disaster-hit destinations [1,2,3,4,5,6,7,8,9,10]. The discussion on how to promote the local economic recovery following a disaster has attracted the attention of both policymakers and scholars worldwide [11,12]. Tourism is one of the world’s fastest-growing industries and yields huge economic benefits through creating employment opportunities, multiplying personal wealth, increasing the investments in infrastructure, raising government tax revenue, and reducing the budget deficit [13,14,15,16]. Hence, for the disaster-hit destinations, an increasing number of policymakers consider tourism development to be a strategic engine for stimulating economic recovery [17,18,19,20,21,22,23,24]. However, does tourism effectively stimulate economic recovery? The lack of research is somewhat surprising, given the causal relationship between tourism development and economic growth following disaster shocks.
As tourism plays an increasingly prominent role in economic growth, the relationship between tourism development and economic growth has attracted wide attention from scholars. In tourism literature, the tourism-led growth hypothesis (TLGH) is mostly used to analyze the effect of tourism development on economic growth based on the country or region level. Scholars have recently extended the studies of TLGH to four main hypotheses: (1) Tourism-led growth hypothesis itself [21,25,26], (2) conservation hypothesis [21,25,26], (3) feedback hypothesis [21,27], and (4) neutrality hypothesis [21,25,28].
The tourism-led growth hypothesis, first proposed by Balaguer and Cantavella-Jorda [29], points out that there is a positive one-way causality from tourism development to economic growth. Namely, tourism development can unidirectionally promote economic growth. A large number of subsequent studies have provided evidence verifying this hypothesis [30,31,32,33,34].
The conservation hypothesis, or so-called economic-driven tourism growth (EDTG) hypothesis, suggests that there exists a unidirectional causal relationship between economic growth and tourism development. In other words, the growth in economic activities can increase tourism demand and income. Aslan, Oh, Payne and Mervar and Lin et al. support the conservation hypothesis [28,35,36,37].
The feedback hypothesis posits that a positive bidirectional causal relationship exists between tourism development and economic growth. Investments in the tourism industry can also stimulate the growth of economic activities and vice versa. The feedback hypothesis has been applied in the studies of Aslan, Lee and Chang, Al-mulali et al., Lorde et al., Ridderstaat et al. and Tugcu [28,38,39,40,41,42].
The neutrality hypothesis postulates that there is no causal relationship between tourism development and economic growth, implying that tourism development cannot significantly stimulate economic growth or vice versa. Such polices or incentives for tourism development have little or no effect on the growth of the overall economy, because tourism is one insignificant part of the whole economic system [21]. The results in Brau et al., Tang and Tan, Chiu and Yeh, and Katircioglu provide support for the neutrality hypothesis [43,44,45,46].
In addition, other scholars have found that tourism development negatively affects economic growth [26,47]. The symptoms of Dutch disease, first put forward by Corden and Neary [48], are often used to illustrate the unfavorable economic effects of tourism expansion: Drawing resources and labor from other industries to tourism-oriented sectors, increasing local land and house prices, and reducing social welfare [22,47,49,50,51,52], and thus hampering long-term economic growth.
For the tourism-dominated destination, the economic structure that is overdependent on tourism may generate adverse effects, because the tourism industry is exposed to an increasing number and range of external shocks [53]. Capó, Font and Nadal argue that an excessive tourism-oriented economy may result in less dynamic and low efficient growth [47]. Gursoy and Rutherford, and Sequeira and Campos provide evidence supporting the negative effect of tourism [54,55].
The TLGH is widely used in general destination in the tourism economic field. For the disaster-hit destination, the empirical research on the causal relationship between tourism development and economic growth following disaster shock is very limited. Jose et al. investigated the tourism-growth nexus for Spain after the global economic and financial crisis, showing that there was a bilateral Granger causality between tourism and economic growth; however, the results are not robust [56]. Julio explored the relationship between tourism and economic growth in Turkey after terrorism. The result illustrates a negative impact of terrorism on real GDP because of the decrease or loss of tourism [57]. Qazi and Rana examined the TLGH for Pakistan and found that tourism income led to economic growth, except in the years of 2006–2008, due to the increase in terrorist attacks [58]. Tang and Abosedra investigate the contribution of tourism to economic growth in Lebanon during 1995–2010, a period of political unrest and war [59].
The main contributions of our study to the existing literature are essentially two-fold. On the one hand, although the contribution of tourism to economic growth has been widely investigated in the tourism economic field, few scholars have empirically investigated the important issue of whether tourism could effectively stimulate economic recovery after the post-disaster recovery phase; likewise, few studies have confirmed whether or not the TLGH is applicable to disaster-affected destinations. Therefore, based on the TLGH, this article applies the panel threshold regression model to explore the threshold effect of tourism development on economic growth for 36 disaster-hit counties during the Wenchuan earthquake recovery and development phase (2008–2016), in an attempt to fill this gap. On the other hand, jointly applying the Tourism Area Life Cycle (TALC) theory, this article further analyzes the dynamism of the nonlinear tourism–growth nexus in different stages of destinations through the evolution of tourism specialization. Based on the empirical results, our study provides comprehensive and reliable insights for policymakers seeking a new source for stimulating economic recovery, both theoretically and empirically. Hence, our research questions to be addressed are: Will tourism development effectively promote economic growth following the disaster shock? Is there a threshold effect of tourism development on economic growth? On the basis of TALC, will the effect of tourism on economic growth vary significantly in different stages of different destinations?
The rest of this paper is organized as follows. Section 2 presents the literature review of the TLGH and TALC model. The case study, method and data source are described in Section 3. Section 4 presents the empirical results of the threshold model. This is followed by conclusions and managerial implications in Section 5.

2. Literature Review

2.1. Tourism-led Growth Hypothesis

Two primary relationships between tourism development and economic growth have been well documented in tourism economic literature: Linear and non-linear relationships. Many studies have investigated the linear tourism-growth nexus by applying such simple techniques as Granger causality tests [38,60,61,62], exponential bivariate GARCH-in-mean model [63], Autoregressive Distributed Lag (ADL) model [59,64], Vector Error Correction Model (VECM) [13,65], and a generalized method of moments (GMM) [66].
Balaguer and Cantavella-Jorda are the first investigators to examine tourism-led growth, illustrating the evidence of one-way causality from tourism to economic growth [29]. Ozturk and Acaravci found no evidence of the tourism–growth nexus in Turkey, suggesting that Turkey’s tourism development cannot significantly stimulate economic growth [67]. Tang and Tan attempted to further verify the validity of the TLGH in Malaysia using a multivariate model derived from the Solow growth theory [62]. They found that tourism had a positive impact on Malaysia’s economic growth, both in the short and long term.
Alhowaish used panel data for the period of 1995–2012 to investigate the causal relationship between tourism development and economic growth in the Gulf Cooperation Council (GCC) countries [68]. The results show a unidirectional causality from economic growth to tourism development. Salifou and Haq employed the panel cointegration technique to confirm the positive effect of physical capital, tourism and the economic globalization index on economic growth in the 11 countries of the Economic Community of the West African States (ECOWAS) [69].
The linear model may oversimplify the tourism-growth nexus because of the complex, dynamic and non-linear link existing among the variables [70]. Hence, some scholars began to investigate the non-linear mechanism between tourism development and economic growth [71,72]. Po and Huang applied the panel threshold approach to test the non-linear tourism-growth nexus in 88 countries. They used q (international tourism receipt as a percentage of GDP) as the threshold variable [73]. The results show that, when q is below 4.05% or above 4.73%, tourism can significantly promote economic growth; when q is between 4.05% and 4.73%, the impact of tourism on economic growth is insignificant.
Chang et al. investigated the threshold effect of tourism on economic growth using r (tourism specialization) as a threshold variable [74]. They found a positive and significant relationship between tourism and economic growth in two regimes: When r is below 14.97% (Regime 1) and when r is between 14.97% and 17.5% (Regime 2). When r is higher than 17.5%, there is no significant relationship between them.
Syed examined the validity of the non-linear tourism–growth nexus for the top ten world tourism destinations using a quantile-on-quantile approach [15]. He found that a positive relation between tourism development and economic growth for the ten countries showed substantial variation across countries. Zuo and Huang employed a system generalized method of moments (SYSGMM) to explore the non-linear relationship between tourism specializations and economic growth in the 31 provinces of mainland China [26]. The empirical results reveal that there is a meaningful N-shaped or inverted-U-shaped relationship between tourism specializations and economic growth.

2.2. Tourism Area Life Cycle model

Since the 1960s, early scholars have already put forward some ideas about the evolution of tourism destination [74,75,76]. Butler’s (1980) TALC is one of the most influentially theoretical models in the tourism field [77]. Butler’s model is the six-stage model of destination evolution, which suggests that the tourism area life cycle experiences six stages, including exploration, involvement, development, consolidation, stagnation, and decline or rejuvenation. Later, Butler (2000) further revised the model and put forward the factors influencing the TALC model: (1) Dynamism, (2) process, (3) capacity or limits to growth, (4) triggers, (5) management, (6) long-term viewpoints, (7) special components, and (8) universal applicability [78].
The TALC has drawn theoretical and practical attention, examination, and modification in relevant literature [79,80,81,82,83]. Kubickova and Li examined the role that the government plays in tourism competitiveness and understood the relationship based on the TALC model [84]. Tang et al. investigated the factors influencing the tourism industry’s carbon emissions from the TALC model perspective [85]. Zhong et al. investigated the applicability of the TALC model to China’s Zhangjiajie National Forest Park [86]. Some studies extend the stages of the TALC, including the post-stagnation stage [87], the rejuvenation stage [88] and the reinvention stage [89].
There have been many debates about how to select the indicators measuring the TALC model. Previous studies widely applied the indicators of tourism specialization to assess the evolution of TALC. These specialization indicators include tourist arrival (e.g., length of stay, characteristics of tourists), tourist receipt and tourist expenditure [87,90,91]. Other scholars selected tourist-related establishment and the authorities’ involvement scope as the evaluating indicators [92,93,94].
The destination life cycle is a dynamic evolutionary process. It is closely related to the level of tourism specialization [26,72,73]. Tourist arrival is a key indicator measuring tourism specialization. Tourist arrival refers to the tourism demand necessary to attract tourists to visit, reflecting the “carrying capacity” of the destination. Development and growth in the TALC model are often expressed in terms of visitor numbers [81]. Tourist receipt is another indicator. Tourist receipt denotes the economic contribution of tourism development, reflecting the structural effect or quality of the tourism specialization.
The process of the effect of tourism specialization on economic growth is embedded in the TALC model [26]. The impact of tourism on economic growth varies with the different level of tourism specialization. This, in turn, reflects the changing effect of the tourism–growth nexus in the different stages of destination life cycle. Consequently, on the basis of the empirical results, this article further divides the 36 disaster-hit counties into six types according to the different stages of the TALC model and discusses the specific impact of tourism on economic growth in different types.

3. Case Study, Method and Data
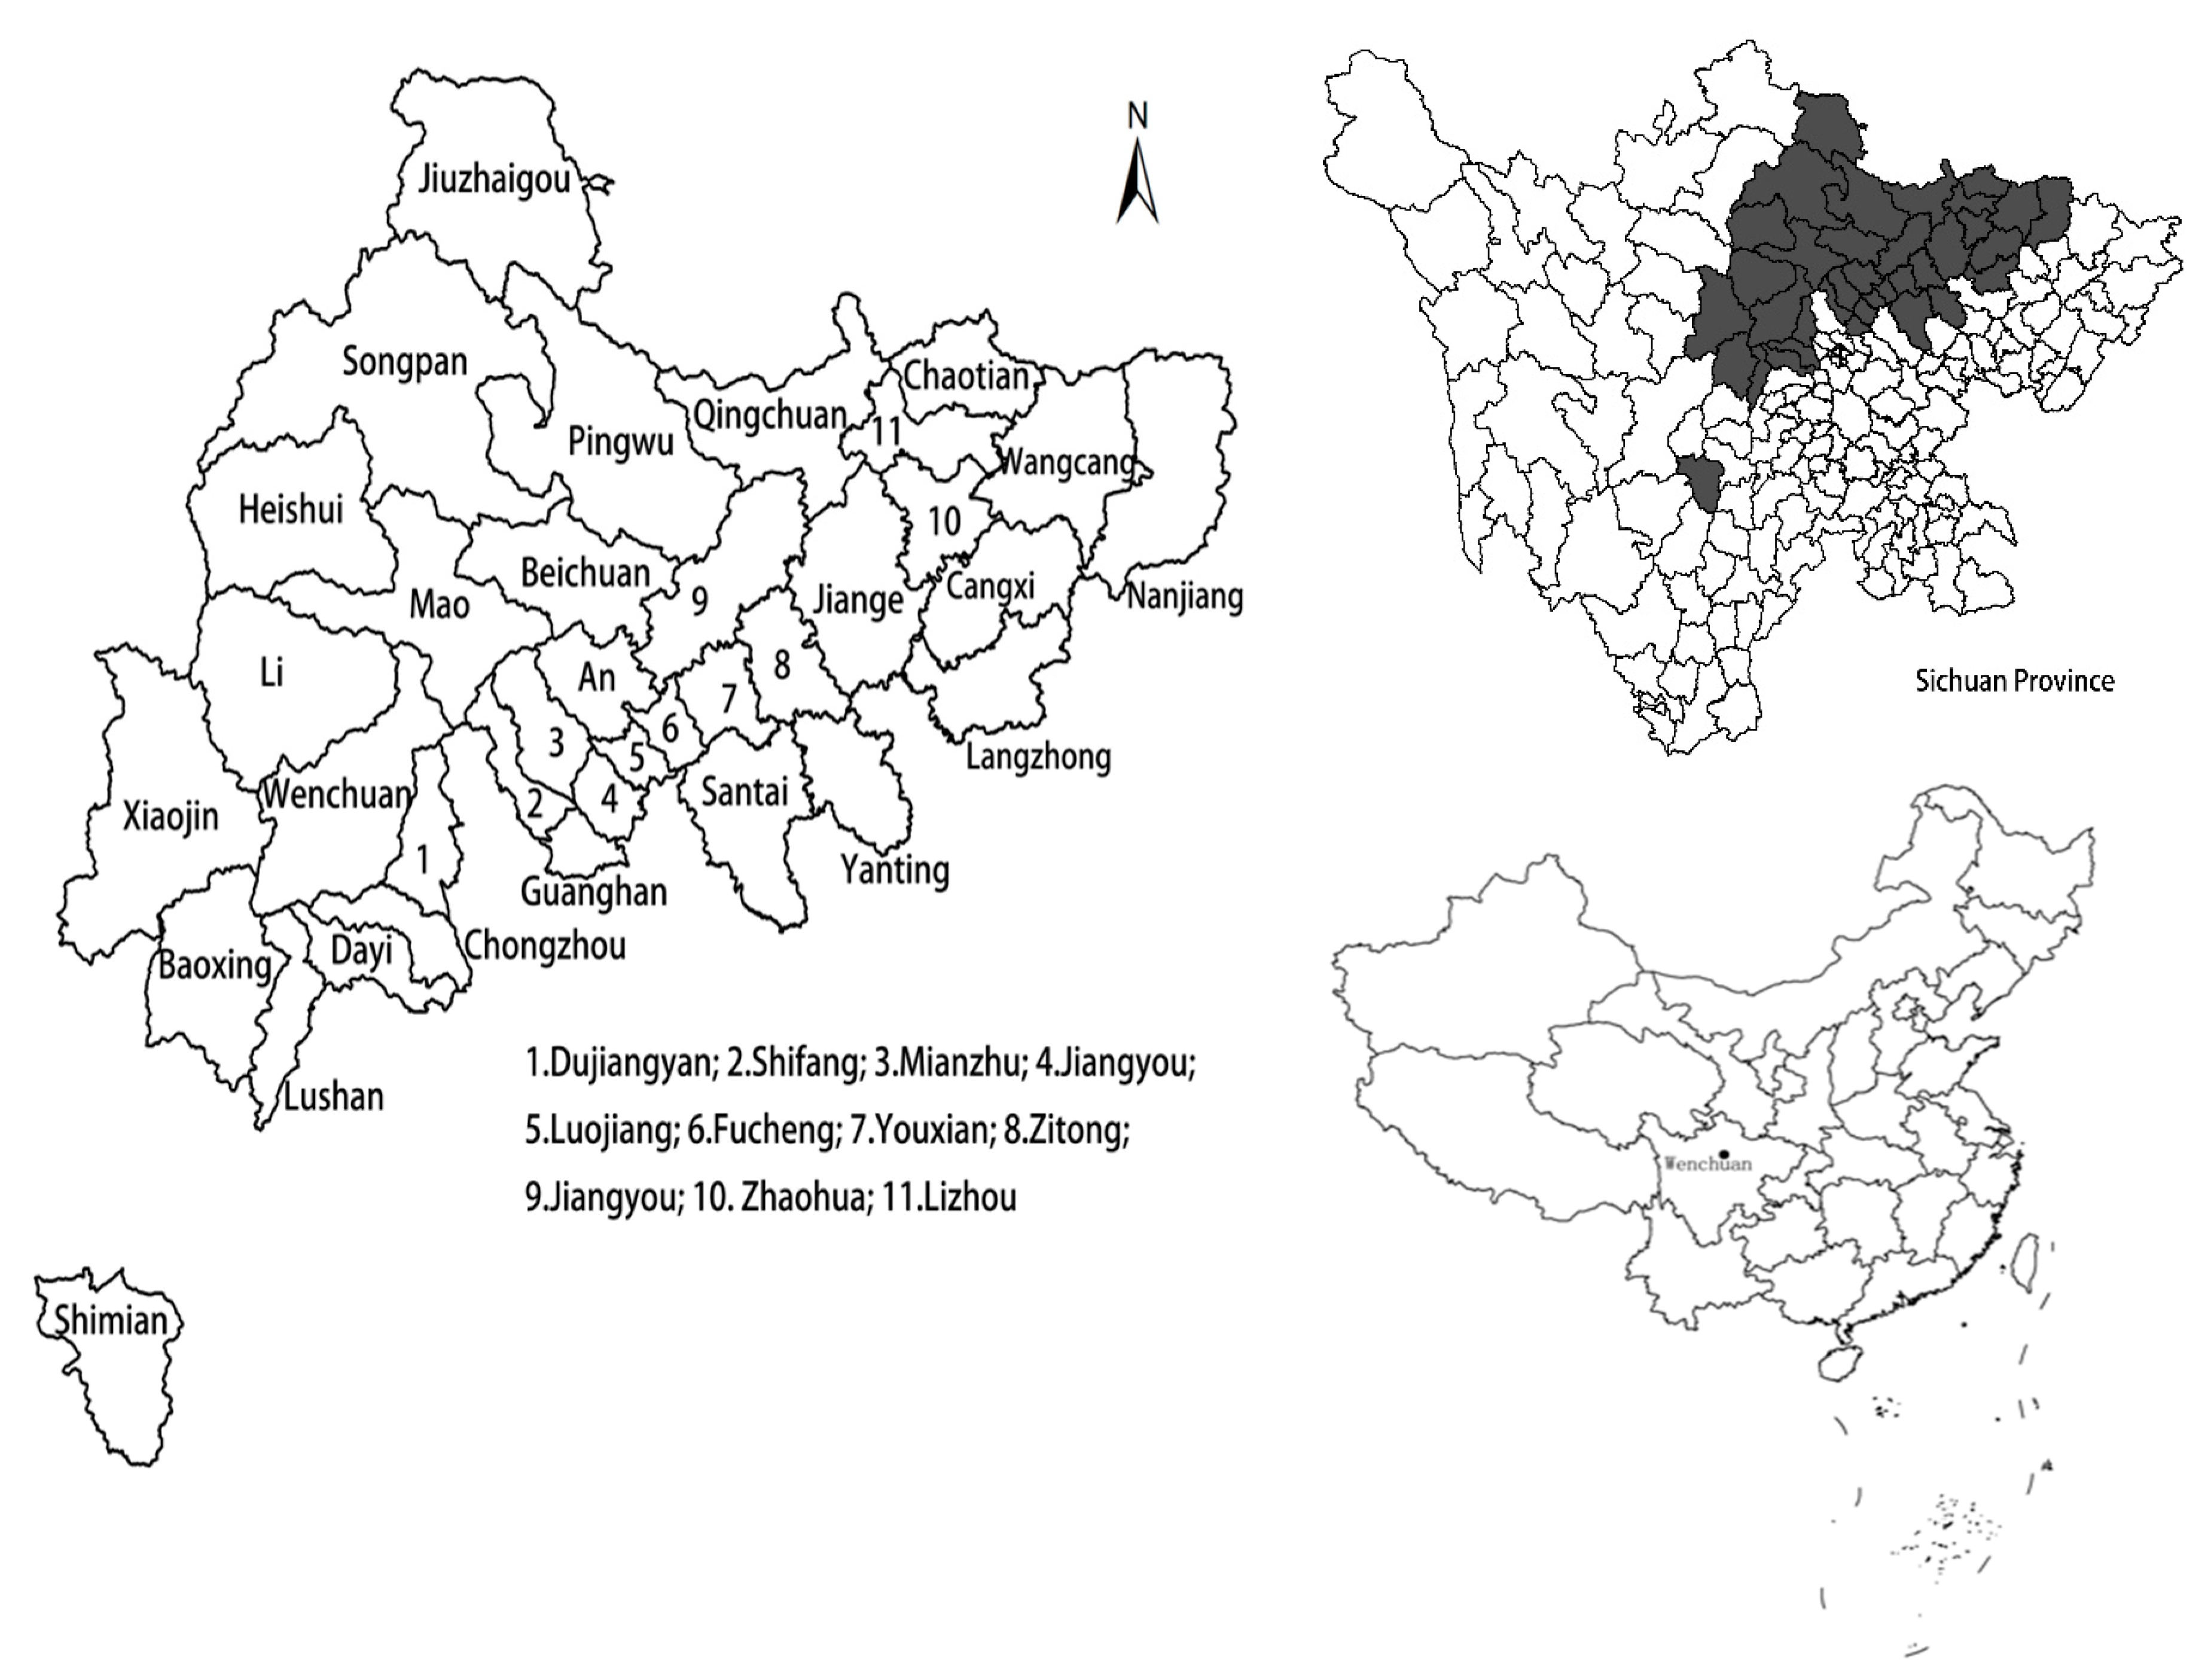
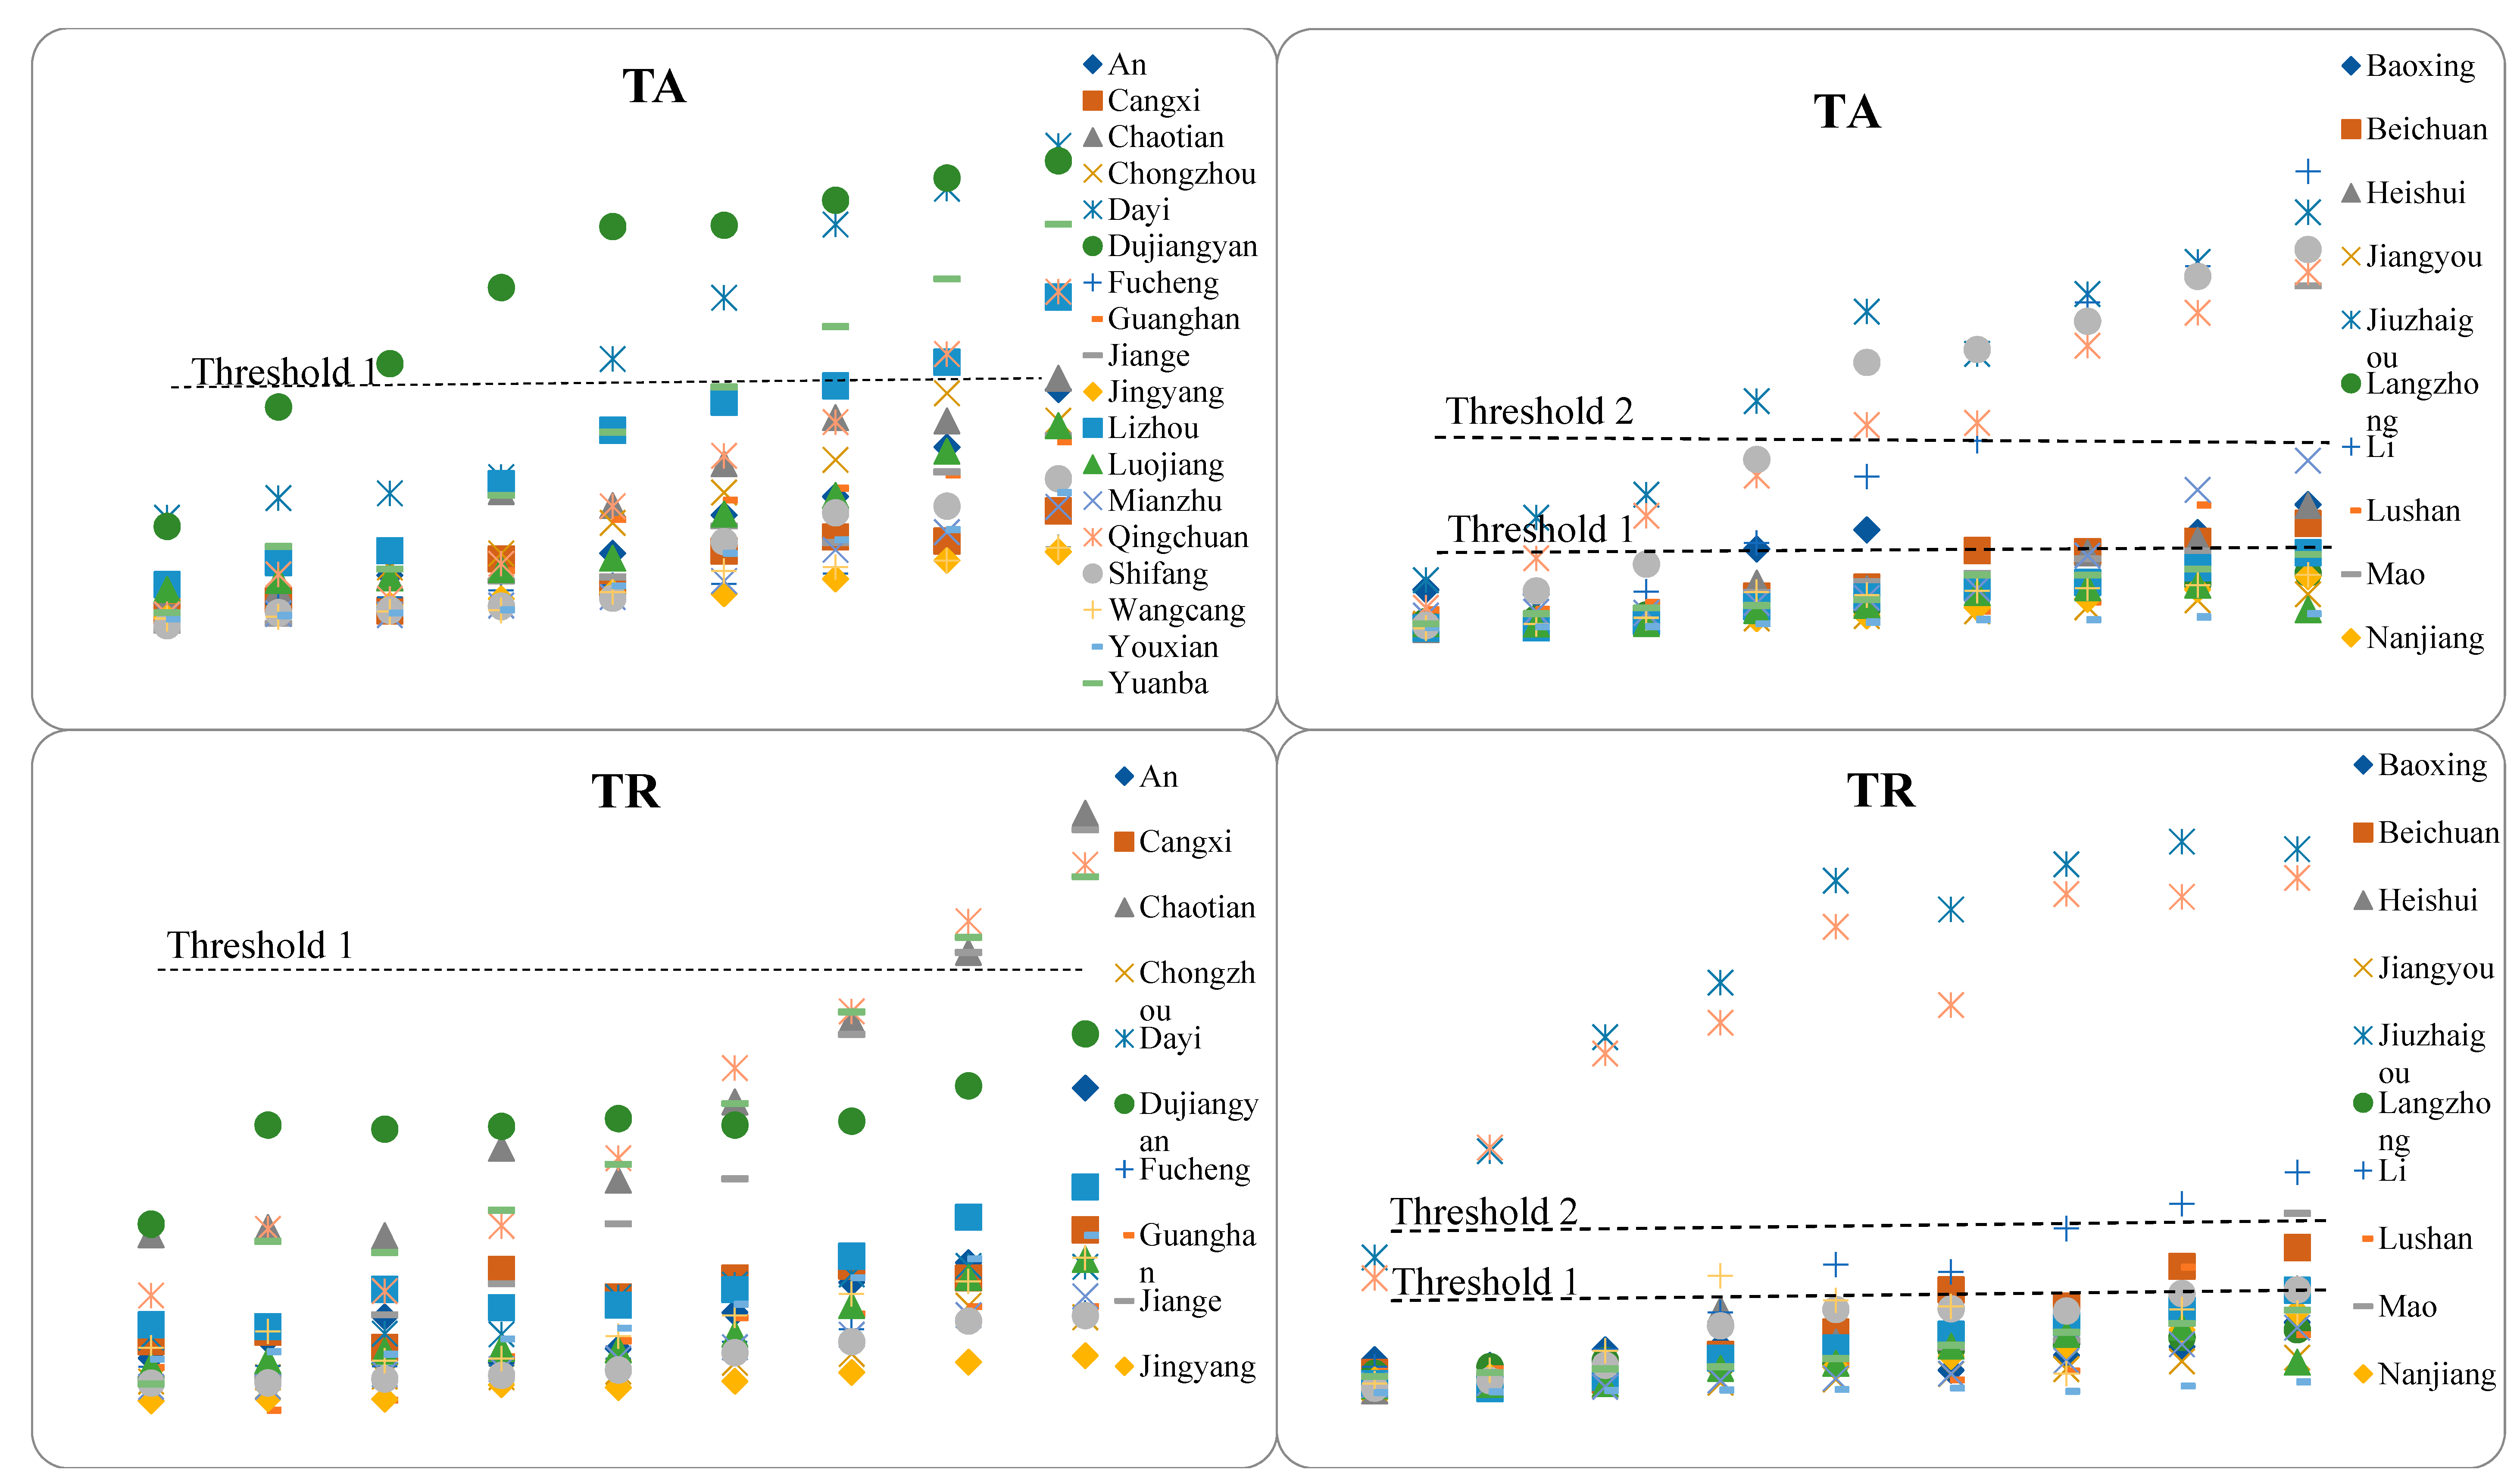
3.1. Case Study

On 12 May 2008, the magnitude-8.0-Ms Wenchuan earthquake struck Wenchuan County in the Aba Tibetan and Qiang Autonomous Prefecture of the Sichuan Province in China (see Figure 1). The earthquake struck most areas of the Sichuan province and caused huge loss of life and property. The earthquake resulted in 69,226 human deaths, 374,643 injures, and 17,923 people that went missing. It also left millions of people homeless.
The Wenchuan Earthquake also destroyed buildings, the ecological environment, critical infrastructure (e.g., highways, water supply, sewage, gas and power systems), and industrial developments. The tourism industry was one of the industries most affected by the earthquake. Direct losses to the tourism industry amounted to 46.6 billion Yuan in Sichuan province. The 36 counties, as shown in Figure 1, which were located in the active seismic belt, were extremely affected by the earthquake. This resulted in a large recession of tourism industry and the dramatic downturn of the entire economy.
After the Wenchuan earthquake, tourism was strategically used to stimulate the economic recovery of most of the 36 disaster-stricken counties. Table 1 illustrates the evolutionary levels of tourism specialization in the 36 counties during the period between 2008 and 2016. The levels of tourism specialization (e.g., tourist arrivals, tourist receipts) in most counties continued to increase after the Wenchuan earthquake. Until 2016, tourism receipt accounts for 40% of the GDP in 20 counties. Hence, tourism is used as a primary pathway of invigorating economic growth in most of the disaster-affected destinations and generates considerable economic returns. It can be seen from Table 1 that tourism receipt has currently become the main source of economic income in these counties.

3.2. Method

Given that the impact of tourism development on economic growth may be non-linear, we employ the fixed-effects panel threshold regression approach of Hansen [95]. In this way, we can explore how tourism development has different influences on economic growth under different levels of threshold variable.
Hajamini and Mohammad suggest that the panel threshold regression method can be more reliable than the cross-sectional and time-series models [96]. The structural equation for the basic panel threshold is as follows:
y i t = μ i t + β 1 x i t I ( q i t γ ) + β 2 x i t I ( q i t > r ) + e i t
where the dependent variable, yit, is the economic growth in the 36 counties in the Sichuan province between 2008 and 2016. The independent variable, xit, denotes tourism development; qit refers to the threshold variable; r is the value of the threshold; μ it indicates the unobservable individual effects of the county; e i t is the random standard error; and I(.) refers to the indicator function.
Hansen suggests that the observations be divided into two regimes, depending on whether the threshold q is smaller or larger than the r parameter [96]. The regimes are distinguished by the slope coefficients: β 1 and β 2 . Therefore, an alternative method of the equation can be written as:
y i t = { u i t + β 1 x i t + e i t if   q γ u i t + β 2 x i t + e i t if   q > γ
To make sure that the empirical results are valid and significant, it is necessary to employ the F test. Hansen recommends that the F test be used to test for the threshold effect and the sup-Ward statistic be applied to test null hypothesis:
F = supF ( r ) and   F ( r ) = ( S S E 0 S S E 1 ( r ) ) / 1 S S E 1 ( r ) / n ( T 1 ) = S S E 0 S S E 1 ( r ) σ 2
Given that there may exist a non-standard distribution of an F test, Hansen proposes a bootstrap method to produce the first-order asymptotic distribution for testing. The P-value for the F-statistic yield from the bootstrap can be used to validly test the existence of a threshold. The null hypothesis of the threshold effect is rejected if the F statistical value is larger than the desired critical value [95], meaning that a nonlinear relationship exists between tourism development and economic growth.
As stated in the introduction, this study empirically focuses on the effect of tourism on economic growth based on the prevailing TLGH by considering three aspects. First, since tourism developed quickly during the post-Wenchuan earthquake recovery and development phase, and because tourism income contributes much to economic revenue, we focus our discussion on whether tourism may be a catalyst for stimulating economic growth following the Wenchuan earthquake. Secondly, during the processing work, we also followed previous literature to test a causal relationship from economic growth to tourism development using the panel Granger causality test. However, the results did not support such a relationship, rejecting the hypothesis of EDTG. Finally, in the process of conducting the study, we applied a panel threshold regression method to examine the threshold effect of economic growth on tourism development. The results revealed that the statistical F values for the three thresholds were all below their critical threshold values, indicating no threshold effect of economic growth on tourism development, rejecting the EDTG hypothesis. Therefore, for the above reasons, we did not examine the EDTG hypothesis in this paper.

3.3. Data

We explore the effect of tourism development on economic growth in 36 disaster-hit counties in Sichuan province following the Wenchuan earthquake. The data spans the period of 2008 through 2016, collecting from the Sichuan Statistical Yearbook (2008–2017), Sichuan Yearbook (2008–2017), Chengdu Yearbook (2008–2017), Deyang Yearbook (2009–2017), Mianyang Yearbook (2008–2017), Yaan Yearbook (2008–2017), Aba Tibetan and Qiang Autonomous Prefecture Yearbook (2009–2017), and the Official Statistical Bulletins for National Economic and Social Development of 36 Counties (2009–2017). Missing data are supplemented by the averaging method with the data from the adjacent two years.
The dependent variable economic growth is constructed by the logarithm of the real GDP per capita (LGDP) [15,26,37]. We empirically confirm the tourism-led growth relationship by establishing a fixed-effect panel data model and a panel threshold regression model. For the threshold variable, the level of tourism specialization is measured by TR (tourism revenue as a share of the real GDP) and TA (tourist arrival as a percentage of the local population). The level of industrial structure is reflected by the variable of IS (the proportion of employees in a tertiary industry to total employees). According to Zuo and Huang [26], TA reflects the size effect or level of tourism specialization, and TR measures the structure effect or quality of tourism specialization.
To control for the effect of the other variables on economic growth, we apply the following control variables according to the recommendations of previous literature [56,62,66,96]: The ratio of the total investment in fixed assets to GDP as capital investment (INV), the ratio of the length of the highway roads to the county area as transportation accessibility (HD), and the proportion of employees in a tertiary industry to total employees as industrial structure (IS). In addition, considering that the Wenchuan earthquake may affect the economic growth, we add the dummy variable for Y2008 to the model. Complete details of the data sources are given in Table 2.

4. Empirical Results

The estimations of panel fixed-effects model and panel threshold regression model first require that all variables are stationary to avoid generating the ‘spurious regression’. The first-generation panel unit root tests (e.g., ADF, LLC, IPS, and PP) are performed to test the stationarity of variables under the assumption that the individual time series in the panel are cross-sectionally independent [101]. If the individual time series in the panel are cross-sectionally, dependently distributed due to the common factors, the results using the first-generation panel unit root tests will cause distortion [102]. Therefore, to overcome this deficiency, we utilize the Pesaran’s cross-sectional dependence (CD) test which examines the cross-sectional dependence in the panel-data models with small T and large N [102]. Then we need to apply the Pesaran’s CADF test to examine the stationarity of all variables in panels with cross-sectional dependence [102]. In Table 3, the results of Pesaran’s CD test reject the null hypothesis of the cross-sectional independence, indicating that the data in the cross-sections are interdependent. Hence, the Pesaran’s CADF test is further used to examine the stationarity of all variables. Table 3 shows significant stationarity results for all variables (e.g., LGDP, TA, HD, INV, IS) at 1% and 5% significance level.
Table 4 and Table 5 display the linear and non-linear impacts of tourism development on economic growth estimated using a conventional panel regression model and panel threshold regression model, respectively. Model 1 in Table 6 presents the linear results based on the panel fixed-effects model. The Hausman test and F test are used to select the pooled OLS model, panel fixed-effects model or panel random-effects model. The Hausman test and F test are both significant at the 1% statistical level, which indicates that the empirical results of the panel fixed-effects model are regarded as reliable. The estimated coefficient of TA is 0.015, which is positive and significant at the 1% statistical level. This implies that a 1% increase in the ratio of tourist arrival to GDP may lead to a 0.015% increase in the logarithm of real GDP per capita (LGDP). The result confirms the validity of the TLGH for the disaster-stricken destinations, and concurs with Chiu and Yeh [45], Katircioglu [46], and Lee and Chang [38], who find evidence of supporting the TLGH that tourism development can be an effective engine for stimulating economic growth.
For the other explanatory variables, in line with Che [103], Foster [104], Pratt [105] and Shi et al. [106], the variables of HD, INV, and IS are estimated to be positive and significant at the 1% statistical level, indicating that transportation accessibility, capital investment and industrial structure can significantly stimulate economic growth. The dummy variable Y2008 for the Wenchuan earthquake has a significantly negative impact on economic growth at the 1% statistical level. This illustrates that the Wenchuan earthquake caused severe damage to the 36 counties and led to a 33% decline in the entire economy. The results are supported by Miao and Ding [107], who investigate the impact of the Wenchuan earthquake on the economy of the counties in the Upper River. They find that the disaster interrupts the counties’ economy and has different effects on regional economic recovery.
In order to investigate the nonlinear relationship between tourism development and economic growth under the different levels of tourism specialization and industrial economy, the article uses a panel threshold regression model. Prior to conducting this analysis, it is necessary to test whether a non-linear relationship exists by determining the number of regimes using the F-test statistic and bootstrap P-value. According to Table 4, the results of F-test and P-value show that the null hypothesis of threshold effect test of all threshold variables (TA, TR and IS) are rejected at the 5% or 10% statistical level in the single threshold model and the double threshold model, but are accepted at the 10% statistical level in the triple threshold model, showing that the tourism–growth model is a two-regime model. Therefore, the following panel threshold regression analysis, which will be based on the double threshold model, is appropriate.
When TA is set as the threshold variable, the threshold values are 17.09 and 40.15. When TR is the threshold variable, the threshold values are 0.52 and 0.93. When IS is the threshold variable, the threshold values are 0.20 and 0.34.
In Table 5, Models (2)–(4) report the non-linear results estimated using the panel threshold model. In Model (2), when TA is used as the threshold variable, we divide the 36 counties into three regimes: 30 counties in regime 1, three counties in regime 2 and three counties in regime 3. If TA is less than 17.09 (regime 1), a 1% increase in TA may significantly contribute to a 0.053% increase in LGDP. If TA is above 17.09 and below 40.15 in Regime 2, a 1% increase in TA may significantly lead to a 0.033% increase in LGDP at the 1% statistical level. If TA exceeds 40.15 in Regime 3, a 1% increase in TA can bring about a 0.017% increase in LGDP at the 1% statistical level. These results reveal that the estimated coefficients will become significantly smaller with a TA higher than the threshold value.
Similarly, when using TR as the threshold variable in Model 3, there are 33 counties in regime 1 (TR ≤ 0.52), 1 county in regime 2 (0.52 < TR ≤ 0.93) and 2 counties (Songpan and Jiuzhaigou) in regime 3 (TR > 0.93). The estimated coefficients of TA on LGDP are significantly positive at the 1% statistical level. These coefficients tend to be smaller with a TR exceeding the threshold value.
When the IS is set as the threshold variable in Model 4, 18 counties are in regime 1 and 18 counties are in regime 2. According to the results in regime 1 (IS ≤ 0.20) and regime 2 (0.20 < IS ≤ 0.34), tourism development has a positive impact on economic growth at the 1% significant level. When IS is larger than the highest threshold value (0.34) in regime 3, a significantly negative relationship exists between tourism development and economic growth at the 1% statistical level. This illustrates that a 1% increase in TA may cause a 0.139% decline in LGDP. In addition, the magnitudes and dimensions of the estimated results for the control variables (HD, INV, IS, and Y2008) are similar to those of Model 1.
For the two indicators of tourism specialization (i.e., TA and TR), when tourism specialization exceeds the first and the second threshold values, the estimated coefficient will become smaller, reflecting that the law of diminishing returns of tourism to economic growth exists. The findings in our study are similar to those of Chang et al. [72], Po and Huang [73], and Zuo and Huang [26]. When tourism specialization exceeds the first or second threshold value, the destination goes into a lock-in situation because of the path-dependence [26]. According to Chang et al. [72], a destination at a high level of tourism specialization may lose the destination’s comparative advantage in tourism with a low contribution of tourism and possibly generates unsustainable economic growth in the long term.
Javier et al. argue that an excessive tourism-oriented economy may have less dynamic or low efficient growth [47]. Table 6 shows that most counties have a low level of tourism specialization. Two counties (i.e., Songpan and Jiuzhaigou) have high levels of tourism specialization, illustrating that tourism development is the main source of local economic activities in these two destinations.
Moreover, there exists non-synchronization between TA and TR in some counties (Table 6), meaning that a conflict may occur between tourism expansion and tourism quality. There are three situations: (1) TA is between the first and second threshold, while TR is below the first threshold (e.g., Dujiangyan, Dayi); (2) TA exceeds the second threshold, while TR is below the first threshold (e.g., Wenchuan); and (3) TA exceeds the second threshold, while TR is between the first and second threshold (e.g., Li). These situations show that the destinations are dominated by mass tourism and low-quality development.
Despite tourism expansion attracting more and more tourists to visit, traditional sightseeing is still the main form of tourism. Destinations that lack high-quality or diversified deep-experiential products may experience a low level of tourism expenditures. Some scholars also find that tourism expansion is less likely to promote long-term economic growth (Javier et al.). In addition, when tourist arrival exceeds the maximum capacity of a destination, it will generate negative social, economic, and environmental problems and undermine the sustainable growth of the economy.
For the threshold value of IS, when IS exceeds the second threshold value (0.34), tourism development negatively influences economic growth. The reason for this may be attributed to the symptom of ‘Dutch disease’. On the one hand, tourism may lead to a reallocation of productive resources and labor from other traditionally productive sectors (e.g., agriculture, manufacturing, forestry) to the tourism-oriented sectors, weakening the competitiveness of traditional sectors [72,106]. This will cause a deindustrialization process and hamper long-term economic growth. On the other hand, the inflow of large amounts of short-term capital into the tourism sector may bring about an unduly rapid tourism expansion. This will lead to a rapid increase in local land prices, a crowding-out effect on local enterprises and an overall loss in social welfare [15,51,71].
In our study, the economic structure of most disaster-stricken counties, in the early stages, is dominated by the agriculture or manufacturing industries. Therefore, an unduly rapid expansion of the tourism sector may lead to a ‘Dutch disease’ effect on other economic sectors, eventually reducing the sustainability of economic growth in such counties as An and Fucheng.
Tourism-led growth is an evolutionary process of change. It reflects the fact that the non-linear tourism–growth nexus is stage-based. Our paper echoes Zuo and Huang [26], who also find that the non-linear impact of tourism-led growth depends on the different stage of the tourism destination life cycle. Namely, in the early stages of the destination, tourism generates increasing economic income and promotes economic growth. When tourism specialization values exceed their critical levels, the impact of tourism on economic growth will decline. The estimated coefficients of tourism on economic growth vary across the different levels of tourism specialization, illustrating that destinations at different stages of the destination life cycle may experience various tourism–growth nexus issues. Lundgren examined the relationship between the attractiveness of tourists and tourism development, suggesting that in the initial stage, the graph curve of theoretical attractiveness reaches a high level, leading to a rise in the popularity of the area. In subsequent phases, the theoretical attractiveness begins to drop [82].
Therefore, in order to further explore the dynamism of the tourism–growth nexus along the different stages of different destinations, we divide the 36 destinations into six types based on Butler’s destination life cycle model: Exploration-stage type, involvement-stage type, transition-stage type, development-stage type, consolidation-stage type, and stagnation-stage type. In the meantime, as TA and TR do not synchronously change, using any individual indicator cannot fully reflect the nature of destination life cycle evolution [26]. Hence, these above types are divided by the change of tourism specialization which consists of both TA and TR (see Table 7 and Figure 2).
Exploration-stage type
Two indicator values of tourism specialization (i.e., TA and TR) are found to be less than the first threshold values. These values do increase slowly. Before the Wenchuan earthquake, most resources were not exploited and tourism facilities were not developed. Tourist arrivals were scarce and the proportion of tourism receipt to GDP was very low. After the earthquake, local governments seized opportunities for tourism development and began to consider tourism as a pathway to stimulating economic recovery. Both tourism arrival and tourism receipt rose steadily but still remain at a low level. Destinations of the exploration-stage type are often in the initial stage of the tourism life cycle. The impact of tourism on economic growth is high. Jingyang and Yanting follow the exploration-stage type.
Involvement-stage type
The values of TA and TR are both below the first threshold but keep increasing. The contribution of tourism to economic growth is significant. The destination of the involvement-stage type often occurs in the early stage of the tourism life cycle. There are many reasons for this. One reason may be that, after the Wenchuan earthquake, the local governments began to consider tourism development as an important strategy for promoting economic recovery. More specifically, The Sichuan Tourism Recovery and Reconstruction Plan for the Post-Wenchuan Earthquake stated that the tourism industry should be a dominant and leading industry in the disaster-ruined area during the post-recovery and reconstruction phases. Therefore, local initiatives exploited potential resources, developed tourism facilities, and increased capital investments in tourism to cater to increasing numbers of tourists. Seventeen counties belong to the involvement-stage type.
Transitional-stage type
Whereas TA is below the first value, TR is between the first and second threshold values. Destinations of this type experience transition from the involvement stage to the development stage. As a result, a potential travel market begins to form. In spite of the relatively low number of tourist arrivals, many high quality and experiential tourism products or activities were developed to increase tourism expenditures, thus leading to relatively high tourist receipt. Tourism significantly contributes to economic growth in the transitional stage. The counties of Jiange, Pingwu, Zitong, and Nanjiang are included in the type.
Development-stage type
In this type, tourism development significantly facilitates economic growth. Two patterns are further classified in the development stage: Tourism expansion and tourism quality. In the pathway of tourism expansion, TA exceeds the first threshold value, whereas TR is lower than the first threshold value. In spite of the progressive growth in tourist arrival, a low-quality tourism expansion, which lacks high-quality or experiential products, may reduce tourism expenditure or short travel time. This leads to a low level of tourism receipt. Dujiangyan, Dayi, Lizhou, Beichuan, Shimian, and Baoxing belong to the tourism expansion type.
In the tourism quality mode, both TA and TR are between the first and second threshold values. This illustrates that the destinations have entered into a second life cycle through tourism innovations or high-quality tourism product development. This is a more sustainable manner of attracting an increasing the number of tourists. In the development stage, the travel market is booming, and tourism has already occupied a large proportion of the local economy. Yuanba, Chaotian, Qingchuan, and Heishui are in the tourism quality type.
Consolidation-stage type
Both TA and TR exceed the second threshold value and continue to grow. However, the growth rates of tourist arrival or tourist receipt may begin to drop. The destination of the consolidation-stage type is often considered to have a tourism-dominated economic structure [77,108], where tourism receipt is the main source of economic income. The travel market tends to be mature in this stage. The effect of tourism on economic growth becomes smaller compared with the early stages of tourism development. The destinations include Li, Mao, Songpan and Jiuzhaigou.
Stagnation-stage type
Whereas TA is larger than the second threshold value, TR is between the first and second threshold value. Although the number of tourist arrivals is high, they may face a diminishing rate of tourism receipt due to the extensive resource-relied mode, excessive competition, innovation and institutional inertia. Signs of a recession emerge in the travel market. Meanwhile, an excessive number of tourist arrivals likely result in economic, social, and environmental problems. The effect of tourism development, which relies solely on tourism expansion, on long-term economic growth is very limited.
Wenchuan is the only county that belongs to the stagnation-stage type. In the future, it may enter the decline stage. According to the Wenchuan official statistics in 2017, the number of tourist arrivals substantially drops by 25.9%, and tourism receipt decreases by 27.9%.
In addition, it should be noted that the regular evolution of the tourism life cycle may be interrupted by human-induced hazards or natural disasters [77,89,109], which require a long time to return to the normal track. In our study, two values of tourism specialization in the two counties of Sonpan and Jiuzhaigou decreased dramatically after the Wenchuan earthquake. This includes TA degenerating from the medium regime in 2007 to the low regime in 2008 and TR declining from the high regime in 2007 to the median regime in 2008.

5. Conclusions and Managerial Implications

To date, few studies have investigated the causal relationship between tourism development and economic growth following disasters. Hence, we use cross-sectional data to examine the linear and non-linear impact of tourism development on economic growth in 36 disaster-stricken counties covering the period of 2008 through 2016, in an attempt to fill this gap. Then, we use this information to further explore the dynamism of the nonlinear tourism–growth nexus based on the theory of Butler’s TALC.
This study involved many steps. First, we applied the fixed-effects panel regression model to investigate the linear impact of the tourism–growth nexus. The results illustrate that there is a positive and significant impact of tourism on economic growth, meaning that tourism development can significantly enhance economic growth. The results confirm the applicability of the TLGH for the disaster-stricken counties. The control variables (i.e., INV, HD and IS) were found to positively affect economic growth at the 1% statistic level. The dummy variable Y2008 negatively influences economic growth at the 1% statistic level, illustrating that the Wenchuan earthquake caused huge economic losses and led to a dramatic decline in the entire economy.
Secondly, the non-linear results obtained from the panel threshold regression model illustrate that non-linear relationships exist between tourism development and economic growth under the threshold variables of TA, TR and IS. These show that counties with different conditions of tourism specialization and industrial structure experienced various impacts on the tourism-led growth nexus.
For the variables TA and TR, the estimated coefficients of tourism on economic growth decrease when both TA and TR exceed the first and second threshold values. For the variable IS, tourism development negatively influences economic growth when IS is larger than the highest threshold value (0.34). This is due to the ‘Dutch disease’ effect, which implies that tourism development, with a high level of industrial structure, undermines the sustainable growth of the overall economy in disaster-stricken counties.
Thirdly, the tourism–growth nexus is a dynamic process of change, closely related to the evolution of the destination life cycle. The estimated coefficients of tourism on economic growth vary with the different levels of tourism specialization. This shows that destinations at different stages of the destination life cycle may have various kinds of influence on the tourism–growth nexus. Therefore, based on Butler’s TALC theory, we further divided the 36 disaster-stricken counties into six types through the evolutions of two main indicators of tourism specialization (TA and TR): Exploration-stage type, involvement-stage type, transition-stage type, development-stage type, consolidation-stage type, and stagnation-stage type.
This article reveals some significant findings. First, although the 8-magnitude Wenchuan earthquake caused huge damage to some areas, it may also break the original economic structure and provide one opportunity of tourism for revitalizing the economy for non-tourism-based areas. Secondly, tourism policy is another driving factor of tourism contributing to economic growth [61,66,110,111]. Some polices, such as The Sichuan Tourism Recovery and Reconstruction Plan for the Post-Wenchuan Earthquake (2008–2010), the State Council’s Opinion on Supporting Policies and Measurement for Post Recovery and Reconstruction (2008), emphasize tourism as the leading industry of stimulating economic recovery in disaster-hit destinations. Thirdly, the economic growth is significantly influenced by transport accessibility, capital investment, industrial structure and disaster. Fourthly, for the tourism-dominated areas, the economic structure’s over-reliance on tourism generates less economic benefit to other areas. It even brings about some adverse effects (e.g., ‘Dutch disease’ effect). Finally, based on Butler’s TALC model, the impact coefficients of tourism on economic growth vary with different levels of tourism specialization, indicating that the tourism–growth nexus changes along with the different life stages of destinations. Hence, we conclude that tourism development is not only a source of stimulating economic recovery for the disaster-stricken area but also a huge power for incurring the industrial structure transformation in the destination economy. The results are generally applicable to policymakers seeking new ways of invigorating the economy in other disaster-hit destinations.
The empirical results in our study have theoretical and practical implications for policymakers in disaster-hit destinations. Local policymakers should establish suitable and effective tourism policies and measurements to promote economic growth based on the different stages of the tourism area life cycle. Destinations of the exploration-stage type and the involvement-stage type, with low levels of tourism specialization, should be concerned about how to exploit potential resources, perfect the diversified and high-quality tourism products, and improve transportation facilities to attract mass tourists. Destinations of the development-stage type should establish a comprehensive and diversified market; it should also improve the quality of the travel products. The destination of the consolidation-stage type should expand the travel market and diversify the economy. This can be accomplished by establishing strong links between the tourism sectors and the other industries to improve the travel market vitality. For the destination of the stagnation-stage type, policymakers should make innovative incentives for tourism development to extend the destination development life cycle, or they should focus on developing other more productive or more efficient industries, if the less-efficient tourism industry cannot be improved. In addition, tourism policymakers should fully recognize the vulnerability of tourism and take measures to strengthen the resistance of the tourism industry to natural disasters and human-induced hazards.
Like other tourism economic literature, this study has some limitations based on which it offers suggestions for future research. First, in terms of research technique, we focus on the effect of tourism development on economic growth following a disaster shock from a static perspective without considering the dynamic effect. Future study will explore the dynamic relationship using some economic techniques, such as the SYSGMM and the panel smooth threshold regression (PSTR) approach. Second, future studies will consider some variables related to tourism development, such as improved accessibility, better accommodation, and tourism attractiveness. In this study, we do not examine the inner relations between these tourism factors and tourism development due to the lack of statistical data. In our future work, we will explore the inner relations of the above factors with tourism development by collecting the data and text materials in various ways, for instance, from official reports, statistical yearbooks, relevant literature, and field investigations.

Note

Notice of the State Council of China on printing and distributing the general plan for recovery and reconstruction after the Wenchuan Earthquake announced the 39 disaster-stricken counties of the Sichuan province that were seriously affected by the Wenchuan earthquake. They include: Penzhou, Dujiangyan, Chongzhou, Dayi, Jingyang, Luojiang, Guanghan, Shifang, Mianzhu, Lizhou, Yuanba, Chaotian, Wangcang, Qingchuan, Jiange, Cangxi, Fucheng, Youxian, An, Santai, Yanting, Zitong, Beichuan, Pingwu, Jiangyou, Langzhong, Shimian, Lushan, Baoxing, Nanjiang, Wenchuan, Li, Mao, Songpa, Jiuzhaigou, Xiaojin, Heishui, Hanyuan, and Zhongjiang. Because there are large gaps in the data on tourism arrival and tourism receipt in Pengzhou, Hanyuan, and Zhongjiang, we select the other 36 counties for the case study. Source: http://www.gov.cn/zwgk/2008-09/23/content_1103686.htm.

Author Contributions

Conceptualization, L.C. and J.Z.; Methodology, J.Z.; Software, J.Z.; Validation, L.C. and J.Z.; Formal Analysis, J.Z.; Investigation, J.Z.; Resources, L.C. and J.Z.; Data Curation, J.Z.; Writing—Original Draft Preparation, J.Z.; Writing—Review & Editing, L.C.; Visualization, L.C.; Supervision, L.C.; Project Administration, L.C.; Funding Acquisition, L.C.

Funding

This research was funded by National Natural Science Foundation of China (40971297), National Social Science Fund of China(18FGL015), Innovation Spark Project of Sichuan University(2018hhs-57), Sichuan University Cluster for Regional History and Frontier Studies.

Acknowledgments

Thanks to the comments and suggestions of the three reviewers and the editors, the quality of this article has been further improved.

Conflicts of Interest

The authors declare no conflict of interest.

References

  1. Bongkosh, N.R. Tourists’ and tourism suppliers’ perceptions toward crisis management on tsunami. Tourism Manag. 2013, 34, 112–121. [Google Scholar]
  2. Goodrich, J.N. September 11, 2001 attack on America: A record of the immediate impacts and reactions in the USA travel and tourism industry. Tourism Manag. 2002, 23, 573–580. [Google Scholar] [CrossRef]
  3. Kotzee, I.; Reyers, B. Piloting a social-ecological index for measuring flood resilience: A composite index approach. Ecol. Indic. 2016, 60, 45–53. [Google Scholar] [CrossRef]
  4. Langley, P. In the eye of the perfect storm: The final salary pensions crisis and the financialisation of Anglo-American capitalism. New Polit. Econ. 2004, 9, 539–558. [Google Scholar] [CrossRef]
  5. Mazzocchi, M.; Montini, A. Earthquake effects on tourism in central Italy. Ann. Tourism Res. 2001, 28, 1031–1046. [Google Scholar] [CrossRef] [Green Version]
  6. Robinson, L.; Jim, K.J. Post-disaster community tourism recovery: The tsunami and Arugam Bay, Sri Lanka. Disasters 2010, 32, 631–645. [Google Scholar] [CrossRef] [PubMed]
  7. Song, H.; Lin, S.S. Impacts of the Financial and Economic Crisis on Tourism in Asia. J. Travel Res. 2010, 49, 16–30. [Google Scholar] [CrossRef]
  8. Yan, B.J.; Zhang, J.; Zhang, H.L. Investigating the motivation experience relationship in a dark tourism space: A case study of the Beichuan earthquake relics, China. Tourism Manag. 2016, 53, 108–121. [Google Scholar] [CrossRef]
  9. Matthew, O.L. Analysis of the legacy of conflict among international tourists in Vietnam. Int. J. Tourism Anthropol. 2017, 6, 1–17. [Google Scholar]
  10. Desbiolles, F.H.; Canosa, A. Not victims nor zoo exhibits: The film My Long Neck and listening to the ‘other’. Int. J. Tourism Anthropol. 2018, 6, 237–254. [Google Scholar] [CrossRef]
  11. Bargawi, H.; Cozzi, G. Engendering economic recovery: Modeling alternatives to austerity in Europe. Fem. Econ. 2017, 23, 225–249. [Google Scholar] [CrossRef]
  12. Oliva, S.; Lazzeretti, L. Measuring the economic resilience of natural disasters: An analysis of major earthquakes in Japan. City Cult. Soc. 2018, 15, 53–59. [Google Scholar] [CrossRef]
  13. Durbarry, R. Tourism and Economic Growth: The Case of Mauritius. Tourism Econ. 2004, 10, 389–401. [Google Scholar] [CrossRef]
  14. Jorge, V.P.R.; Francisco, L.R.; María, S.G. Testing dependence between GDP and tourism’s growth rates. Tourism Manag. 2015, 48, 268–282. [Google Scholar]
  15. Syed, S.J.H.; Shahbaz, M.; Ferrer, R. Tourism-led growth hypothesis in the top ten tourist destinations: New evidence using the quantile-on-quantile approach. Tourism Manag. 2017, 60, 223–232. [Google Scholar] [Green Version]
  16. Tang, C.H.; Jang, S.S. The tourism-economy causality in the United States: A sub-industry level examination. Tourism Manag. 2009, 30, 553–558. [Google Scholar] [CrossRef]
  17. Beirman, D. Marketing of tourism destinations during a prolonged crisis: Israel and the Middle East. J. Vacat. Mark. 2002, 8, 167–176. [Google Scholar] [CrossRef]
  18. Brent, W.R. Chaos, crises and disasters: A strategic approach to crisis management in the tourism industry. Tourism Manag. 2009, 25, 669–683. [Google Scholar]
  19. Cellini, R.; Cuccia, T. The economic resilience of tourism industry in Italy: What the ‘great recession’ data show. Tourism Manag. Perspect. 2015, 32, 346–356. [Google Scholar] [CrossRef]
  20. Croes, R. A paradigm shift to a new strategy for small island economies: Embracing demand side economics for value enhancement and long term economic stability. Tourism Manag. 2006, 27, 453–465. [Google Scholar] [CrossRef]
  21. Dogru, T.; Bulut, U. Is tourism an engine for economic recovery? Theory and empirical evidence. Tourism Manag. 2018, 67, 425–434. [Google Scholar] [CrossRef]
  22. Holzner, M. Tourism and economic development: The beach disease? Tourism Manag. 2011, 32, 922–933. [Google Scholar] [CrossRef]
  23. Gurtner, Y. Returning to paradise: Investigating issues of tourism crisis and disaster recovery on the island of Bali. J. Hosp. Tourism Manag. 2016, 28, 11–19. [Google Scholar] [CrossRef]
  24. Patricia, A.S. Memory texts and Nazi concentration camps: A comparative analysis. Int. J. Tourism Anthropol. 2018, 6, 154–171. [Google Scholar]
  25. Wu, T.P.; Wu, H.C.; Liu, S.B.; Hsueh, S.J. The relationship between international tourism activities and economic growth: Evidence from China’s economy. Tourism Plan. Dev. 2018, 15, 365–381. [Google Scholar] [CrossRef]
  26. Zuo, B.; Huang, S.S. Revisiting the Tourism-Led Economic Growth Hypothesis: The Case of China. J. Travel Res. 2018, 57, 151–163. [Google Scholar] [CrossRef]
  27. Chou, M.C. Does tourism development promote economic growth in transition countries? A panel data analysis. Econ. Model. 2013, 33, 226–232. [Google Scholar] [CrossRef] [Green Version]
  28. Aslan, A. Tourism development and economic growth in the Mediterranean countries: Evidence from panel Granger causality tests. Curr. Issues Tourism 2013, 17, 363–372. [Google Scholar] [CrossRef]
  29. Balaguer, J.; Cantavella-Jorda, M. Tourism as a long run economic growth factor: The Spanish case. Appl. Econ. 2002, 34, 877–884. [Google Scholar] [CrossRef]
  30. Brida, J.G.; Risso, W.A. Tourism as a factor of long-run economic growth: An empirical analysis for Chile. Eur. J. Tourism Res. 2009, 2, 178–185. [Google Scholar]
  31. Cortes, J.I.; Pulina, M. Inbound tourism and long-run economic growth. Curr. Issues Tourism 2010, 13, 61–74. [Google Scholar] [CrossRef]
  32. Dritsakis, N. Tourism as a long run economic growth factor: An empirical investigation for Greece using causality analysis. Tourism Econ. 2004, 10, 305–316. [Google Scholar] [CrossRef]
  33. Husein, J.; Kara, S.M. Research note: Re-examining the tourism-led growth hypothesis for Turkey. Tourism Econ. 2011, 17, 917–924. [Google Scholar] [CrossRef]
  34. Bojanic, D.C.; M, L. A Comparison of the Moderating Effect of Tourism Reliance on the Economic Development for Islands and Other Countries. Tourism Manag. 2016, 53, 207–214. [Google Scholar] [CrossRef]
  35. Oh, C.O. The contribution of tourism development to economic growth in the Korean economy. Tourism Manag. 2005, 26, 39–44. [Google Scholar] [CrossRef]
  36. Payne, J.E.; Mervar, A. The tourism growth nexus in Croatia. Tourism Econ. 2010, 16, 1089–1094. [Google Scholar] [CrossRef]
  37. Lin, V.S.S.; Yang, Y.; Li, G. Where can tourism-led growth and economy-driven tourism growth occur? J. Travel Res. 2018. [Google Scholar] [CrossRef]
  38. Lee, C.C.; Chang, C.P. Tourism development and economic growth: Closer look to panels. Tourism Manag. 2008, 29, 180–192. [Google Scholar] [CrossRef]
  39. Al-mulali, U.; Fereidouni, H.G.; Lee, J.M.Y.; Mohammed, A.H. Estimating the tourism-led growth hypothesis: A case study of the Middle East countries. Anatolia Int. J. Tourism Hosp. Res. 2014, 25, 290–298. [Google Scholar] [CrossRef]
  40. Lorde, T.; Francis, B.; Drakes, L. Tourism services exports and economic growth in Barbados. Int. Trade J. 2011, 25, 205–232. [Google Scholar] [CrossRef]
  41. Ridderstaat, J.; Croes, R.; Nijkamp, P. Tourism and Long-Run Economic Growth in Aruba. Int. J. Tourism Res. 2014, 16, 472–487. [Google Scholar] [CrossRef]
  42. Tugcu, C.T. Tourism and economic growth nexus revisited: A panel causality analysis for the case of the Mediterranean Region. Tourism Manag. 2014, 42, 207–212. [Google Scholar] [CrossRef]
  43. Brau, R.; Lanza, A.; Pigliaru, F. How Fast Are Small Tourist Countries Growing? Evidence from the Data for 1980–2003. Tourism Econ. 2007, 13, 603–614. [Google Scholar] [CrossRef]
  44. Tang, C.; Tan, E. How stable is the tourism-led growth hypothesis in Malaysia? Evidence from disaggregated tourism markets. Tourism Manag. 2013, 37, 52–57. [Google Scholar] [CrossRef]
  45. Chiu, Y.B.; Yeh, L.T. The threshold effects of the tourism-led growth hypothesis: Evidence from a cross-sectional model. J. Travel Res. 2017, 56, 625–637. [Google Scholar] [CrossRef]
  46. Katircioglu, S.T. Revisiting the tourism-led growth hypothesis for Turkey using the bounds test and Johansen approach for cointegration. Tourism Manag. 2009, 30, 17–20. [Google Scholar] [CrossRef]
  47. Javier, C.P.; Antoni, R.F.; Rossello, J. Tourism and long-term growth. A Spanish perspective. Ann. Tourism Res. 2007, 34, 709–726. [Google Scholar]
  48. Corden, W.; Neary, J. Booming sector and deindustrialisation in a small open economy. Econ. J. 1982, 92, 825–848. [Google Scholar] [CrossRef]
  49. Chao, C.C.; Hazari, B.R.; Laffargue, J.P.; Sgro, P.M.; Yu, E.S.H. Tourism, Dutch disease and welfare in an open dynamic economy. Jpn. Econ. Rev. 2006, 57, 501–515. [Google Scholar] [CrossRef]
  50. Copeland, B. Tourism, welfare, and de-industrialization in a small open economy. Economica. 1991, 58, 515–529. [Google Scholar] [CrossRef]
  51. Nowak, J.J.; Sahli, M.; Cortes-Jimenez, I. Tourism, capital good imports and economic growth: Theory and evidence for Spain. Tourism Econ. 2007, 13, 515–536. [Google Scholar] [CrossRef]
  52. Sheng, L.; Tsui, Y. A General Equilibrium Approach to Tourism and Welfare: The Case of Macao. Habitat Int. 2009, 33, 419–424. [Google Scholar] [CrossRef]
  53. Glauco, D.V.; Khine, S.K. Tourism Specialization, Absorptive Capacity, and Economic Growth. J. Travel Res. 2017, 56, 423–435. [Google Scholar]
  54. Gursoy, D.; Rutherford, D.G.R. Host attitudes toward tourism: An improved structural model. Ann. Tourism Res. 2004, 31, 495–516. [Google Scholar] [CrossRef]
  55. Sequeira, T.N.; Macas, N.P. Does Tourism Influence Economic Growth? A Dynamic Panel Data Approach. Appl. Econ. 2008, 40, 2431–2441. [Google Scholar] [CrossRef]
  56. Jose, F.P.R.; Ana, B.R.R.; Rubia, A. Is the tourism-led growth hypothesis valid after the global economic and financial crisis? The case of Spain 1957–2014. Tourism Manag. 2017, 61, 96–109. [Google Scholar]
  57. Julio, A.A.R. Evaluating the dynamics and impact of terrorist attacks on tourism and economic growth for Turkey. J. Policy Res. Tourism Leisure Events 2017, 9, 56–81. [Google Scholar]
  58. Qazi, M.A.H.; Rana, E.A.K. Tourism-Led Growth Hypothesis: A Case Study of Pakistan. Asia Pac. J. Tourism Res. 2013, 18, 303–313. [Google Scholar]
  59. Tang, C.F.; Abosedra, S. Small sample evidence on the tourism-led growth hypothesis in Lebanon. Curr. Issues Tourism 2014, 17, 234–246. [Google Scholar] [CrossRef]
  60. Arslanturk, Y.; Balcilar, M.; Ozdemir, Z.A. Time-Varying Linkages between Tourism Receipts and Economic Growth in a Small Open Economy. Econ. Model. 2011, 28, 664–671. [Google Scholar] [CrossRef]
  61. Suhel, S.; Bashir, A. The role of tourism toward economic growth in the local economy. Econ. J. Emerg. Mark. 2018, 10, 32–39. [Google Scholar] [CrossRef] [Green Version]
  62. Tang, C.F.; Tan, E.C. Does tourism effectively stimulate Malaysia’s economic growth? Tourism Manag. 2015, 46, 158–163. [Google Scholar] [CrossRef]
  63. Chen, C.F.; Song, Z.C.W. Tourism expansion, tourism uncertainty and economic growth: New evidence from Taiwan and Korea. Tourism Manag. 2009, 30, 812–818. [Google Scholar] [CrossRef]
  64. Kibara, O.N.; Odhiambo, N.M.; Njuguna, J.M. Tourism and economic growth in Kenya: An empirical investigation. Inter.Bus. Econ. Res. J. 2012, 11, 517–528. [Google Scholar] [CrossRef]
  65. Oludele, O.A.; Lydia, A.B. International tourism and economic development in South Africa: A Granger causality test. Int. J. Tourism Res. 2010, 12, 149–163. [Google Scholar]
  66. Tang, C.F.; Tan, E.C. Tourism-Led growth hypothesis: A new global evidence. Cornell Hosp. Q. 2017, 59, 304–311. [Google Scholar] [CrossRef]
  67. Ozturk, I.; Acaravci, A. On the Causality between Tourism Growth and Economic Growth Empirical Evidence from Turkey. Transylv. Revi. Adm. Sci. 2009, 25, 73–81. [Google Scholar]
  68. Alhowaish, A. Is Tourism Development a Sustainable Economic Growth Strategy in the Long Run? Evidence from GCC Countries. Sustainability 2016, 8, 605. [Google Scholar] [CrossRef]
  69. Salifou, C.K.; Haq, I.U. Tourism, globalization and economic growth: A panel cointegration analysis for selected West African States. Curr. Issues Tourism 2017, 20, 664–667. [Google Scholar] [CrossRef]
  70. Wang, Y.S. Threshold effects on development of tourism and economic growth. Tourism Econ. 2012, 18, 1135–1141. [Google Scholar] [CrossRef]
  71. Brida, J.G.; Lanzilotta, B.; Pereyra, J.S.; Pizzolon, F. A Nonlinear Approach to the Tourism-Led Growth Hypothesis: The Case of the MERCOSUR. Curr. Issues Tourism 2015, 18, 647–666. [Google Scholar] [CrossRef]
  72. Chang, C.; Khamkaev, T.; McAleer, M. IV Estimation of a Panel Threshold Model of Tourism Specialization and Economic Development. Tourism Econ. 2012, 18, 5–41. [Google Scholar] [CrossRef] [Green Version]
  73. Po, W.; Huang, B. Tourism development and economic growth—A nonlinear approach. Physica A 2008, 387, 5535–5542. [Google Scholar] [CrossRef]
  74. Christaller, W. Some considerations of tourism location in Europe: The peripheral regions-underdeveloped countries-recreation areas. Reg. Sci. Assoc. Pap. 1963, 12, 95–105. [Google Scholar] [CrossRef]
  75. Gilbert, E.W. The growth of inland and seaside health resorts in England. Scott. Geogr. Mag. 1939, 55, 16–35. [Google Scholar]
  76. Plog, S.C. Why destination areas rise and fall in popularity. Cornell Hotel Restaur. Q. 1974, 14, 55–58. [Google Scholar] [CrossRef]
  77. Butler, R.W. The concept of a tourist area cycle of evolution: Implications for management of resources. Can. Geogr. 1980, 24, 5–12. [Google Scholar] [CrossRef]
  78. Butler, R. The resort cycle two decades on. In Reflections on Experience; Faulkner, B., Laws, E., Morcado, G., Eds.; Cassell: London, UK, 2010; pp. 284–298. [Google Scholar]
  79. Butler, R. The Tourism Area Life Cycle Model. Applications and Modifications; Channel View Publications: Clevedon, NY, USA, 2006; Volume 1. [Google Scholar]
  80. Butler, R. The Tourism Area Life Cycle Model. Conceptual and Theoretical Issues; Channel View Publications: Clevedon, UK, 2006; Volume 2. [Google Scholar]
  81. Butler, R. Tourism in the future: Cycles, waves, or wheels? Futures J. Policy Plan. Futures Stud. 2009, 41, 346–352. [Google Scholar] [CrossRef]
  82. Lundgren, J.O. An empirical interpretation of the TALC: Tourist Product Life Cycles in the Eastern Townships of Quebec. In The Tourism Area Life Cycle, Applications and Modifications; Butler, R.W., Ed.; Channel View Publications: Clevedon, NY, USA; Buffalo, NY, USA; Toronto, ON, Canada, 2006; Volume 1, pp. 91–106. [Google Scholar]
  83. Kruczek, Z.; Kruczek, M.; Szromek, A.R. Possibilities of Using the Tourism Area Life Cycle Model to Understand and Provide Sustainable Solution for Tourism Development in the Antarctic Region. Sustainability 2018, 10, 89. [Google Scholar] [CrossRef]
  84. Kubickova, M.; Li, H. Tourism Competitiveness, Government and Tourism Area Life Cycle (TALC) Model: The Evaluation of Costa Rica, Guatemala and Honduras. Int. J. Tourism Res. 2017, 19, 223–234. [Google Scholar] [CrossRef]
  85. Tang, C.C.; Zhong, L.S.; Ng, P. Factors that Influence the Tourism Industry’s Carbon Emissions: A Tourism Area Life Cycle Model Perspective. Energy Policy 2017, 109, 704–718. [Google Scholar] [CrossRef]
  86. Zhong, L.S.; Deng, J.Y.; Xiang, B.H. Tourism development and the tourism area life-cycle model: A case study of Zhangjiajie National Forest Park, China. Tourism Manag. 2008, 29, 841–856. [Google Scholar] [CrossRef]
  87. Priestley, G.; Mundet, L. The post-stagnation phase of the resort life-cycle. Ann. Tourism Res. 1998, 25, 85–111. [Google Scholar] [CrossRef]
  88. Cooper, C. The anatomy of rejuvenation stage of the TALC. In The Tourism Area Life Cycle. Conceptual and Theoretical Issues; Butler, R.W., Ed.; Channel View Publications: Clevedon, UK, 2006; Volume 2, pp. 183–200. [Google Scholar]
  89. Baum, T. Taking the exit route: Extending the tourism area life cycle model. Curr. Issues Tourism 1998, 1, 167–175. [Google Scholar] [CrossRef]
  90. Cole, S. Synergy and congestion in the tourist destination life cycle. Tourism Manag. 2012, 33, 1128–1140. [Google Scholar] [CrossRef]
  91. Haywood, K.M. Can the Tourist-Area Life Cycle be Made Operational? Tourism Manag. 1986, 7, 154–167. [Google Scholar] [CrossRef]
  92. Kermath, B.M.; Thomas, R.N. Spatial dynamics of resorts: Sosua, Dominican Republic. Ann. Tourism Res. 1992, 19, 172–190. [Google Scholar] [CrossRef]
  93. Keller, P.C. Stages of peripheral tourism development—Canada’s Northwest Territories. Tourism Manag. 1987, 8, 20–32. [Google Scholar] [CrossRef]
  94. Lee, Y.H.; Weaver, D. The tourism area life cycle in Kim Yujeong Literary Village, Korea. Asia Pac. J. Tourism Res. 2014, 19, 181–198. [Google Scholar] [CrossRef]
  95. Hansen, B.E. Threshold effects in non-dynamic panels: Estimation, testing, and inference. J. Econ. 1999, 93, 345–368. [Google Scholar] [CrossRef] [Green Version]
  96. Hajamini, M.; Mohammad, A.F. Economic growth and government size in developed European countries: A panel threshold approach. Econ. Anal. Policy 2018, 58, 1–13. [Google Scholar] [CrossRef]
  97. Liu, J.J.; Peter, N.; Lin, D.R. Urban-rural imbalance and tourism-led growth in China. Ann. Tourism Res. 2017, 64, 24–36. [Google Scholar] [CrossRef]
  98. Zhang, J.X.; Liu, Q.L.; Wang, C.; Li, H. Spatial–Temporal modeling for regional economic development: A quantitative analysis with panel data from Western China. Sustainability 2017, 9, 1955. [Google Scholar] [CrossRef]
  99. Chakrabarti, S. Can highway development promote employment growth in India? Transp. Policy 2018, 69, 1–9. [Google Scholar] [CrossRef]
  100. Hu, M.J.; Zhou, L.X.; Li, Z.J. The Spatial Pattern and Its Influencing Factors of County Consumption Level in Jiangsu Province. Econ. Geogr. 2014, 34, 48–53, 74. (In Chinese) [Google Scholar]
  101. Chang, T.Y.; Chiang, G.N. Regime-switching effects of debt on real GDP per capital the case of Latin American and Caribbean countries. Econ. Model. 2011, 28, 2404–2408. [Google Scholar] [CrossRef]
  102. Pesaran, M.H. A simple panel unit root test in the presence of cross section dependence. J. Appl. Econom. 2007, 22, 265–312. [Google Scholar] [CrossRef]
  103. Che, C.M. Panel threshold analysis of Taiwan’s outbound visitors. Econ. Model. 2013, 33, 787–793. [Google Scholar] [CrossRef]
  104. Foster, N. Exports, growth and threshold effects in Africa. J. Dev. Stud. 2016, 42, 1056–1074. [Google Scholar] [CrossRef]
  105. Pratt, S. The economic impact of tourism in SIDS. Ann. Tourism Res. 2015, 52, 148–160. [Google Scholar] [CrossRef]
  106. Shi, R.Y.; Ji, S.B.; Wang, X.Z. Impacts of star-rated hotel expansion on inbound tourism development: Evidence from China. Appl. Econ. 2016, 48, 3033–3048. [Google Scholar] [CrossRef]
  107. Miao, C.; Ding, M.T. Analysis of influence of natural disaster on the economy and prediction of recovery time based on grey forecasting–difference comparison model: A case study in the upper Min River. Nat. Hazards 2017, 85, 1135–1150. [Google Scholar] [CrossRef]
  108. Garay, L.; Cànoves, G. Life cycles, stages and tourism history: The Catalonia (Spain) experience. Ann. Tourism Res. 2011, 38, 651–671. [Google Scholar] [CrossRef]
  109. Ma, M.; Hassink, R. An evolutionary perspective on tourism area development. Ann. Tourism Res. 2013, 41, 89–109. [Google Scholar] [CrossRef]
  110. Shen, Y.; Li, S.M.; Jiang, K.; Hu, P. Fortune or misfortune: Threats and opportunities for the development of the tourism industry in the heavily attacked area in ‘5.12’ earthquake of China. Int. J. Tourism Anthropol. 2012, 2, 16–33. [Google Scholar] [CrossRef]
  111. Skipper, J.; Davidson, S.R. The big house as home: Roots tourism and slavery in the USA. Int. J. Tourism Anthropol. 2018, 6, 390–410. [Google Scholar] [CrossRef]
Figure 1. The location of the 36 Wenchuan earthquake-stricken counties.
Sustainability 11 00371 g001
Figure 2. The dynamic evolution of tourism specialization between the years of 2008 and 2016.
Sustainability 11 00371 g002
Table 1. The change in tourist arrival as a percentage of local population (TA) and ratio of tourism receipt to GDP (TR) after the Wenchuan Earthquake (2008–2016).
CountyTA
200820092010201120122013201420152016
An1.832.514.075.085.598.239.5112.9216.90
Baoxing8.567.5614.2417.2021.307.6416.6820.6926.64
Beichuan0.841.032.207.279.1316.9316.6718.8722.66
Cangxi1.292.321.635.203.265.756.726.448.52
Chaotian2.093.073.939.868.8811.7814.9714.7417.69
Chongzhou3.323.754.615.577.699.7912.0516.6514.76
Dayi8.059.419.7310.8519.0223.2628.3330.8033.77
Dujiangyan7.4515.7218.7123.9728.2028.2830.0131.5532.74
Fucheng 1.522.082.533.023.363.464.185.045.99
Guanghan2.321.331.494.367.929.2510.0710.9813.29
Heishui0.161.593.1110.028.809.9316.4019.0726.42
Jiange0.290.761.733.673.947.466.3211.2113.72
Jiangyou1.381.522.232.563.044.084.876.327.64
Jingyang1.141.522.002.442.872.793.815.095.70
Jiuzhaigou10.5923.8628.7848.5867.6158.5871.2978.1488.67
Langzhong1.852.453.263.554.457.088.559.9412.10
Li1.853.598.1418.4932.6140.1569.5877.1997.34
Lizhou3.434.945.7710.4014.1016.0417.1718.8223.32
Luojiang3.083.713.874.465.248.309.5912.6414.41
Lushan4.294.395.836.507.454.015.8926.5114.69
Mao0.591.282.927.9910.2712.0215.1316.7373.04
Mianzhu1.311.431.341.982.563.675.837.058.80
Nanjiang0.981.282.132.503.054.776.548.6411.37
Pingwu0.550.601.905.057.059.1810.1413.2316.44
Qingchuan1.374.132.434.868.8412.3314.6619.3723.68
Santai1.481.381.514.235.277.958.989.534.42
Shifang0.611.491.661.932.496.398.398.8510.75
Shimian3.093.923.705.776.858.7315.8329.7635.96
Songpa4.7515.2324.2632.8043.5543.9460.3867.3375.97
Wangcang1.081.201.551.642.914.374.625.075.97
Wenchuan1.078.3414.0236.2556.8459.5965.5875.1080.84
Xiaojin0.481.402.708.047.418.308.889.5611.70
Yanting0.580.770.831.401.712.282.222.843.45
Youxian1.071.281.441.663.325.586.517.219.78
Yuanba1.476.054.489.5813.9517.0921.2624.5528.34
Zitong1.423.454.715.216.4311.7011.6512.9516.06
CountyTR
200820092010201120122013201420152016
An0.070.090.120.060.080.120.160.190.41
Baoxing0.220.180.280.300.340.150.250.300.45
Beichuan0.140.050.090.250.390.660.560.810.93
Cangxi0.090.100.080.180.140.170.180.170.23
Chaotian0.220.230.220.330.290.390.490.580.75
Chongzhou0.040.040.040.040.050.060.070.130.12
Dayi0.090.110.100.100.140.160.170.180.18
Dujiangyan0.230.360.350.360.370.360.360.410.48
Fucheng 0.060.060.060.060.070.090.100.110.12
Guanghan0.050.000.010.070.090.120.120.130.13
Heishui0.020.090.170.530.330.310.480.540.67
Jiange0.040.040.120.160.230.290.470.580.73
Jiangyou0.040.050.060.070.090.130.160.210.23
Jingyang0.010.010.010.030.030.040.050.060.07
Jiuzhaigou0.871.542.262.613.253.073.363.503.45
Langzhong0.130.180.210.190.200.280.320.360.41
Li0.170.150.290.520.820.771.051.201.40
Lizhou0.110.110.150.130.130.150.190.240.28
Luojiang0.060.060.070.080.080.100.130.170.19
Lushan0.140.160.180.180.180.090.150.800.37
Mao0.090.080.170.260.320.300.340.471.14
Mianzhu0.030.030.050.050.070.080.100.120.14
Nanjiang0.090.110.140.160.180.240.300.410.52
Pingwu0.070.030.100.230.290.380.450.540.66
Qingchuan0.140.230.150.230.320.430.500.620.69
Santai0.050.060.070.160.200.300.380.420.20
Shifang0.030.030.040.040.050.070.090.110.12
Shimian0.060.070.050.090.100.130.210.320.42
Songpa0.741.562.162.352.962.463.173.153.27
Wangcang0.080.100.060.070.090.120.150.160.19
Wenchuan0.040.090.180.430.540.540.530.640.66
Xiaojin0.060.150.270.750.590.560.130.540.51
Yanting0.010.010.020.020.030.040.020.050.08
Youxian0.060.070.070.090.100.130.170.190.22
Yuanba0.030.210.200.250.310.390.500.600.67
Zitong0.110.130.160.170.220.310.390.450.53
Note: TA = tourist arrival as a percentage of local population; TR = Ratio of tourism receipt to GDP.
Table 2. Data and sources.
VariableDescriptionExplanationLiterature Source
LGDPThe logarithm of the real GDP per capitaEconomic growthSyed et al. [15], Zuo and Huang [26]
TATourist arrival as a percentage of the local populationReflecting the size effect or level of tourism specializationZuo and Huang [26], Jose et al. [56], Tang et al. [66], Liu et al. [97]
TRTourism revenue as a share of the real GDPReflecting the structure effect or quality of tourism specialization
HDThe ratio of the length of the highway roads to the county areaTransportation accessibilityTang et al. [66], Zhang et al. [98]; Chakrabarti [99],
INVThe ratio of the total investment in fixed assets to GDPCapital investmentZuo and Huang [26], Chang et al. [72]
ISThe proportion of employees in a tertiary industry to total employeesIndustrial structureZuo and Huang [26], Hu et al. [100]
Table 3. Results of Pesaran’s cross-sectional dependence (CD)_test and Pesaran’s panel unit root test.
Pesaran’s Cross Sectional Dependence Test
CD statistics28.576 *** (0.000)
Pesaran’s CADF test
LGDP−2.272 ***
(0.004)
INV–2.239 ***
(0.007)
TA−2.079 **
(0.040)
IS–2.540 ***
(0.000)
HD−2.710 ***
(0.000)
Note: p values are reported in parentheses. * p < 0.1, ** p < 0.05, *** p < 0.01.
Table 4. Threshold effect test.
Threshold VariableNumber RSSMSEFPThreshold Critical
10%5%1%
TASingle10.1620.033107.07 ***0.00031.56734.89341.130
Double7.9700.02586.64 ***0.00027.69731.77039.003
Triple 7.3310.02327.460.81765.81175.02584.374
TRSingle11.5470.03756.44 **0.01333.28539.10056.939
Double10.3120.03337.73 ***0.00723.18127.12935.381
Triple10.1000.0326.630.91336.80741.16262.276
ISSingle12.9010.04117.47 *0.06015.03517.73723.329
Double12.3700.04013.52 *0.09313.31016.16321.344
Triple12.1670.0395.2500.65730.53436.75351.716
Note: p values are reported in parentheses. * p < 0.1, ** p < 0.05, *** p < 0.01.
Table 5. The effect of tourism on economic growth in the linear model and in the threshold model.
VariablesFixed EffectsThreshold Effects
Model (1)Model (2)Model (3)Model (4)
TA0.015 ***
(0.000)
HD0.907 ***
(0.000)
0.581 ***
(0.000)
0.712 ***
(0.000)
0.827 ***
(0.000)
INV0.019 **
(0.03)
0.018 ***
(0.007)
0.020 **
(0.011)
0.015 *
(0.073)
IS0.711 ***
(0.000)
0.556 ***
(0.001)
0.628 **
(0.001)
1.378 ***
(0.000)
Y2008−0.327 ***
(0.000)
−0.223 ***
(0.000)
-0.270 ***
(0.000)
-0.321 ***
(0.000)
TA (TA ≤ 17.09) 0.053 ***
(0.000)
TA (17.09 < TA≤40.15) 0.033 ***
(0.000)
TA (TA > 40.15) 0.017 ***
(0.000)
TA (TR ≤ 0.52) 0.035 ***
(0.000)
TA (0.52 < TR ≤ 0.93) 0.022 ***
(0.000)
TA (TR > 0.93) 0.011 ***
(0.000)
TA (IS ≤ 0.20) 0.022 ***
(0.000)
TA (0.20 < IS ≤ 0.34) 0.014 ***
(0.000)
TA (IS > 0.34) −0.139 ***
(0.000)
Constant8.535 ***
(0.000)
8.617 ***
(0.000)
8.595 ***
(0.000)
8.480 ***
(0.000)
R20.7370.8460.8000.753
F-test38.23 ***
64.810 ***
44.62 ***
39.780 ***
Hausman test19.70 ***
Note: p values are reported in parentheses. * p < 0.1, ** p < 0.05, *** p < 0.01.
Table 6. The level of threshold variables in each regime.
CountiesTARegimeTRRegimeISRegime
An7.4010.1410.383
Baoxing15.6110.2810.151
Beichuan10.6210.4310.191
Cangxi4.5710.1510.141
Chaotian9.6710.3910.151
Chongzhou8.6910.0710.201
Dayi19.2520.1410.212
Dujiangyan24.0720.3710.302
Fucheng3.4610.0810.342
Guanghan6.7810.0810.161
Heishui10.6110.3510.262
Jiange5.4610.310.141
Jiangyou3.7410.1110.232
Jingyang3.0410.0410.242
Jiuzhaigou52.9032.6630.312
Langzhong5.9110.2510.242
Li 38.7730.7120.192
Lizhou12.6710.1710.151
Luojiang7.2610.110.171
Lushan8.8410.2510.181
Mao15.5510.3510.222
Mianzhu3.7710.0710.201
Nanjiang4.5810.2410.191
Pingwu7.1310.3110.121
Qingchuan10.1910.3710.141
Santai4.9710.210.131
Shifang4.7310.0710.161
Shimian12.6210.1610.212
Songpa40.9132.4230.222
Wangcang3.1610.1110.181
Wenchuan44.1830.410.242
Xiaojin6.5010.410.191
Yanting1.7910.0310.212
Youxian4.2110.1210.222
Yuanba14.0910.3510.201
Zitong8.1810.2810.191
Table 7. The distribution of the disaster-stricken counties according to each type.
StyleNumberCounties
Exploration-stage type2Jingyang, Yanting
Involvement-stage type15An, Cangxi, Chongzhou, Fucheng, Guanghang, Jiangyou, Langzhong, Lushan, Luojiang, Mianzhu, Santai, Shifang, Wangcang, Xiaojin, Youxian
Transitional-stage type4Jiange, Nanjiang, Pingwu, Zitong
Development-stage type10Tourism expansion: Baoxing, Beichuan, Dayi, Dujiangyan, Lizhou, Shimian
Tourism quality: Chaotian, Heishui, Qingchuan, Yuanba,
Consolidation-stage type4Jiuzhaigou, Li, Mao, Songpan
Stagnation-stage type1Wenchuan

