Article

Research on the Spatial Pattern Characteristics of the Taihu Lake “Dock Village” Based on Microclimate: A Case Study of Tangli Village

Department of Landscape Architecture, Nanjing Forestry University, Nanjing 210037, China
*
Author to whom correspondence should be addressed.
Sustainability 2019, 11(2), 368; https://doi.org/10.3390/su11020368
Submission received: 1 December 2018 / Revised: 4 January 2019 / Accepted: 7 January 2019 / Published: 12 January 2019

Abstract

:
“Dock Village” terrain is, as its name implies, a region that contains settlements reminiscent of docks, in terms of their elongated shape, their outward upward tilt, and their location in the center of low, wide valleys. Dock village terrain features deep, fertile soil suitable for farming. Taihu Lake contains a number of classic examples of dock villages. Dock villages are relatively independent and hidden, characteristics that not only play a role in security and defense, but also, more importantly, are associated with enhanced climate adaptability, a relative lack of cold weather, and equable levels of heat and humidity. The dock village reflects the wisdom and distillation of traditional Chinese ecological practices and is highly valued as a research topic. Based on microclimate theory and ENVI-met software, four microclimate indices, namely, air temperature, wind speed, wind direction, and relative humidity, were simulated and analyzed in this study. The correlation between spatial characteristics and microclimate was studied from four perspectives: plane space, cross-section space, vertical section space, and linear development space. This research summarizes the historical context and evolution of the dock village spatial form in the construction of contemporary human settlements. It also provides scientific suggestions for the protection and sustainable development of ancient villages.

1. Introduction

The word “dock,” first recorded in “Fu Qian: Popular Literature” in the phrase “camp in the dock” refers to a location characterized by a high center and low outskirts. “Dock Village” refers to ancient villages with high terrain around them. The meaning of the term has gone through phases roughly consisting of “the mountain barrier represents a dock” to “the city with low terrain is a dock”, and finally “the settlement and village are called a dock”. This has occurred over thousands of years, reflecting the traditional “space concept” of the ancient village, from layout plan to material form [1]. This “space concept” contains the two aspects of natural and human space, mainly involving the basic climate, geographical resources, and natural environment, along with its particular form of human environmental factors [2]. This concept condenses traditional ancient wisdom for contemporary use and is of important research value. Thus far, the process of dock village development has involved the continuous interaction and mutual influence between natural space and human space.
Microclimate research, however, includes the investigation of climate conditions from the ground to the roofs of buildings, and from single buildings to the entire local area, thus providing an important method for revealing the spatial characteristics of dock villages [3]. Microclimate refers to the small-scale climate near the stratum atmosphere, which is mainly affected by human and biological activities, as well as the types of underlying surfaces [4]. The research methods used for microclimate include meteorological observation, remote sensing monitoring and computer numerical simulation [5]. Among them, meteorological observation selects a specific area as the research area, chooses representative points and lines within it, and obtains the temperature distribution using high temporal resolution [6,7,8]. Remote sensing monitoring is characterized by its macroscopicity and synchronicity. It is widely used in the study of heat island phenomena in many cities with inversion parameters of image brightness temperature, surface temperature or temperature [9,10,11,12,13,14]. The above two methods require considerable manpower, material resources, and capital investment. More importantly, field experiments are greatly disturbed by the outside world, and it is not easy to obtain a continuous distribution of meteorological grid data. Therefore, in the study of complex and changeable microclimate, numerical simulation has more advantages [15,16,17,18]. Among the numerous numerical simulation methods, ENVI-met is one of the most widely used types of microclimate simulation software in the field of meteorology and architectural planning, at home and abroad.
Due to the simple operation of the ENVI-met numerical simulation software, we only need to define boundary conditions and quantity matching. The model then conveniently outputs meteorological parameters, such as air temperature, humidity, wind speed, wind direction, and average radiation temperature, on an urban microclimate scale [19]. Therefore, internationally many scholars have studied the microclimate using ENVI-met. For example, outside of China, Pearlmutter et al. [20] examined the microclimate parameters and total energy balance of urban street canyons. Their results demonstrated that a cold island phenomenon exists in narrow street canyons on hot summer nights, whereas in winter, these street canyons can provide warmer conditions. Ali Toudert and Mayer [21] investigated Ghardaia, Algeria, and studied the effects of the aspect ratio and orientation of street canyons on the outdoor thermal environment. Their results showed that the thermal environment of street canyons with different orientations varies, with faster heat dissipation exhibited by canyons with north-south orientations. Ng et al. [22] simulated the effects of greening types, greening rates, building heights and other factors on the urban microclimate based on the architectural form of Hong Kong, Kowloon Peninsula, Mong Kok District. It was found that a 33% greening rate was the lower limit to reduce a thermal load grade. Salata et al. [23] simulated different microclimate variables and compared the results with the actual measured values to verify the reliability of ENVI-met software. Microclimate research using ENVI-met software in China has included, for example, the relationship between microclimate and regional spatial form [24,25,26], green space layout [27,28,29,30], landscape elements [31], architectural layout [32,33,34], plant species [35], and human comfort [36,37]. In spite of this diverse research, there is still a relative lack of information on the microclimates of traditional ancient villages.
There are a large number of Taihu Lake dock villages which are mainly concentrated on the East and West Mountain islands of the central district of Taihu Lake. Among them, Tangli Village is the most typical. Therefore, taking Tangli, an ancient village of Taihu Lake, as an example, this study analyzed a microclimate simulation in terms of four weather conditions: air temperature, wind speed, wind direction, and relative humidity. The relationship between the spatial characteristics of a Taihu Lake Dock Village and microclimate is discussed, from four perspectives: plane space, cross-section space, vertical section space, and linear development space. Based on our results, we summarize the strategy and direction of ancient village renewal, based on the “dock village spatial view” and provide scientific suggestions for the protection and sustainable development of ancient villages.

2. Material and Methods

2.1. Study Area

The ancient Tangli Village is located in the northwest of Xishan Island, Taihu Lake, which is part of the Wuzhong District, in Suzhou City, China (Figure 1). It covers an area of about 21.04 ha [38]. Tangli Village’s geographical coordinates are 31°06′46″–31°08′07″ north latitude, and 120°13′51″–12°15′27″ east longitude. The remaining side of the terrain is raised in a curve, the terrain in the middle section is the lowest, the north-south axis of the village along the valley is longer (about 2 km), the east-west axis is narrower (about 1.5 km), and the overall spatial layout is highly hidden.
After thousands of years of development, ancient Tangli Village has formed a unique plane spatial pattern. From an overall point of view, the village is surrounded by mountains on three sides, while the other side is raised in the shape of the bow of a ship. The middle terrain is the lowest, showing a spatial pattern of a wide middle and narrow ends. In terms of internal spatial structure, there is a river system in Tangli that runs through the entire village along the main road, dividing it into three sections. Each section has a narrow shape with two tips [39]. It has the patchy distribution characteristics of “small aggregation, large dispersion”. The red dots in Figure 2a represent the center and edge of Tangli village. The dotted line connecting these points shows the basic spatial shape of the village, which is the most typical representation of the Dock Village.
In the ancient village of Tangli, the surrounding mountains are small, their slopes are slightly steep, the soil is rich, and lush trees form a public forest in a semicircle around the village. The crowns of the mountains exhibit a slight gradient. Given the overall mountainous terrain, flat land is extremely scarce. Taking adequate light into consideration, a terrace was settled in the central part of the southern slope of the flat region. The slopes of the foothills and villages that are most appropriate for farmland are relatively gentle, and the soil is fertile. Given the close proximity to Taihu Lake, water is plentiful, and rice is the primary economic crop. Taking into consideration the protection of resources and adaptability to the natural environment, the ancient Tangli village ingeniously utilizes the elevation difference of terrain and varies, forming a cross-section spatial pattern conforming to the mountain-shaped mountain situation (Figure 2b), and a vertical-section spatial pattern of “mountain-forest-land-village-field-lake” with obvious characteristics (Figure 2c).

2.2. Data Source and Processing

2.2.1. Stereopair Data

GeoEye-1 high-resolution stereo satellite images with a panchromatic resolution of 0.41 m and a multispectral resolution of 1.65 m were obtained in July 2017. Using ArcGIS 10.0 software and based on the RGB (Red, Green, Blue) and HSV (Hue, Saturation, Value) color space transformation method, the original panchromatic and multispectral band images were fused using the “Composite bands” command in the Analyst tool (Figure 3). Then, the “Create Signature” command in the “Data Management” tool was applied to create the image feature file of the research area. Finally, the “Maximum likelihood classification” command in the “Spatial Analysis” tool was applied to extract the image of building height and the underlying cover type (Figure 3).

2.2.2. Building Height Measurement Data

The Vertex laser rangefinder was used to measure the height of 426 buildings in the study area, and these data were then used to verify the accuracy of the building height extraction from remote sensing images [40]. The buildings in the study area had fewer than three stories, and their heights did not exceed 12 m. Since the measurement accuracy of the Vertex laser rangefinder is 0.4 m, its measurements met the research requirements. Finally, the image format was transformed using Photoshop software, and a base map in BMP (bitmap) format was generated. This BMP base map could be recognized by ENVI-met software and became the plane map for the simulation model of the study area (Figure 3).

2.2.3. Meteorological Data

The Xishan Island Station in Wuzhong District of Suzhou City was selected as the background meteorological data for the Microclimate Simulation in the study area, and the observation data of the automatic station (point A in Figure 3b) in the study area on the same day were used as verification data for the accuracy of the microclimate simulation. Meteorological data mainly included air temperature, 2-min average wind speed, wind direction, relative humidity, and so on. Data quality control was carried out before application.

2.3. Research Methods

ENVI-met urban microclimate software is a 3-dimensional microclimate simulation program developed by Bruse and Fleer of the University of Bochum, Germany in 1998 [41]. This software is based on the theoretical knowledge of computational fluid dynamics (CFD), thermodynamics, and urban meteorology. The space levels range from 0.1–1.0 km. The vertical range is less than or equal to 200 m. Its maximum settings can simulate 4D interaction, with a spatial grid resolution of 0.5–10.0 m and a 10-s time scale simulation of solid surfaces, such as plants, in an urban environment [42].
According to the analysis of the current situation of the study area, the simulated area of 1.4 km × 2 km can cover the whole Tangli village and its surrounding environment. Based on the parameters of the software, 70 × 100 × 30 grids were set, with resolutions of Dx = 20 m, Dy = 20 m, and Dz = 1.4 m, respectively (Dx and Dy are the horizontal and vertical resolutions of x and y, respectively; Dz is the vertical resolution of z). ENVI-met software requires the height of a 3-dimensional model to be z ≥ 2zHmax, where Hmax is the height of the tallest building in the simulated area, meaning that the height of a building in the model area must not exceed 45 m. The tallest building in our study area was 12 m, which was within the numerical simulation height requirement.
According to the climatic characteristics of the study area, the diurnal variation of the autumn climate is very distinct. The high atmospheric pressure has a great influence on the valley wind. Moreover, considering the northwesterly wind coming from Taihu Lake in autumn, the humidity in the study area is affected. Therefore, autumn was chosen as the research period. The simulated meteorological data were measured on the same day over a 24-h period, from 00:00 a.m. to 24:00 p.m. on 25 November 2017. The simulated results were output every hour. The initial simulation parameters were set based on the meteorological data from Xishan Island, Wuzhong District, Suzhou City, The initial wind speed was 4 m/s, the wind direction was northwest, and the rough length was set to 0.01. The initial minimum temperature (10 °C) occurred at 8:00 a.m., the maximum temperature (16 °C) occurred at 3:00 p.m. and 4:00 p.m. (Figure 2), and the initial humidity was 35%. A simple forcing function was enabled to improve the simulation accuracy. Hourly temperature and humidity data were input to modify the operational parameters of the model. The forcing type was selected for the boundary model.

3. Results and Analysis

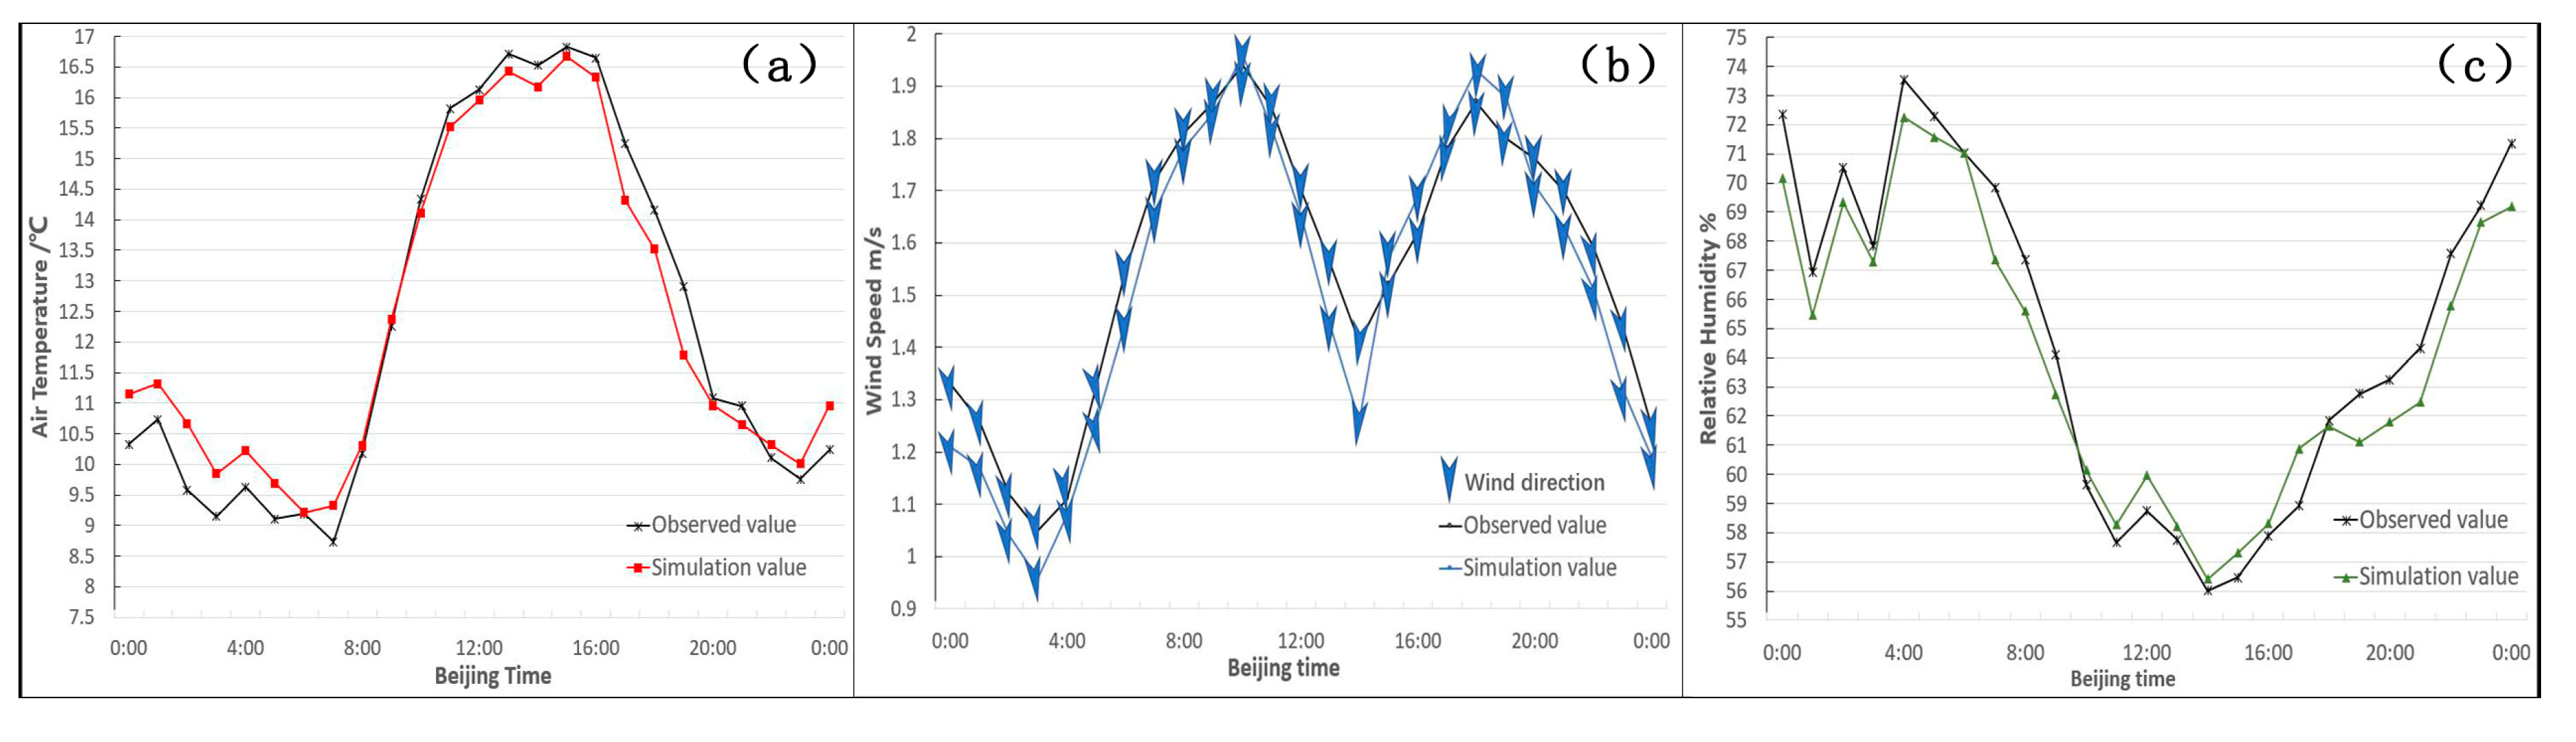
3.1. Simulation Accuracy Analysis

ENVI-met Microclimate Simulation simulated the temporal variation of temperature, wind speed, wind direction and relative humidity in the study area well. To verify the scientific soundness of the microclimate simulation, the hourly Microclimate Simulation data of the observation location in the study area were derived. Compared with the observed data, it can be seen that the variation curves were in good agreement (Figure 4). Therefore, the results of this simulation are scientifically sound.

3.2. Microclimate Simulation Results

The spatial distribution of air temperature, wind speed, wind direction, and relative humidity at 3:00 p.m. in the study area were derived according to the ENVI-met simulation results (Figure 5). From the point of view of the temperature distribution (Figure 5a), the temperature inside Tangli Village was 15.85~17.22 °C, which was generally higher than the air temperature around it (mainly 14.49~15.85 °C). The difference in temperature between the interior and exterior of the whole village was very obvious, reaching a maximum of 2.73 °C. Based on the distribution of wind speed (Figure 5b), the wind speed in Tangli Village generally ranged between 0.41 and 0.93 m/s. This was noticeably lower than the external wind speed, which mainly varied from 0.93 to 2.74 m/s. The maximum wind speed difference between the inside and the outside of the village was 2.69 m/s. In the interior of the village, some areas with wind speeds ranging from 1.70 m/s to 2.22 m/s were evenly distributed. Based on the wind direction distribution (Figure 5c), the northwesterly wind was the dominant wind direction but after entering the study area, the wind direction changed to a northeasterly wind in the northwest region. At the same time, there was an upward wind direction along the hillside east of the village center. Based on the distribution of relative humidity (Figure 5d), the relative humidity within Tangli Village ranged from 45.27%–60.12%, while the humidity outside the village varied from 60.12%–82.41%. This distinct difference was as high as 37.14%, with humidity levels outside the village almost double those within the village. In general, the commonality of the above four types of microclimate spatial distributions was that they are distributed in the shape of patches or strips but are centered on Tangli Village, which is consistent with the overall spatial pattern of Tangli Village. However, the detailed microclimate differences inside and outside Tangli Village, as well as the village interior, can be analyzed mainly from the spatial pattern. This is also the result of microclimatic differences caused by the unique characteristics of the spatial pattern of a “Dock Village”.

3.3. Summary and Discussion

Plane spatial pattern, cross-section spatial pattern, vertical-section spatial pattern and spatial distribution trend of linear development are the four spatial characteristics of the Taihu Lake dock village analyzed in this study. According to the results of simulation analysis of the four parameters of air temperature, wind speed, wind direction and relative humidity in the study area using ENVI-met software, it can be seen that the four spatial characteristics of Taihu Lake dock village have a great impact on the microclimatic environment. Furthermore, this microclimate change has promoted the spatial development of the dock village, which is consistent with the observations of many other studies [43,44].
The influence of the planar spatial pattern on microclimate is mainly reflected in heat conduction and wind speed and direction. On the one hand, the more compact the layout of the building is, the less heat is easily lost, and the higher the temperature is. On the other hand, the more compact the layout of the building, the lower the wind speed and the more disordered the wind direction. This observation is consistent with most previous studies on the effect of temperature [45,46,47]. The influence of cross-section and vertical-section spatial patterns on microclimate are mainly reflected in the formation of the Mountainvalley breeze and the resistance to the cold current of Taihu Lake, which are also the most characteristic spatial pattern characteristics of Taihu Lake dock villages.
Nevertheless, in addition to the usual observations, as a numerical simulation method, the contingency of environmental impacts, such as local wind field and anthropogenic heat release, cannot be considered in the ENVI-met Microclimate Simulation process, which results in various differences between simulated microclimate results and measured values. For example, according to the results shown in Figure 4a, the simulated temperature was lower than the observed value from 9:00 a.m. to 9:00 p.m. This is mainly due to the fact that the ENVI-met simulation does not include the thermal capacity of materials, as well as the inadequate calculation of thermal stability of building materials and environmental thermal radiation. This is consistent with observations from many other studies [21].
The main contribution of this paper is the discovery of the unique spatial pattern characteristics of these villages, and the analysis of the advantages of these characteristics from a microclimate perspective. Moreover, the biggest difference from other studies using microclimate simulation to analyze spatial pattern is the study of the combined behavior of air temperature, wind speed, wind direction and relative humidity, as well as the interaction between these microclimate parameters and the spatial pattern, rather than single factors and unilateral influences. This enabled us to explore the spatial pattern characteristics a Taihu Lake Dock Village in-depth and a detailed discussion follows.

3.3.1. Effects of Planar Spatial Patterns on Microclimate

Based on the “small aggregation, large evacuation” block distribution characteristics, shown in Figure 4c, there is a blue wind belt that runs through the village. That is to say, air ducts are formed between blocks to ensure the ventilation environment in the village. During the summer, a southeasterly wind enters from southeast of the village, drives the air flow along the long axis of the village, and then tilts the air flow upward when it meets the gentle slope to the north. Not only will internal heat be discharged, resisting the entry of external heat, but the internal air pressure will be reduced, providing villagers with a relatively cool and dry environment. However, if the northwesterly wind in autumn and winter, or the southeasterly wind in spring and summer, enters Tangli Village, the wind speed will be dispersed and reduced by this block pattern (Figure 6a), resulting in the wind speed inside the village being significantly lower than that outside. This reflects the fact that in the face of a strong wind, a dock village’s spatial layout acts as a windbreak.
The unique planar spatial pattern can limit diffusion of the heat radiation generated by the village, thus making the village feel warm in winter. As shown in Figure 6b, the heat flows among the small settlements in the village absorb each other. The heat flow from the village to the outside will be blocked by the mountains in the north, east and south, and would not be easily lost. This is also one of the main reasons why the temperature inside Tangli Village is higher than that outside.
In terms of humidity distribution, rapid vapor volatilization occurs due to relatively high temperatures and wind speed. Thus, the spatial distributions of humidity and wind speed are very similar. This is also an indirect result of the plane spatial pattern. In addition, because of the vegetation-covered mountains around the village, high temperatures will cause the plants to transpire, thus generating a large amount of water and increasing the air humidity. Therefore, the humidity around the village is higher than that inside the village.

3.3.2. Effects of Cross-Section Spatial Pattern on Microclimate

Because the external source of heat in villages mainly depends on solar radiation, the temperature is mainly affected by the illumination time. Therefore, the time points of sunrise and sunset, as well as the length of sunshine time, determine the time points of temperature change and the duration of high temperature in the village. According to the real-time data of the day, the sunrise time and sunset time of Tangli Village on 25 November 2017 were 06:37 and 16:54, respectively, totaling 10 h and 17 min. Therefore, as can be seen from Figure 3a, the temperature in Tangli Village began to rise after 7 o’clock in the morning and decrease after 5 o’clock in the afternoon.
From the perspective of the wind environment, Tangli Village is conducive to the formation of the Mountainvalley breeze. The Mountainvalley breeze is a local wind formed by the temperature difference between the free atmosphere at the same altitude on the hillside and in the valley in front of the slope. Due to the thermal difference between the air at the top and near the bottom of the valley, daytime wind blows from the valley to the top of the valley, which is called the “valley breeze”. From the wind direction in Figure 4c, it can be seen that the wind on both sides of the village tends towards the mountains on both sides. At night, the wind blowing from the top of the mountain to the bottom of the valley is called the “mountain breeze” (Figure 7). Together, the mountain breeze and valley breeze are called the Mountainvalley breeze. Although the Mountainvalley breeze is a local breeze with a 24 h cycle, in a dock village, the daytime valley breeze can improve the ventilation environment inside the village and can transport the smoke, dust and aerosols produced by the village to the mountain for purification. However, on a clear day, the valley breeze carries warm air to the mountain, which raises the temperature of the mountain and promotes the early germination, early blossoming, early fruiting and early maturity of plants, crops and fruit trees in the hilly area of the piedmont and also reduces the cold in winter. The valley breeze brings water vapor to the upper part of the valley, which increases the air humidity in the mountains and decreases the air humidity in the valley [48]. This phenomenon is particularly significant in the afternoon hours. If there is enough water vapor in the air, the summer valley wind often condenses clouds and causes rain, which is beneficial to the growth of trees and crops in mountainous areas. At night, the mountain breeze brings water vapor from the mountain to the valley, so the air humidity on the mountain decreases and the air humidity in the valley increases. In the growing season, the mountain breeze can reduce the temperature, which is beneficial for the accumulation of nutrients in plants and the growth and expansion of tubers and roots.

3.3.3. Effects of Vertical-Section Spatial Pattern on Microclimate

From the spatial pattern of the vertical section of Tangli Village, it can be seen that the northern side of the village is adjacent to Taihu Lake, and the middle terrain is higher. The village is hidden in the valley. In ancient times, this pattern was mainly used to deter thieves on Taihu Lake and to prevent flood disasters. However, from the perspective of the microclimate, it also has a greater impact now. First, in terms of the wind environment, the lake wind and cold current are brought by the northwesterly wind from Taihu Lake in winter. When the cold current encounters the mountain body in the northwest and the higher terrain in the north of the village (Figure 8), it will not only greatly reduce the wind speed and the invasion of the village by the cold current (Figure 4b) but will also significantly change the direction of the wind (Figure 5c), so that the wind direction conforms to the belt layout of the village, thus improving the ventilation conditions inside the village. Second, in terms of temperature, from Figure 4a it can be seen that the temperature in the north of the village is slightly lower than that in the interior of the village but is still significantly higher than the ambient temperature around the village. This is because the north of the village is too high to block the cold air in the north. Third, because the northerly wind comes from the lake and contains a lot of water vapor, it greatly increases the air humidity in the northern part of the village. In winter, Tangli Village is located in an area that should be warm and dry in the afternoon, while the northern part of the village experiences low temperature and humid micro-climate change. Therefore, although the northern part of Tangli Village serves as the main entrance, it intentionally elevates the terrain to prevent the impact of this microclimate change.

3.3.4. The Relationship between Spatial Distribution Trend of Linear Development and Microclimate

As shown in Figure 9, the buildings in Tangli Village are closely integrated with four elements: rivers, roads, surface runoff and contours. Moreover, the buildings take the village center as the core, and gradually expand outward parallel to river lines, road lines, surface runoff lines and contours, showing the law of decreasing density distribution. The layout of Tangli village is closed. Given this natural environmental characteristic, production and life in a dock village lack external support and are generally self-sufficient. There is a strong correlation between production resources and spatial distribution. Currently, from the perspective of the microclimate, this layout also has a great impact on the spatial development of villages.
According to the spatial distribution maps obtained from the above microclimate simulation, the suitable temperature, wind speed, wind direction and relative humidity regions in the study area were extracted for superposition analysis (Figure 10). The extraction of a suitable temperature region was mainly based on the mid-high temperature region in winter, that is, the region with temperatures greater than 15.85 °C (Figure 5a). The extraction of the wind speed region mainly considered the area with moderate wind speed inside the village, that is, the area with wind speed between 0.67 m/s and 1.44 m/s (Figure 5b). Extraction of the wind direction region was mainly based on the change in the main wind direction (Figure 5c). Since the wind direction in the region is consistent with the main wind direction, it means that the region does not play a role in regulating or influencing the wind environment. With the change in the main wind direction, the extraction of the wind channel should also be considered, that is, the wind direction conforming to the long axis direction of the study area is the best wind direction. The extraction of the relative humidity area mainly takes into account the low and middle humidity area, that is, the area with relative humidity lower than 67.55% (Figure 5d). Finally, the circular space shown in Figure 9 was obtained by superposition analysis. The main river lines, traffic lines, runoff lines and contours of Tangli village were extracted and superimposed with suitable spatial distribution of microclimate. It was found that there is a highly coupled relationship between them. From this we can see that microclimate has a great influence on the linear development spatial pattern of Tangli village.

4. Conclusions and Future Prospects

Tangli Village, as an example of a Taihu Lake dock village, has unique spatial pattern characteristics. Through the Microclimate Simulation experiment, we analyzed the influence of the spatial pattern of Tangli village on microclimate, and obtained results which led to the following conclusions:
(1)
From an overall point of view, the flat space of Tangli Village is characterized by having a wide middle and being narrow at both ends. The internal structure is a “small aggregation, large dispersion” patch pattern. This planar feature can not only reduce heat loss in winter, but also improve the wind environment inside the village in summer.
(2)
The cross-section spatial pattern of Tangli Village conforms to the situation of the mountain, and ingeniously utilizes the gap of the terrain. In this elevation space, the Mountainvalley breeze can form, which can not only reduce the temperature difference between day and night, but also improve the wind environment in the east-west direction of the village.
(3)
The vertical-section spatial pattern of Tangli village forms the model of “mountain-forest-land-village-farmland-lake”, which can not only effectively utilize land, but also resist the cold current coming from Taihu Lake in winter and improve the microclimate at the main entrance of the village.
(4)
The linear development spatial pattern of Tangli Village refers to the gradual outward expansion of buildings along the main rivers, roads, surface runoff and contours. This spatial development model fully adapts to the changes and impacts of the microclimate, which shows good microclimate adaptability.
Taihu Lake Dock Villages embody the infinite ecological wisdom and survival skills of the ancient Chinese. They have survived thousands of years’ worth of history and natural challenges. The wise strategies employed in dock villages deserve our deep consideration and investigation in order to guide and support large-scale urban and rural construction. At the same time, we should also realize that in the face of social, survival, natural, and other changes and upheavals, some aspects of traditional dwellings have been unable to meet the needs of current development and life. This requires us to study their intrinsic essence, not only for the protection and development of traditional settlements and historical heritage in order to establish fundamental principles, but also for the deep expression of regional architecture and landscapes, which serve as a source of ideas and inspiration.

Author Contributions

Conceptualization, X.T. and K.M.; Data curation, K.M. and Y.W.; Resources, K.M.; Software, K.M. and Y.R.; Writing—original draft, K.M.

Funding

This research is supported by National Natural Science Foundation of China: 31270746, Six Talent Peaks Project in Jiangsu Province: 2013-JZ-014, Postgraduate Research & Practice Innovation Program of Jiangsu Province: KYCX18_0979, Ministry of Housing and Urban-Rural Development: 2016-R2-068, Top-notch Academic Project of Jiangsu Higher Education.

Conflicts of Interest

The authors declare no conflicts of interest.

References

  1. Wu, Q.; Han, L.; Zhu, L.; Chen, F. Layout Analyses of Wuyuan Ancient Villages. Planners 2010, 4, 84–89. [Google Scholar]
  2. Sun, S.L.; Li, X.; Song, S. A Study of Landscape Pattern Characteristics and Ecological Adaptability of Bouyei Stone House Group. J. Chin. Urban For. 2017, 15, 26–30. [Google Scholar] [CrossRef]
  3. Yuri-Ling, H.E.; Zhang, Y.P.; Liu, Y.H.; You-Xin, M.A.; You-Rong, L.I.; Dou, J.X.; Guo, P. A Study on the Horizonal-Spatial Characteristics of Urban Climate in Kunming City. Sci. Geogr. Sin. 2002, 22, 724–729. [Google Scholar]
  4. Ni, X. Myanmar Wenxuan Meditation Center Design Based on Microclimate of Gardens; Tsinghua University: Beijing, China, 2012. [Google Scholar]
  5. Leng, H.; Yuan, Q. International Experience and Enlightenment on Urban Microclimate Environment Control and Optimization. Urban Plan. Int. 2014, 29, 114–119. [Google Scholar]
  6. Xiong, Y.; Wang, Y.; Zhao, C.; Chen, C.; Shi, Y. Space Form of Classical Southern China Gardens Based on Micro-climate Improvement. J. Northwest For. Univ. 2015, 30, 295–300. [Google Scholar] [CrossRef]
  7. Huang, L.M.; Li, J.L.; Zhao, D.; Zhu, J. A fieldwork study on the diurnal changes of urban microclimate in four types of ground cover and urban heat island of Nanjing, China. Build. Environ. 2008, 43, 7–17. [Google Scholar] [CrossRef]
  8. Sun, J.; Feng, J.; Duan, W. Change in the Urban Heat Island Effect in Kunming. Clim. Environ. Res. 2015, 20, 645–653. [Google Scholar] [CrossRef]
  9. Vogt, J.V.; Viau, A.A.; Paquet, F. Mapping regional air temperature fields using satellite-derived surface skin temperatures. Int. J. Climatol. 1997, 17, 1559–1579. [Google Scholar] [CrossRef] [Green Version]
  10. Kolokotroni, M.; Giridharan, R. Urban heat island intensity in London: An investigation of the impact of physical characteristics on changes in outdoor air temperature during summer. Sol. Energy 2008, 82, 986–998. [Google Scholar] [CrossRef] [Green Version]
  11. Wang, W.-W.; Li, G.-L.; Xue, J. Spatial distribution of urban heat island in Hangzhou and its mitigation countermeasures. J. Nat. Dis. 2009, 18, 14–20. [Google Scholar] [CrossRef]
  12. Zhu, S.; Zhang, G.; Liu, Y. Change of Underlying Surface Pattern and Its Local Thermal Environment Effect in Suzhou City. Sci. Geogr. Sin. 2012, 32, 859–865. [Google Scholar] [CrossRef]
  13. Liu, Y.H.; Quan, W.J. Research on High Temperature Indices of Beijing City and Its Spatiotemporal Pattern Based on Satellite Data. Clim. Environ. Res. 2014, 19, 332–342. [Google Scholar] [CrossRef]
  14. Zhang, H.L.; Zhu, S.Y.; Wang, M.J.; Zhang, Z.Y. Sky View Factor Estimation based on 3D Urban Building Data and Its Application in Urban Heat island—Illustrated by the Case of Adelaide. Remote Sens. Technol. Appl. 2015, 30, 899–907. [Google Scholar] [CrossRef]
  15. Max, T.A.; Morris, E.N. Building, Climate, Energy; China Architecture & Building Press: Beijing, China, 1990; ISBN 978-7-112-00723-3. [Google Scholar]
  16. Chen, Z.L. Research of Vegetation System’s Effects on Outdoor Thermal Environment of Residential Communities in Hot-Humid Climate; South China University of Technology: Guangzhou, China, 2010. [Google Scholar]
  17. Wang, Z. Design Strategies for the Climate Adaptability of Street Canyon Based on Urban Microclimate in Hot-Summer and Cold-Winter Zone; Huazhong University of Science & Technology: Wuhan, China, 2008. [Google Scholar]
  18. Lin, B.R. Studies of Greening’s Effects on Outdoor Thermal Environment; Tsinghua University: Beijing, China, 2004. [Google Scholar]
  19. Krüger, E.L.; Minella, F.O.; Rasia, F. Impact of urban geometry on outdoor thermal comfort and air quality from field measurements in Curitiba, Brazil. Build. Environ. 2011, 46, 621–634. [Google Scholar] [CrossRef]
  20. Pearlmutter, D.; Bitan, A.; Berliner, P. Microclimatic analysis of “compact” urban canyons in an arid zone. Atmos. Environ. 1999, 33, 4143–4150. [Google Scholar] [CrossRef]
  21. Ali-Toudert, F.; Mayer, H. Numerical study on the effects of aspect ratio and orientation of an urban street canyon on outdoor thermal comfort in hot and dry climate. Build. Environ. 2006, 41, 94–108. [Google Scholar] [CrossRef]
  22. Ng, E.; Chen, L.; Wang, Y.; Yuan, C. A study on the cooling effects of greening in a high-density city: An experience from Hong Kong. Build. Environ. 2012, 47, 256–271. [Google Scholar] [CrossRef]
  23. Salata, F.; Golasi, I.; de Lieto Vollaro, R.; de Lieto Vollaro, A. Urban microclimate and outdoor thermal comfort. A proper procedure to fit ENVI-met simulation outputs to experimental data. Sustain. Cities Soc. 2016, 26, 318–343. [Google Scholar] [CrossRef]
  24. Li, J.J.; Wang, J.G. Simulation analysis on relationship between spatial form and microclimate of pedestrian street in Nanjing. J. Southeast Univ. 2016, 46, 1103–1109. [Google Scholar] [CrossRef]
  25. Sun, X.; Yang, J.Y.; Wen, S.S. Study on Spatial Form and Thermal Environment of Urban Central District Based on ENVI-met Simulation: A Case Study of Xinjiekou, Nanjing. In Urban Ecological Planning; China Architecture & Building Press: Shenyang, China, 2016. [Google Scholar]
  26. Lao, Z.-M.; Li, Y.-M.; Deng, X.; Li, Y.-X. Numerical simulation of thermal environment in Zhongshan urban streets based on ENVI-met. China Environ. Sci. 2017, 37, 3523–3531. [Google Scholar]
  27. Yue, X.Q.; Yi, H.W.; Kong, F.H.; Chen, J.Y.; Liu, M.Q. The Influence of Green Space Layout on Microclimate based on ENVI-met: A Case Study of the Residential District in Nanjing. Jiangsu Urban Plan. 2018, 3, 34–40. [Google Scholar]
  28. Zhan, H. The Analysis of Temporal and Spatial Variation of Three-Dimensional Vegetation Temperature Fields Based on the ENVI-Met Model; Beijing Forestry University: Beijing, China, 2014. [Google Scholar]
  29. Zhang, L.; Zhan, Q.; Lan, Y. Study on Cooling Effect of Residential Green Space in Wuhan. Chin. Landsc. Archit. 2018, 34, 47–53. [Google Scholar]
  30. Xiaohan, L.I.; Dan, H.U.; Yuanzheng, L.I.; Zhou, H. The impact of central green space layout on micrometeorology in high residential community. Ecol. Sci. 2017, 36, 202–209. [Google Scholar] [CrossRef]
  31. Guo, S.M.; Liu, Y.J.; Wang, W. Analyzing the Association of Village Landscape Elements and Micro-climate Adaptability—Based on Guishan Village in Huai’an. In Digital Culture; China Architecture & Building Press: Nanjing, China, 2017. [Google Scholar]
  32. Han, L.I.; Jia-Zheng, W.U.; Zhao, Y.F.; Huang, J.; Zheng-Wei, L.I.; Ying-Jun, R. Influence Analysis of Building Layouts on Micro-environment of Residence Community. Build. Energy Effic. 2016, 44, 57–63. [Google Scholar] [CrossRef]
  33. Yang, X.; Chen, Z.; Shangguan, L.; Xiao, Q.; Wang, X. Research on the Impact of Underground Parking to the Microclimate in Residential Quarter. Chin. J. Undergr. Space Eng. 2016, 12, 11–19. [Google Scholar] [CrossRef]
  34. Qin, W.C.; Dan, H.U.; Yuan-Zheng, L.I.; Guo, Z. Numerical simulation of microclimate in Beijing typical residential area based on ENVI-met model. J. Meteorol. Environ. 2015, 56–62. [Google Scholar] [CrossRef]
  35. Liu, Z.; Zheng, S.; Fang, X.; Lu, X.; Zhao, L. Simulating validation of ENVI-met vegetation model to Ficus microcarpa in hot-humid region of subtropical zone. J. Beijing For. Univ. 2018, 40. [Google Scholar] [CrossRef]
  36. Yang, X.; Xinsheng, L.U. Urban Landscape Planning Methods Based on ENVI-met Software Microclimate Simulation and Thermal Comfort: A Case Study of Bei Xin’an Area of Shijingshan District in Beijing. J. North China Univ. Technol. 2018, 30, 117–125. [Google Scholar]
  37. Yang, X.; He, S.; Lu, X. Research on Thermal Comfort Evaluation of Public Space in Beijing Old City Based on Software Simulation: A Case Study of Six Alleys in Baita Temple Area. Urban Archit. 2018, 6, 51–56. [Google Scholar]
  38. Tang, X.L.; Zhang, Z.R.; Yu, A.N. Landscape resource evaluation based on GIS-AHP analysis in Xishan traditional villages of Tai Lake. J. Gansu Agric. Univ. 2017, 52, 124–132. [Google Scholar]
  39. Suzhou City, Wuzhong District Xishan Town Chronicles Editorial Committee. Xishan Town Chronicles; Suzhou University Press: Suzhou, China, 2001. [Google Scholar]
  40. Zhu, S.; Gao, M.; Chen, T.; Zhang, G. Simulation and Analysis of Urban Near-Surface Air Temperature Based on ENVI-met Model: A Case Study in Some Areas of Nanjing. Clim. Environ. Res. 2017, 22, 499–507. [Google Scholar] [CrossRef]
  41. Bruse, M.; Fleer, H. Simulating surface–plant–air interactions inside urban environments with a three dimensional numerical model. Environ. Model. Softw. 1998, 13, 373–384. [Google Scholar] [CrossRef]
  42. Unger, J. Intra-urban relationship between surface geometry and urban heat island: Review and new approach. Clim. Res. 2004, 27, 253–264. [Google Scholar] [CrossRef]
  43. Ambrosini, D.; Galli, G.; Mancini, B.; Nardi, I.; Sfarra, S. Evaluating Mitigation Effects of Urban Heat Islands in a Historical Small Center with the ENVI-Met (R) Climate Model. Sustainability 2014, 6, 7013–7029. [Google Scholar] [CrossRef]
  44. Zhan, H.J.; Xie, W.J.; Sun, H.; Huang, H.G. Using ENVI-met model; sensitivity analysis; three-dimensional temperature field of vegetated scenes. J. Beijing For. Univ. 2014, 36, 64–74. [Google Scholar]
  45. Won, M.; Han, S. Simulations of Changes in Wind Field Over Mountainous Terrains Using WRF and ENVI-met Numerical Models. Korean J. Agric. For. Meteorol. 2013, 15, 17–25. [Google Scholar] [CrossRef] [Green Version]
  46. Kusumastuty, K.D.; Poerbo, H.W.; Koerniawan, M.D. Climate-sensitive urban design through Envi-Met simulation: Case study in Kemayoran, Jakarta. IOP Conf. Ser. Earth Environ. Sci. 2018, 129, 012036. [Google Scholar] [CrossRef]
  47. Xun, P.; Huang, S.; Chen, Z. Improvement Strategy for Outdoor Environment Quality in Commercial Street Based on ENVI-MET Simulation. Appl. Mech. Mater. 2014, 641–642, 1131–1136. [Google Scholar] [CrossRef]
  48. Pan, S. The Principle of Modern Climatology; China Meteorological Press: Beijing, China, 1994. [Google Scholar]
Figure 1. (a) Key map; (b) Xishan Island boundary; and (c) Tangli Village, including significant cultural and geographical components.
Sustainability 11 00368 g001
Figure 2. A sketch map of the spatial pattern of Tangli Village: (a) plane; (b) cross-section; (c) vertical-section.
Sustainability 11 00368 g002
Figure 3. (a) Stereopair of the research area; (b) covering types of buildings and underlying surfaces; (c) bitmap (BMP) format architectural contour line.
Sustainability 11 00368 g003
Figure 4. Microclimate simulation data in the study area compared with the observed data: (a) temperature; (b) wind speed and direction; (c) relative humidity.
Sustainability 11 00368 g004
Figure 5. Spatial distribution of Microclimate Simulation in the study area at 3 p.m. on 25 November 2017. (a) air temperature; (b) wind speed; (c) wind direction; and (d) relative humidity.
Sustainability 11 00368 g005
Figure 6. The influence of the spatial pattern of the study area on the microclimate: (a) wind environment; (b) heat flow.
Sustainability 11 00368 g006
Figure 7. The effects of the cross-section spatial pattern of the microclimate in the study area: (a) valley breeze in the daytime; (b) mountain breeze at night.
Sustainability 11 00368 g007
Figure 8. The effect of the vertical section spatial pattern on the cold winter current in the study area.
Sustainability 11 00368 g008
Figure 9. Analysis of the current situation of Tangli Village. (a) river; (b) road; (c) surface runoff; and (d) contour.
Sustainability 11 00368 g009
Figure 10. The coupling relationship between the spatial distribution trend of linear development and microclimate in the study area.
Sustainability 11 00368 g010

