Abstract
China’s steel industry is an energy-intensive sector. Synergistic reduction of emissions of CO2 and air pollutants (SO2, NOx, and PM2.5) in the steel industry has an important practical significance for climate change and air pollution control. According to the CO2 emission reduction intensity targets (CERO) and air pollutant emission targets (PERO) for 2020 and 2030, 28 types of energy-saving and emission reduction technologies (20 types of carbon reduction technology and eight types of air pollution end-of-pipe technology) were selected for examination, and a two-stage dynamic optimization model with collaborative implementation of PERO and CERO was built to assess the near future (2015–2020) and long-term (2020–2030) implementation plans for synergistic emissions reduction of CO2 and air pollutants. The results show that in the near future, the implementation of PERO will have a greater synergistic effect on CO2 emission reduction. CO2 emission reduction under PERO in 2020 will be 97 million tons (Mt) higher than that of CERO, an increase of nearly 26%. However, the effects of implementing CERO are better in the long run. Under CERO, the emission reductions of SO2, NOx, and PM2.5 in 2030 are 2.44 Mt, 1.47 Mt, and 0.86 Mt, respectively, and 7%, 4%, and 5% higher than the implementation of PERO. As far as marginal abatement cost is concerned, in the near future, the marginal abatement costs of CO2 and air pollutant equivalents are 1.06 yuan/kgCO2 and 133 yuan/kg pollution equivalent (pe) under PERO, which are 23% and 11% lower than that of CERO, while in the long run, the marginal abatement costs of CO2 and pollutant equivalents under CERO are 0.025 yuan/kgCO2 and 2.73 yuan/kgpe, about 96% and 95% lower than that of PERO.
1. Introduction
The steel industry is characterized by high energy consumption and high emissions. Its carbon dioxide (CO2) emissions account for approximately 15% [1] of China’s total CO2 emissions. It is an important target industry for China when implementing energy conservation and emission reduction policies. In addition, because of the homology between greenhouse gases and air pollutants, the combustion of fossil energy sources such as coal will also produce emissions of air pollutants such as SO2, NOx, and PM2.5. In 2013, SO2, NOx, and smoke and dust in the steel industry accounted for 10.5%, 3.3%, and 5.8% of total industrial emissions, respectively [2]. SO2, NOx, and particulate matter (PM) emissions in the steel industry rank third, third, and first of all industrial sectors [3], respectively. In recent years, China has plunged into heavy air environmental pollution: 70.7% of Chinese cities failed to meet air quality standards in 2017 [4]. Environmental damage has had a huge impact on China’s economy [5], accounting for about 5–6% of China’s gross domestic product (GDP) [6]. Therefore, it is of great practical significance to study the synergistic emission reduction of CO2 and air pollutants in China’s steel industry to achieve the national NDC target and win China“s ”Blue Sky Defense War’.
The term ‘co-benefit’ first appeared in the third assessment report of the Intergovernmental Panel on Climate Change (IPCC) in 2001. It is defined as the benefit of implementing policies for various reasons at the same time [7]. Because the definition of co-benefits proposed by the IPCC is relatively broad, different countries and institutions have had different understandings of the term. In the current literature on co-benefits, the understanding of the word is mainly divided into two types: static synergistic effect analysis and dynamic synergistic effect analysis. Static synergistic effect analysis can be further divided into the factor method, comprehensive index method, and marginal abatement cost (MAC) curve analysis method. The factor method is mainly used to compare the synergistic effect of one gas emission reduction measure on another gas emission reduction [8,9,10]. The comprehensive index method assigns an effect coefficient to each type of gas to measure the synergistic effect of all gases considered under different measures [11,12]. The MAC curve analysis incorporates the air quality benefits or environmental damage costs into the calculation process of MAC, thus determining the sequence of technology adoption [13,14,15]. In summary, static synergistic effect analysis methods are relatively intuitive and easy to understand, but they cannot predict the synergistic effect of the whole planning period, because they do not consider the time factor.
Dynamic synergistic effect analysis can also be divided into top-down and bottom-up methods. Top-down methods, such as the computable general equilibrium (CGE) model [16,17,18,19,20], can quantify the impact of different policies on the macro-economy by establishing a correlation between air pollution control or carbon emission reduction policies and relevant factors in macro-economy. However, it cannot accurately reflect the effects of technological changes. Bottom-up methods, such as greenhouse gas-air pollution interactions and synergies (GAINS) [21,22,23,24,25], and the integrated MARKAL-EFOM system (TIMES) models [26,27,28] simulate the technologies used in the energy production process from the micro-level, using a line optimization model to predict the impact of economic activities on the climate and environment. The point of this study is to determine a synergistic emission reduction scheme of CO2 and air pollutants under different objectives by optimizing the technology portfolio. Unlike previous literature, this paper adopts a non-linear bottom-up dynamic optimization method. Although some studies use non-linear programming to study the choice of technology [29,30], they are limited to theoretical research, and do not involve synergistic problems.
In the existing literature, at the spatial level, Yang and Teng [31] and Wang et al. [32] studied the impact of China’s coal control policy (2010–2050) and non-fossil energy promotion policy (2005–2100) on SO2, NOx, and PM2.5 emissions. Bhanarkar et al. [23], Dong et al. [17], Liu et al. [24], and Lin et al. [33] all used 2030 as their target year and explored the synergistic emission reduction of air pollutants (PM10, PM2.5, black carbon, SO2, CO, VOC, etc.) and CO2 under the influence of the air pollution control policies or CO2 emission reduction technologies. Compared to the spatial analysis perspective, more studies focused on the industry or sector level, such as the power sector, transportation sector, and cement industry [13,33,34,35,36,37,38]. However, most of the above studies analyze the long-term synergistic effects of a single policy. Few studies consider the synergistic effects of 2020 air pollution control objectives. However, the current environmental governance is in urgent need of policy guidance and implementation. Peng et al. [39] also suggested the importance of studying co-controlling air pollutant and carbon emissions with a short-term perspective, in order to guide immediate policy making and analyzed the co-benefits under different scenarios in 2015. However, they did not consider the dynamic development of the relevant industries over time.
In terms of CO2 and air pollutant synergistic emission reduction in the steel industry, Ma et al. [26] analyzed the synergistic effect of production restructuring, as well as the effect of energy-saving and emission reduction technologies on air pollutants in the steel industry from 2010–2050. They thought implementing energy-saving technologies was the most effective way to reduce CO2 emission in the short-term, while adjusting production structures would play an important role in CO2 emission reduction in the long run. Wu et al. [12] evaluated the synergistic emission reduction effects of 24 types of energy-saving technology on CO2, SO2, NOx, and PM10, by establishing the synergistic benefit function (APeq). Ma et al. [15] used a static model to analyze the impact of energy-saving technologies on air pollutant emission reduction. However, while these studies discuss the synergistic effect of carbon emission reduction technology on SO2, NOx, PM2.5, and other air pollutant emission reductions, they omit the impact of end-of-pipe technologies on CO2 emissions. Though Zhang et al. [25] considered energy-saving technologies and end-of-pipe control technologies in the steel industry, and analyzed the synergies between different technology combinations between 2010–2030, they did not integrate the goal of winning the “Blue Sky Defense War” into the research framework, nor analyze the synergistic effects under the goal of winning the “Blue Sky Defense War”.
In short, research comparing the synergistic emission reduction effects of air pollution treatment objectives (PERO) and carbon reduction objectives (CERO) in 2020 and 2030 remains scant. Therefore, further research on the optimization of the technology portfolio among carbon emission reduction technology and end-of-pipe technology in the steel industry is necessary to fill the gap. Twenty types of carbon emission reduction technologies and eight types of end-of-pipe technologies have been screened out (as listed Table 1 and Table 2), based on the principle of advancement and applicability, and a two-stage dynamic optimization comprehensive model involving the near future (2015–2020) objectives and long-term (2020–2030) objectives of CERO and PERO was constructed. The following time spans of near future and long-term are from 2015 to 2020 and 2020 to 2030, respectively. The emission reduction of different gases (CO2, SO2, NOx, and PM2.5) and MACs under different targets is compared from vertical and horizontal perspectives, and suggestions on which emission reduction objectives should take precedence in the near future and long term stages are offered.

Table 1.
Energy saving and emission reduction technology in China’s steel industry.
Table 2.
End-of-pipe technologies of air pollutants in the steel industry.
2. Comprehensive Assessment Model
2.1. Framework of Model
The comprehensive assessment model constructed in this paper includes an emission accounting module and a two-stage dynamic optimization module, as shown in Figure 1. The emission accounting module is used to calculate the emissions of CO2 and air pollutants in the scenario of “business as usual” (BAU), and the detailed calculation steps are included in Section 2.2. The two-stage dynamic optimization module is used to calculate the emission reduction of CO2 and three air pollutants (SO2, NOx, and PM2.5) under CERO and PERO, discussed in Section 2.3.
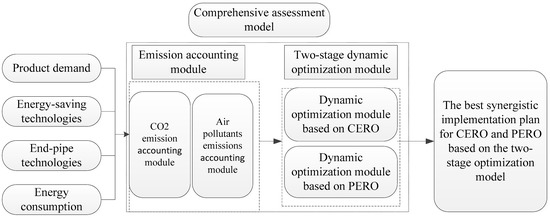
Figure 1.
The framework of the comprehensive assessment model.
2.2. Emission Accounting Module
2.2.1. CO2 Emission Accounting
In general, the application of end-of-pipe technologies will increase CO2 emissions due to electricity consumption, so we calculated the CO2 emissions from three aspects: CO2 emissions generated from fossil fuel combustion (Ec), CO2 emissions generated from the production process, and CO2 emissions generated from the electricity consumption of end-of-pipe technologies (Eend). CO2 emissions generated from the production process can be further divided into: emissions from the flux of iron-making in the process of high-temperature decomposition (), and emissions from the process of carbon reduction in steelmaking (). The calculation methods of each part are as follows:
where is the output of crude steel, is the comprehensive energy consumption per unit of crude steel, represents the comprehensive emission factor, is the iron-to-steel ratio (here, iron-making flux is calculated with limestone, and the ratio of flux is 0.15 t/t iron [40]), represents the emission factor of limestone (adopting the default value of IPCC), represents iron consumption per ton of steel in steelmaking [41], represents the carbon content of pig iron (adopting the default value of IPCC), and represents the average amount of carbon in steel (adopting the default value of IPCC). represents the electricity consumption of end-of-pipe technology j, represents the penetration rates of end-of-pipe technology j, and represents the emission factor of electricity.
2.2.2. Emissions Accounting of Air Pollutants
Air pollutant emissions are mainly derived from energy combustion, with a small percentage derived from production processes. Considering the application of end-of-pipe technologies in the steel industry, we should deduct the removal volume of end-of-pipe technologies from the total emission of each pollutant when calculating the emissions of air pollutants:
where represents emissions of air pollutants, 1 and 2 represent the energy combustion process and production process, respectively, k represents energy varieties, represents energy consumption (calculated by energy structure of ferrous industry), represents the air pollutant emission factor of energy varieties, represents the air pollutant emission factor of the production process, and represents the removal efficiency of end-of-pipe technology j. The specific value of each parameter is shown in Section 3.1.
2.3. Two-Stage Dynamic Optimization Module
We take the development level of the relevant technologies as the decision variables for discussing the development path of these technologies under the minimum cost. Based on this, the emission reduction of CO2 and three air pollutants (SO2, NOx, and PM2.5) can be calculated. The modelling ideas of the two-stage dynamic optimization model are shown in Figure 2.
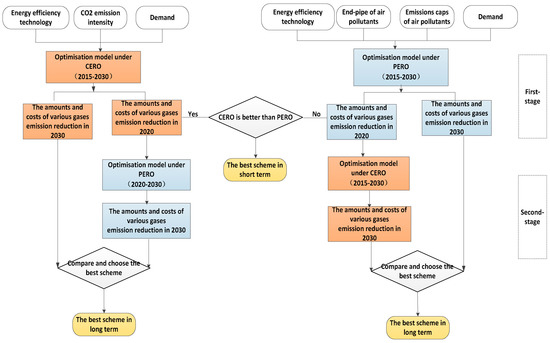
Figure 2.
Modeling ideas of the two-stage dynamic optimization model.
The optimization process of the first stage is as follows:
- (1)
- From a long-term perspective, the synergistical control of four gases (CO2, SO2, NOx, and PM2.5) and MACs under a single objective (CERO or PERO) is predicted respectively.
- (2)
- By comparing the short-term synergistical effects and MACs under each objective, the best short-term synergetic scheme is determined.
The second optimization process is to compare the emission reduction effects and MACs of four gases under the implementation of CERO and PERO, separately in the long-term, based on the implementation of the optimal synergistical scheme in the near future, and then determine the optimal long-term collaboration scheme.
It should be noted that the input of the model of the second stage is the output of the optimal implementation scheme in the near future. In addition, because of the different removal rates of activated carbon flue gas desulfurization and denitrification technology in SO2 and NOx, we regard it as two technologies. In essence, they are one technology, we equalized their costs and energy consumptions and controlled their popularity rate changes by certain constraints.
2.3.1. Objective Function
The forms of objective functions under CERO and PERO are the same (i.e., total cost minimization). The total cost includes the fixed investment cost, operation and maintenance cost, and variable operation cost. The expression of objective function is as follows:
where TC is the total cost, is the discount rate (5% [42] is adopted here), is the fixed investment cost, is the operation and maintenance (O&M) cost, indicate the capacity and output of the technology, respectively, i represents the technology type, including energy-saving, i1, and end-of-pipe technology, i2, t represents the year, and T represents the number of planning periods.
2.3.2. Constraints
The constraints of the two-stage dynamic optimization model include capacity constraints, CO2 emission constraints, air pollutants emission constraints, and penetration constraints.
Capacity constraints refer to the fact that the output of technology in each period cannot exceed the cumulative capacity of technology of this period, as shown in Formula (9). The calculation of cumulative capacity is shown in the Formula (10), which means that with the expiration of existing technology lifespans, new technology production capacities need to be continuously introduced to meet the demand for steel products. in Formula (10) represents the lifespan of technology (adopting 20 years [43]). These constraints are applicable to dynamic optimization models under CERO and PERO.
CO2 emission constraints indicate that the CO2 emission per industrial added value in each period should not exceed the limited emission intensity of this period, as shown in Formula (11). The left side of the formula consists of three parts: the first part displays the CO2 emission in the period t under BAU, , and the second part displays the CO2 emission reduction of carbon reduction technologies in the period t, which can be obtained by the product of energy saving, , of energy k from technology i1, the emission factor of energy k, , and the output of technology i1. The third part displays the added CO2 emission of end-of-pipe technologies due to electricity consumption, which can be obtained by the electricity emission factor, , electricity consumption of end-of-pipe technology, , and the output of end-of-pipe technology. The right side of the formula is the product of CO2 emission intensity, , and the industry added value, . These constraints are only suitable to the dynamic optimization model under CERO.
Air pollutants emission constraints indicate that the emission amounts of air pollutants in each period should not exceed the prescribed emission limits of air pollutants of this period. While most end-of-pipe technologies remove some air pollutants, they also release air pollutants due to their consumption of electricity. Thus, when calculating the emission of air pollutants, we also consider air pollutants emissions generated by this electricity:
where, represents the emission of air pollutants (SO2, NOx, and PM2.5) in the period t under BAU, represents the removal rate of end-pipe technology, and represents the emission caps of air pollutants. As we can see in Formula (12), these are non-linear constraints. These non-linear constraints are only suitable to the dynamic optimization model under PERO.
The popularity rate constraints are shown as Formulas (13)–(15). Formula (13) shows that the penetration rate of technology in the future will not be lower than that of the latest phase, assuming that no new or efficient technologies will replace existing technologies. To avoid repeated calculation, this paper assumes that the end-of-pipe technologies for removing the same air pollutants are mutually exclusive, as shown in Formula (14). Formula (15) ensures the consistency of activated carbon flue gas desulfurization and denitrification technology.
3. Data Source and Scenario Settings
3.1. Data Source
The steel demand and industrial added value are taken from the 13th “Five-Year Plan of the Iron and Steel Industries” [44], described Yang and Teng [31] and Zhang et al. [7], and shown in Table 3.
Table 3.
Related data of the steel industry.
The related cost data of all technologies are taken from China’s National Key Energy Conservation Technologies Promotion Catalogue [45], the Guide to Advanced and Applicable Technologies of Energy-saving and Emission Reduction in the Iron and Steel Industries [46], the Application of Advanced Applicable Technology for Energy Conservation and Emission Reduction in Iron and Steel Industry [47], the National Energy Statistic Yearbook [48], the China Steel Yearbook [40], and other related references [12,49,50,51,52]. Energy prices are calculated based on the change rate of energy prices in the future predicted by IEA, as shown in Table 2 and Table 3.
CO2 emission factors from different energy varieties (apart from electricity and heat) are taken from China’s greenhouse gas inventory of 2008 [53], and are calculated by the carbon content and carbon oxidation rate per unit calorific value of different energy sources. The emission factors of air pollutants are taken from Zhao et al. [54], and the emission factors of electricity and heat are referred to in Tan et al. [55] and Zhao et al. [54]. Equivalent values of air pollutants are taken from the environmental protection tax law of the People’s Republic of China, as shown in Table 4 and Table 5.
Table 4.
Fuel price.
Table 5.
Emission factors of electricity and heat.
3.2. Scenario Settings
The cooperative implementation schemes of CERO and PERO are studied in this paper. CERO focuses on the CO2 emission amount per unit of industrial added value of the target year, while PERO focuses on the emission caps of air pollutants of the target year. Based on the 13th “Five-Year Work Plan for Greenhouse Gas Control” [56], China’s NDC target in 2030, and the “Three-Year Plan of Action for Winning the Blue Sky Defense War” [57], while considering future uncertainty, we set two restriction scenarios for each objective, as shown in Table 6, assuming that 70% [58] of energy-saving contributions are derived from energy-saving technology.
Table 6.
Description of different scenarios.
4. Results and Discussion
4.1. Analysis of Synergistic Effects under a Single Objective
4.1.1. Analysis of Synergistic Effects under CERO
Because the same emission reduction objectives are described in CPS-I and CPS-II, the change trends of gases under the two scenarios are the same in the near future (2015–2020), as shown in Figure 3. CO2 emissions will increase from 1.63 billion tons (Bt) in 2015 to 1.78 Bt in 2020, and the annual growth rate is 1.7%. SO2, NOx, and PM2.5 will increase from 4.79 Mt, 3.53 Mt, and 1.82 Mt in 2015 to 4.82 Mt, 4.05 Mt, and 2.36 Mt in 2020, and the annual growth rates are 0.12%, 2.8%, and 5.4%, respectively.
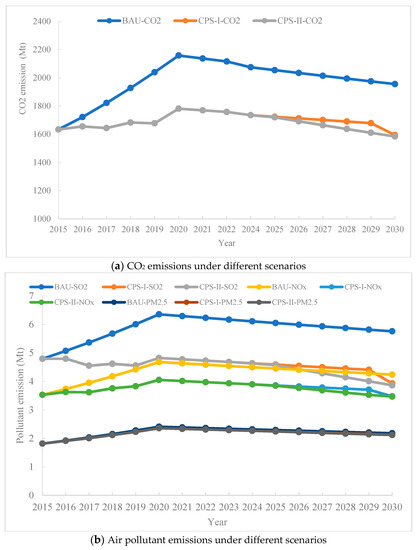
Figure 3.
Emissions under CERO.
In the long-term (2020–2030), the emissions of the four gases will decrease annually. Emissions of CO2, SO2, NOx, and PM2.5 will decrease to 1.6 Bt, 3.93 Mt, 3.48Mt, and 2.12 Mt in 2030 under the scenario of CPS-I, showing decreases of 18%, 32%, 18%, and 2.8% compared to BAU. Because the target of CO2 emission intensity in 2030 under CPS-II is higher than that of CPS-I, CO2 emission reductions under CPS-II are higher than that of CPS-I, and the emission reduction of air pollutants is also higher than that of CPS-I. Cumulative emissions of the four gases (CO2, SO2, NOx, and PM2.5) under CPS-II will decrease to 1.58 Bt, 3.86 Mt, 3.47 Mt, and 2.12 Mt in 2030, showing decreases of 19%, 33%, 18%, and 2.8% compared to BAU.
Thus, if CERO is implemented separately, the emissions of three air pollutants will also be reduced. The ranking of the synergistical degree of the three air pollutant emission reductions is SO2, then NOx, and PM2.5, and the synergistic effect on PM2.5 emission reduction under CERO is very weak.
4.1.2. Analysis of Synergistic Effects under PERO
According to the results of optimization, as shown in Figure 4, there is no difference in the scenarios of CES-I and CES-II. In the near future (2015–2020), if only PERO is implemented, the cumulative CO2 emission will be 1.68 Bt in 2020, showing a decrease of 22% compared to BAU. The emission of SO2, NOx, and PM2.5 will be 4.32 Mt, 3.32 Mt, and 1.51 Mt in 2020, showing decreases of 32%, 29%, and 37% compared with BAU. The amount CO2 emissions under PERO is 97.1 Mt lower than that of CERO.
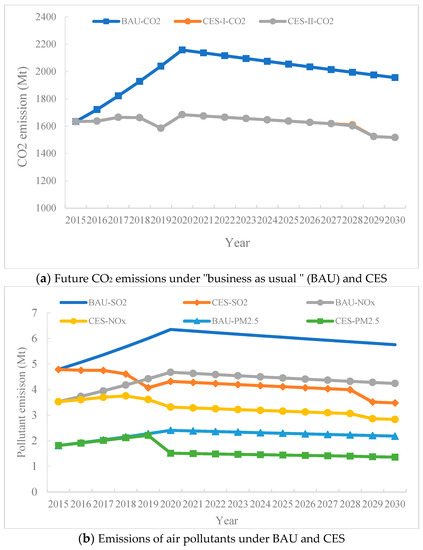
Figure 4.
Emissions under PERO.
In the long-term (2020-2030), emissions of the four gases will decrease annually, and the emissions of these gases are same in CES-I and CES-II. Emission of CO2, SO2, NOx, and PM2.5 will decrease to 1.52 Bt, 3.48 Mt, 2.84 Mt, and 1.36 Mt in 2030 in both scenarios, showing decreases of 22%, 40%, 33%, and 38%, respectively, compared to BAU. The amount CO2 emissions under PERO is 67 Mt lower than that of CERO.
Thus, if only PERO is implemented, the emissions of air pollutants and CO2 will all be reduced to a large degree. Although the promotion of most end-of-pipe technologies will increase CO2 emissions due to electricity consumption, it will not change the synergistic emission reduction characteristics of the implementation of PERO on CO2 as a whole. Although the scenario of CES-II continues the control target of air pollutants in 2020, while the scenario of CES-I relaxes the control of air pollutants compared to 2020, there is no obvious difference in the optimization results in either scenario. This also shows that even if the control intensity of air pollution is reduced in the future, it will not have a significant impact on the environment under the premise of realizing the goals of air pollution control in 2020.
4.2. Comparison of Synergistic Effects between CERO and PERO
Based on the comprehensive evaluation model, this section focuses on comparing the degree of synergy of each stage in CERO and PERO.
4.2.1. Comparison of Synergistic Effects in CERO and PERO in the Near Future
In the near future (2015–2020), because both scenarios have the same objectives, we use CPS to express CPS-I and CPS-II. Thus, we only compare the three scenarios: BAU, CPS, and CES.
The Development of Technologies Portfolio
To meet the CERO of 2020, all carbon reduction technologies except G1, G7, G8, G11, G16, G17, and G20, should be rapidly popularized, and they are set to be comprehensively popularized in 2019. Because there are no constraints on the emissions of air pollutants, end-of-pipe technologies experience no major changes in CPS.
Compared with CPS, the carbon reduction technologies, aforementioned technologies, and G17. will be accelerated to development in CES, and will be comprehensively popularized in 2019. For the emission reductions of SO2, carbon reduction technologies have more cost-effective advantages than end-of-pipe technologies, so there will be no major changes in the development of end-of-pipe technologies for removing SO2. Because the technologies of carbon reduction have less effect on NOx and PM2.5, E5 and E8 will be also accelerated to development under CES, the popularity rate of these two technologies in 2020 are set to be 30% and 46%, respectively.
Emission Reductions of CO2 and Air Pollutants
As shown in Figure 5, although the emissions of CO2 in CPS and CES are significantly lower than BAU, the extent of their decline is different. In 2020, cumulative CO2 emissions in CES will be 97 Mt lower than that of CPS. From the perspective of CO2 emission intensity, without considering the emission reduction of non-energy-saving technologies, the emission intensity of CO2 in CES in 2020 will be 23% lower than in 2015, which fully meets the target of 22% reduction of CERO in 2020.
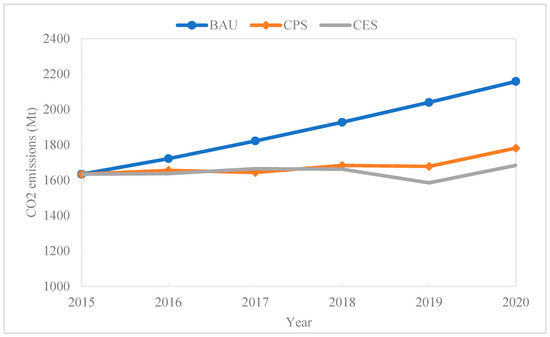
Figure 5.
CO2 emissions under different scenarios from 2015-2020.
Figure 6 shows the emissions of air pollutants under different scenarios in 2020. Although the emissions of the three air pollutants under CPS are obviously lower than that of BAU, their emission trends will increase annually. Considering the emission reduction caused by non-energy-saving technologies, the emissions of the three air pollutants (SO2, NOx, and PM2.5) in 2020 will be 4.16 Mt, 3.78 Mt, and 2.33 Mt, respectively. Obviously, emissions of NOx and PM2.5 are still higher than that of 2015. Therefore, if only considering the implementation of CERO in the near future, the PERO of 2020 will not be met.
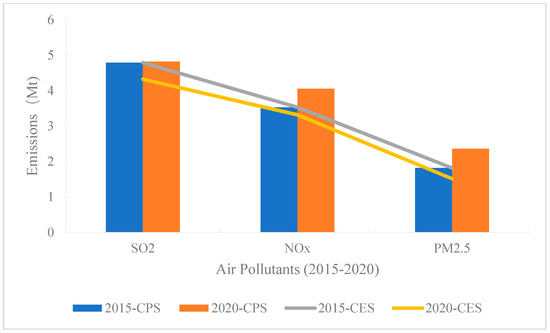
Figure 6.
Emissions of air pollutant under different scenarios from 2015-2020.
MAC
MAC is the cost of reducing one additional unit of gas. For convenient comparison, we converted the emission reductions of the three air pollutants into pollution equivalents, and then calculated the MAC. As shown in Figure 7, the MACs of CO2 and air pollutant equivalents in 2020 are 1.39 yuan/kgCO2 and 229 yuan/kgCO2 under CERO, and 1.07 yuan/kgCO2 and 133 yuan/kgCO2 under PERO. Thus, from the perspective of MACs, PERO is better than CERO.
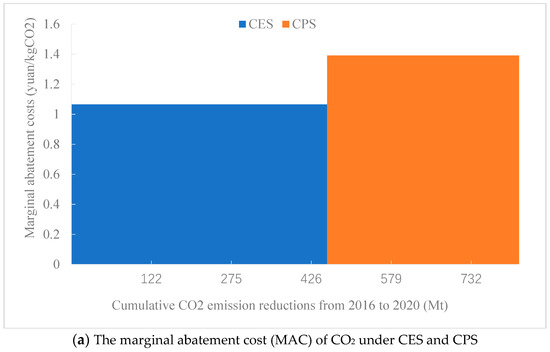
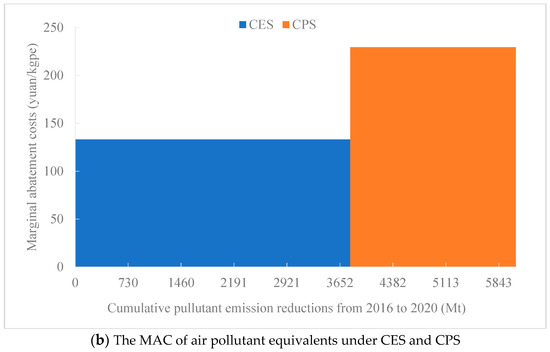
Figure 7.
The MAC of air pollutant equivalents under CES and CPS.
In summary, although the implementation of CERO can lead to the emission reductions of the three air pollutants, it has a weak cooperative effect on PM2.5. Compared to 2015, emissions of air pollutants will be increasing annually, and will not meet the control target of air pollution in 2020. Implementing PERO not only reduces the emissions of CO2, but also reduces emissions of other air pollutants. In addition, PERO has the absolute cost advantage. Thus, PERO should be given priority for the synergistical control of CO2 emissions.
4.2.2. Comparison of Synergistic Effects between CERO and PERO in the Long Term
Based on the best synergistical scheme for the near future—the implementation of PERO to co-control CO2 emissions—we will further analyze the development of the technological portfolio in the long-term. Although the targets for 2030 under the two scenarios of CERO are different, there are no obvious differences in optimization results. This is because the development of carbon reduction technologies has been accelerated to a high level prior to 2020 under PERO. CES-CPS represent the scenarios of implementing PERO before 2020 and implementing CERO after 2020. Next, we compare the synergistical effects of the two scenarios of CES-CPS and CES in the long-term.
The Development of Technology Mix in the Long-Term
Under CES-CPS, to meet CERO of 2030, all technologies, except G1 and G20, are set to be comprehensively popularized in 2022. G1 will be comprehensively popularized in 2030, while the end-of-pipe technologies will experience no major changes.
Under CES, in addition to maintaining the development level of technologies in 2020, G20 will be accelerated to development in the latter period, and will be comprehensively popularized by 2029.
The Emission Reduction Potentials of CO2 and Air Pollutants under CERO and PERO
From the long-term perspective, as shown in Figure 8, the emission reduction of CO2 under CES-CPS is lower than that of CES. The emissions of CO2 under CES and CES-CPS in 2030 will be 1.52 Bt and 1.48 Bt, respectively.
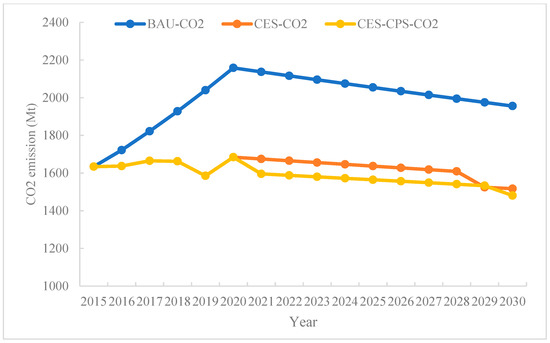
Figure 8.
CO2 emissions under different scenarios in the long-term period.
In terms of the emissions of air pollutants, as shown Figure 9, the emissions of SO2, NOx, and PM2.5 in 2030 under CES will be 3.48 Mt, 2.84 Mt, and 1.36 Mt, respectively. The emission of these air pollutants in 2030 under CES-CPS will be 0.87 Mt, 2.16 Mt, and 0.67Mt, respectively, which are 2.61Mt, 0.67Mt and 0.7Mt lower than that of CES, respectively.
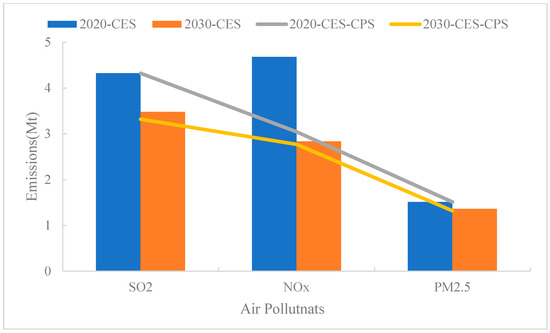
Figure 9.
The emission of air pollutants under different scenarios.
MAC
With the development of technology, the benefits of energy-saving will also increase annually in both scenarios. Compared with CES, the effects of energy-saving of CES-CPS are apparent. In 2030, the MACs of CO2 and air pollutant equivalents are 0.55 yuan/kgCO2 and 59.8 yuan/kgpe under CES, and 0.02 yuan/kgCO2 and 2.7 yuan/kgpe under CES-CPS, as shown in Figure 10.
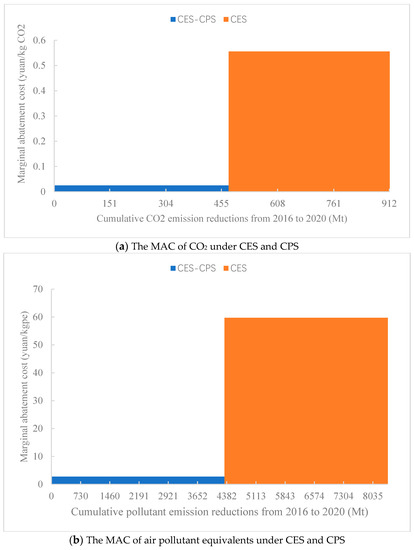
Figure 10.
The MACs under CES and CPS.
Uncertainty still exists in this study. For CERO, there are no quantitative objectives for CO2 emission intensity of the 14th and 15th “five-year plans” in the steel industry. Similarly, for the goal of air pollutants control, the Chinese government has only issued the “Three-year Action Plan to Win the Blue Sky Defense War”. Therefore, changes in the above factors in the future will have an impact on the optimization results. In addition, the emergence of new technologies will also affect the accuracy of the results of this study.
4.3. The Choice of Implementation Scheme under the Two-Stage Dynamic Optimizaiton Model
In summary, there are synergistic effects between CERO and PERO in different periods, but the synergistic effects are different. In the short-term period, the synergistic effects of PERO are better than those of CERO (i.e., under PERO, three air pollutants can be reduced significantly and CO2 can also be reduced in a large extent at the same time), while in the long-term, the synergistic effects of CERO are better than those of PERO.
4.4. Policy Discussion
Based on the above results, three suggestions are proposed in this paper:
- (1)
- To alleviate the dual pressures of the steel industry in coping with climate change and environmental protection, a variety of control measures should be implemented. Each emission reduction measure has its own focus. Thus, the coordinated implementation of various measures can play a complementary role for maximizing the advantages of different strategies.
- (2)
- The steel industry should prioritize the implementation of PERO and the synergistic emission control of CO2 in the near future and prioritize the implementation of CERO and the synergistic emission control of air pollutants in the long-term. Although these two objectives have synergistic effects on each other in the implementation process, the degree of synergy is quite different, so the implementation of the correct synergistic scheme will play a multiplier role in reducing the emissions of CO2 and three air pollutants. Thus, in the framework of this paper, implementing PERO could not only alleviate the current environmental pressure, but also have a strong synergistic effect on CO2 emissions in the near future, and with the gradual improvement of environmental governance, implementing CERO will ensure the realization of NDC goals in China in the long-term.
- (3)
- Policy support of technology should be strengthened. Although accelerating technological development will lead to a higher initial investment, increasing the benefits of energy-saving with the popularization of technology will offset and may even exceed the input cost, transforming it into income in the long run. Therefore, accelerating the popularization of technology is not only conducive to greatly reducing the emissions of various gases, but also enables enterprises to enjoy the benefits of energy-saving incomes as soon as possible.
5. Conclusions
The implementation schemes of synergistic emissions reduction of CO2 and air pollutants in China’s steel industry are studied in this paper. Considering 20 types of carbon emission reduction technologies and eight types of end-of-pipe technologies in the steel industry, a non-linear comprehensive evaluation model including co-control of CO2 emission reduction intensity targets (CERO), and air pollutants emission targets (PERO) in 2020 and 2030 was established. Through the emissions predictions of CO2 and three air pollutants (SO2, NOx, and PM2.5) in the steel industry and the analysis of synergistic effects under different emission reduction targets, synergistic effects between CERO and PERO were found. We compared the implementation effects of a single objective from two aspects: emission reductions of four gases and MACs. From the results of this study, in the near future (2015-2020), the intensity of carbon emission reduction can be reduced by 23% by the implementation of PERO, which can fully meet the target of carbon emission reduction by 2020. At the same time, the marginal abatement cost of CO2 and air pollutant equivalents are 23% and 11% lower than that of CERO, respectively. On this basis, we have suggested the implementation of CERO in the long-term period (2020–2030), which can ensure the realization of China’s NDC goals while also ensuring environmental improvement at a lowest cost. The marginal abatement cost of CO2 and air pollutant equivalents are 96% and 95% lower than that of PERO, respectively.
Author Contributions
Conceptualization, H.L., X.T. and J.G.; Methodology, H.L., X.T. and J.G.; Investigation, H.L., K.Z. and C.H.; Data Curation, H.L.; Writing—Original Draft Preparation, H.L.; Supervision, X.T. and J.G.; Project Administration, X.T. and J.G.
Funding
This work is supported by National Natural Science Foundation of China (71573249), the Key Task Project of Institutes of Science and Development of Chinese Academy of Sciences (Y02015003), the Clean Development Mechanism Fund of China (2014091), the Project-Impact and Adaptation of Climate Change in Major Economies of the Belt and Road (2018YFA0606500), and National Natural Science Foundation of China (71801212).
Acknowledgments
Thanks to the comments and suggestions of the two reviewers and the editors, the quality of this article has been further improved.
Conflicts of Interest
The authors declare no conflict of interest.
References
- Opportunities and Challenges Coexist! Carbon Emission Trading Quota Scheme for Iron and Steel Industry Is in Progress! Available online: http://www.sohu.com/a/234612755_100007564 (accessed on 14 October 2018).
- Analysis on the Technical Route of China’s Steel Sintering Flue Gas Treatment Industry and the Scale of Market Investment Demand in 2014. Available online: www.chyxx.com/industry/201411/291258.html (accessed on 20 October 2018).
- The Steel Industry Enters the “Window Period” of Green Transformation: Steel Enterprises Have Benefits, Environmental Protection and Power. Available online: http://energy.people.com.cn/n1/2018/0730/c71661-30177583.html (accessed on 20 December 2018).
- China Ecological Environment Bulletin. Available online: www.mee.gov.cn/hjzl/zghjzkgb/lnzghjzkgb/201805/P020180531534645032372.pdf (accessed on 20 December 2018).
- Zhou, Q.; Yabar, H.; Mizunoya, T.; Higano, Y. Evaluation of integrated air pollution and climate change policies: Case study in the thermal power sector in Chongqing City, China. Sustainability 2017, 9, 1741. [Google Scholar] [CrossRef]
- China Loses 2.6 Trillion Yuan per Year Due to Environmental Pollution. Available online: discovery.163.com/12/0316/09/7SN5DHST000125LI.html (accessed on 26 December 2018).
- Climate Change 2001: Mitigation; Cambridge University Press: New York, NY, USA, 2001.
- Mao, X.Q.; Zeng, A.; Hu, T.; Xing, Y.K.; Liu, S.Q. Study of coordinate control effect assessment of technological measures for emissions reduction. China Popul. Resour. Environ. 2011, 21, 1–6. [Google Scholar]
- Xie, Y.B.; Li, W. Synergistic Emission Reduction of Chief Air Pollutants and Greenhouse Gases Based on Scenario Simulations of Energy Consumptions in Beijing. Environ. Sci. 2013, 35, 2057–2064. [Google Scholar]
- Mao, X.; Zeng, A.; Liu, S.; Hu, T.; Xing, Y. Assessment of SO2, NOx and CO2 co-control effects by technological reduction measures in iron & steel industry. Acta Sci. Circumstantiae 2012, 32, 125. [Google Scholar]
- Liu, S.-Q.; Mao, X.-Q.; Hu, T.; Zeng, A.; Xing, Y.-K.; Tian, C.-X.; Li, L.-P. Roadmap of co-control of air pollutants and GHGs in iron and steel industry in China. Environ. Sci. Technol. 2012, 35, 168–174. [Google Scholar]
- Wu, X.; Zhao, L.; Zhang, Y.; Zhao, L.; Zheng, C.; Gao, X.; Cen, K. Cost and potential of energy conservation and collaborative pollutant reduction in the iron and steel industry in China. Appl. Energy 2016, 184, 171–183. [Google Scholar] [CrossRef]
- Yang, X.; Teng, F.; Wang, G. Incorporating environmental co-benefits into climate policies: A regional study of the cement industry in China. Appl. Energy 2013, 112, 1446–1453. [Google Scholar] [CrossRef]
- Xi, Y.; Fei, T.; Gehua, W. Quantifying co-benefit potentials in the Chinese cement sector during 12th Five Year Plan: An analysis based on marginal abatement cost with monetized environmental effect. J. Clean. Prod. 2013, 58, 102–111. [Google Scholar] [CrossRef]
- Ding, M.A.; Chen, W.Y. Analysis of the co-benefit of emission reduction measures in China’s iron and steel industry. China Environ. Sci. 2015, 35, 298–303. [Google Scholar]
- Nam, K.; Waugh, C.J.; Paltsev, S.; Reilly, J.M.; Karplus, V.J. Carbon co-benefits of tighter SO2 and NOx regulations in China. Glob. Environ. Chang. 2013, 23, 1648–1661. [Google Scholar] [CrossRef]
- Dong, H.; Dai, H.; Dong, L.; Fujita, T.; Geng, Y.; Klimont, Z.; Inoue, T.; Bunya, S.; Fujii, M.; Masui, T. Pursuing air pollutant co-benefits of CO2 mitigation in China: A provincial leveled analysis. Appl. Energy 2015, 144, 165–174. [Google Scholar] [CrossRef]
- Nam, K.-M.; Waugh, C.J.; Paltsev, S.; Reilly, J.M.; Karplus, V.J. Synergy between pollution and carbon emissions control: Comparing China and the United States. Energy Econ. 2014, 46, 186–201. [Google Scholar] [CrossRef]
- Xu, Y.; Masui, T. Local air pollutant emission reduction and ancillary carbon benefits of SO2 control policies: Application of AIM/CGE model to China. Eur. J. Oper. Res. 2009, 198, 315–325. [Google Scholar] [CrossRef]
- Wang, H.; Dai, H.; Dong, L.; Xie, Y.; Geng, Y.; Yue, Q.; Ma, F.; Wang, J.; Du, T. Co-benefit of carbon mitigation on resource use in China. J. Clean. Prod. 2018, 174, 1096–1113. [Google Scholar] [CrossRef]
- Kanada, M.; Dong, L.; Fujita, T.; Fujii, M.; Inoue, T.; Hirano, Y.; Togawa, T.; Geng, Y. Regional disparity and cost-effective SO2 pollution control in China: A case study in 5 mega-cities. Energy Policy 2013, 61, 1322–1331. [Google Scholar] [CrossRef]
- Zhang, S.; Worrell, E.; Crijns-Graus, W. Evaluating co-benefits of energy efficiency and air pollution abatement in China’s cement industry. Appl. Energy 2015, 147, 192–213. [Google Scholar] [CrossRef]
- Bhanarkar, A.D.; Purohit, P.; Rafaj, P.; Amann, M.; Bertok, I.; Cofala, J.; Rao, P.S.; Vardhan, B.H.; Kiesewetter, G.; Sander, R. Managing future air quality in megacities: Co-benefit assessment for Delhi. Atmos. Environ. 2018, 186, 158–177. [Google Scholar] [CrossRef]
- Liu, F.; Klimont, Z.; Zhang, Q.; Cofala, J.; Zhao, L.; Huo, H.; Nguyen, B.; Schöpp, W.; Sander, R.; Zheng, B. Integrating mitigation of air pollutants and greenhouse gases in Chinese cities: Development of GAINS-City model for Beijing. J. Clean. Prod. 2013, 58, 25–33. [Google Scholar] [CrossRef]
- Zhang, S.; Worrell, E.; Crijns-Graus, W.; Wagner, F.; Cofala, J. Co-benefits of energy efficiency improvement and air pollution abatement in the Chinese iron and steel industry. Energy 2014, 78, 333–345. [Google Scholar] [CrossRef]
- Ma, D.; Chen, W.; Yin, X.; Wang, L. Quantifying the co-benefits of decarbonisation in China’s steel sector: An integrated assessment approach. Appl. Energy 2016, 162, 1225–1237. [Google Scholar] [CrossRef]
- Feng, X.Z.; Lugovoy, O.; Qin, H. Co-controlling CO2 and NOx emission in China’s cement industry: An optimal development pathway study. Adv. Clim. Chang. Res. 2018, 9, 34–42. [Google Scholar] [CrossRef]
- Ma, D.; Wang, L.; Yin, X.; Chen, W. Co-benefits of reducing carbon emissions in China’s iron and steel industry. Energy Procedia 2014, 61, 1557–1560. [Google Scholar] [CrossRef]
- Guo, J.-X.; Zhu, L.; Fan, Y. Emission path planning based on dynamic abatement cost curve. Eur. J. Oper. Res. 2016, 255, 996–1013. [Google Scholar] [CrossRef]
- Guo, J.-X.; Fan, Y. Optimal abatement technology adoption based upon learning-by-doing with spillover effect. J. Clean. Prod. 2017, 143, 539–548. [Google Scholar] [CrossRef]
- Yang, X.; Teng, F. The air quality co-benefit of coal control strategy in China. Resour. Conserv. Recycl. 2016, 129, 373–382. [Google Scholar] [CrossRef]
- Wang, L.; Patel, P.L.; Yu, S.; Liu, B.; McLeod, J.; Clarke, L.E.; Chen, W. Win–Win strategies to promote air pollutant control policies and non-fossil energy target regulation in China. Appl. Energy 2016, 163, 244–253. [Google Scholar] [CrossRef]
- Lin, J.; Kang, J.; Khanna, N.; Shi, L.; Zhao, X.; Liao, J. Scenario analysis of urban GHG peak and mitigation co-benefits: A case study of Xiamen City, China. J. Clean. Prod. 2018, 171, 972–983. [Google Scholar] [CrossRef]
- Shrestha, R.M.; Pradhan, S. Co-benefits of CO2 emission reduction in a developing country. Energy Policy 2010, 38, 2586–2597. [Google Scholar] [CrossRef]
- Zhang, S.; Worrell, E.; Crijns-Graus, W.; Krol, M.; de Bruine, M.; Geng, G.; Wagner, F.; Cofala, J. Modeling energy efficiency to improve air quality and health effects of China’s cement industry. Appl. Energy 2016, 184, 574–593. [Google Scholar] [CrossRef]
- Hasanbeigi, A.; Lobscheid, A.; Lu, H.; Price, L.; Dai, Y. Quantifying the co-benefits of energy-efficiency policies: A case study of the cement industry in Shandong Province, China. Sci. Total Environ. 2013, 458, 624–636. [Google Scholar] [CrossRef]
- Guo, X.; Guo, X.; Yuan, J. Impact analysis of air pollutant emission policies on thermal coal supply chain enterprises in china. Sustainability 2014, 7, 75–95. [Google Scholar] [CrossRef]
- Tu, Z.; Shen, R. Can China’s Industrial SO2 Emissions Trading Pilot Scheme Reduce Pollution Abatement Costs? Sustainability 2014, 6, 7621–7645. [Google Scholar] [CrossRef]
- Peng, W.; Yang, J.; Wagner, F.; Mauzerall, D.L. Substantial air quality and climate co-benefits achievable now with sectoral mitigation strategies in China. Sci. Total Environ. 2017, 598, 1076–1084. [Google Scholar] [CrossRef] [PubMed]
- China Iron and Steel Association. China Steel Yearbook; China Iron and Steel Association: Beijing, China, 2016. [Google Scholar]
- China Metallurgical Planning Institute. Steel Demand Is Expected to Fall by 4.8% This Year. Available online: http://forex.hexun.com/2015-12-07/181030343.html (accessed on 22 October 2018).
- Ashina, S.; Fujino, J.; Masui, T.; Ehara, T.; Hibino, G. A roadmap towards a low-carbon society in Japan using backcasting methodology: Feasible pathways for achieving an 80% reduction in CO2. Energy Policy 2012, 41, 584–598. [Google Scholar] [CrossRef]
- Zhang, C.K. Potential of Industrial Energy Conservation and Emission Reduction and Collaborative Control Analysis. Master’s Thesis, Tsinghua University, Beijing, China, 2015. [Google Scholar]
- Planning for Adjustment and Upgrading of Iron and Steel Industry (2016–2020). Available online: http://jxw.panzhihua.gov.cn/xxgk/zdxxgk/yddtgzl/698278.shtml (accessed on 4 May 2018).
- National Development and Reform Commission. National Key Energy Conservation Technologies Promotion Catalogue. Available online: http:// http://www.ndrc.gov.cn/ (accessed on 3 April 2018).
- Guide to Advanced and Applicable Technologies of Energy-Saving and Emission Reduction in Iron and Steel Industry. Available online: https://max.book118.com/html/2017/0514/106736057.shtm/ (accessed on 4 June 2018).
- Application of Advanced Applicable Technology for Energy Conservation and Emission Reduction in Iron and Steel Industry. Available online: https://wenku.baidu.com/view/ae2ff9e9f8c75fbfc77db23e.html (accessed on 5 July 2018).
- National Bureau of Statistics. National Energy Statistics Yearbook; China Statistics Press: Beijing, China, 2016.
- Analysis on the Number of Projects and Landing Rate of China’s Environmental Protection Industry at the End of September 2017. Available online: http://www.chyxx.com/industry/201711/587248.html (accessed on 19 October 2018).
- Li, L.; Yuan, D. Development Report on Trade in Environmental Services; China Environmental Science Press: Beijing, China, 2017. [Google Scholar]
- Worrell, E.; Price, L.; Martin, N. Energy efficiency and carbon dioxide emissions reduction opportunities in the US iron and steel sector. Energy 2001, 26, 513–536. [Google Scholar] [CrossRef]
- Xu, X.Y.; Ren, M.; Gao, J.L. Technology Path of Energy Conservation and CO2 Emissions Reduction of Iron and Steel Industry in Jing-Jin-Ji. Eco-Economy 2017, 33, 38–43. [Google Scholar]
- Division for Climate Change of the National Development and Reform Commission. Study on China’s Greenhouse Gas Inventory in 2008; China Planning Publishing House: Beijing, China, 2004.
- Zhao, B.; Wang, P.; Ma, J.Z.; Zhu, S.; Pozzer, A.; Li, W. A high-resolution emission inventory of primary pollutants for the Huabei region, China. Atmos. Chem. Phys. 2012, 12, 481–501. [Google Scholar] [CrossRef]
- Tan, X.; Lai, H.; Gu, B.; Zeng, Y.; Li, H. Carbon emission and abatement potential outlook in China’s building sector through 2050. Energy Policy 2018, 118, 429–439. [Google Scholar] [CrossRef]
- 13th Five-Year Work Plan for Greenhouse Gas Control. Available online: http://www.gov.cn/zhengce/content/2016-11/04/content_5128619.ht (accessed on 7 June 2018).
- Three-Year Plan of Action for Winning the Blue-Sky Defense War. Available online: http://www.cpad.gov.cn/art/2018/7/3/art_1461_86571.html?from=groupmessage (accessed on 6 May 2018).
- Energy-Saving Technology Is the First Choice for the Steel Industry. Available online: https://wenku.baidu.com/view/a06f2aa36294dd88d1d26b00.html (accessed on 17 November 2018).


© 2019 by the authors. Licensee MDPI, Basel, Switzerland. This article is an open access article distributed under the terms and conditions of the Creative Commons Attribution (CC BY) license (http://creativecommons.org/licenses/by/4.0/).