Article

Distribution of Cd and Cu Fractions in Chinese Soils and Their Relationships with Soil pH: A Meta-Analysis

1
Beijing Key Laboratory of Farmland Soil Pollution Prevention and Remediation, College of Resources and Environmental Sciences, China Agricultural University, Beijing 100193, China
2
College of Resources and Environment Science, Hebei Agricultural University, Baoding 071001, China
*
Author to whom correspondence should be addressed.
Sustainability 2019, 11(2), 337; https://doi.org/10.3390/su11020337
Submission received: 26 November 2018 / Revised: 22 December 2018 / Accepted: 28 December 2018 / Published: 11 January 2019

Abstract

:
Soil contamination by potentially toxic metals (PTMs) has become a public concern in China. However, the distribution and controlling factors of soil PTM fractions remain largely unknown, limiting our ability to assess their health risks and thus to make sound controlling polices. Here, we investigate the fraction distribution of cadmium (Cd) and copper (Cu) in Chinese soils and their relationships with soil pH, based on a national meta-analysis of 163 published literatures. Exchangeable Cd in southern China accounted for 19.50 ± 14.97% of total Cd, significantly (p < 0.01) higher than the corresponding 13.42 ± 6.95% in northern China. Potentially available fractions constituted about 60% of total Cd at the national scale. By contrast, about half of soil Cu existed in unavailable residual fraction. Phytoavailable (i.e., exchangeable) fraction accounted for only 2.71 ± 1.65% and 2.54 ± 1.58% of total Cu in northern and southern China, respectively. Percentages of exchangeable Cd and Cu were negatively correlated (p < 0.01) with soil pH, while potentially available fractions increased significantly (p < 0.05) with soil pH. Our results provide the first national assessment of Cd and Cu fraction distribution and their responses to soil pH variations, highlighting the necessity to consider their fraction distribution and soil properties when assessing the health risks of soil PTM contamination in China.

1. Introduction

Soil contamination by potentially toxic metals (PTMs) has drawn much attention in China during the past decades [1,2,3], since they may endanger human health through the transfer from soil to food [4,5,6,7]. These PTMs in soils mainly come from various anthropogenic activities, such as mining & smelting, fuel burning, fertilization, and sewage irrigation [1,3,8,9]. Preliminary estimates showed that 10–17% of Chinese croplands were polluted with PTM concentrations exceeding the Class II limits in China’s soil environmental quality standard, and 13.8% of the cereals were contaminated by PTMs [3,10]. A nationwide survey, conducted between 2005 and 2013 by the Ministry of Environmental Protection (MEP) and Ministry of Land and Resources (MLR), suggested that eight PTMs (i.e., Lead (Pb), Cadmium (Cd), Mercury (Hg), Arsenic (As), Copper (Cu), Nickel (Ni), Zinc (Zn), and Chromium (Cr)) in 13.33% of the soil samples exceeded their Class II concentration limits in China’s soil environmental quality standard [11,12]. Although the current status based on total concentration is still in an acceptable level, continuous pollutant loadings will increase soil PTM contamination in China [2,6].
Previous studies have reached a consensus that fraction distribution, rather than total concentration, is the governing factor for plant uptake and bioaccumulation of PTMs [13,14,15]. Conceptually, PTMs in soil are usually bound to organic and inorganic solid components by various processes, and thus with different phytoavailability [13,16,17]. Firstly, weakly bound exchangeable fraction is smaller in quantity, but higher in availability. Therefore, enrichments of PTMs by plant are commonly found to increase with the concentrations of exchangeable fraction [14,15]. Secondly, fractions more strongly bound to minerals and organic matter, are usually less available to plants. However, these fractions could be mobilized into available forms due to a change in environmental conditions, and therefore are considered as potentially available [18,19,20,21]. For example, studies reported that PTMs bound to carbonates were released to solution during soil acidification (i.e., soil pH decline) [22,23,24]. Finally, PTMs sequestered in the crystals of non-carbonate minerals are assumed as stable under conceivable natural conditions, and are usually thus considered as non-available fraction [17,18,19]. Therefore, understandings of fraction distribution and its influencing factors are crucial to asses the health risk of soil PTM contamination, and thus to make sound controlling policies.
Chinese soils have during the past three decades suffered from significant acidification in both agricultural and natural ecosystems, due to over N-fertilization [25] and atmospheric acidic deposition [26,27]. Understanding the relationships between PTM fraction distribution and soil pH is thus a prerequisite in order to assess the impact of soil acidification on PTM contamination in China. As a key property, soil pH has been found as the primary factor controlling the plant assimilation of PTMs [9,15,28]. Regional surveys showed that PTMs in plant tissues increased with soil pH decrease [29,30,31]. Furthermore, the enrichment factors of PTMs, relative to their total concentrations in soil, were negatively correlated with soil pH [32,33,34]. Experiments indicated that temporary soil acidification accelerated the release of soil PTMs [23,35], while increasing soil pH reduced their leaching and plant uptake [36,37,38]. So far, however, PTM fraction distribution and their relationships between soil pH remain unknown at the national scale. Such inadequacies constituted a knowledge gap between their total concentration and potential health risk, and hinder our ability to evaluate the influence of soil acidification on crop PTM contamination. In addition, Cd and Cu were the most polluted ones among eight investigated PTMs. They have been seen to exceed standard by the rates of 7.0% and 2.1%, respectively, in the national survey [11]. In this study, we therefore investigate the fraction distributions of Cd and Cu in Chinese soils and their relationships with soil pH, based on a national meta-analysis.

2. Materials and Methods

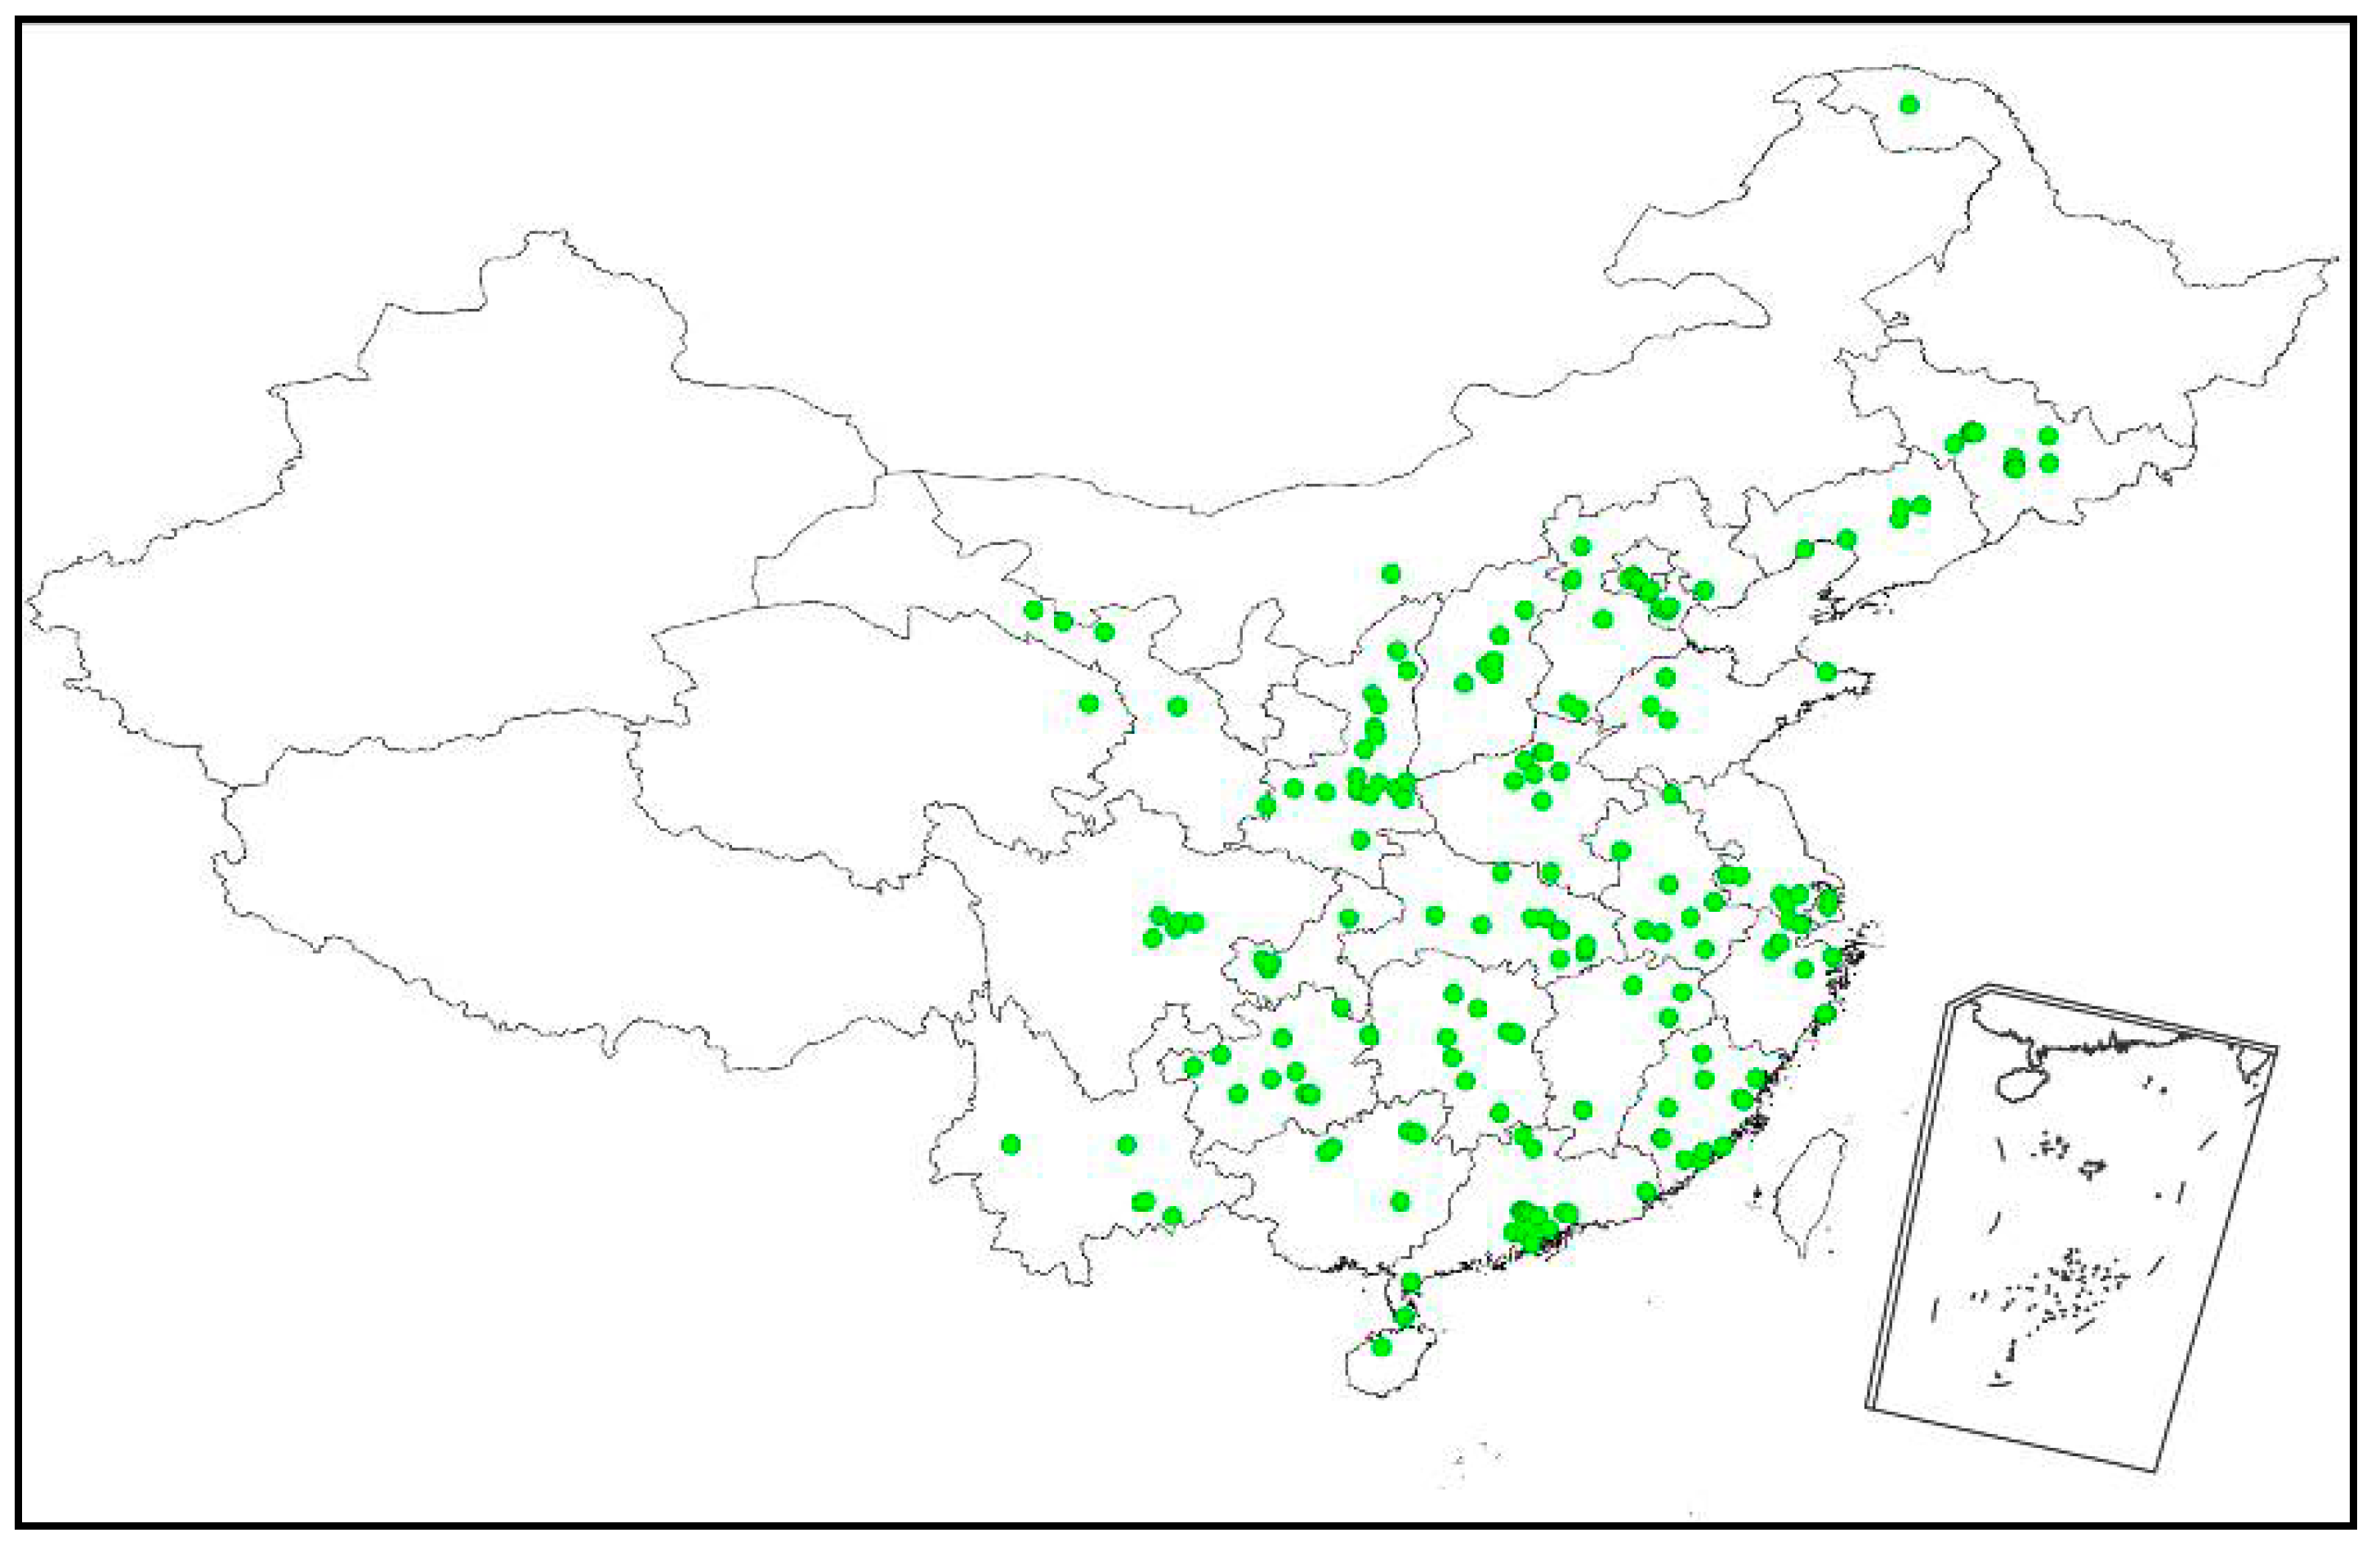
2.1. Data Compiliation

Fractions and total concentration of soil Cd and Cu were collected from published literatures (1990–2017) in China Knowledge Resource Integrated Database (CNKI: Beijing, China). “Soil heavy metal” was the key research word, using the term “fraction” to refine the hits. Total concentration and fractions of soil Cd and Cu as well soil pH were subsequently manually extracted from the selected literatures. Soil Cd and Cu fractions used in this study were analyzed according to the commonly used Tessier or BCR (Community Bureau of Reference) procedures [17,18,19]. Exchangeable, acid-soluble (i.e., bound to carbonate minerals), reducible (i.e., bound to Fe & Mn oxides), oxidizable (i.e., bound to organic matter) and residual (i.e., sequestered in non-carbonate minerals) fractions were included in our database. These fractions were sequentially extracted using solutions of salt, acetic acid, hydroxylamine hydrochloride, hydrogen peroxide, and nitric acid, respectively [17,18,19]. Since BCR schemes do not determine exchangeable and carbonate bound fraction separately, data for these two fractions were from the results measured using Tessier method. In this study, total concentrations of Cd and Cu were converted to mg kg−1 if other units were used in the original references. Five fractions were presented as their percentages of the total concentration, since most collected literatures reported them in percentage rather than absolute concentration. If original references presented the fractions in absolute concentration, their percentages were manually calculated relative the total concentration. In addition, other relevant information (e.g., site location, soil type and land use type) was collected if available in the original references. A total of 514 sites from 163 references were included in our database (Figure 1 and Supplementary Table S1).

2.2. Data Classification

We classified the data into northern China and southern China groups, due to the distinct geographical distribution of soil pH and PTM contamination characteristics in these two regions. Data in northern China group were distributed in the northern, northeastern and northwestern China. Typical soils in these regions include cultivated loessial soils (Loessi-Orthic Primosols), fluvo-aquic soils (Ochri-Aquic Cambosols), and black soils (Udic Isohumosols). These soils are usually circumneutral or alkaline, because of lower chemical weathering. Data in southern China group covered the data from southern, southeastern and southwestern China, where red soils (Argi-Udic Ferrosols) and yellow soils (Ali-Perduic Agrosols) are the most common soil types. These soils are weakly to strongly acidic, due to long-term weathering under subtropical monsoon climate. Detailed pedogenic properties of all these soil types are described in Chinese soil taxonomy system which is basically similar to the FAO (Food and Agriculture Organization of the United Nations) system [39]. In our database, soil pH for northern China group was significantly higher (p < 0.01) than that for southern China group, with average pH values of 7.89 and 5.95, respectively. In addition, hills and mountains are the common landforms in southern China, with more mineral resources in this region [40]. Irrigation water contaminated by mining and smelting activities is considered to be the major source of PTMs in soil and crop [41]. By contrast, mineral resources and mining activities in northern China are much less than those in southern China [40]. According to the existing literatures, PTM contaminations in agricultural soils and crops were mainly reported in southern China [3,6,8,9].

3. Results and Discussions

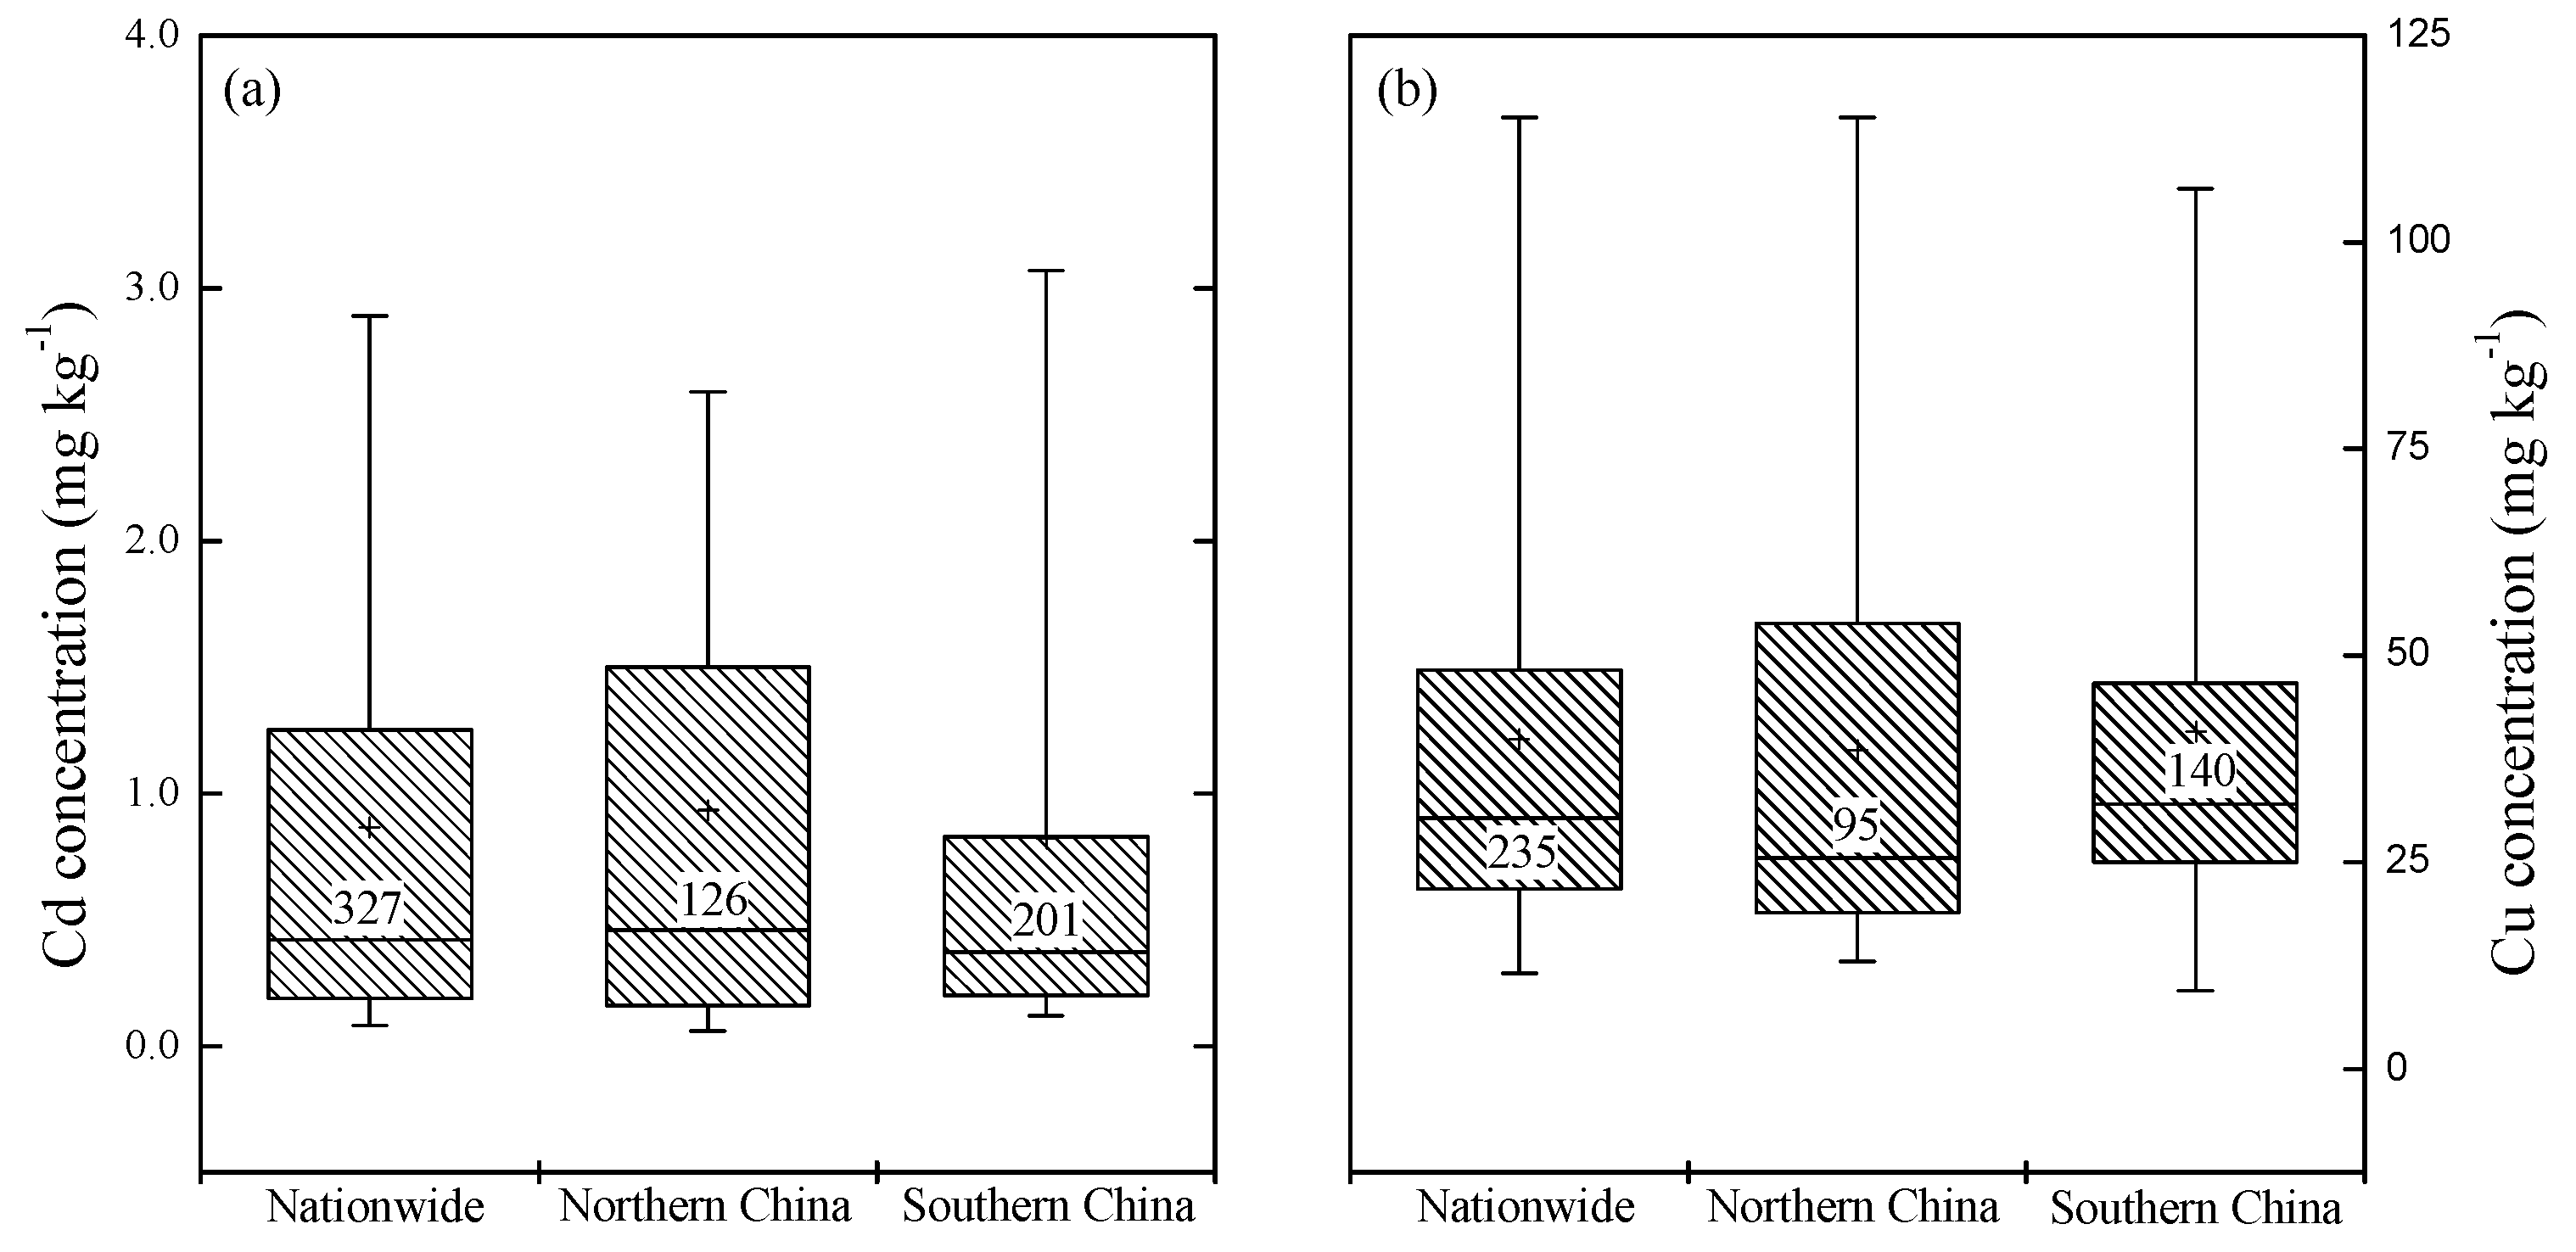
3.1. Total Concentration of Cd and Cu in Chinese Soils

Total concentrations of Cd and Cu at the national and regional scales are shown in Figure 2. At the national scale, the average and median Cd concentrations were 0.86 and 0.42 mg kg−1, respectively (Figure 2a). Of the investigated soils 27% had Cd concentration lower than the Class I limit (i.e., 0.2 mg/kg) defined by the China’s soil environmental quality standard [12], while 40% of them were contaminated by Cd with concentrations higher than the corresponding Class II standard (i.e., 0.6 mg kg−1). These data show severer Cd contamination than the result of national survey [11]. In northern China, the average and median total soil Cd levels were 0.93 and 0.46 mg kg−1, respectively. The corresponding values in southern China were 0.82 and 0.37 mg kg−1, respectively. No significant difference in the total Cd concentration was found between the northern and southern China data groups (p = 0.38). Copper (Cu) concentrations were much higher than Cd, with national average and median values of 39.90 and 30.36 mg kg−1, respectively (Figure 2b). This is close to the result of Niu et al. (2013), showing average and median Cu concentration of 40.5 and 26.6 mg kg−1, respectively [4]. Song et al. (2014) reported a total Cu concentration of 30.67 ± 12.19 mg kg−1 (n = 86) in Chinese croplands [10]. In our database, Cu concentration in 61% of the soils was lower than the Class I concentration limit in Chinese soil environmental quality standard, while 6% of them were higher than the corresponding Class II standard. In addition, significantly different total Cu concentration was not observed between northern and southern China, with averages of 38.61 and 40.77 mg kg−1, respectively. This Cu contamination status is basically similar to the results from national survey [11] and other meta-analysis [3,4].

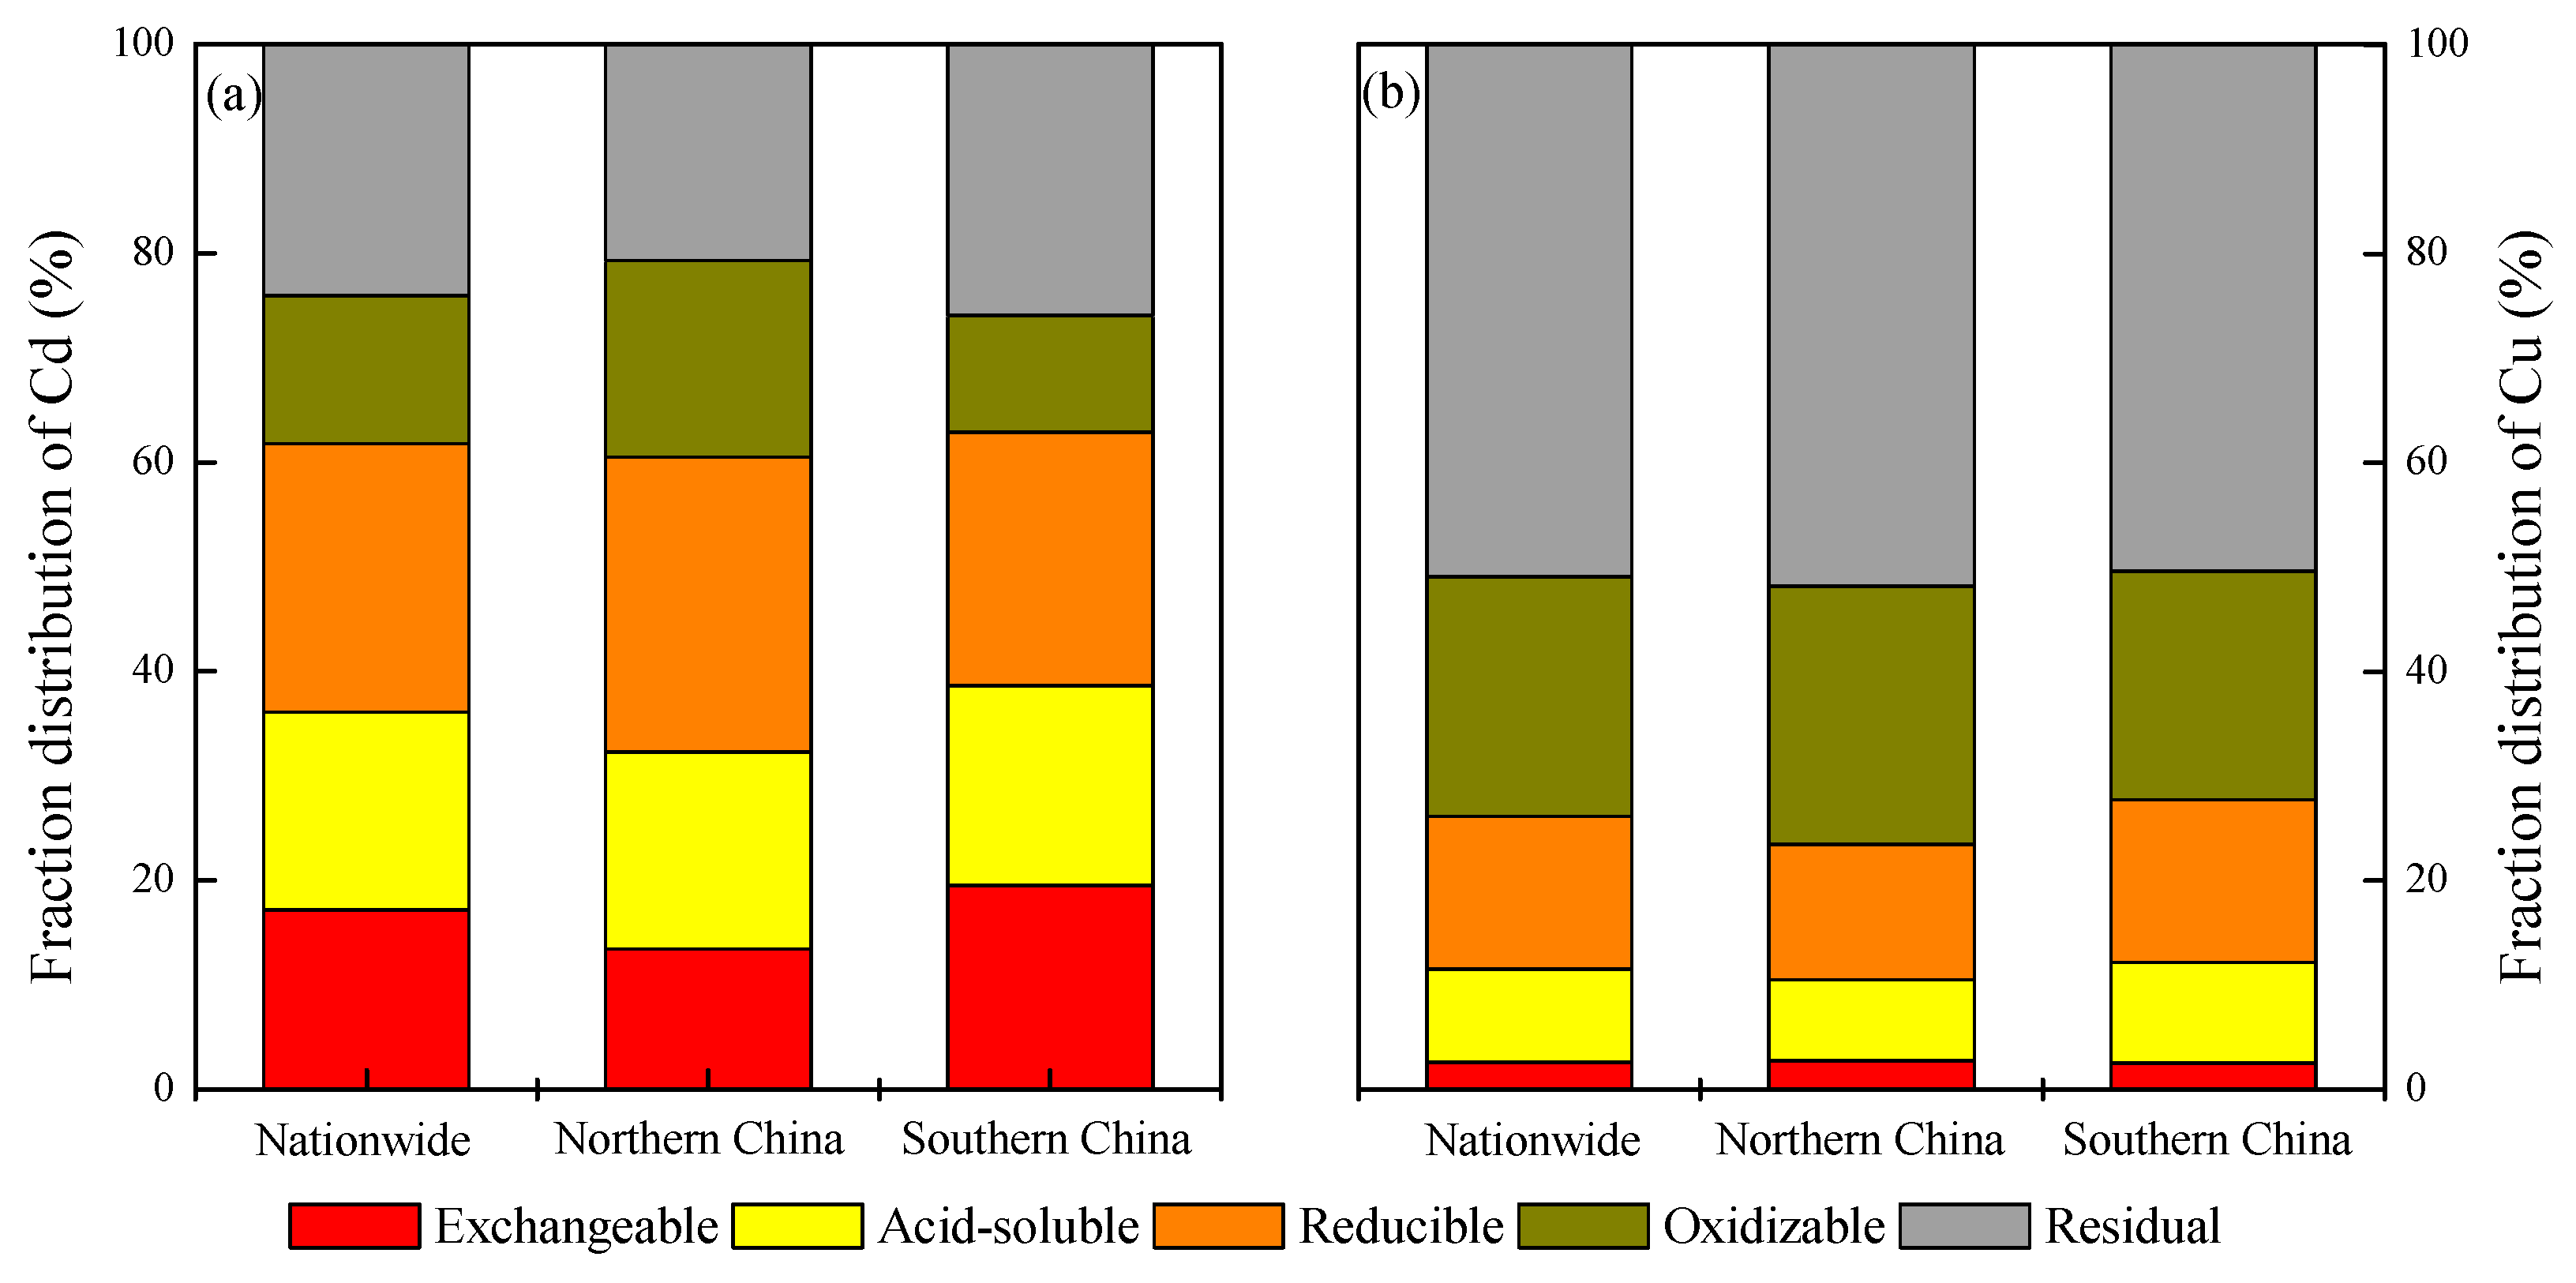
3.2. Fraction Distribution of Cd and Cu in Chinese Soils

Fraction distribution of soil Cd is shown in Figure 3a. At the national scale, exchangeable Cd accounted for 17.13 ± 13.44% of the total amount, with the 10, 50 (i.e., median) and 90 percentiles of 4.88%, 15.97% and 38.55%, respectively. This percentage range is close to the result in paddy soils in southern China [28]. Such high percentage of exchangeable Cd may account for the frequently reported Cd enrichments in plants [32,34,42], since it is considered as the most phytoavailable faction. About 60% of total Cd existed as potentially available fractions, with the average percentages of 17.13%, 18.95% and 25.72% for acid-soluble, reducible and oxidizable fraction, respectively. Totally, these four fractions took up ca. 80% of total Cd, showing its higher health risk in China and highlighting the importance to stabilize these potentially available fractions for soil Cd contamination remediation. The percentage of exchangeable Cd in northern China was 13.42 ± 6.95%, with the 10, 50 and 90 percentiles of 4.81%, 15.25% and 25.17%, respectively. The corresponding values in southern China were 19.50 ± 14.97, 5.00, 16.00, and 48.70%, respectively, which are significantly (p < 0.01) higher than those in northern China. This means that there is a higher health risk due to soil Cd contamination in southern China, though total Cd concentrations were not significantly different between northern and southern China (Figure 2a).
As shown in Figure 3b, fraction distribution of Cu was clearly different from that of Cd. Most of soil Cu existed as non-available residual fraction, with the average and median percentages of 51.94% and 55.69%, respectively, at the national scale. Moreover, there was no significant difference (p = 0.11) in the percentage of residual Cu between northern and southern China, with average values of 51.84% and 50.40%, respectively. The exchangeable Cu fraction was only minor, with percentages of 2.61 ± 1.62%, 2.71 ± 1.65% and 2.54 ± 1.58% in nationwide, northern and southern China, respectively. Moreover, the difference in percentage exchangeable Cu between northern and southern China was not significant (p = 0.34). Acid-soluble, reducible and oxidizable fractions accounted for 18.91 ± 9.03%, 14.62 ± 11.50% and 22.92 ± 16.49% of the total Cu, respectively, at the national scale. Moreover, oxidizable Cu represented 24.71 ± 15.75% in southern China, which is significantly higher than the corresponding 21.88 ± 16.79% in northern China (p = 0.03). This is likely duo the generally higher soil organic matter content in southern China [43]. This fraction distribution pattern is consistent with the results in other literatures [20,44], indicating a lower health risk due to soil Cu contamination in China.
Our study also showed the inaccuracy in current fractionation methods of soil PTMs. For example, substantial acid-soluble fractions for both Cd and Cu were found in southern China, where soils are acidic with an average soil pH of 5.95 (Figure 3). However, significant carbonate minerals should not be expected in such acidic soils, according to the well known concepts in soil science [45,46]. This divergence is mainly due to the poor extractant selectivity, meaning that fractions other than carbonate bound can also be extracted by the dilute acetic acid [16]. In addition, strong bonds with mineral surfaces (e.g., specific adsorption) constitute important ways to retain PTMs in soil [45,46], while this fraction is not well quantified in current fractionation methods. It should be noticed that extraction procedures in BCR and Tessier methods were originally designed for sediments under reducing and circumneutral conditions [18,19]. However, soils are distinct from sediments in composition, properties, and thus in the retaining mechanisms of PTMs. This means that the same operational procedure may extract different PTM pools in soil and sediment, due to the poor selectivity of extractants. Moreover, this difference may vary with soil composition and properties. Therefore, enough attentions to these methodological artifacts should be taken when using fraction data to explain and predict the changes in soil PTMs.

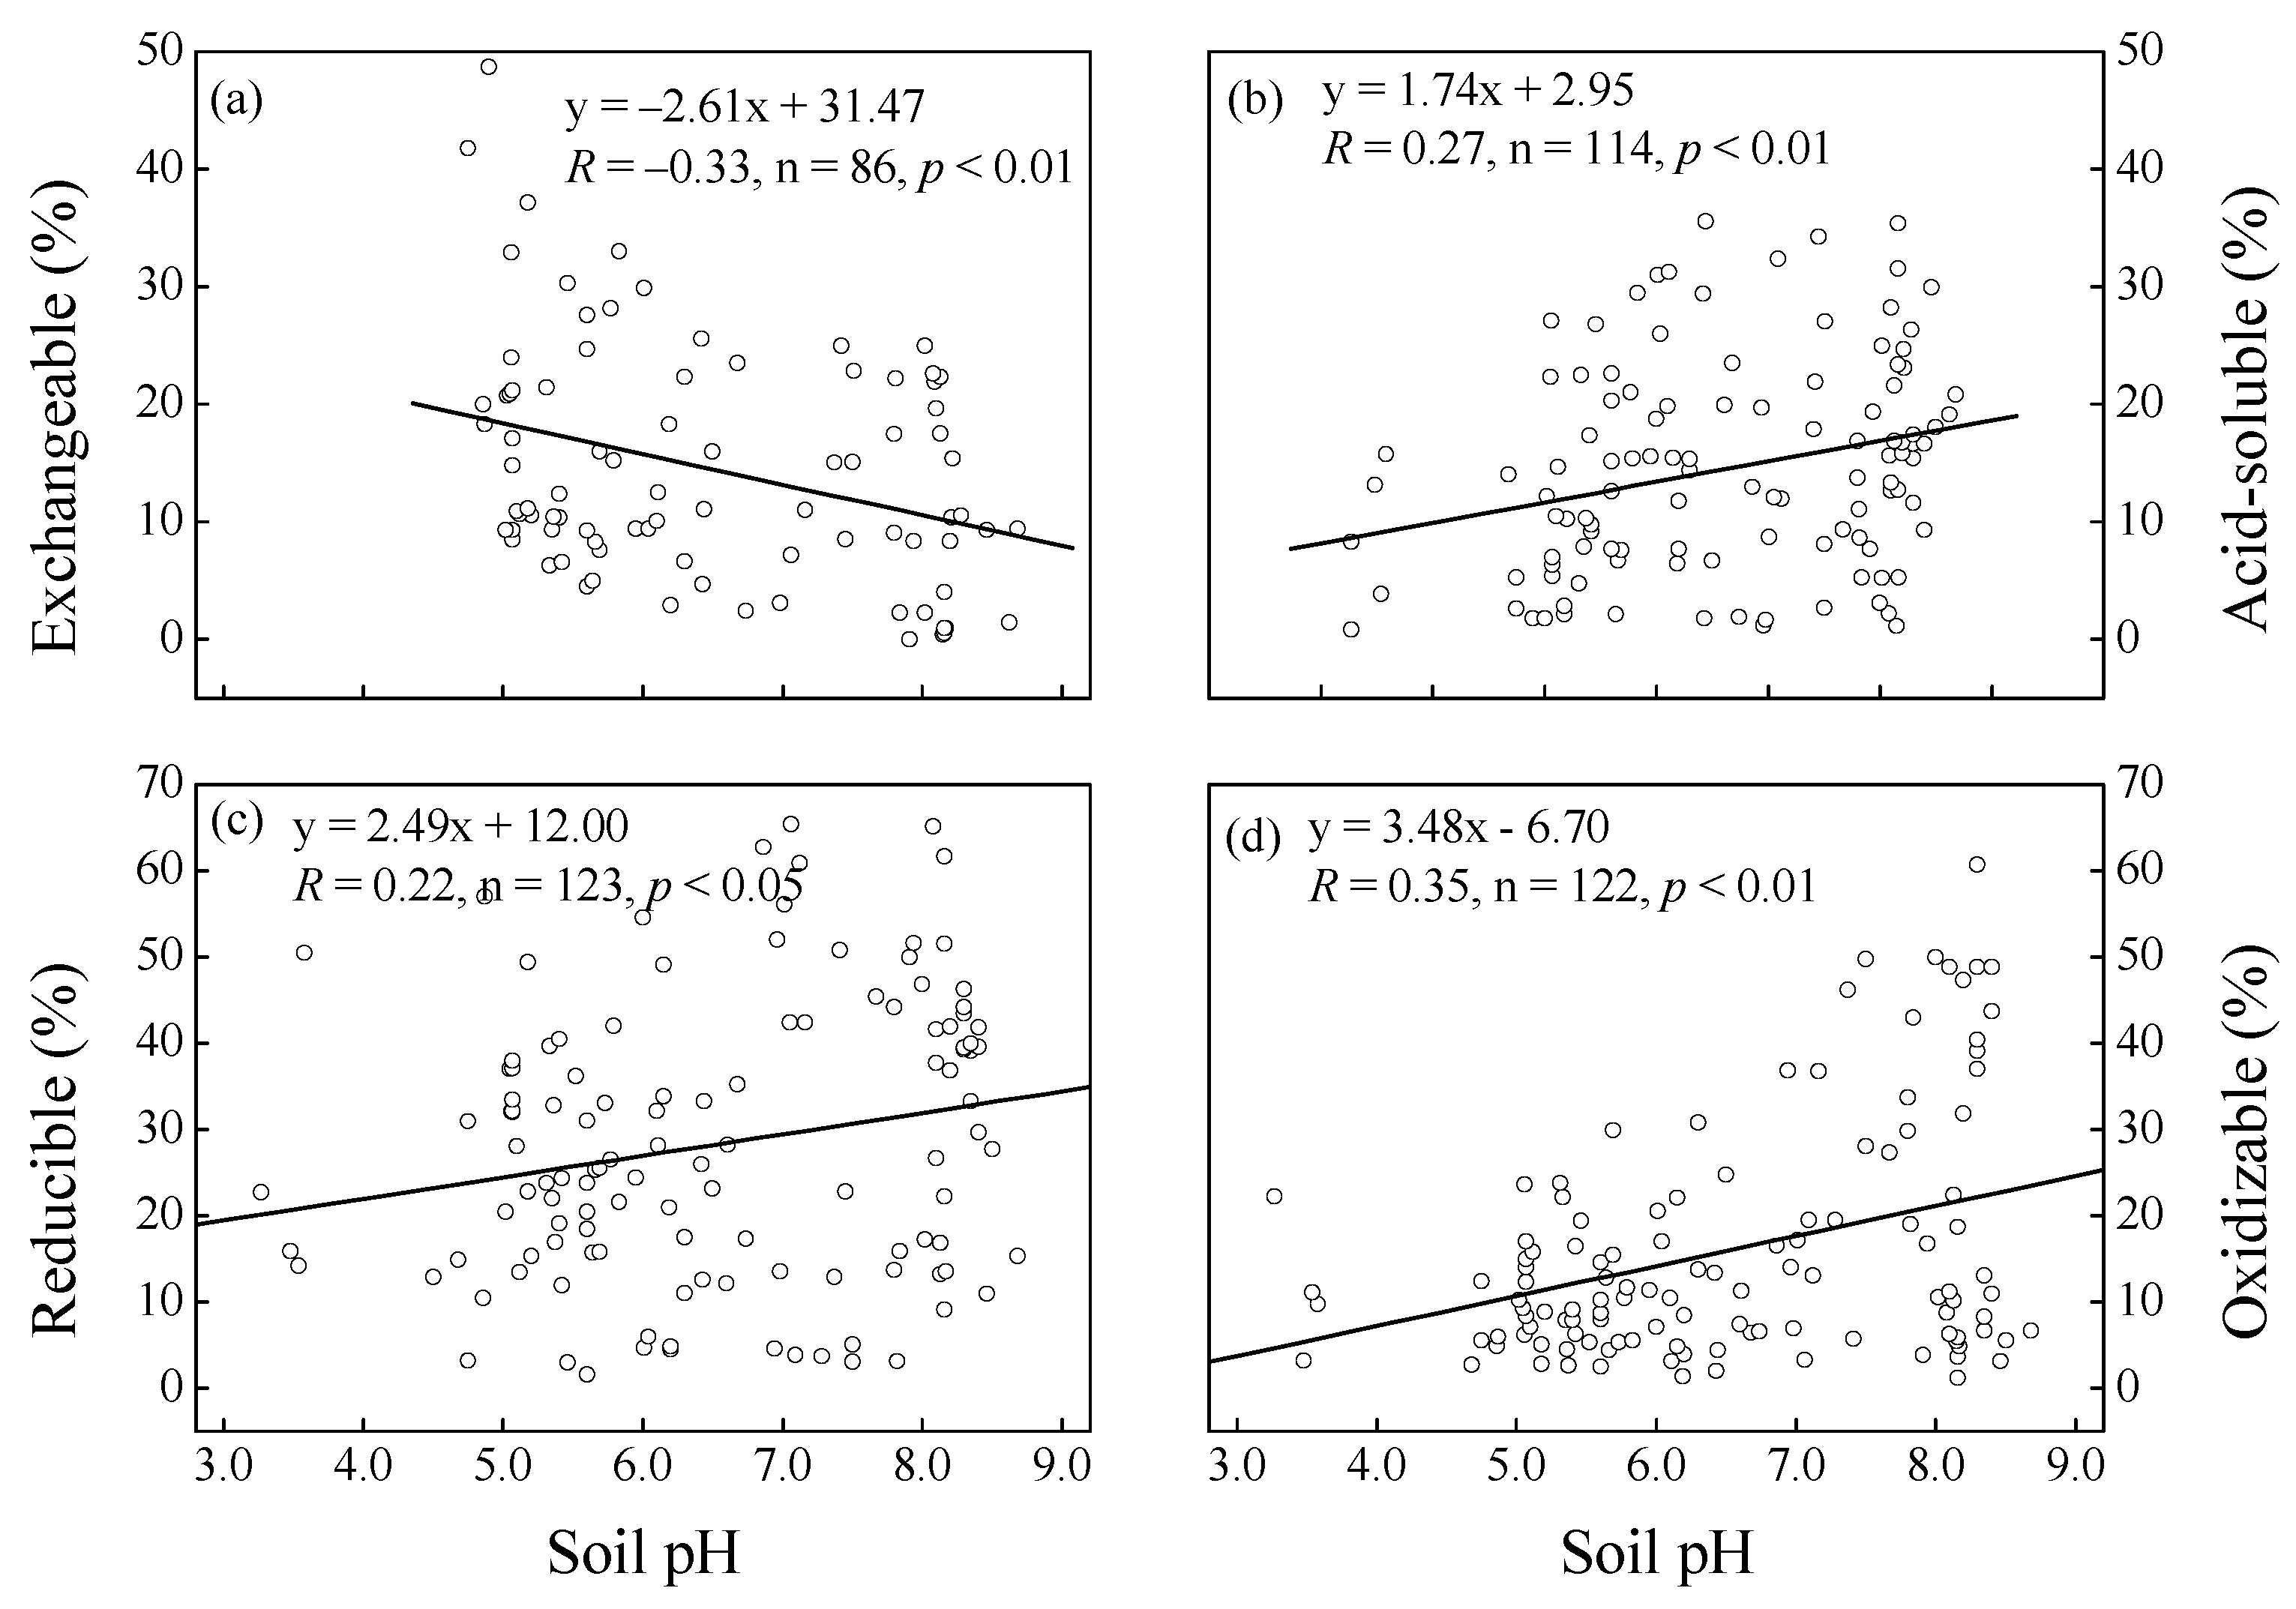
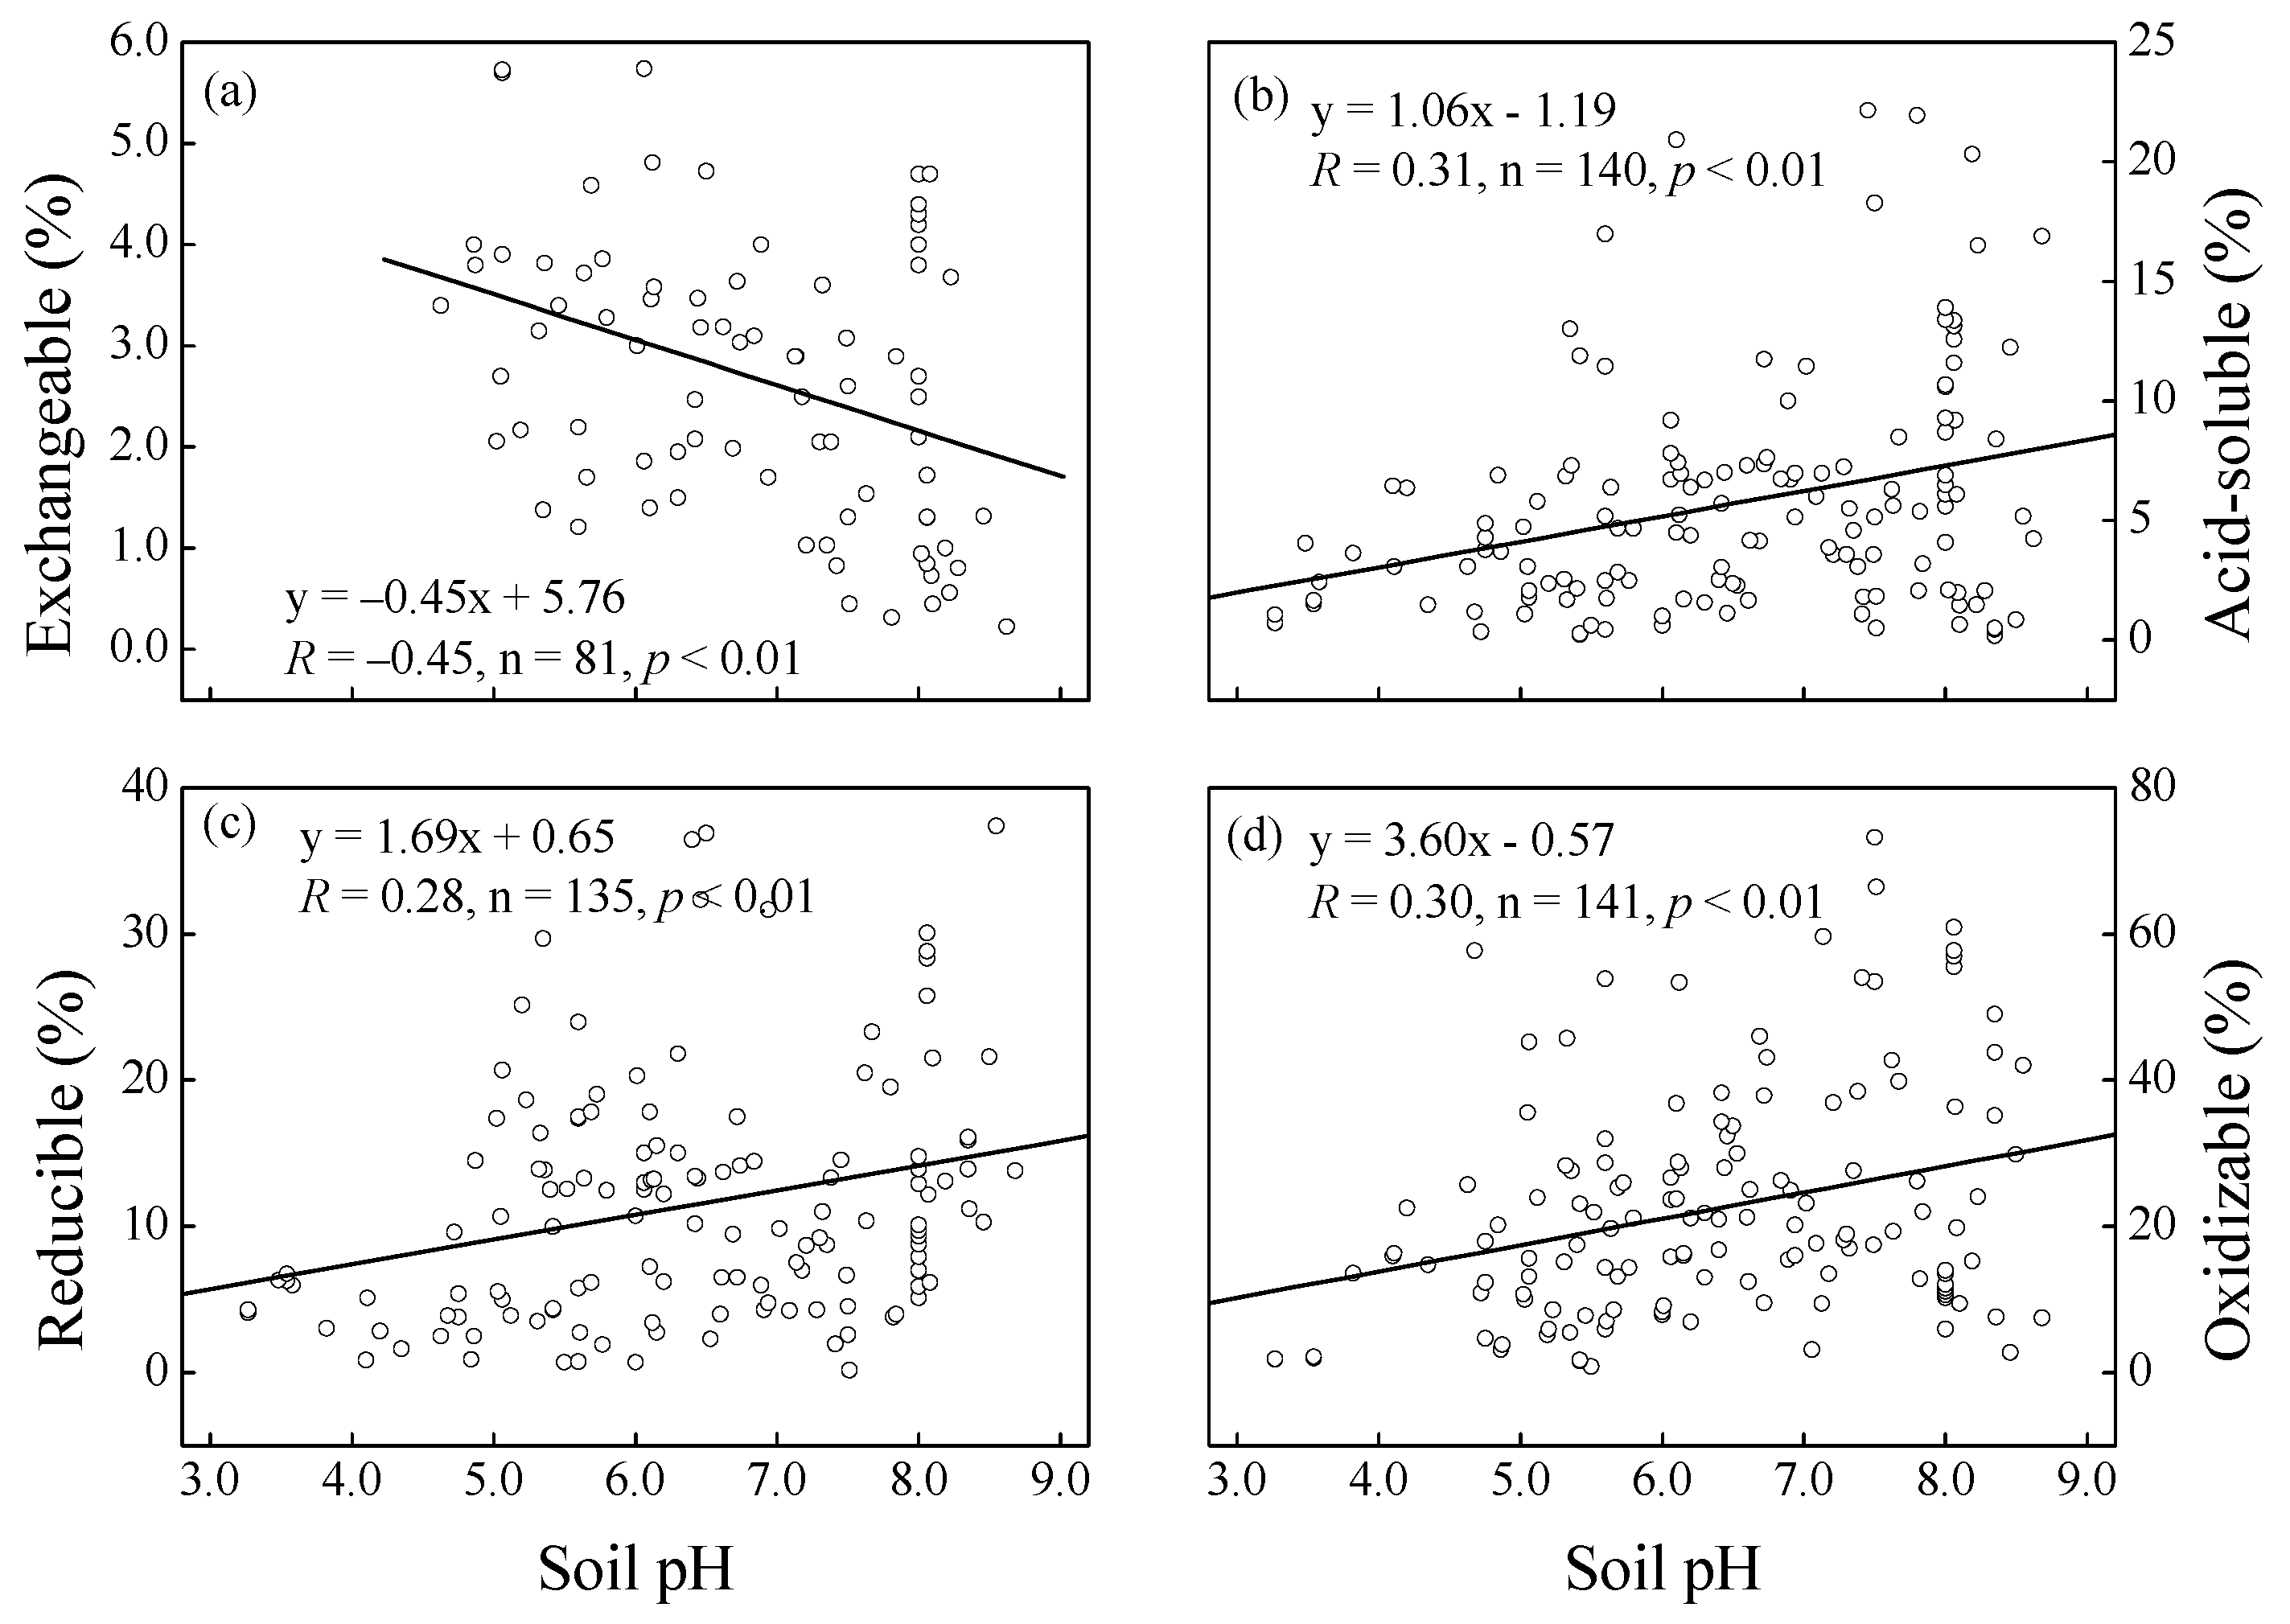
3.3. Influence of Soil pH on the Fraction Distribution of PTMs

The relationships between Cd fraction percentages and soil pH are shown in Figure 4. There was a negatively correlation (p < 0.01) between exchangeable Cd percentage and soil pH. This means that exchangeable Cd is higher in acidic than in alkaline soils, accounting for the significant difference in exchangeable Cd percentage between northern and southern China (Figure 3a). Contrarily, the percentages of acid-soluble, reducible and oxidizable Cd increased significantly (p < 0.05) with soil pH increase. Such relationships indicate that there is more Cd strongly retained in alkaline soils. As shown in Figure 5, the relationships between Cu fractions and soil pH were basically similar with those for Cd fractions. However, the regression slopes for exchangeable, acid-soluble and reducible Cu were lower than the corresponding ones for Cd fractions, due to the lower percentages of these Cu fractions (Figure 3). These relationships suggest that the phytoavailability of PTMs in acidic soils is higher than those in alkaline soils, under the same total concentration. Therefore, the health risk is much higher in southern China, even though the total concentration is similar to that in northern China (Figure 2). This postulation is well supported by regional surveys showing that phytoavailability and bio-enrichment of PTMs were correlated inversely with soil pH [29,31,32,34].
These spatial relationships between PTM fractions and soil pH may be extrapolated to predict the temporal effects of soil acidification. As shown in Figure 4 and Figure 5, the percentage of exchangeable fraction increased with soil pH decrease, meaning that soil acidification may enhance the percentage and thereby phytoavailability of PTMs. Likewise, potentially mobilizable fractions may be mobilized into available ones, since all these fractions significantly decreased with soil pH decline. Conceptually, soil acidification may cause increases in mineral dissolution, positive surface charges, and the protonation of organic matter. All these processes can promote the release of soil PTMs otherwise strongly bound to solid phases [45,47]. Laboratory experiments confirmed that soil acidification contributed significantly to the leaching of PTMs and increased their bioavailability [23,24,48]. Field experiment at Rothamsted Research station showed that 60–90% of Cd was mobilized from an acidic soil (pH = 4) during the past 100 years [22]. In China, over N-fertilization has caused significant soil acidification in major croplands, with a pH decline of between 0.13–0.8 [25]. During the similar period, soil acidification also occurred across Chinese forest and grasslands mainly due to the acidic atmospheric deposition [26,27]. According to our results, such soil acidification may have increased the phytoavailability and heath risk due to PTM contamination of crops in China.

3.4. Implications for the Assessment and Remediation of PTM Contamination

There are significant differences between the PTM fractions in their relative amounts and phytoavailability, which should be considered in the risk assessment and remediation of soil PTM contamination. Firstly, the available fraction (i.e., exchangeable) takes up only minor portion of the total amount, and is highly dependent on soil properties. For example, regional surveys showed that exchangeable faction of PTMs significantly increased with soil organic matter content [14,29], but decreased with soil pH [14,28]. These governing factors may account for the observed facts that soil properties controlled the bio-enrichment of PTMs [28,32,34]. Therefore, exchangeable fraction, rather than total concentration, should be used as the reasonable proxy when assessing the status and health risks of soil PTM contamination. Our results showed significant increases in exchangeable Cd and Cu percentages with soil pH decrease, suggesting a higher health risk in acidic soils under the same total PTM concentration. Therefore, PTM contamination should be controlled more strictly in southern China, due to the acidic nature of soils in this region. Current standard based on total PTM concentration may be under-protective in southern China, but over-protective in northern China. Secondly, changes in soil properties should be considered when predicting the pollution risks. Chinese soils are experiencing significant changes in soil pH [25,26,27] and organic carbon content [43,49]. Based on previous literatures, these changes in fundamental soil properties may cause broad impacts to the fraction distribution and phytoavailability of PTMs [24,50]. However, such influences have not been well assessed, especially at the regional and national scale. Thirdly, immobilizing the available fraction, rather than decreasing total concentration, should be the top priority to minimize the transfer of PTMs from soil to the food chain. Studies showed that increasing soil pH, by addition of lime or biochar to acid soils, significantly reduced the bioaccumulation of PTMs [36,37,38,51]. Although hyper-accumulating plants help to reduce the concentration of PTMs [52,53], other fractions may replenish the available fraction due to the essential control of soil properties (e.g., soil pH and organic matter).

4. Conclusions

In our database, the median values of soil Cd and Cu concentration were 0.42 and 30.36 mg/kg, respectively, without significant difference between northern and southern China. Exchangeable fraction accounted for 19.50 ± 14.97% of total Cd in southern China, which is significantly (p < 0.01) higher than the corresponding 13.42 ± 6.95% in northern China. About 80% of soil Cd existed in exchangeable, acid-soluble, reducible, and oxidizable factions, indicating its high phytoavailability and transfer potential from soil to plant, especially in southern China where soils are usually acidic. By contrast, unavailable residual fractions constituted about half of the total Cu. There were only 2.71 ± 1.65% and 2.54 ± 1.58% of total Cu distributed in the exchangeable pool, in northern and southern China, respectively. This fraction distribution of soil Cu suggests a lower health risk, compared with that predicted based on total Cu concentration. Fraction distribution of Cd and Cu were significantly controlled by soil pH. Percentages of exchangeable fraction increased (p < 0.01) with soil pH decline, while other mobilizable fractions showed clear increases in their percentages with soil pH. Our results provided the first assessment of soil Cd and Cu fraction distribution at the national scale, and further clarified the influence of soil pH on PTMs fraction distribution. These findings highlighted the necessity to consider their fraction distribution and soil properties (e.g., soil pH, and organic matter) when evaluating the health risks of soil PTM contamination in China. Moreover, these results imply that the on-going soil acidification in China may have enhanced the mobilization of PTMs, accelerating their transfer from soil to food chain.

Supplementary Materials

The following are available online at https://www.mdpi.com/2071-1050/11/2/337/s1, Table S1: A list of reference used in this meta-analysis.

Author Contributions

Y.N., J.G. designed the research. X.Z., B.L. and Y.W. collected and analyzed the data. Y.N., J.G. wrote the manuscript.

Funding

This research was funded by National Natural Science Foundation of China (41230856).

Conflicts of Interest

The authors declare no conflict of interest.

References

  1. Hu, H.; Jin, Q.; Kavan, P. A Study of heavy metal pollution in China: Current status, pollution-control policies and countermeasures. Sustainability 2014, 6, 5820–5838. [Google Scholar] [CrossRef]
  2. Zhao, F.; Ma, Y.; Zhu, Y.; Tang, Z.; McGrath, S.P. Soil contamination in China: Current status and mitigation strategies. Environ. Sci. Technol. 2015, 49, 750–759. [Google Scholar] [CrossRef] [PubMed]
  3. Zhang, X.; Zhong, T.; Liu, L.; Ouyang, X. Impact of soil heavy metal pollution on food safety in China. PLoS ONE 2015, 10, e0135182. [Google Scholar] [CrossRef] [PubMed]
  4. Niu, L.; Yang, F.; Xu, C.; Yang, H.; Liu, W. Status of metal accumulation in farmland soils across China: From distribution to risk assessment. Environ. Pollut. 2013, 176, 55–62. [Google Scholar] [CrossRef] [PubMed]
  5. Fang, Y.; Sun, X.; Yang, W.; Ma, N.; Xin, Z.; Fu, J.; Liu, X.; Liu, M.; Mariga, A.M.; Zhu, X.; et al. Concentrations and health risks of lead, cadmium, arsenic, and mercury in rice and edible mushrooms in China. Food Chem. 2014, 147, 147–151. [Google Scholar] [CrossRef] [PubMed]
  6. Chen, H.; Teng, Y.; Lu, S.; Wang, Y.; Wang, J. Contamination features and health risk of soil heavy metals in China. Sci. Total Environ. 2015, 512–513, 143–153. [Google Scholar] [CrossRef]
  7. Race, M.; Ferraro, A.; Fabbricino, M.; Marca, A.L.; Panico, A.; Spasiano, D.; Tognacchini, A.; Pirozzi, F. Ethylenediamine-N,N′-Disuccinic Acid (EDDS)—Enhanced flushing optimization for contaminated agricultural soil remediation and assessment of prospective Cu and Zn transport. Int. J. Environ. Res. Public Health 2018, 15, 543. [Google Scholar] [CrossRef]
  8. Zhang, X.; Chen, D.; Zhong, T.; Zhang, X.; Cheng, M.; Li, X. Assessment of cadmium (Cd) concentration in arable soil in China. Environ. Sci. Pollut. Res. 2015, 22, 4932–4941. [Google Scholar] [CrossRef]
  9. Jing, F.; Chen, X.; Yang, Z.; Guo, B. Heavy metals status, transport mechanisms, sources, and factors affecting their mobility in Chinese agricultural soils. Environ. Earth Sci. 2018, 77, 104. [Google Scholar] [CrossRef]
  10. Song, W.; Chen, B.; Liu, L. Soil heavy metal pollution of cultivated land in China. Res. Soil Water Conserv. 2013, 20, 293–298, (In Chinese with English abstract). [Google Scholar]
  11. Ministry of Land and Resources, PRC. Report on the National Soil Contamination Survey. (In Chinese). Available online: http://www.mlr.gov.cn/xwdt/jrxw/201404/t20140417_1312998.htm (accessed on 27 August 2018).
  12. Ministry of Environmental Protection, PRC. Environmental quality standard for soils GB 15618-1995. (In Chinese). Available online: http://www.zbgb.org/e/down.php?id=478530 (accessed on 8 December 2018).
  13. Harmsen, J. Measuring bioavailability: From a scientific approach to standard method. J. Environ. Qual. 2007, 36, 1420–1428. [Google Scholar] [CrossRef] [PubMed]
  14. Zhang, J.; Li, H.; Zhou, Y.; Dou, L.; Cai, L.; Mo., L.; You, J. Bioavailability and soil-to-crop transfer of heavy metals in farmland soils: A case study in the Pearl River Delta, South China. Environ. Pollut. 2018, 235, 710–719. [Google Scholar] [CrossRef] [PubMed]
  15. Römkens, P.F.A.M.; Guo, H.; Chu, C.; Liu, T.; Chiang, C.; Koopmans, G.F. Prediction of Cadmium uptake by brown rice and derivation of soil–plant transfer models to improve soil protection guidelines. Environ. Pollut. 2009, 157, 2435–2444. [Google Scholar] [CrossRef]
  16. Hass, A.; Fine, P. Sequential selective extraction procedures for the study of heavy metals in soils, sediments, and waste materials—A critical Review. Crit. Rev. Environ. Sci. Technol. 2010, 40, 365–399. [Google Scholar] [CrossRef]
  17. Rauret, G. Extraction procedures for the determination of heavy metals in contaminated soil and sediment. Talanta 1998, 46, 449–455. [Google Scholar] [CrossRef]
  18. Tessier, A.; Campbell, P.G.C.; Bisson, M. Sequential extraction procedure for the speciation of particular trace elements. Anal. Chem. 1979, 51, 844–851. [Google Scholar] [CrossRef]
  19. Ure, A.M.; Quevauviller, Ph.; Muntau, H.; Griepink, B. Speciation of heavy metals in soils and sediments. An account of the improvement and harmonization of extraction techniques undertaken under the auspices of the BCR of the commission of the European Communities. Intern. J. Environ. Anal. Chem. 1993, 51, 135–151. [Google Scholar] [CrossRef]
  20. Cao, C.; Zhang, Q.; Ma, Z.; Wang, X.; Chen, H.; Wang, J. Fractionation and mobility risks of heavy metals and metalloids in wastewater-irrigated agricultural soils from greenhouses and fields in Gansu, China. Geoderma 2018, 328, 1–9. [Google Scholar] [CrossRef]
  21. Gurung, B.; Race, M.; Fabbricino, M.; Komínková, D.; Libralato, G.; Siciliano, A.; Guida, M. Assessment of metal pollution in the Lambro Creek (Italy). Ecotox. Environ. Saf. 2018, 148, 754–762. [Google Scholar] [CrossRef]
  22. Blake, L.; Goulding, K.W.T. Effects of atmospheric deposition, soil pH and acidification on heavy metal contents in soils and vegetation of semi-natural ecosystems at Rothamsted Experimental Station, UK. Plant Soil 2002, 240, 235–251. [Google Scholar] [CrossRef]
  23. Liao, B.; Guo, Z.; Probst, A. Soil heavy metal contamination and acid deposition: Experimental approach on two forest soils in Hunan, Southern China. Geoderma 2005, 127, 91–103. [Google Scholar] [CrossRef]
  24. Guo, F.; Ding, C.; Zhou, Z.; Huang, G.; Wang, X. Stability of immobilization remediation of several amendments on cadmium contaminated soils as affected by simulated soil acidification. Ecotoxicol. Environ. Saf. 2018, 161, 164–172. [Google Scholar] [CrossRef] [PubMed]
  25. Guo, J.; Liu, X.; Zhang, Y.; Shen, J.; Han, W.; Zhang, W.; Christie, P.; Goulding, K.T.W.; Vitousek, P.M.; Zhang, F. Significant Acidification in Major Chinese Croplands. Science 2010, 327, 1008–1010. [Google Scholar] [CrossRef] [PubMed] [Green Version]
  26. Zhu, Q.; de Vries, M.; Liu, X.; Zheng, M.; Hao, T.; Du, E.; Zhang, F.; Shen, J. The contribution of atmospheric deposition and forest harvesting to forest soil acidification in China since 1980. Atmos. Environ. 2016, 146, 215–222. [Google Scholar] [CrossRef] [Green Version]
  27. Yang, Y.; Ji, C.; Ma, W.; Wang, S.; Wang, S.; Han, W.; Mohammat, A.; Robinson, D.; Smith, P. Significant soil acidification across northern China’s grasslands during 1980s–2000s. Glob. Chang. Biol. 2012, 18, 2292–2300. [Google Scholar] [CrossRef]
  28. Zhang, M.; Liu, Z.; Wang, L. Use of single extraction methods to predict bioavailability of heavy metals in polluted soils to rice. Commun. Soil Sci. Plant Anal. 2010, 41, 820–831. [Google Scholar] [CrossRef]
  29. Zhao, K.; Fu, W.; Ye, Z.; Zhang, C. Contamination and spatial variation of heavy metals in the soil-rice system in Nanxun County, Southeastern China. Int. J. Environ. Res. Public Health 2015, 12, 1577–1594. [Google Scholar] [CrossRef]
  30. Ran, J.; Wang, D.; Wang, C.; Zhang, G.; Zhang, H. Heavy metal contents, distribution, and prediction in a regional soil–wheat system. Sci. Total Environ. 2016, 544, 422–431. [Google Scholar] [CrossRef]
  31. Wen, B.; Li, L.; Duan, Y.; Zhang, Y.; Shen, J.; Xia, M.; Wang, Y.; Fang, W.; Zhu, X. Zn, Ni, Mn, Cr, Pb and Cu in soil-tea ecosystem: The concentrations, spatial relationship and potential control. Chemosphere 2018, 204, 92–100. [Google Scholar] [CrossRef]
  32. Gu, Q.; Yang, Z.; Yu, T.; Yang, Q.; Hou, Q.; Zhang, Q. From soil to rice—A typical study of transfer and bioaccumulation of heavy metals in China. Acta Agric. Scand. Sect. B Soil Plant Sci. 2018, 68, 7631–7642. [Google Scholar] [CrossRef]
  33. Yang, Y.; Chen, W.; Wang, M.; Peng, C. Regional accumulation characteristics of cadmium in vegetables: Influencing factors, transfer model and indication of soil threshold content. Environ. Pollut. 2016, 219, 1036–1043. [Google Scholar] [CrossRef] [Green Version]
  34. Li, Y.; Fang, F.; Wu, M.; Kuang, Y.; Wu., H. Heavy metal contamination and health risk assessment in soil-rice system near Xinqiao mine in Tongling city, Anhui province, China. Hum. Ecol. Risk Assess. 2018, 24, 743–753. [Google Scholar] [CrossRef]
  35. Patinha, C.; Reis, A.P.; Dias, C.; Cachada, A.; Adão, R.; Martins, H.; da Silva, E.F.; Sousa, A.J. Lead availability in soils from Portugal’s Centre Region with special reference to bioaccessibility. Environ. Geochem. Health 2012, 34, 213–227. [Google Scholar] [CrossRef] [PubMed]
  36. Jiang, J.; Xu, R.; Jiang, T.; Li, Z. Immobilization of Cu(II), Pb(II) and Cd(II) by the addition of rice straw derived biochar to a simulated polluted Ultisol. J. Hazard. Mater. 2012, 229–230, 145–150. [Google Scholar] [CrossRef] [PubMed]
  37. Zhang, X.; Wang, H.; He, L.; Lu, K.; Sarmah, A.; Li, J.; Bolan, N.S.; Pei, J.; Huang, H. Using biochar for remediation of soils contaminated with heavy metals and organic pollutants. Environ. Sci. Pollut. Res. 2013, 20, 8472–8483. [Google Scholar] [CrossRef]
  38. Lu, K.; Yang, X.; Gielen, G.; Bolan, N.S.; Ok, Y.; Niazi, N.K.; Xu, S.; Yuan, G.; Chen, X.; Zhang, X.; et al. Effect of bamboo and rice straw biochars on the mobility and redistribution of heavy metals (Cd, Cu, Pb and Zn) in contaminated soil. J. Environ. Manag. 2017, 186, 285–292. [Google Scholar] [CrossRef]
  39. Gong, Z.; Zhang, G.; Chen, Z. Pedogenesis and Soil Taxonomy; Science Press: Beijing, China, 2007; ISBN 978-7-03-019653-8. [Google Scholar]
  40. Liu, M. Atlas of Physical Geography of China; China Cartographic Publishing House: Beijing, China, 2010; ISBN 978-7-5031-5370-9. [Google Scholar]
  41. Li, Z.; Ma, Z.; van der Kuijp, T.J.; Yuan, Z.; Huang, L. A review of soil heavy metal pollution from mines in China: Pollution and health risk assessment. Sci. Total Environ. 2014, 468–469, 843–853. [Google Scholar] [CrossRef]
  42. Ma, Y.; Jia, Z.; Li, S. Risk assessment of heavy metals in soil of Tongnan District (Southwest China): Evidence from multiple indices with high-spatial-resolution sampling. Environ. Sci. Pollut. Res. 2017, 24, 20282–20290. [Google Scholar] [CrossRef] [PubMed]
  43. Zhao, Y.; Wang, M.; Hu, S.; Zhang, X.; Ouyang, Z.; Zhang, G.; Huang, B.; Zhao, S.; Wu, J.; Xie, D.; et al. Economics- and policy-driven organic carbon input enhancement dominates soil organic carbon accumulation in Chinese croplands. Proc. Natl. Acad. Sci. USA 2018, 115, 4045–4050. [Google Scholar] [CrossRef] [PubMed] [Green Version]
  44. Yang, S.; Zhou, D.; Yu, H.; Wei, R.; Pan, B. Distribution and speciation of metals (Cu, Zn, Cd, and Pb) in agricultural and non-agricultural soils near a stream upriver from the Pearl River, China. Environ. Pollut. 2013, 177, 64–70. [Google Scholar] [CrossRef]
  45. Sparks, D.L. Environmental Soil Chemistry, 2nd ed.; Academic Press: London, UK, 2003; ISBN 978-0-12-656446-4. [Google Scholar]
  46. MicBride, M.B. Environmental Chemistry of Soils; Oxford University Press: New York, NY, USA, 1994; ISBN 0-19-507011-9. [Google Scholar]
  47. Bolan, N.S.; Adriano, D.C.; Curtin, D. Soil acidification and liming interactions with nutrient and heavy metal transformation and bioavailability. Adv. Agron. 2003, 78, 215–272. [Google Scholar]
  48. Puga, A.P.; Melo, L.C.A.; de Abreu, C.A.D.; Coscionea, A.R.; Paz-Ferreiroc, J. Leaching and fractionation of heavy metals in mining soils amended with biochar. Soil Tillage Res. 2016, 164, 25–33. [Google Scholar] [CrossRef]
  49. Yang, Y.; Li, P.; Ding, Z.; Zhao, Z.; Ma, W.; Ji, C.; Fang, J. Increased topsoil carbon stock across China’s forests. Glob. Chang. Biol. 2014, 20, 2687–2696. [Google Scholar] [CrossRef] [PubMed]
  50. Ye, X.; Li, H.; Ma, Y.; Wu, L.; Sun, B. The bioaccumulation of Cd in rice grains in paddy soils as affected and predicted by soil properties. J. Soil Sediment 2014, 14, 1407–1416. [Google Scholar] [CrossRef]
  51. Bian, R.; Joseph, S.; Cui, L.; Pan, G.; Li, L.; Liu, X.; Zhang, A.; Rutlidge, H.; Wong, S.; Chia, C.; et al. A three-year experiment confirms continuous immobilization of cadmium and lead in contaminated paddy field with biochar amendment. J. Hazard. Mater. 2014, 272, 121–128. [Google Scholar] [CrossRef] [PubMed]
  52. Mahar, A.; Wang, P.; Ali, A.; Awasthi, M.K.; Lahori, A.H.; Wang, Q.; Li, R.; Zhang, Z. Challenges and opportunities in the phytoremediation of heavy metals contaminated soils: A review. Ecotoxicol. Environ. Saf. 2016, 126, 111–121. [Google Scholar] [CrossRef] [PubMed]
  53. Gratão, P.L.; Prasad, M.N.V.; Cardoso, P.F.; Lea, P.J.; Azevedo, R.A. Phytoremediation: Green technology for the clean up of toxic metals in the environment. Braz. J. Plant Physiol. 2005, 17, 53–64. [Google Scholar] [CrossRef]
Figure 1. Geographic distribution of data used in the meta-analysis.
Sustainability 11 00337 g001
Figure 2. Distribution of total concentration of Cd (a) and Cu (b) in Chinese soils. The line and cross within the box represents the median and average value of all data, respectively; the bottom and top edges of the box represent 25 and 75 percentiles of all data, respectively; and the bottom and top bars represent 5 and 95 percentiles, respectively.
Sustainability 11 00337 g002
Figure 3. Averaged fraction distribution of Cd (a) and Cu (b) in Chinese soils.
Sustainability 11 00337 g003
Figure 4. Spatial relationships between soil pH and Cd fractions. (a) exchangeable, (b) acid-soluble, (c) reducible, and (d) oxidizable. To remove the influence of outliers, only data between μ − 3σ and μ + 3σ were included. μ and σ are the average and standard deviation of each fraction, respectively.
Sustainability 11 00337 g004
Figure 5. Spatial relationships between soil pH and Cu fractions. (a) exchangeable, (b) acid-soluble, (c) reducible, and (d) oxidizable. To remove the influence of outliers, only data between μ − 3σ and μ + 3σ were included. μ and σ are the average and standard deviation of each fraction, respectively.
Sustainability 11 00337 g005

