Analysis of Travel Mode Choice Behavior Considering the Indifference Threshold


Abstract
:1. Introduction
2. Methodology
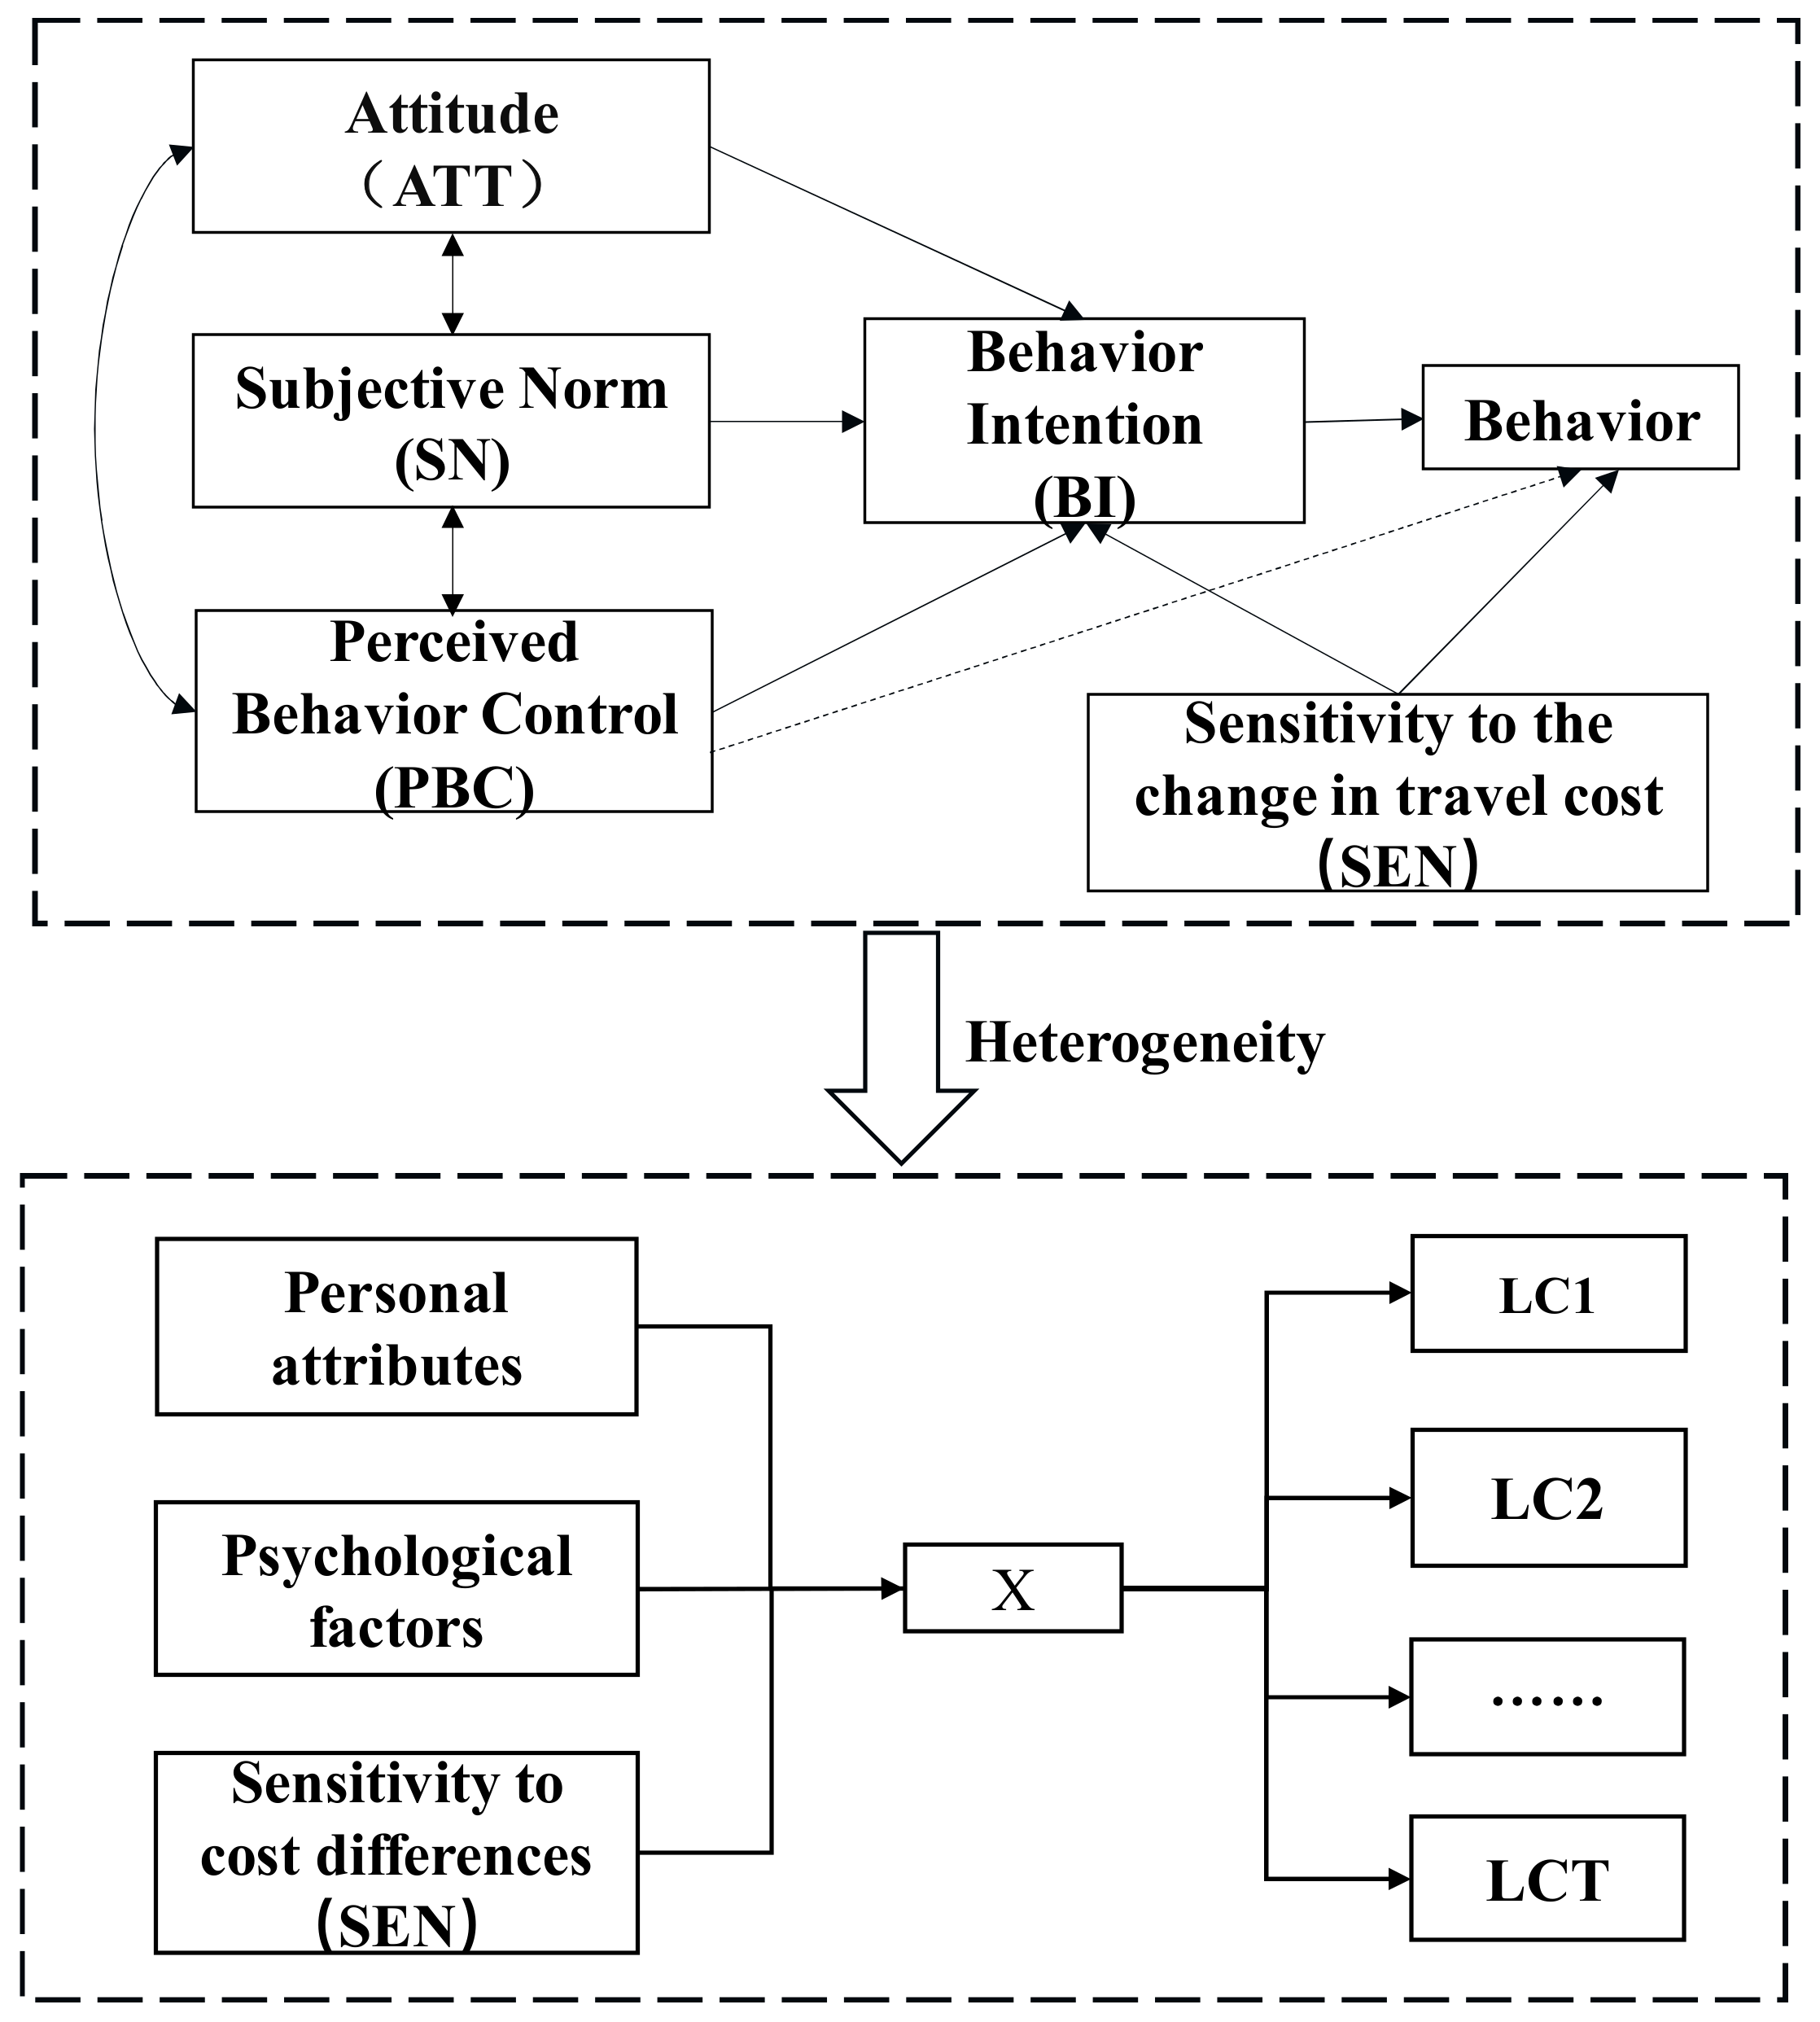
2.1. Model framework
2.2. The Structural Equation Model
2.3. Latent Class Model
3. Data Collection and Analysis
3.1. Descriptive Statistical Analysis
3.2. Cross-Analysis of Personal Attributes—Sensitivity to Changes in Travel Cost
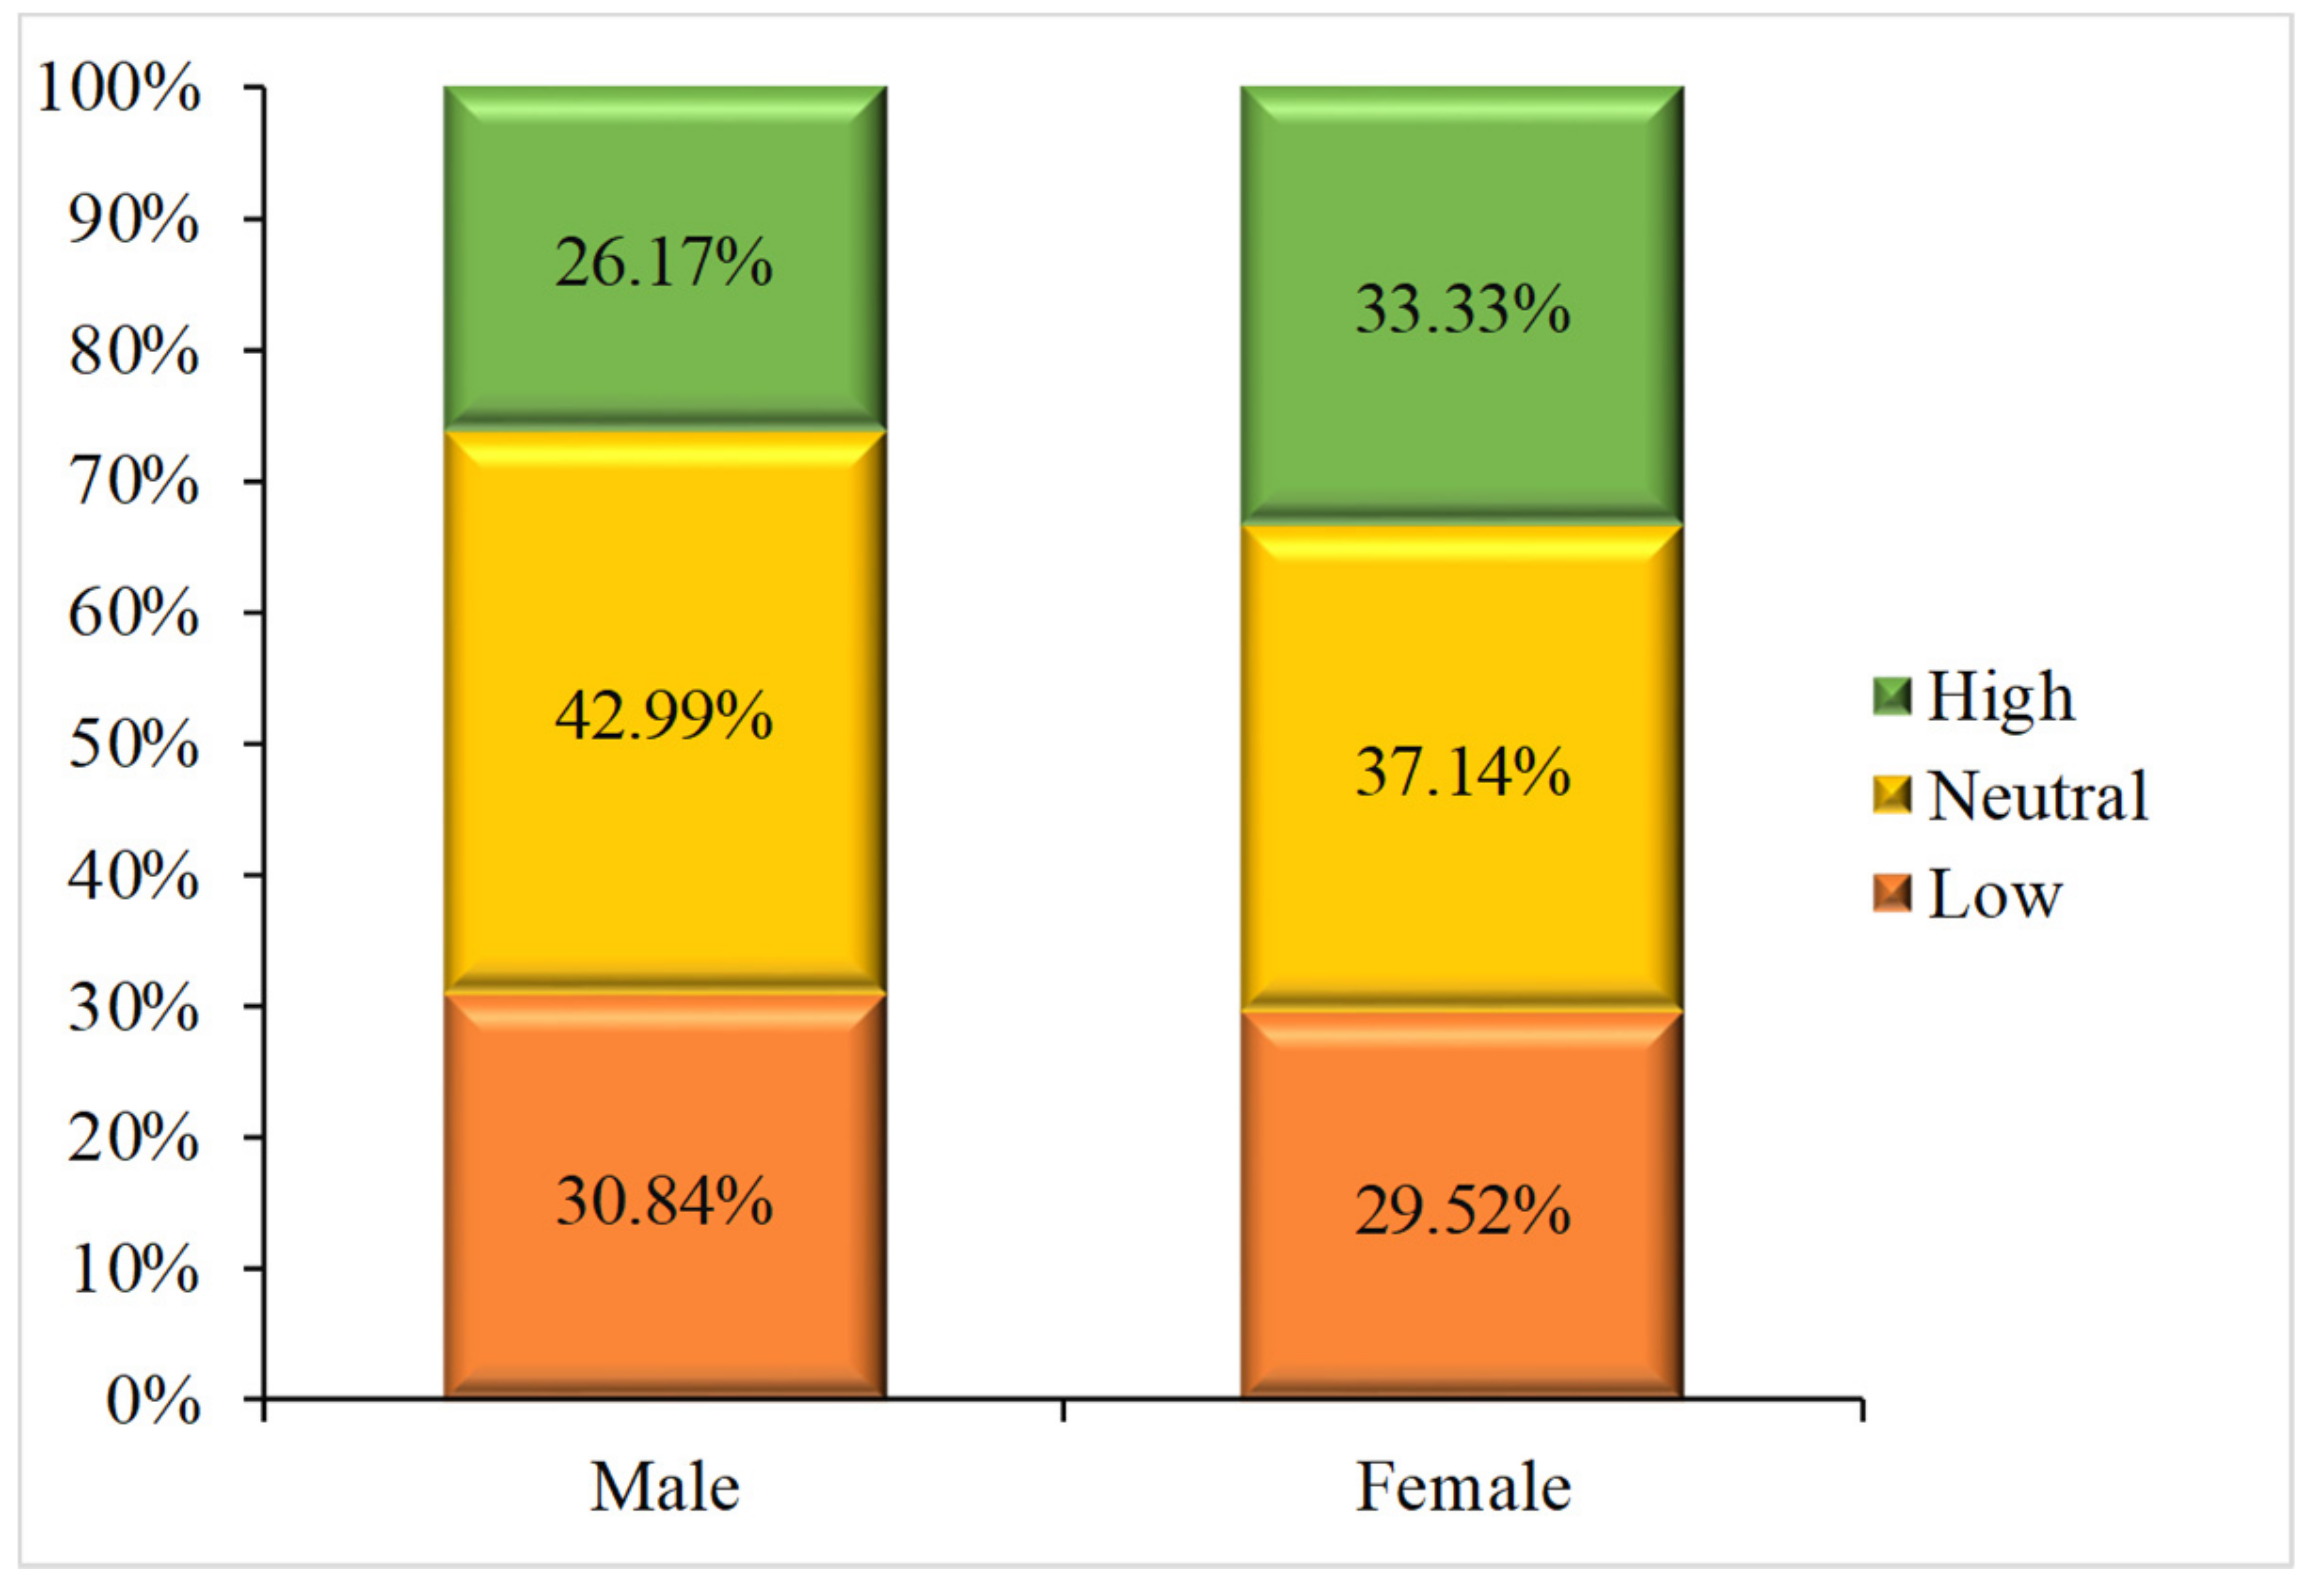
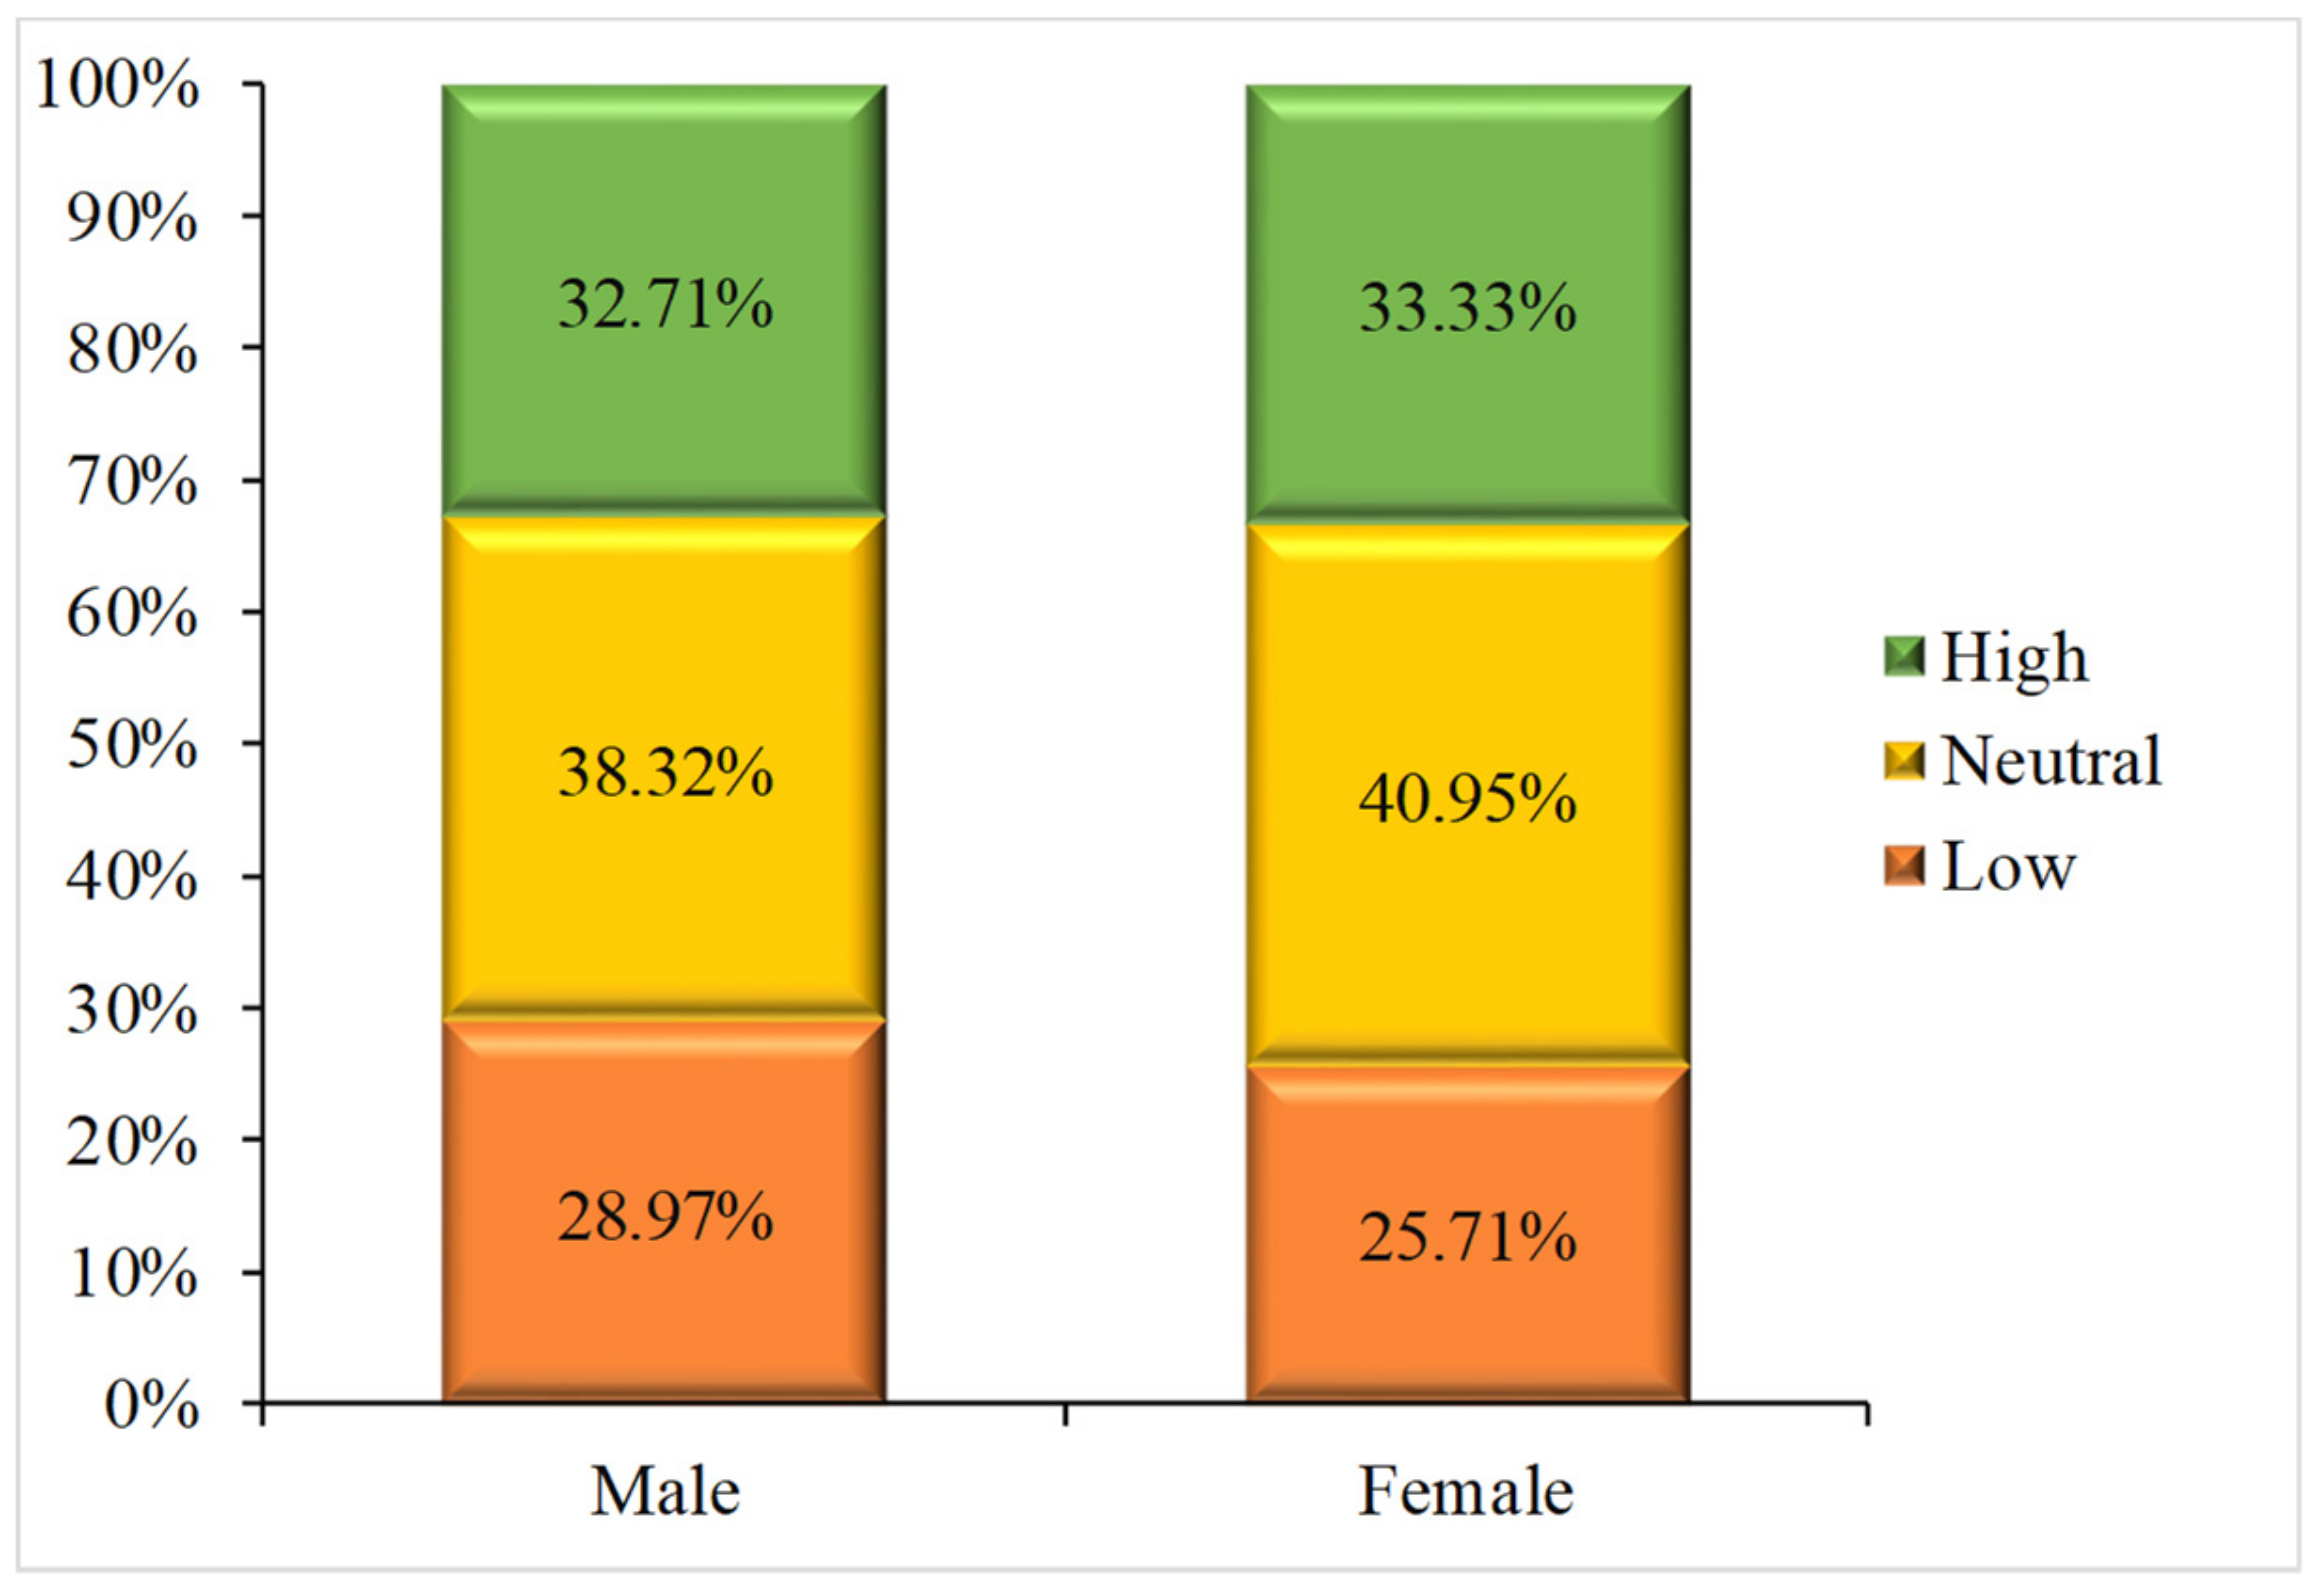
3.2.1. Analysis of the Sensitivity of Travelers of Different Genders to Changes in Cost
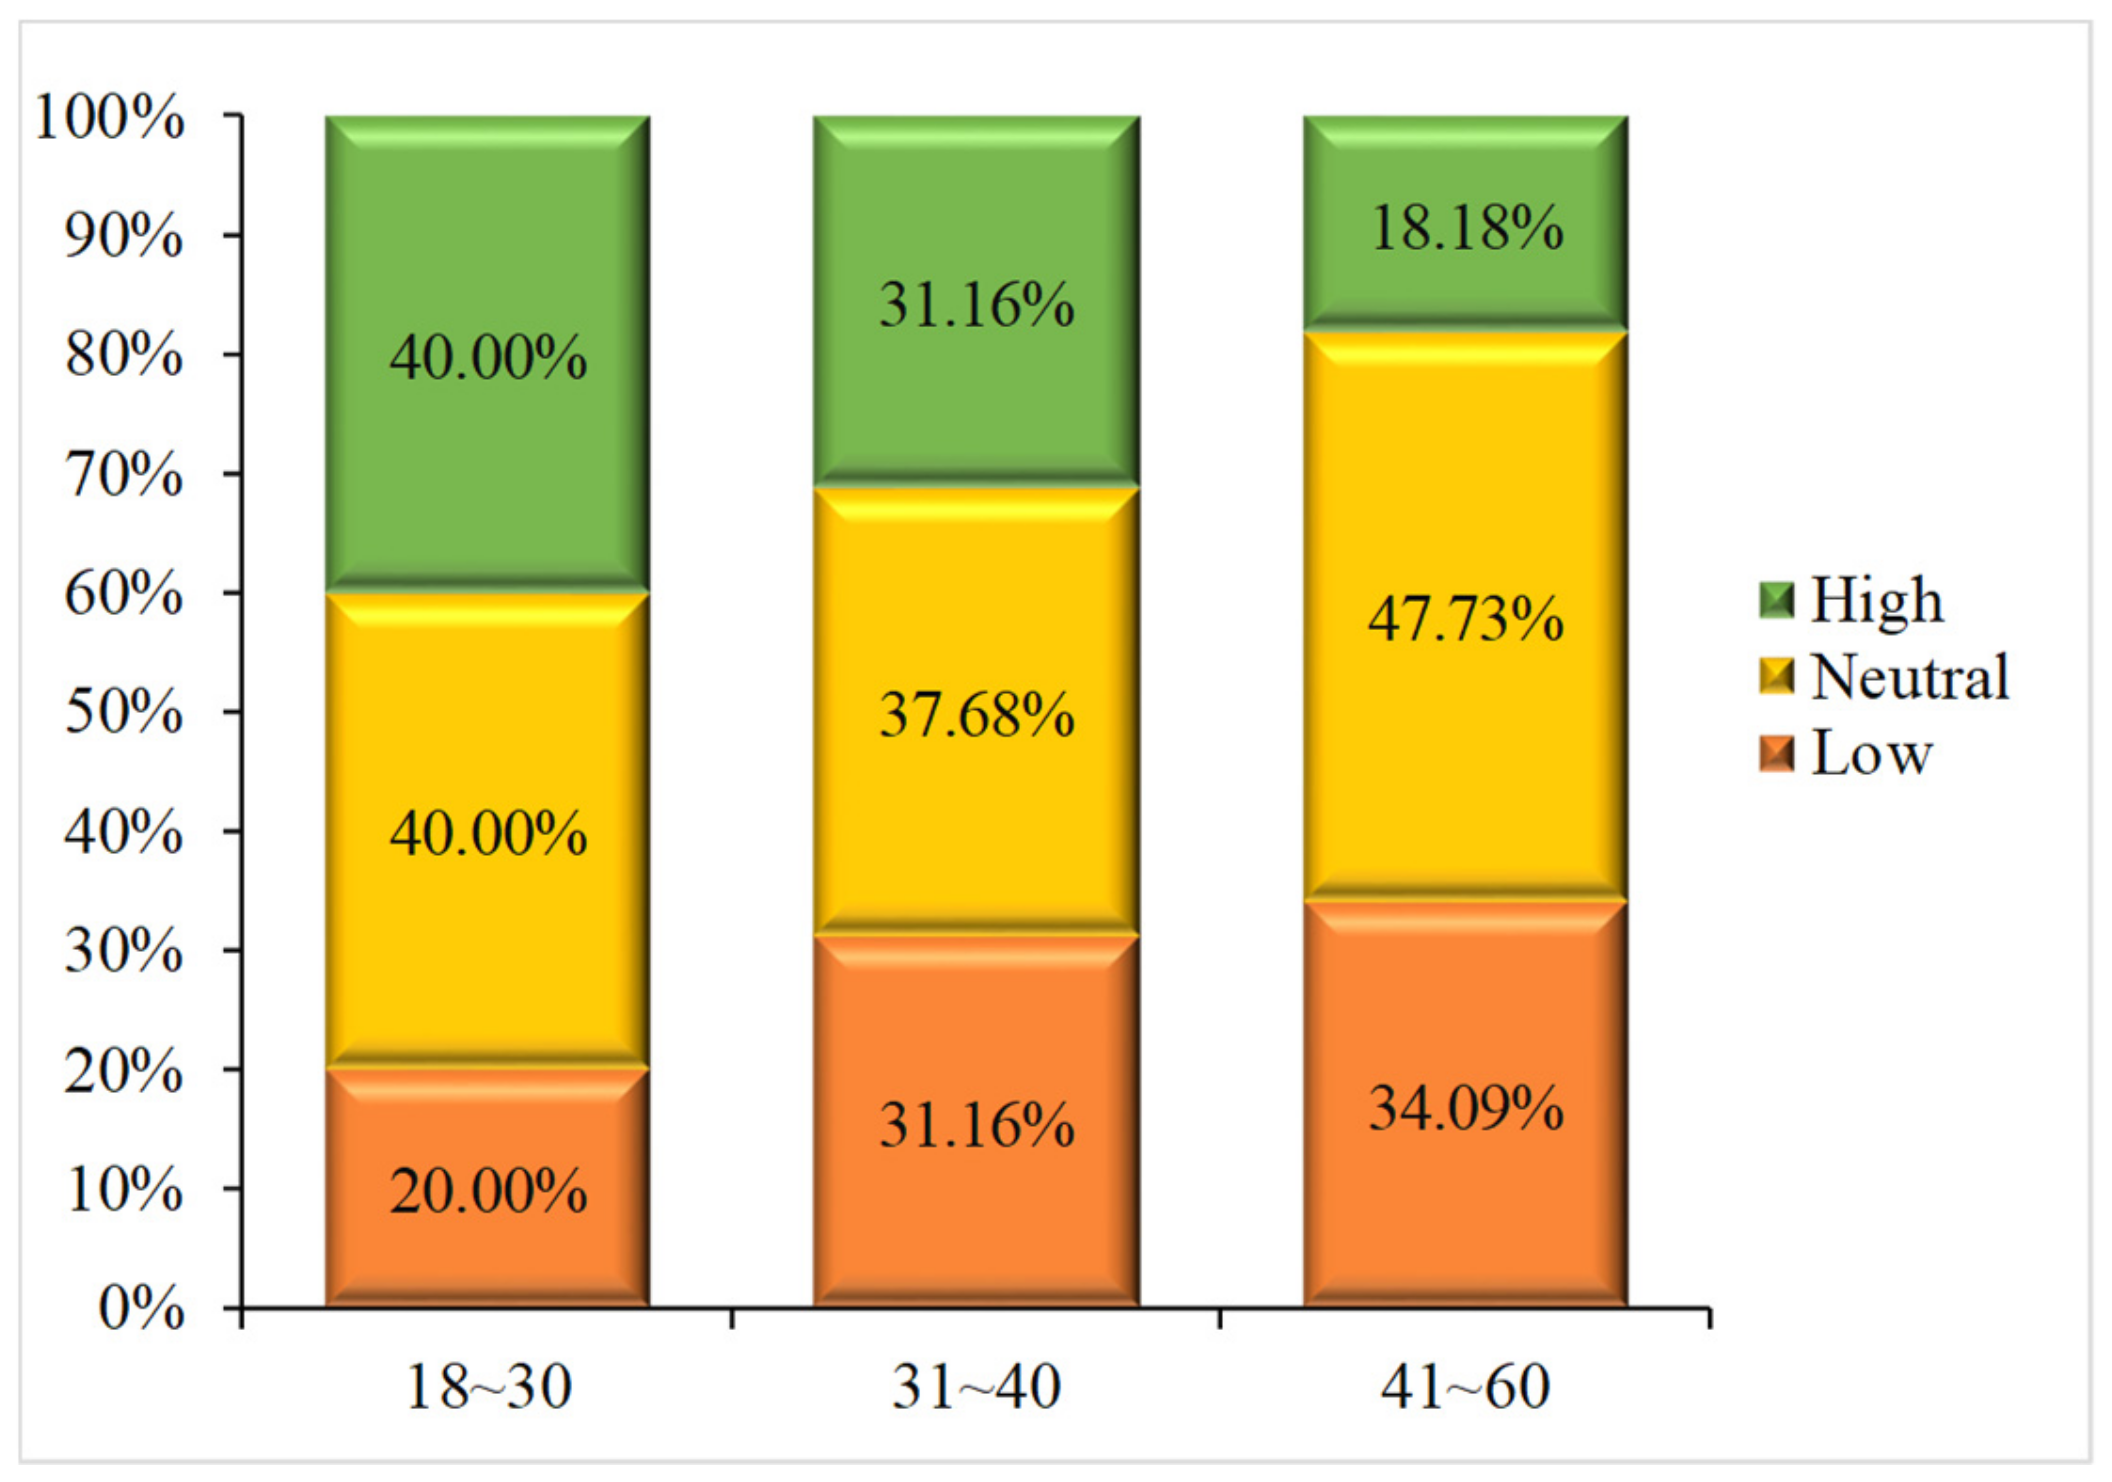
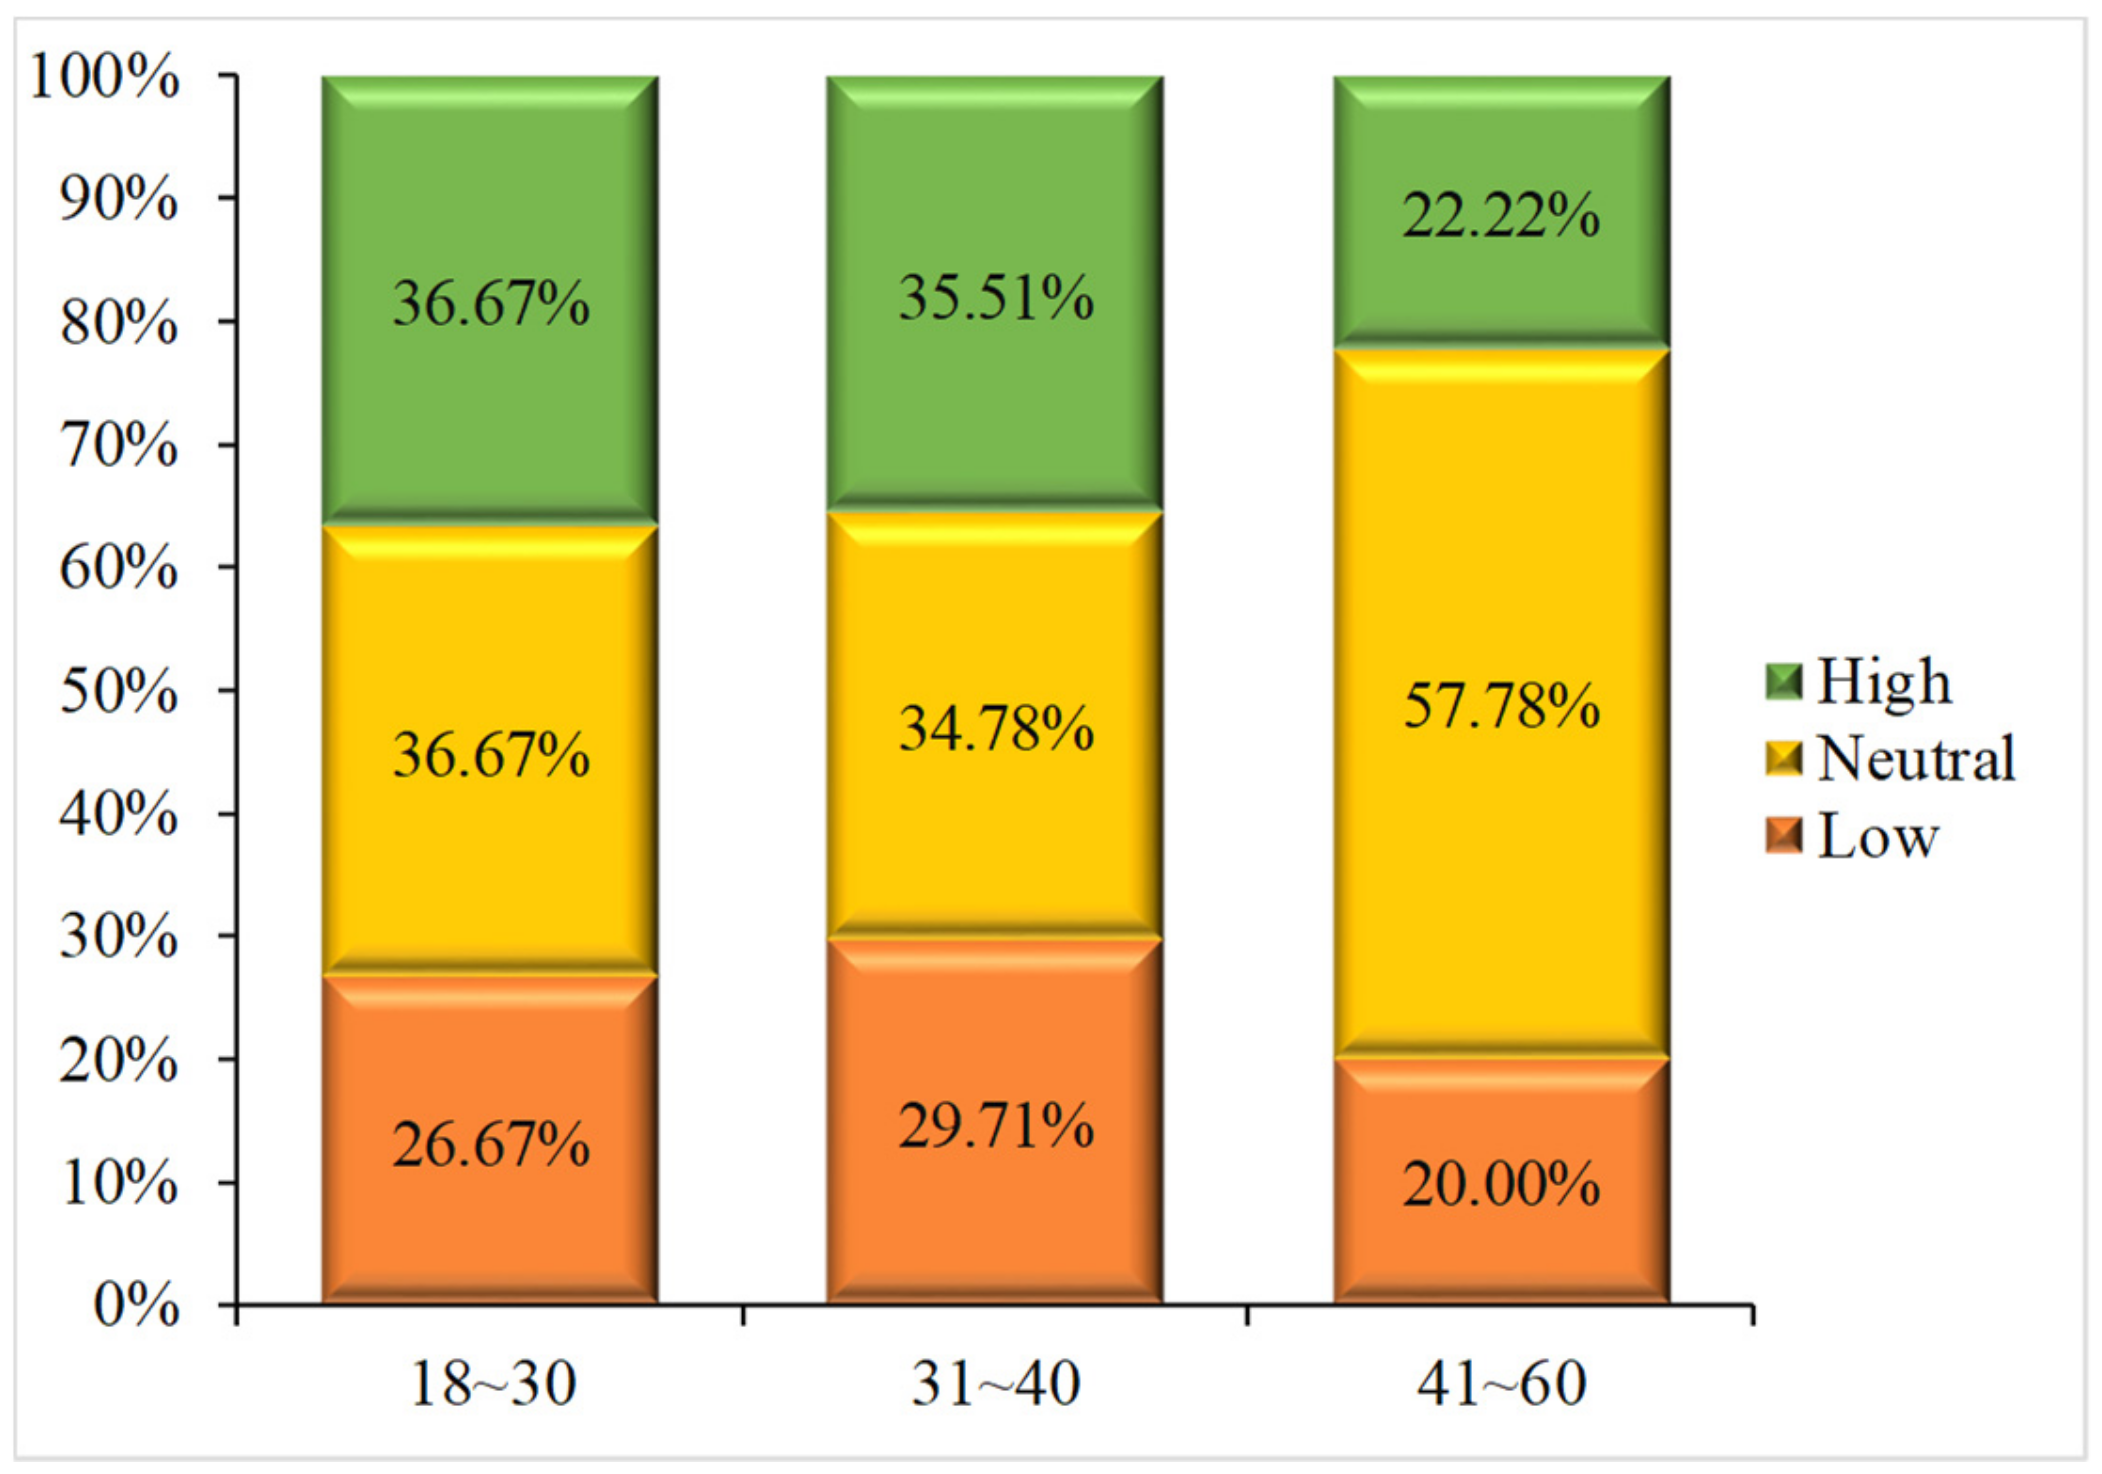
3.2.2. Analysis of the Sensitivity of Different Aged Travelers to Changes in Travel Cost
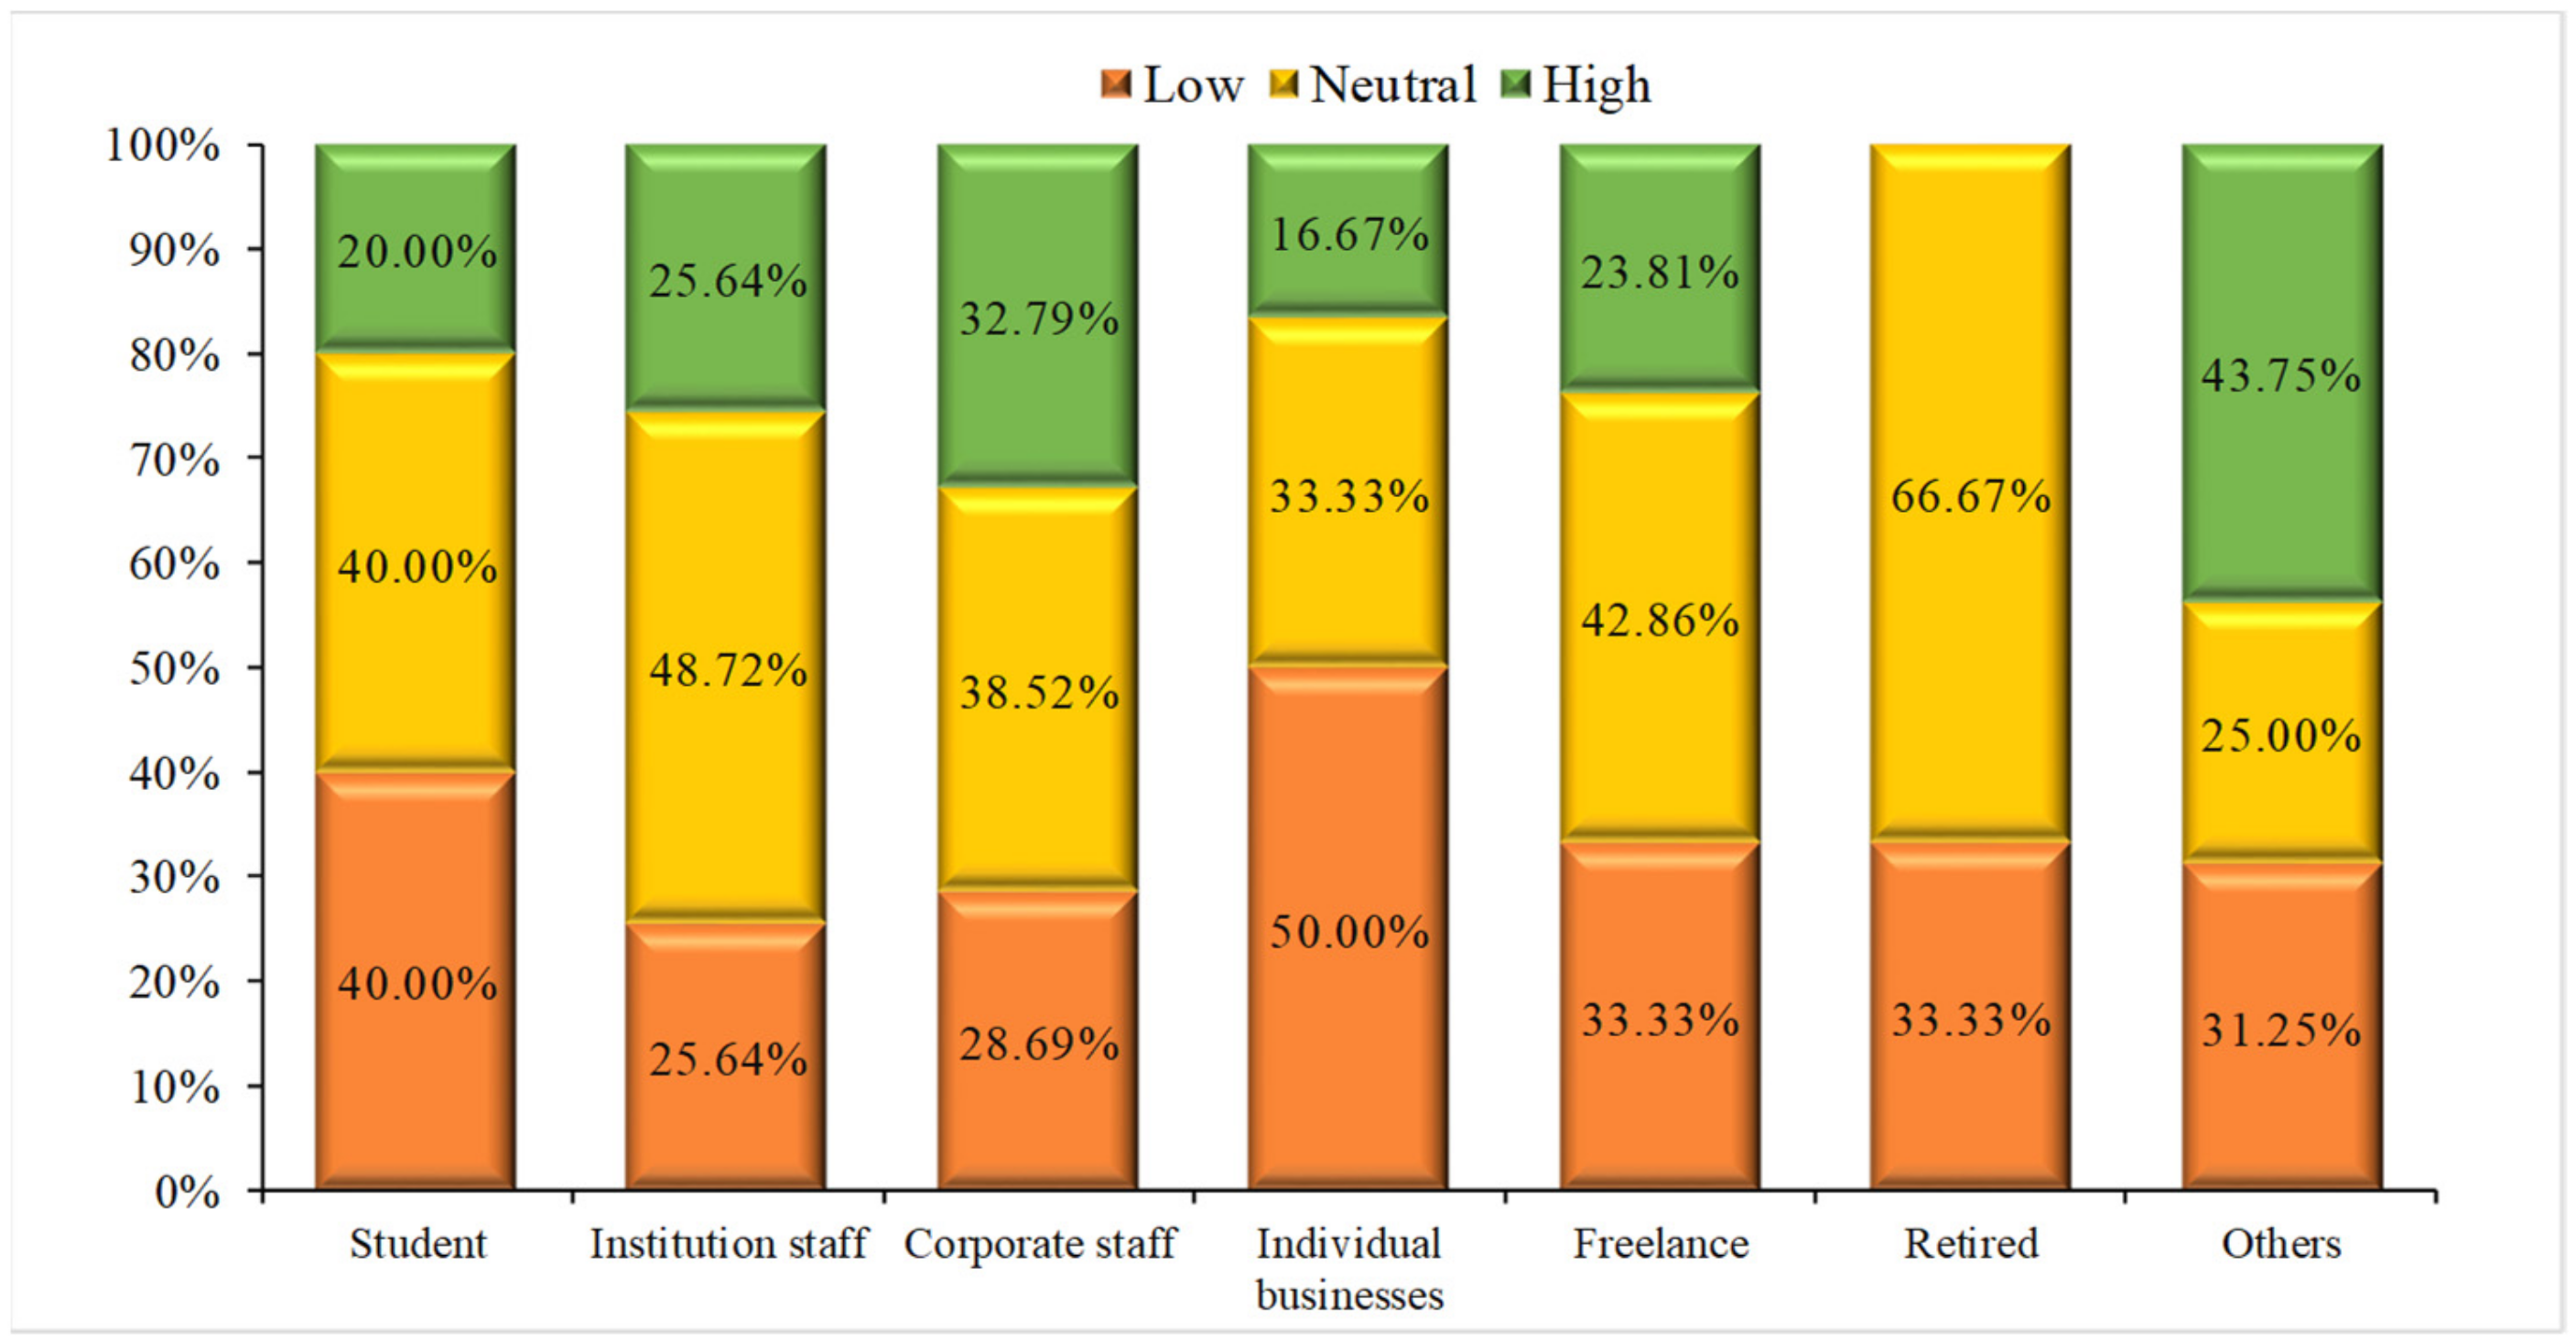
3.2.3. Analysis of the Sensitivity of Travelers with Different Occupations to Changes in Travel Cost
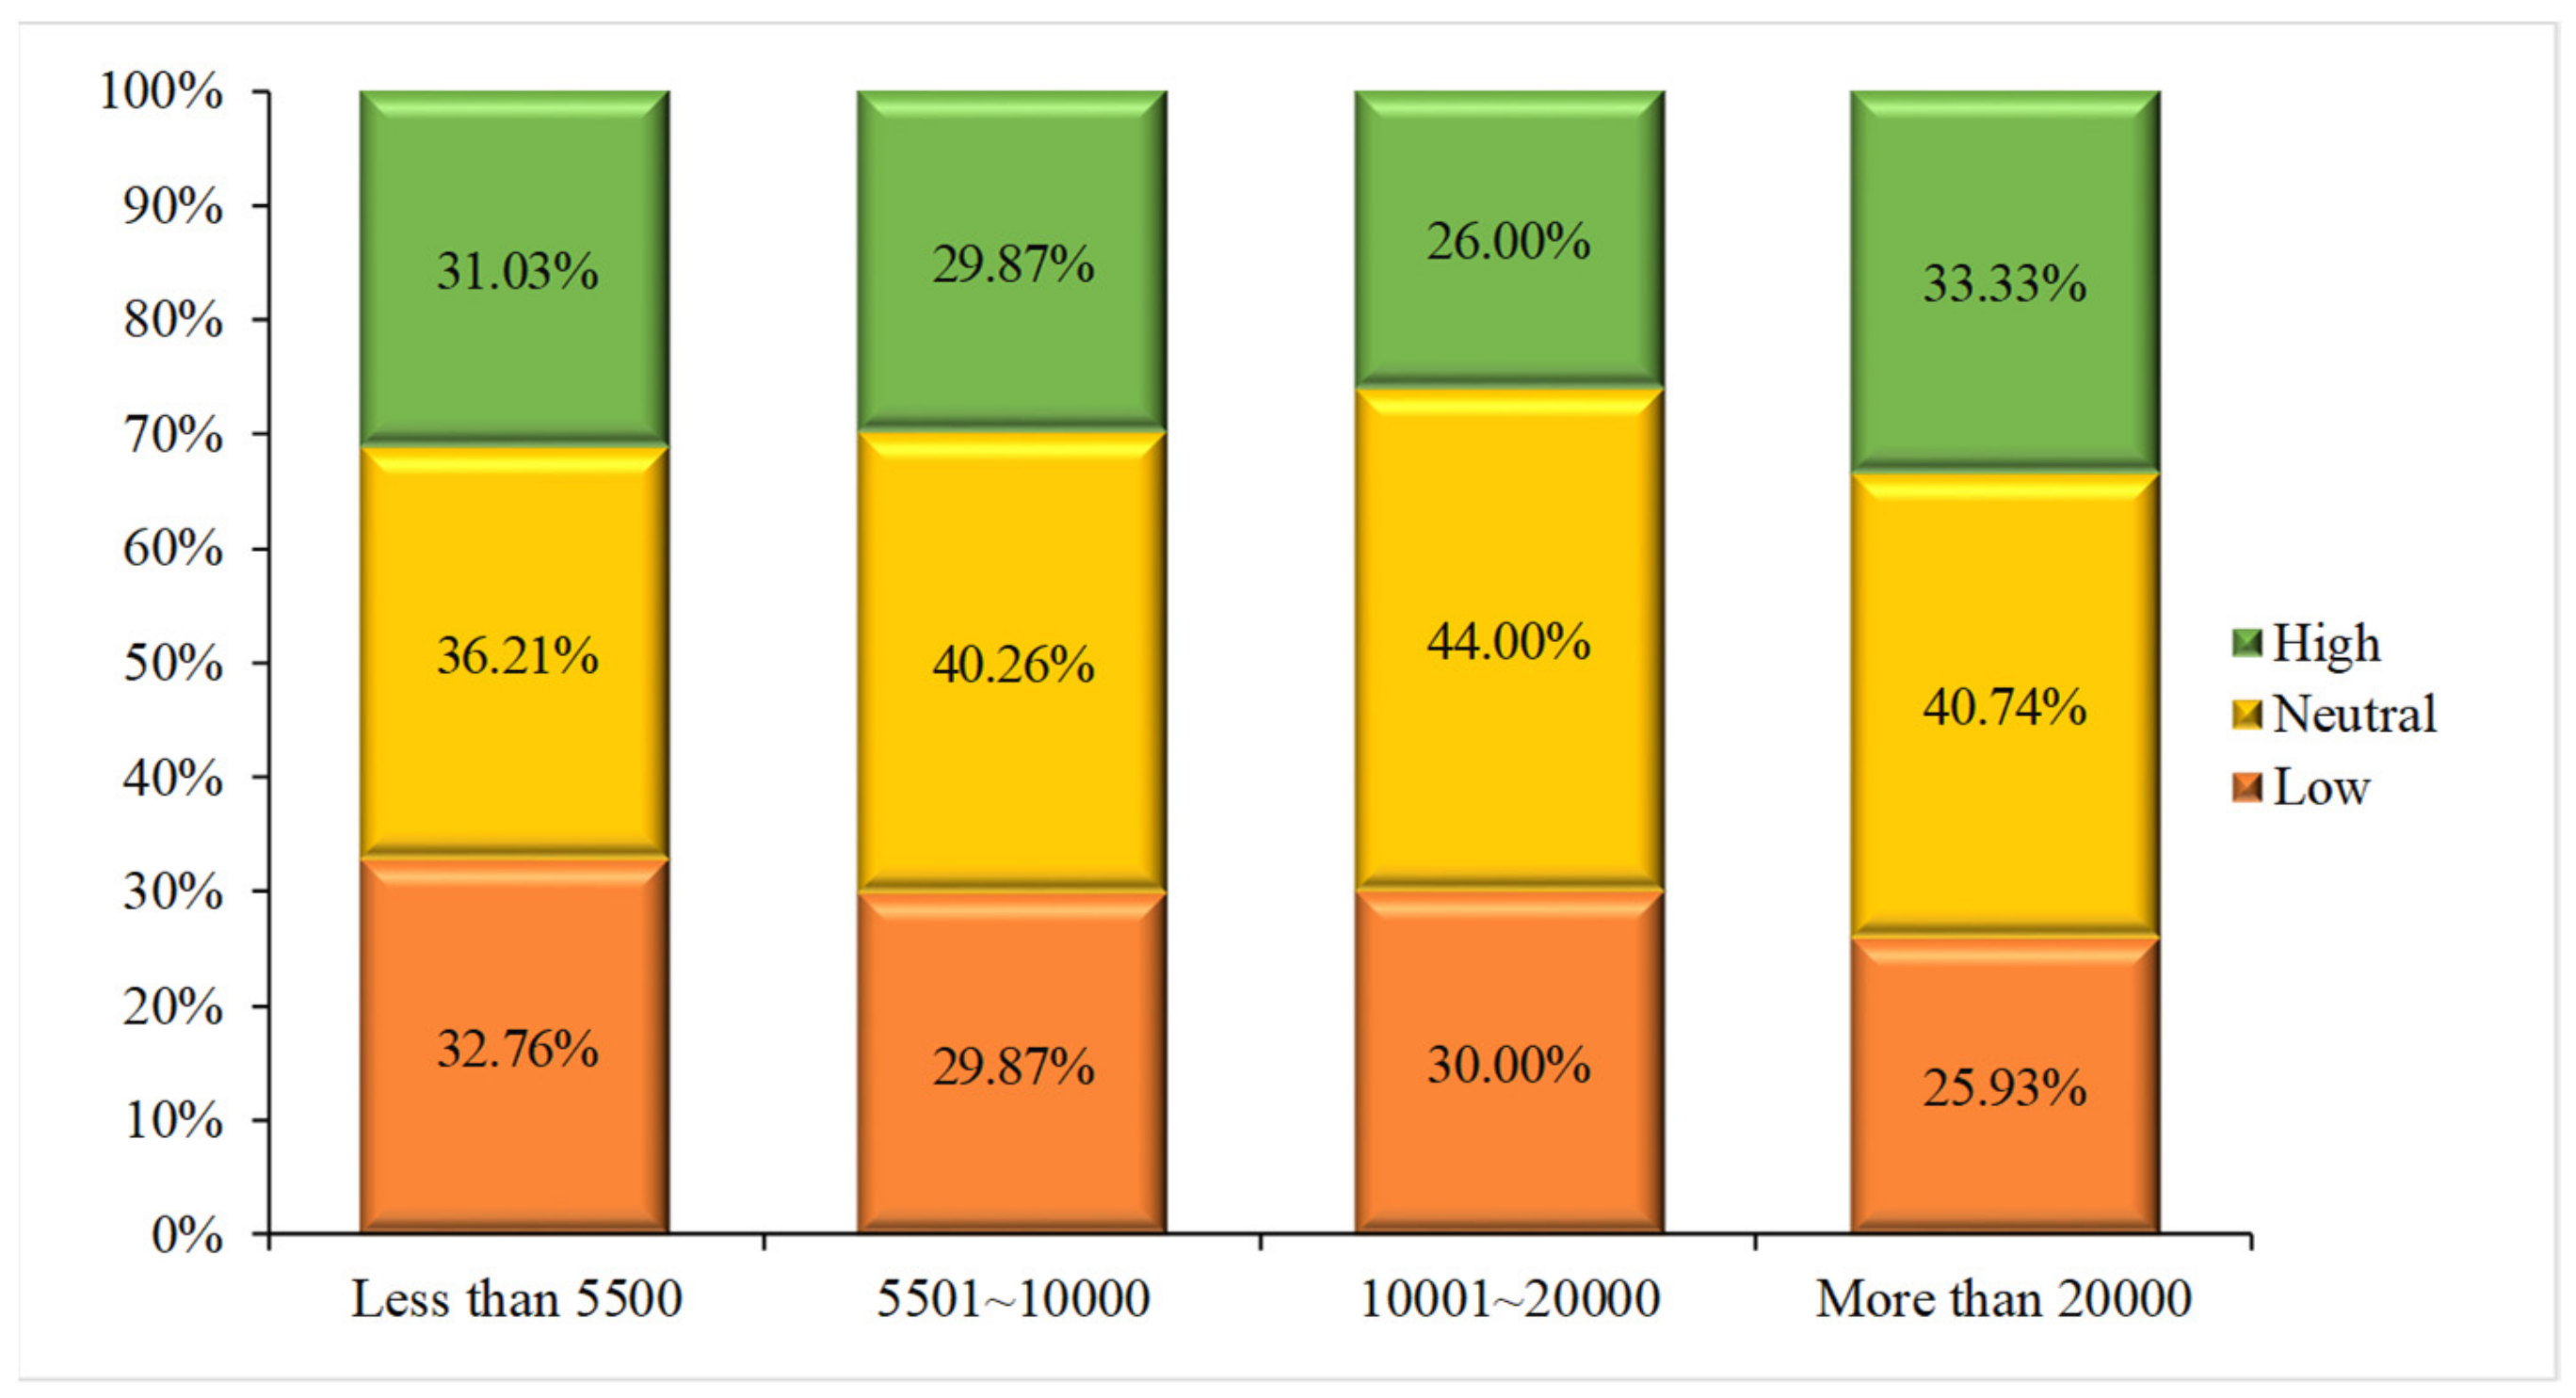
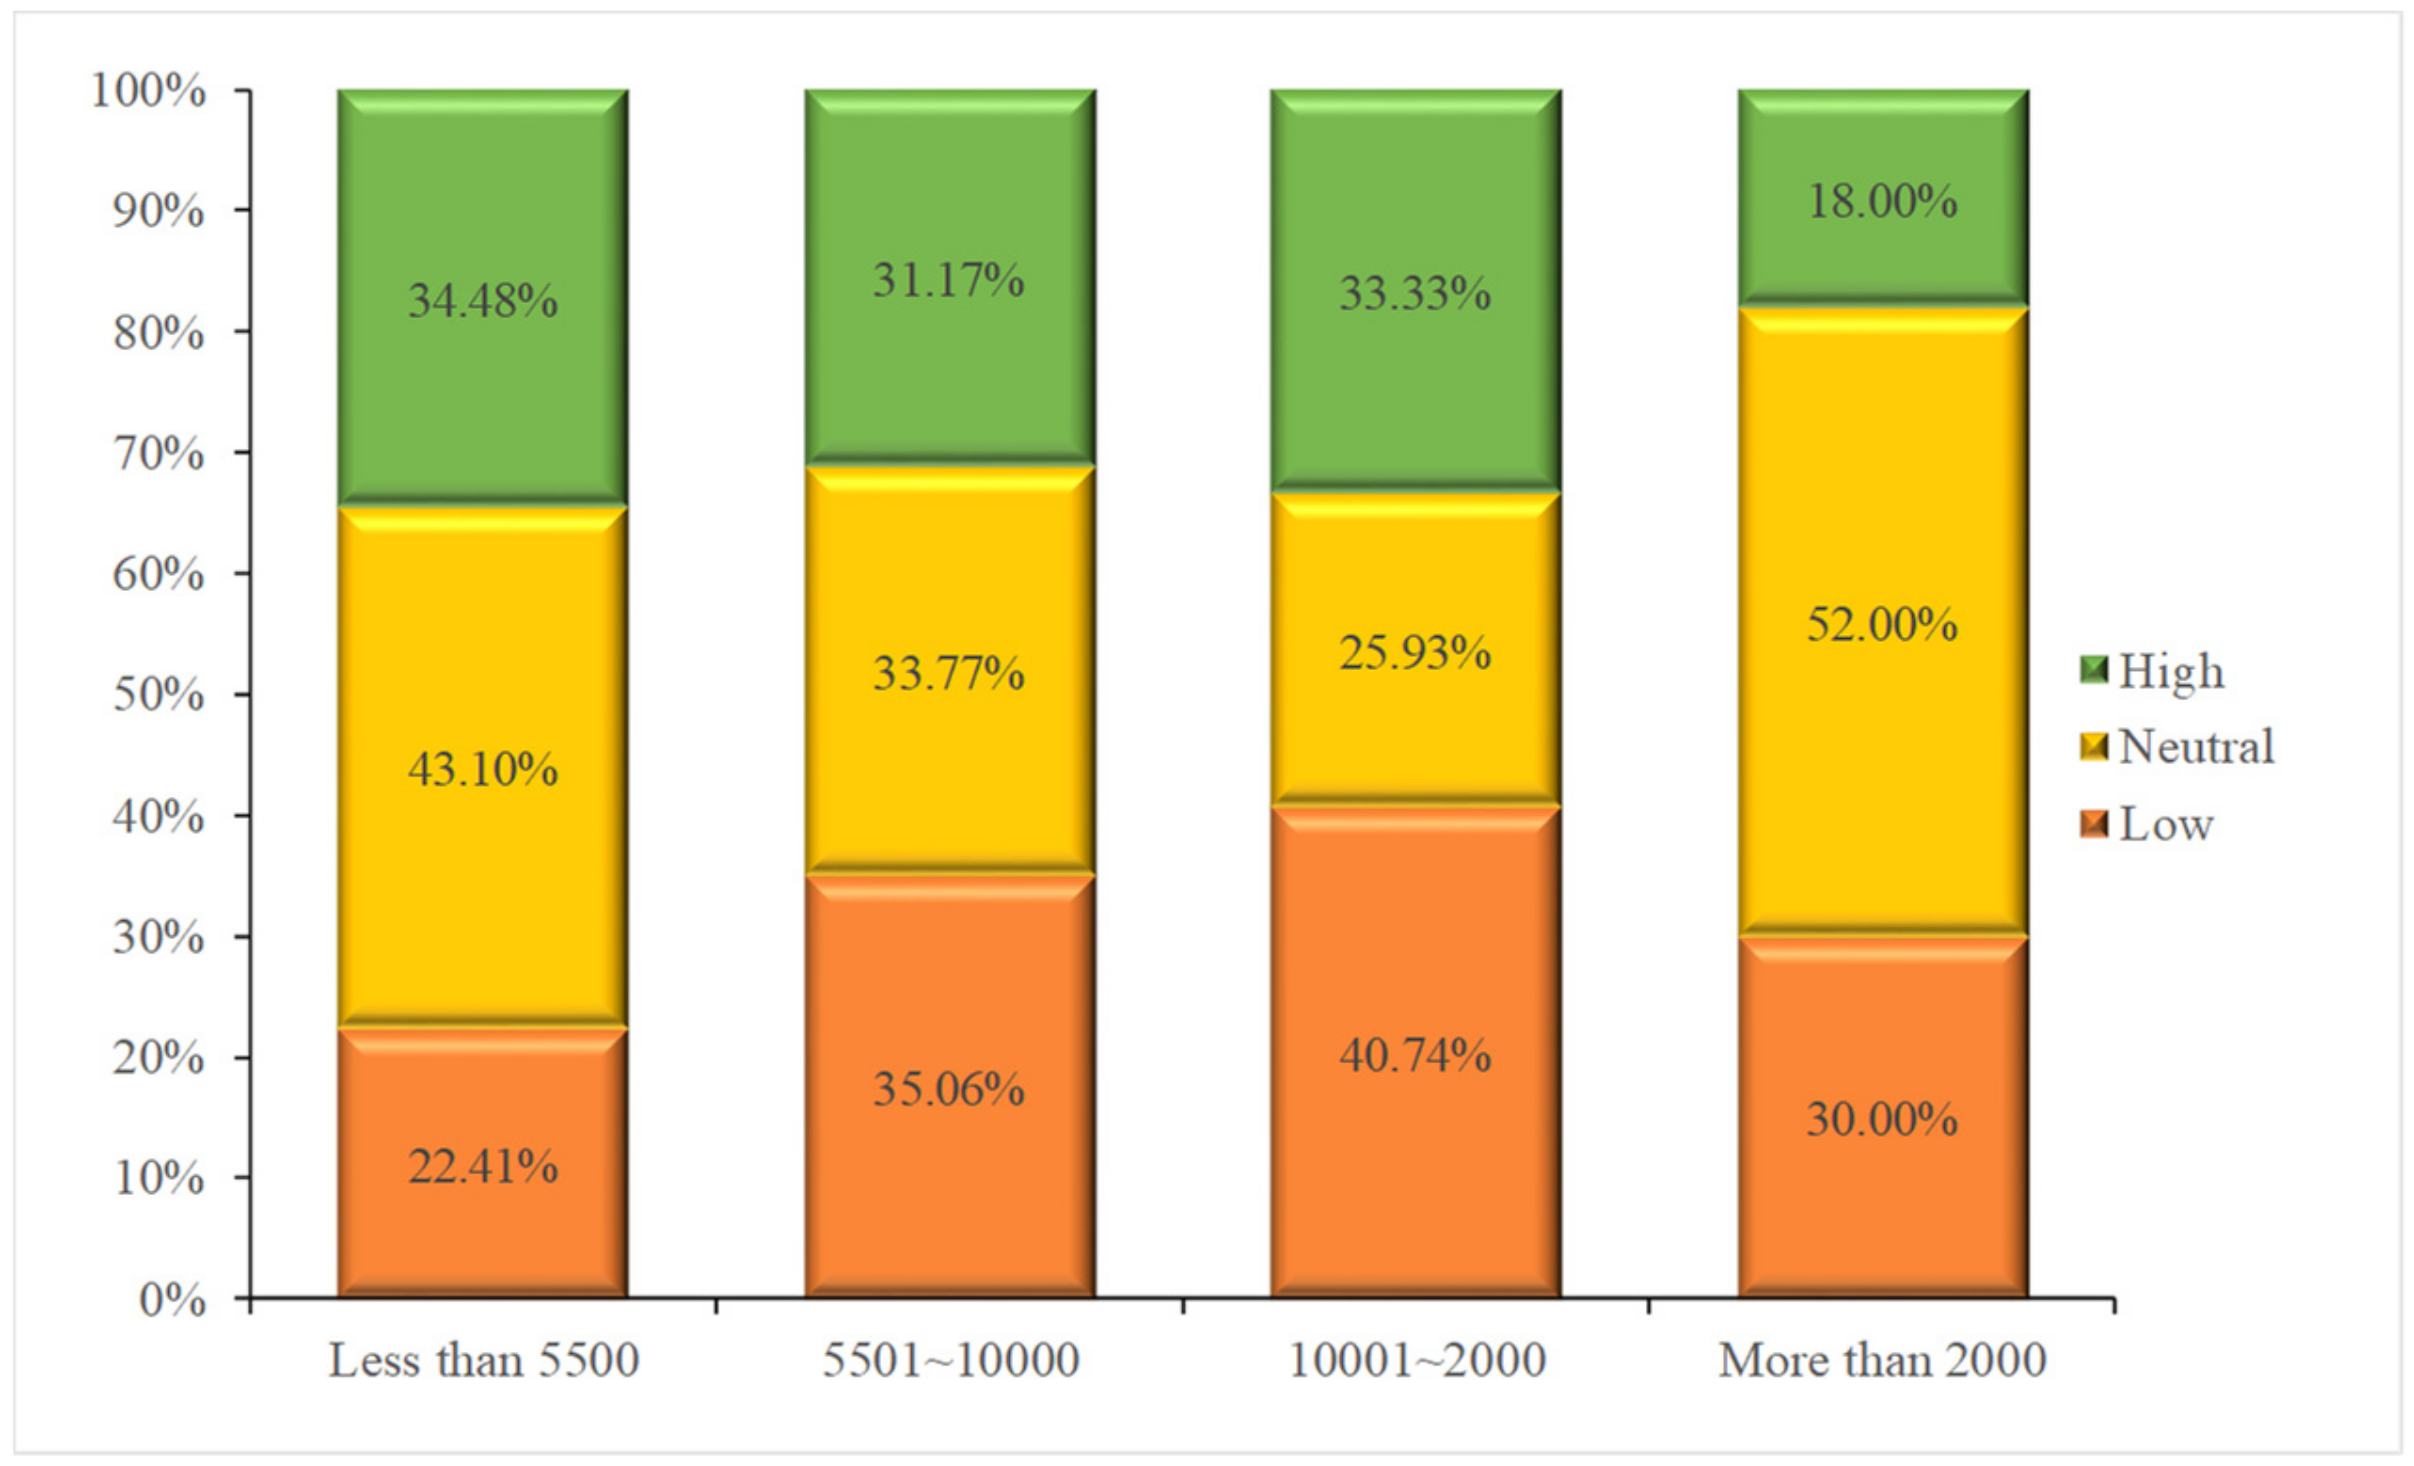
3.2.4. Analysis of the Sensitivity of Travelers with Difference Incomes to Changes in Cost
3.3. Data Analysis
3.3.1. Reliability Test
3.3.2. Validity Test
3.3.3. Fitness Test
4. Results and Discussion
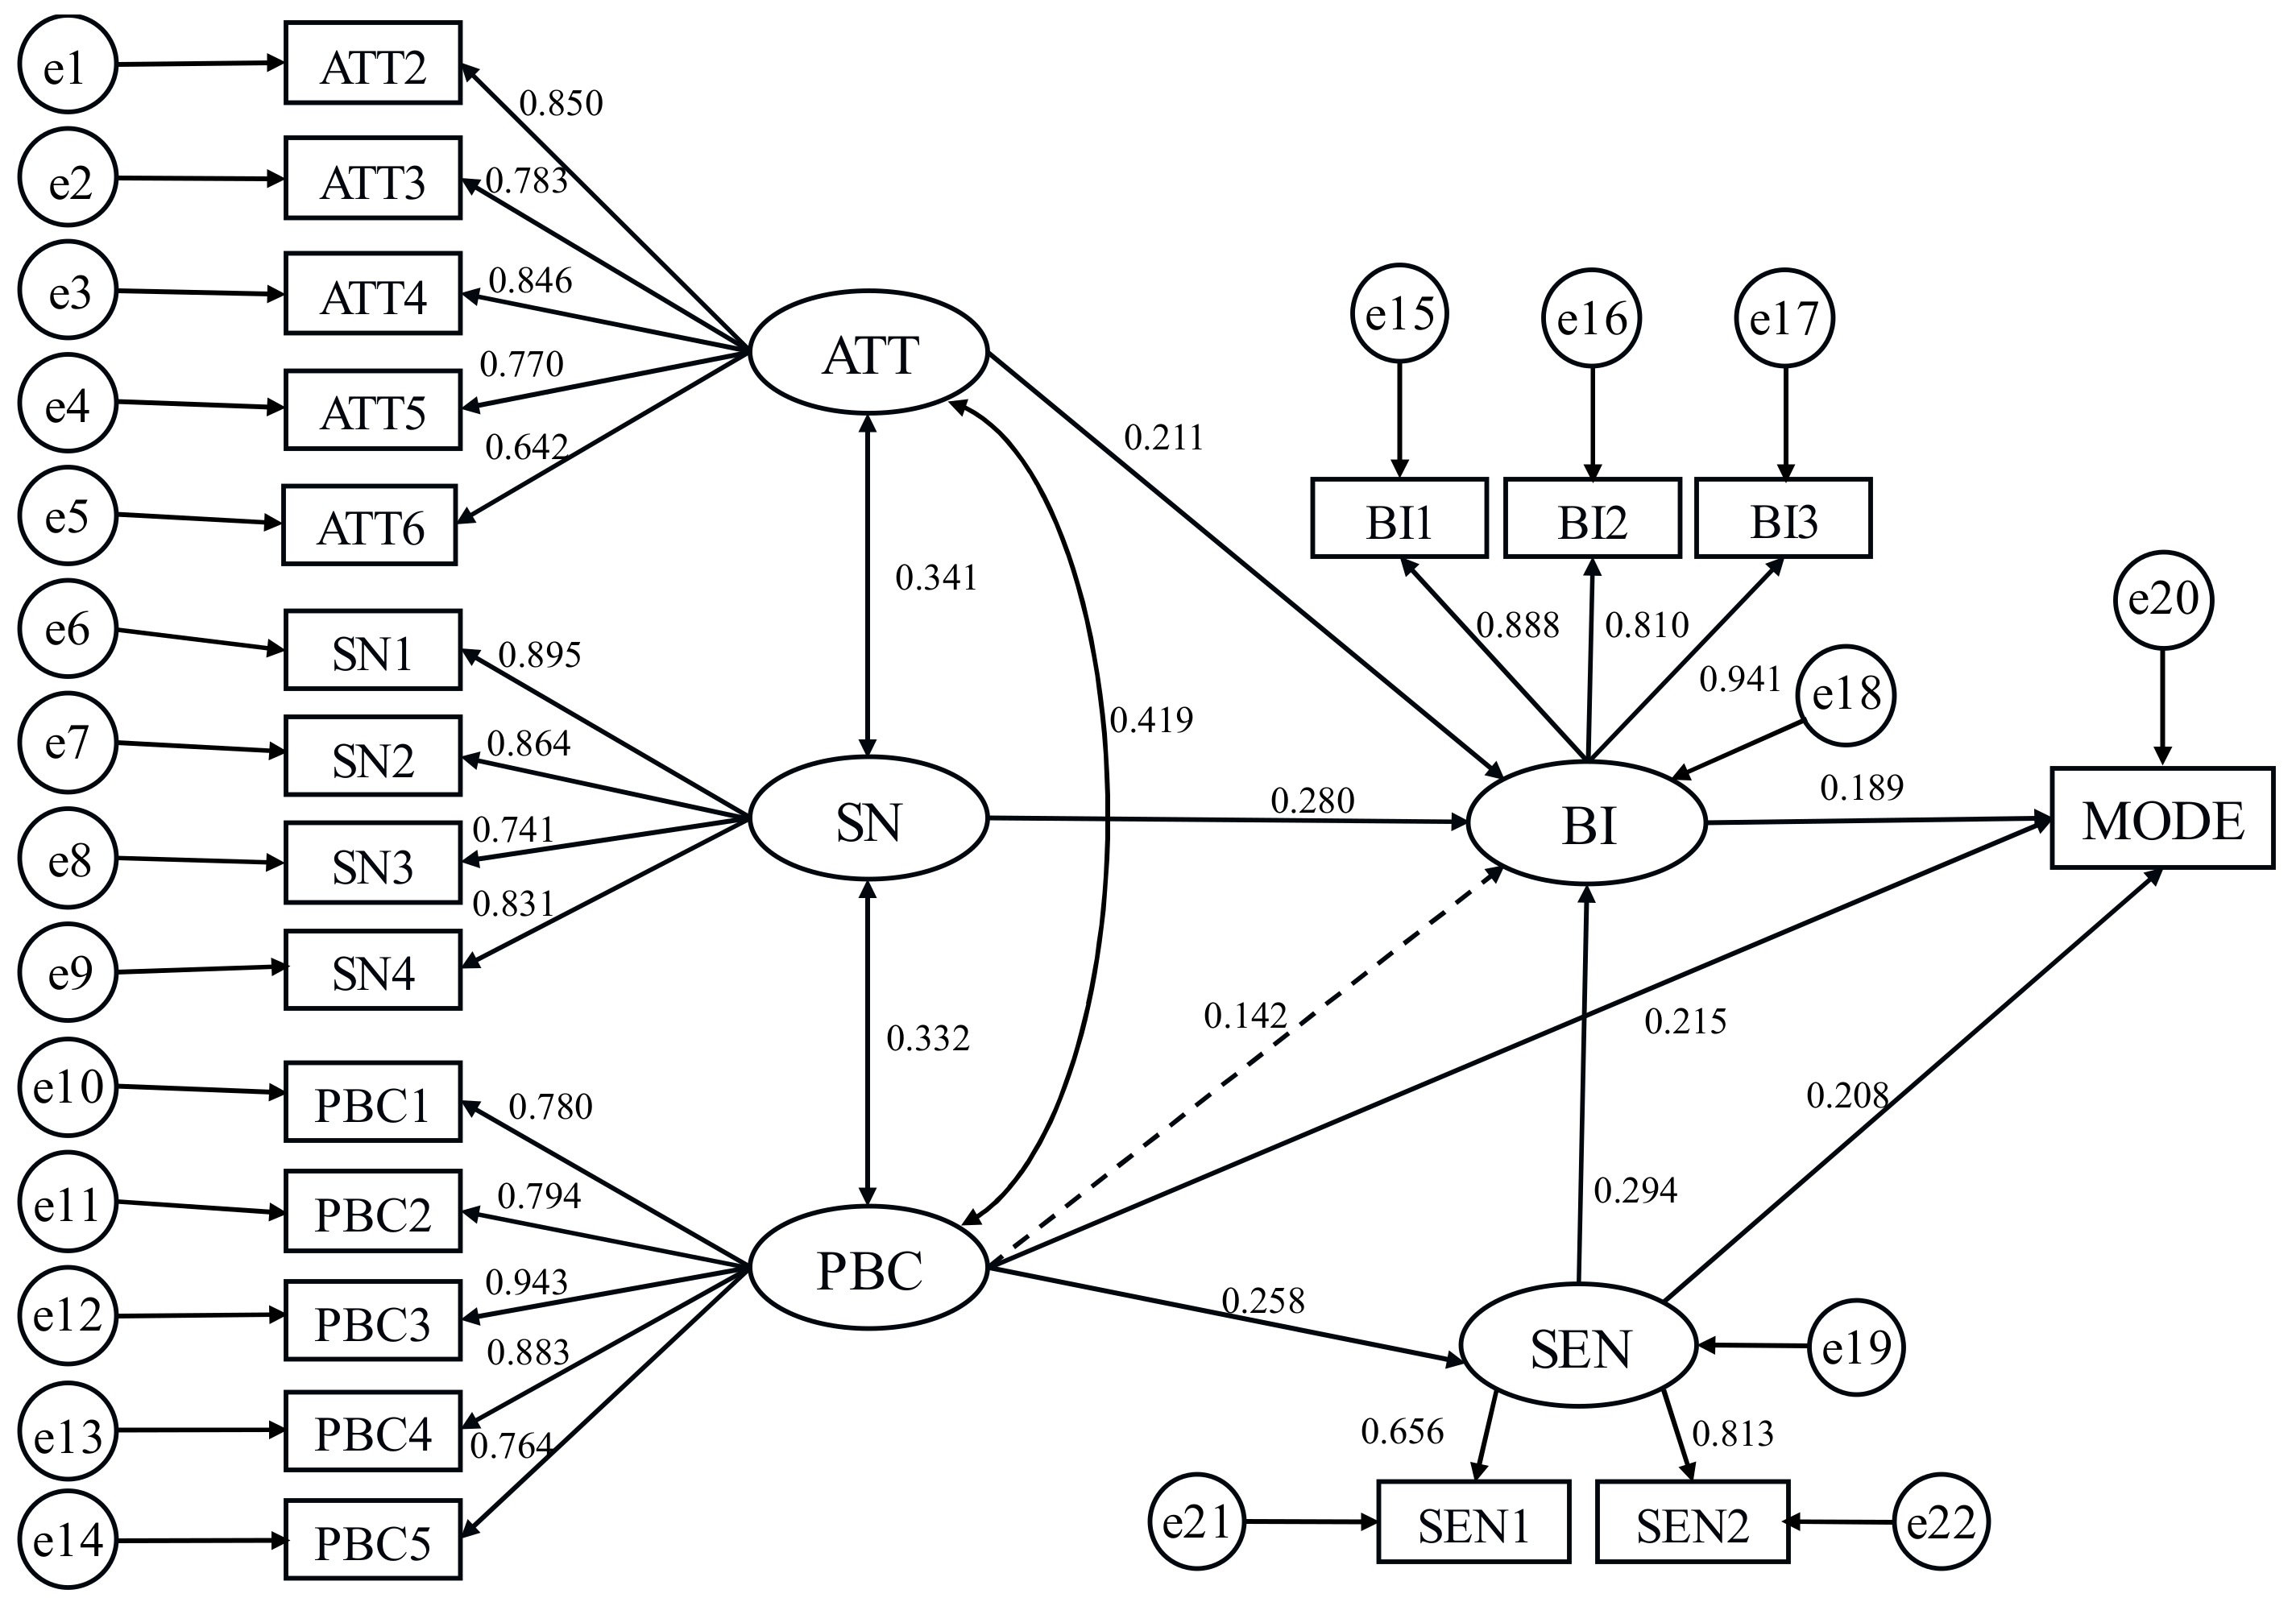
4.1. Analysis of SEM Estimation Results
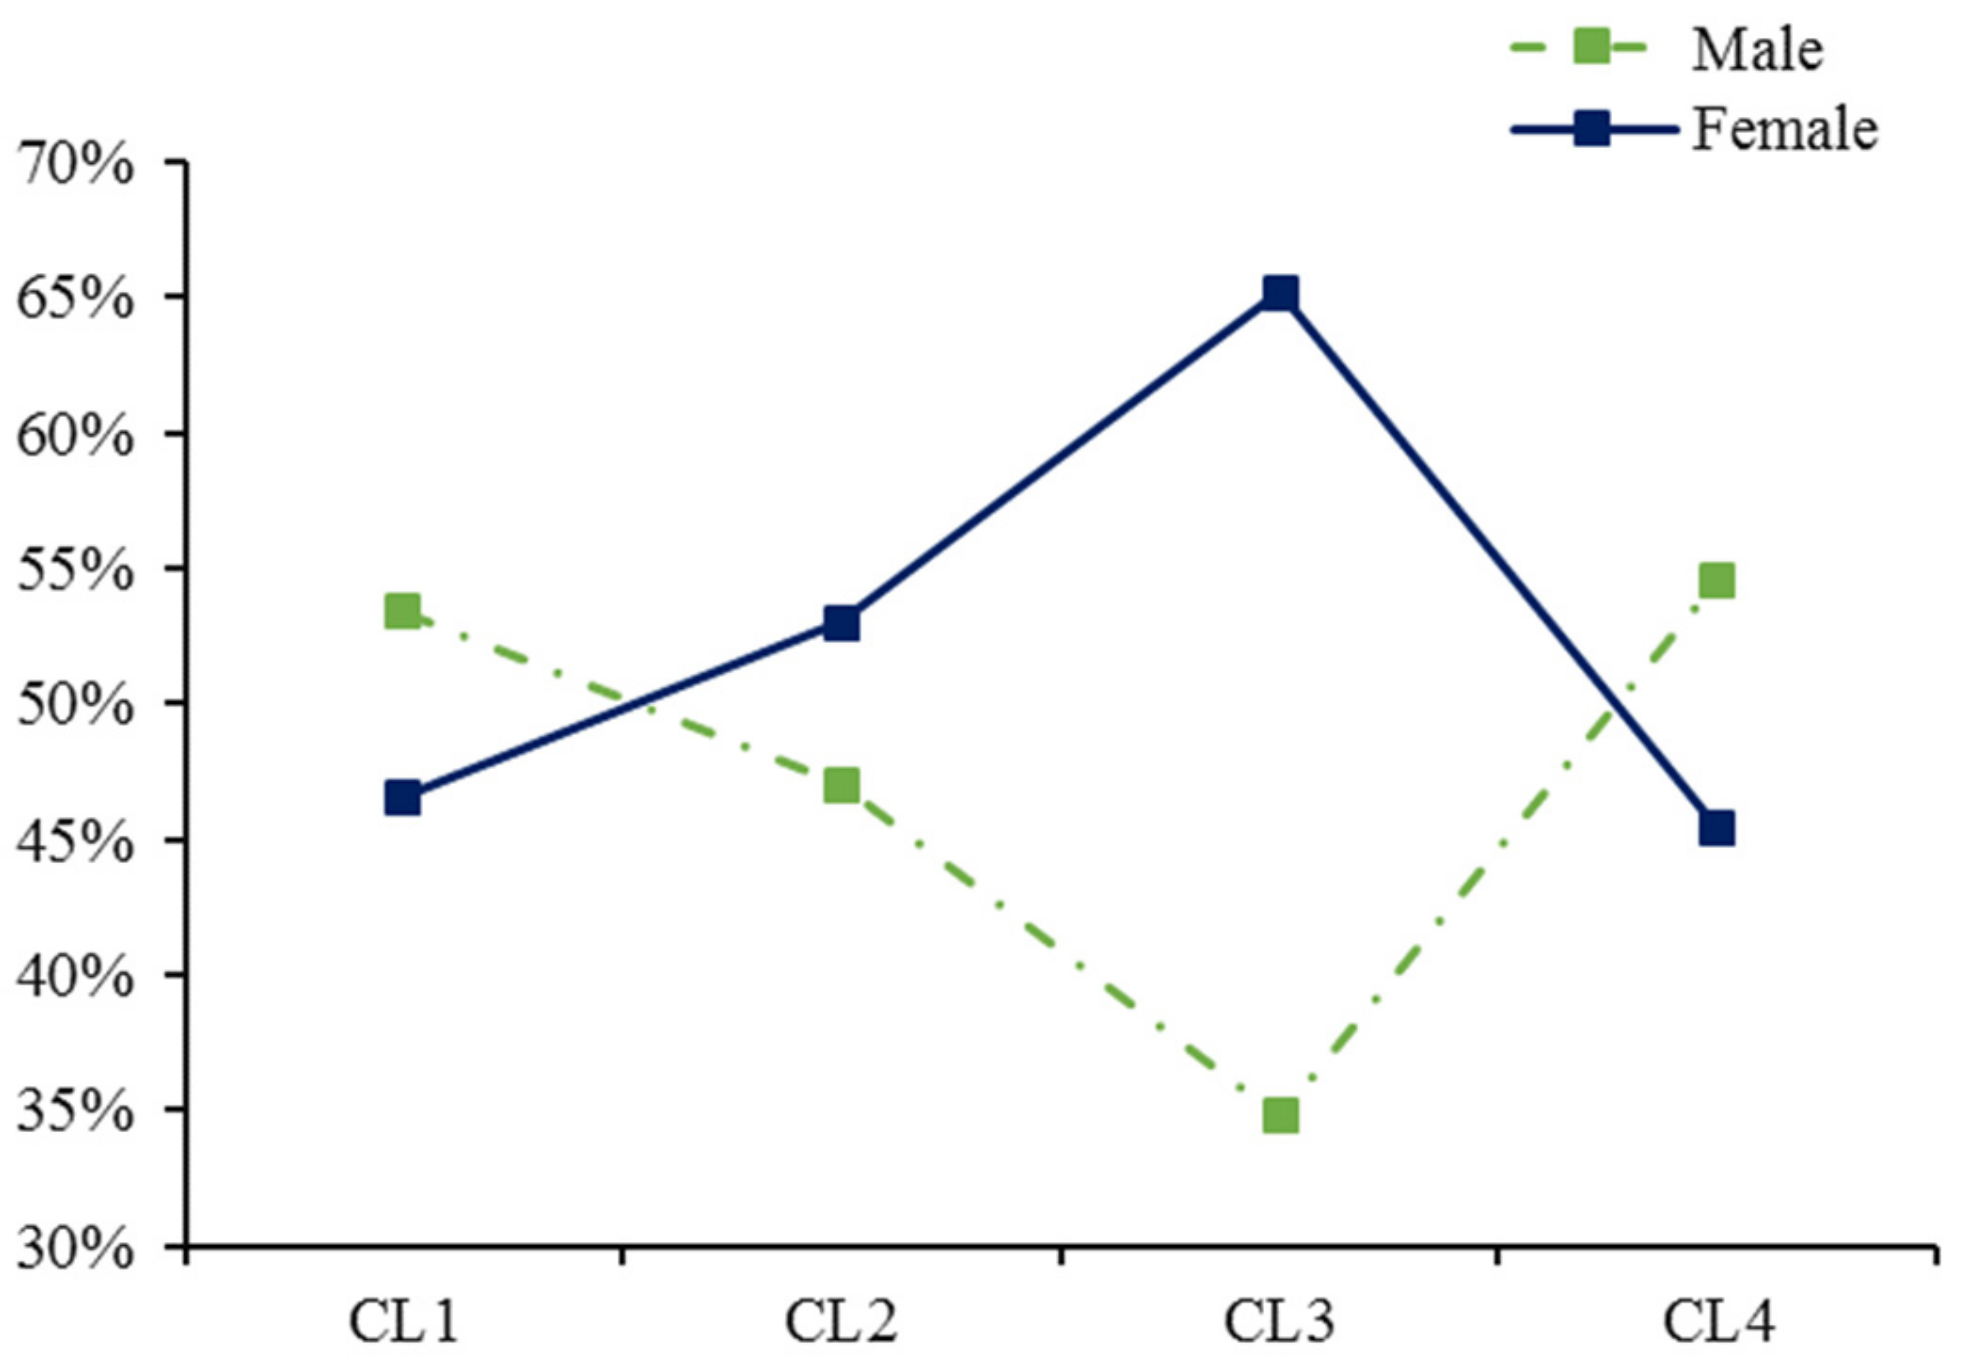
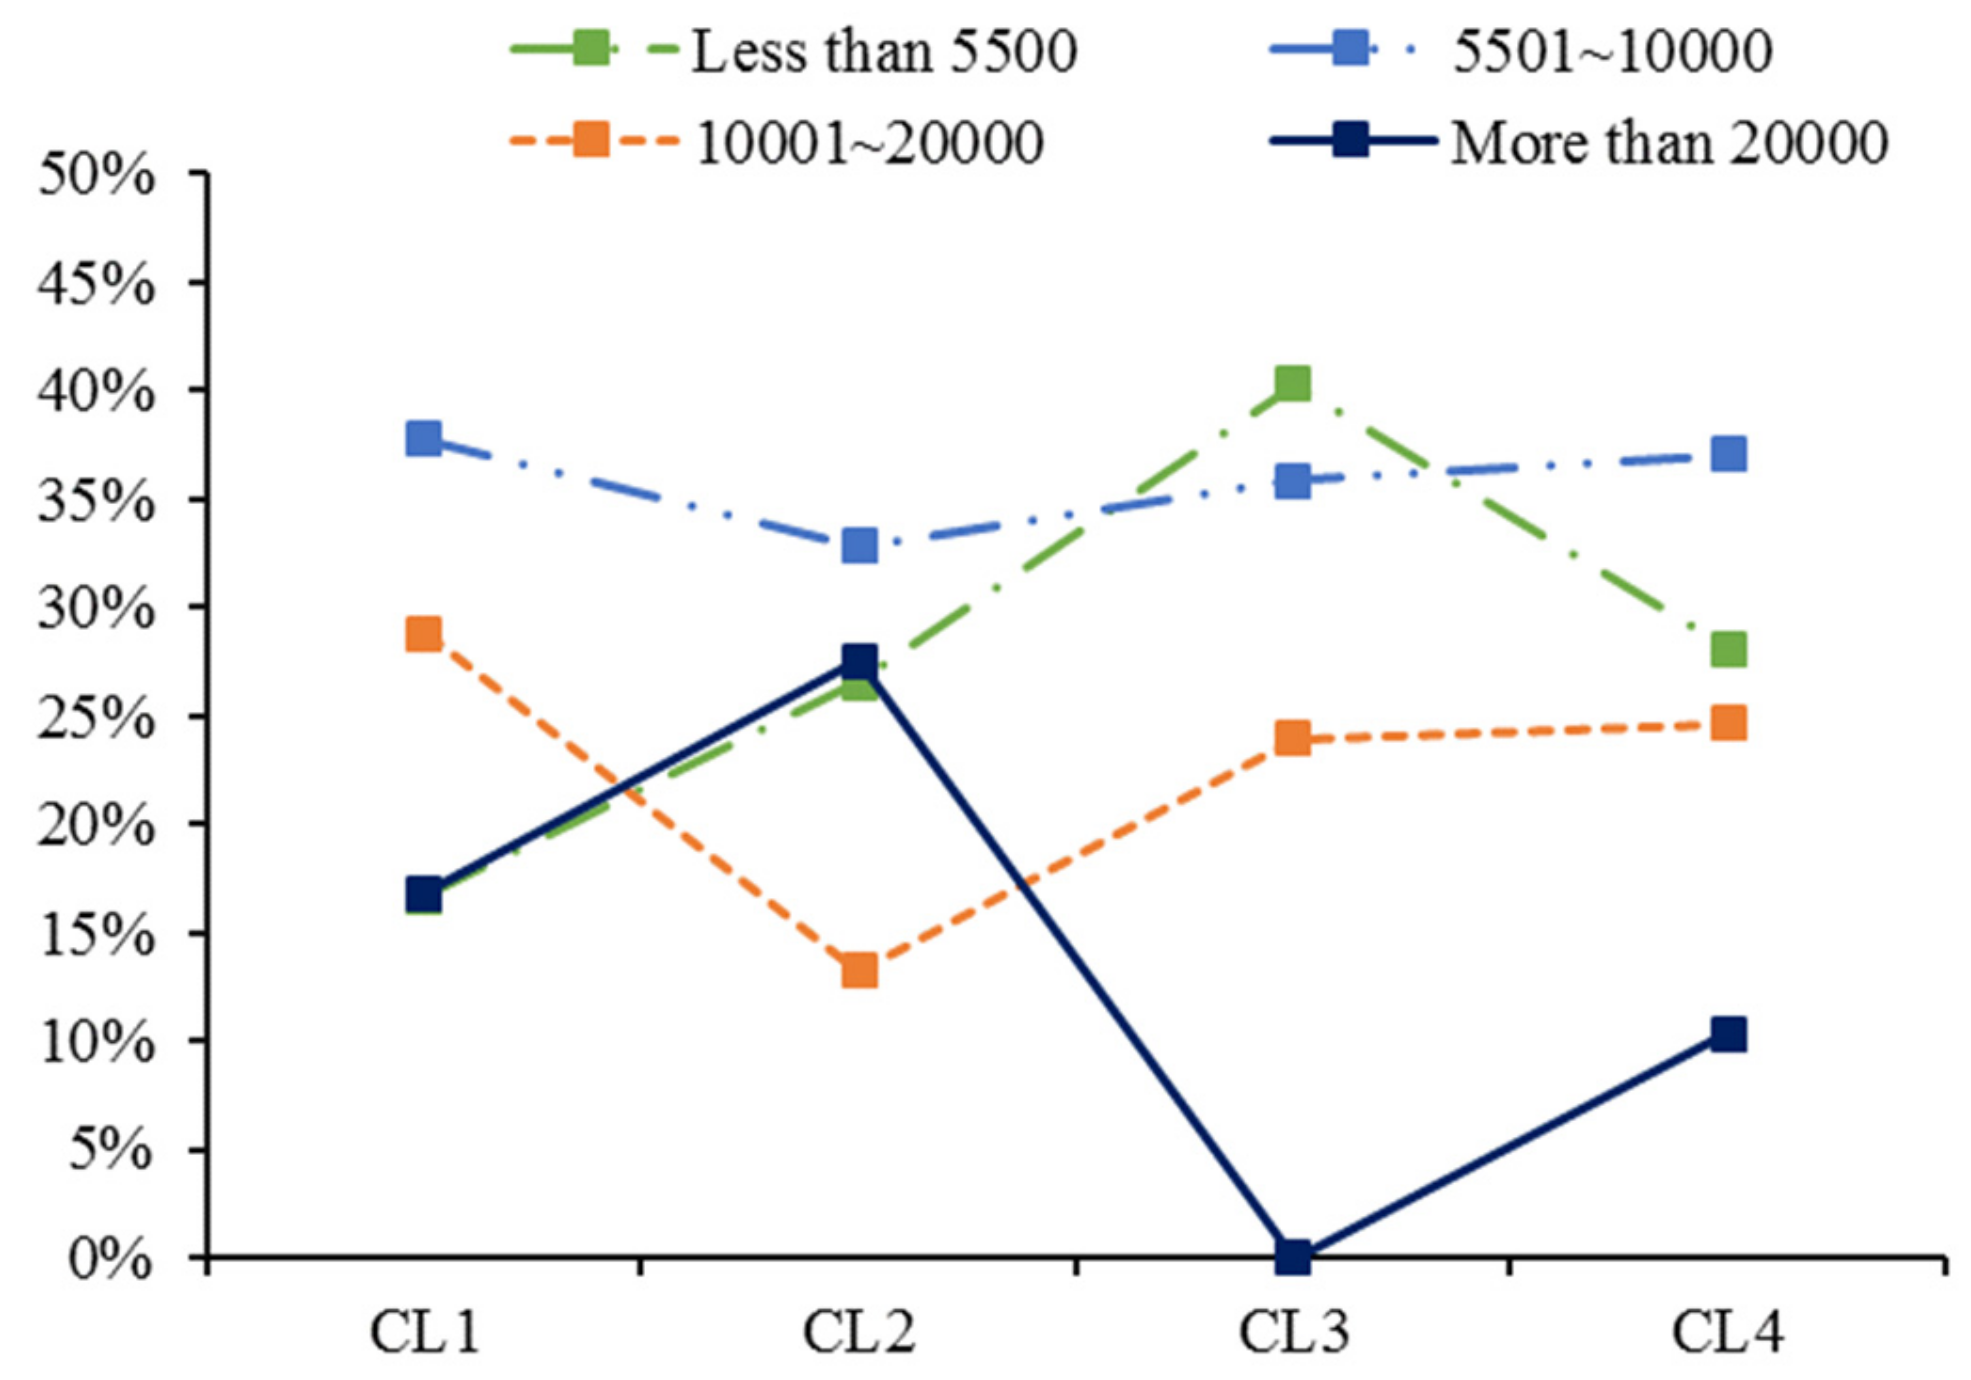
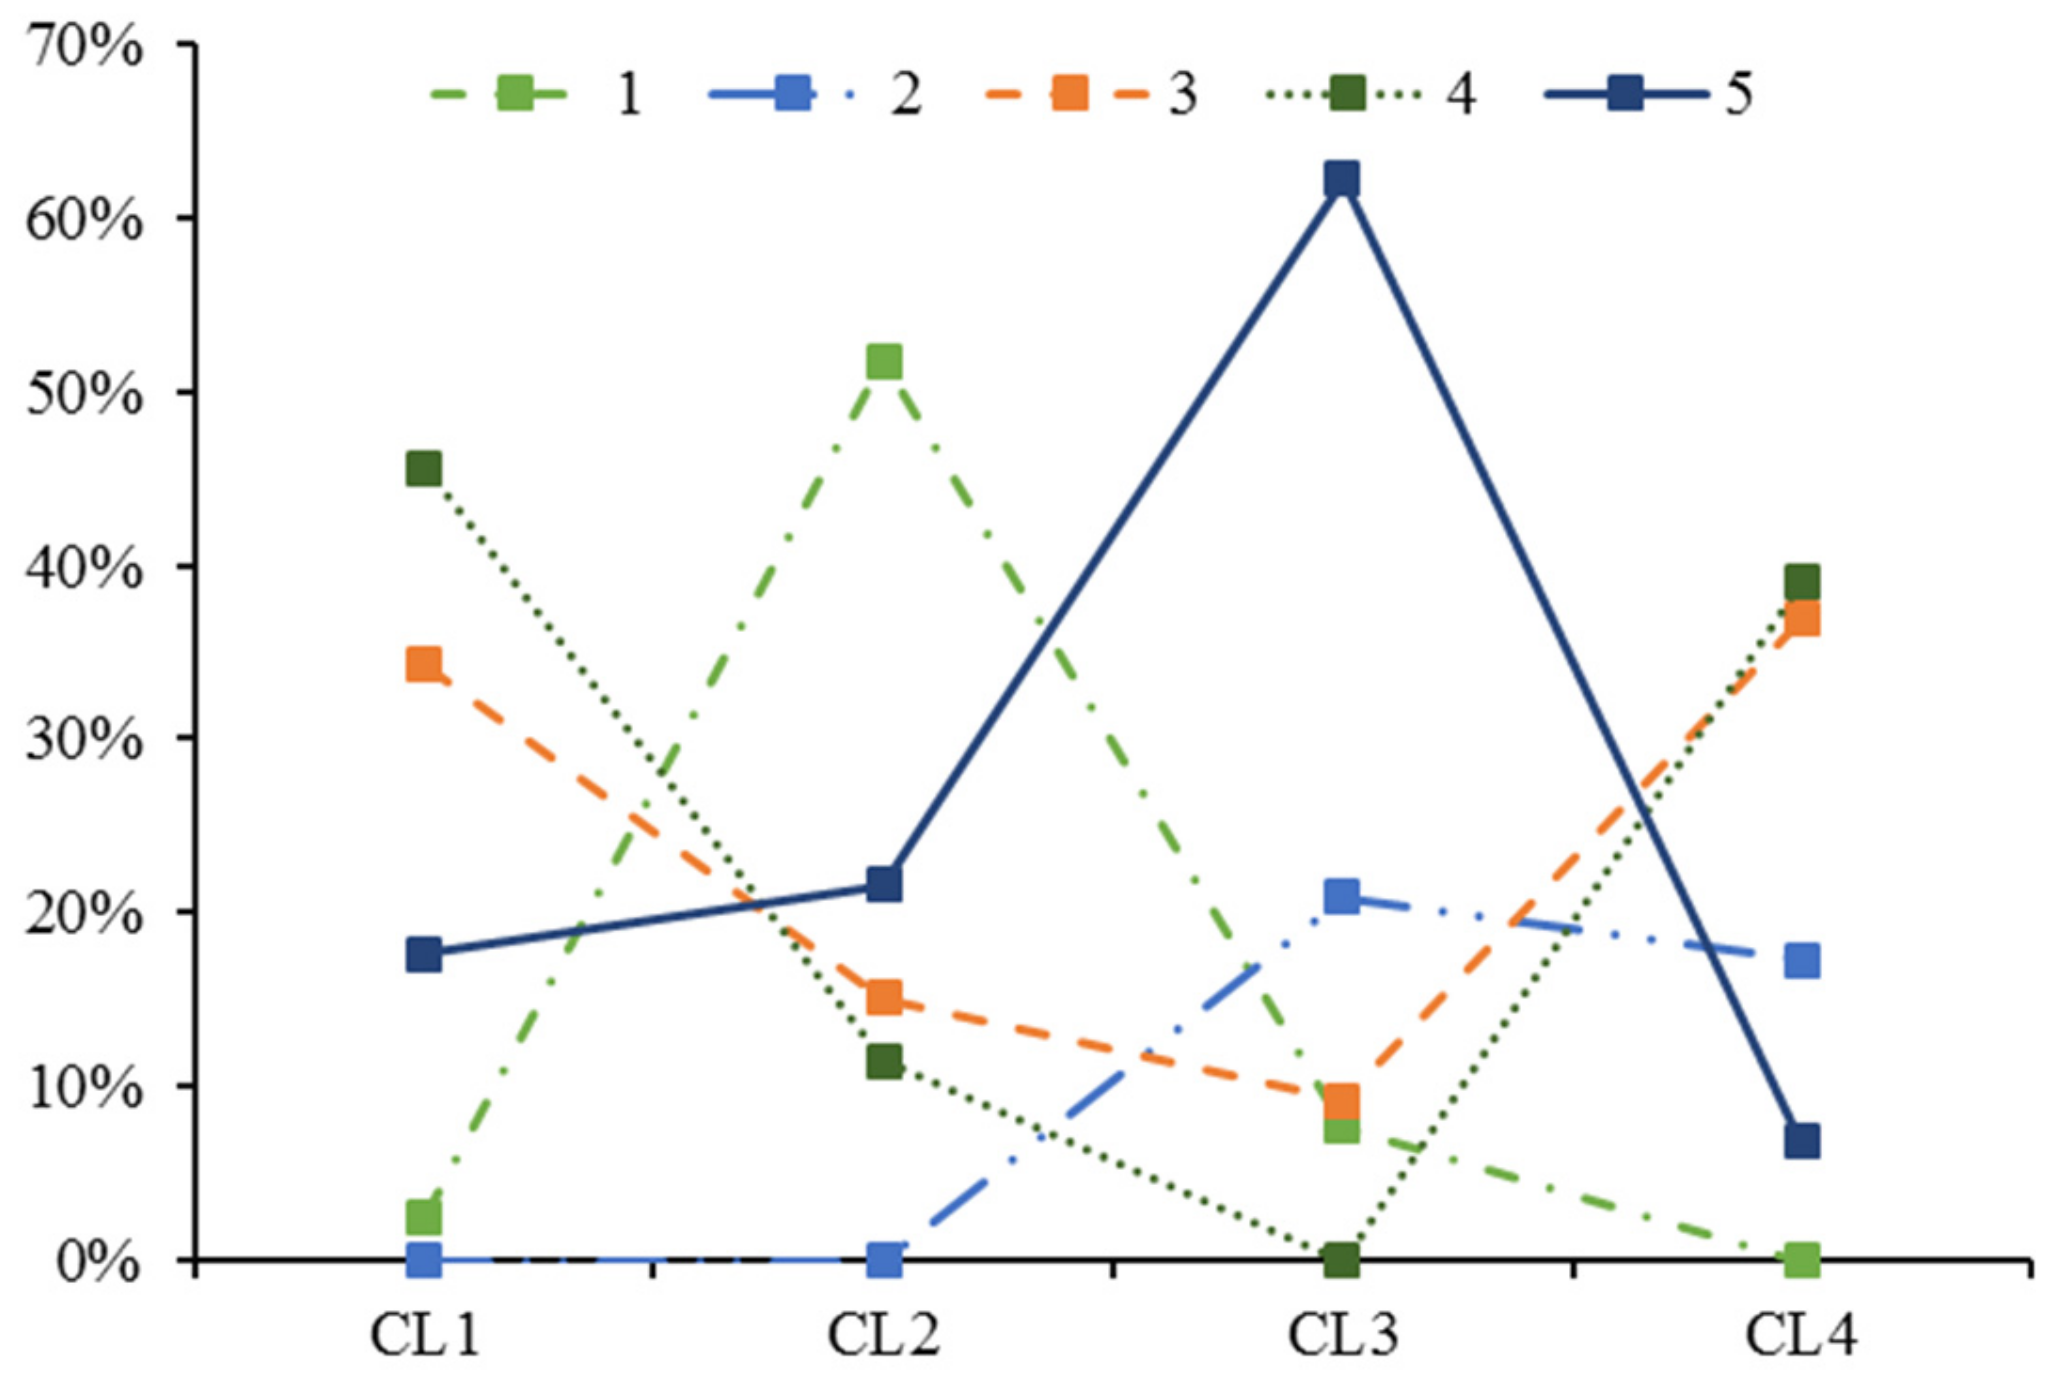
4.2. Analysis of LCM Estimation Results
4.2.1. Selection of Explicit Variables
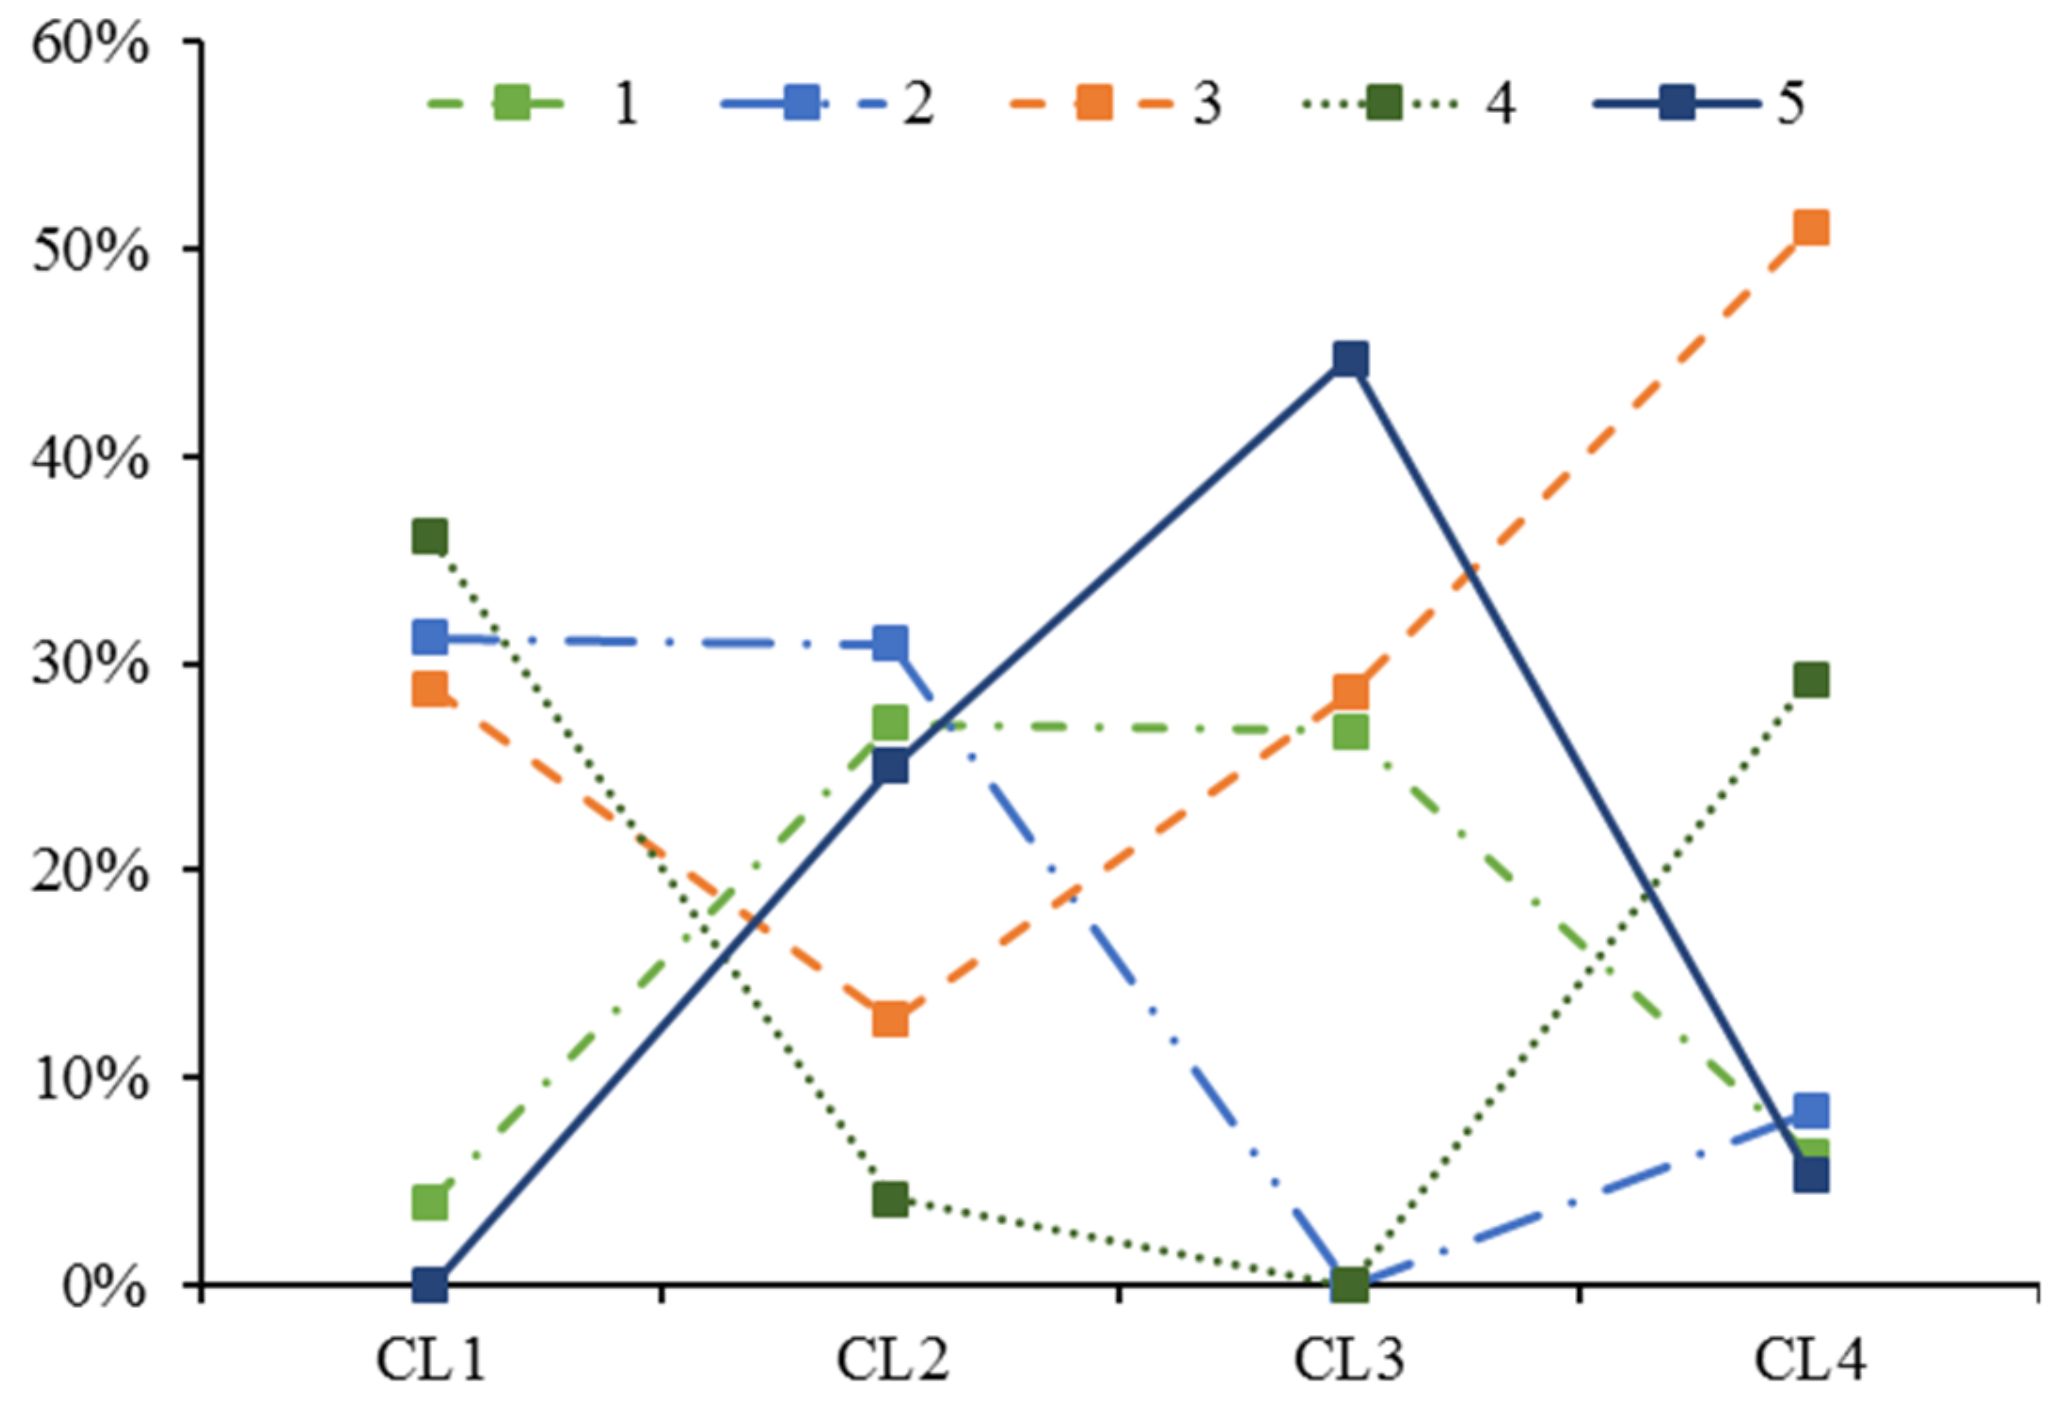
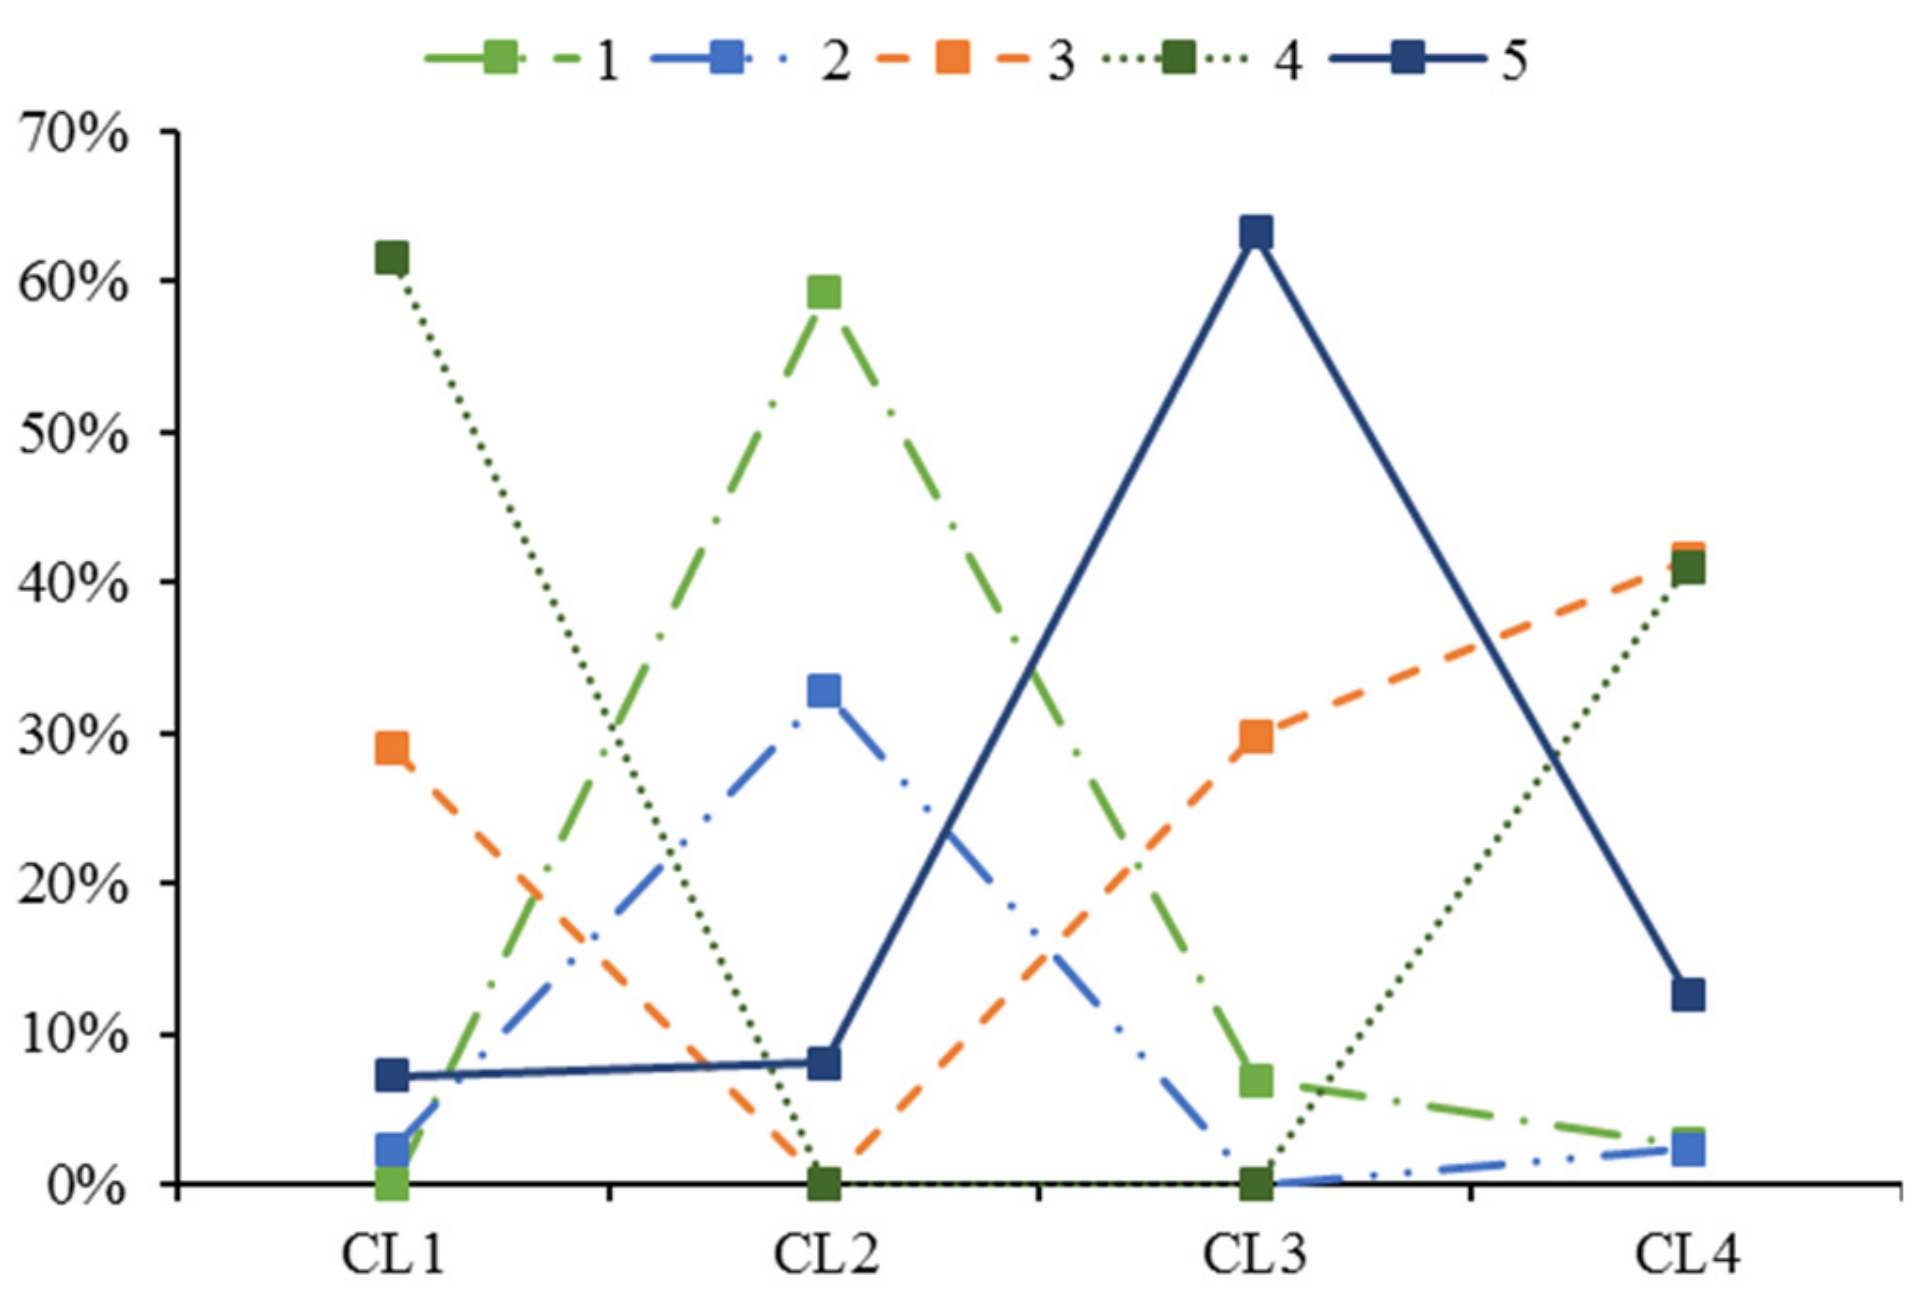
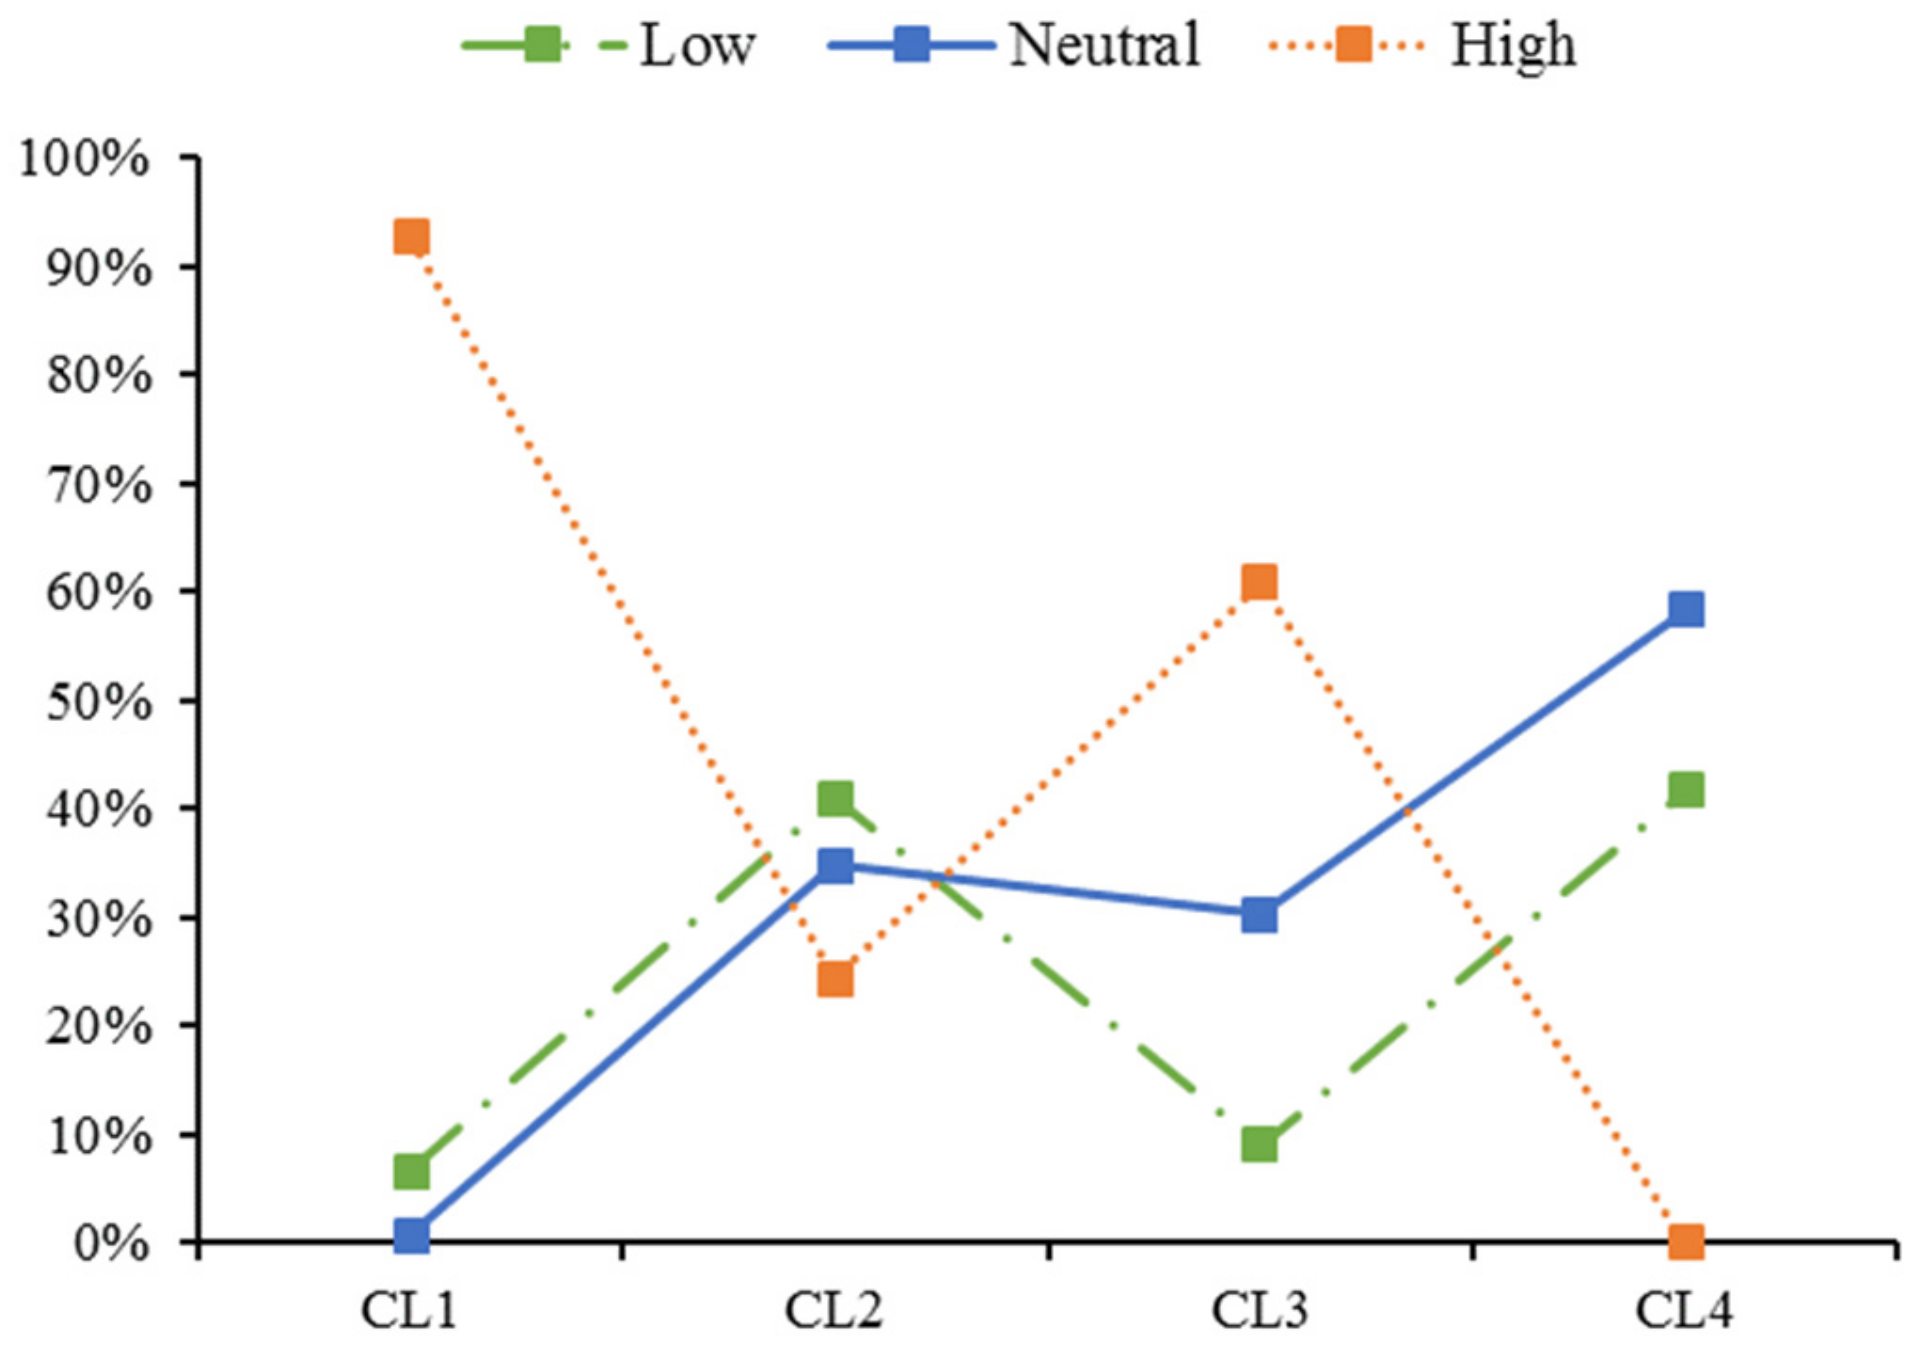
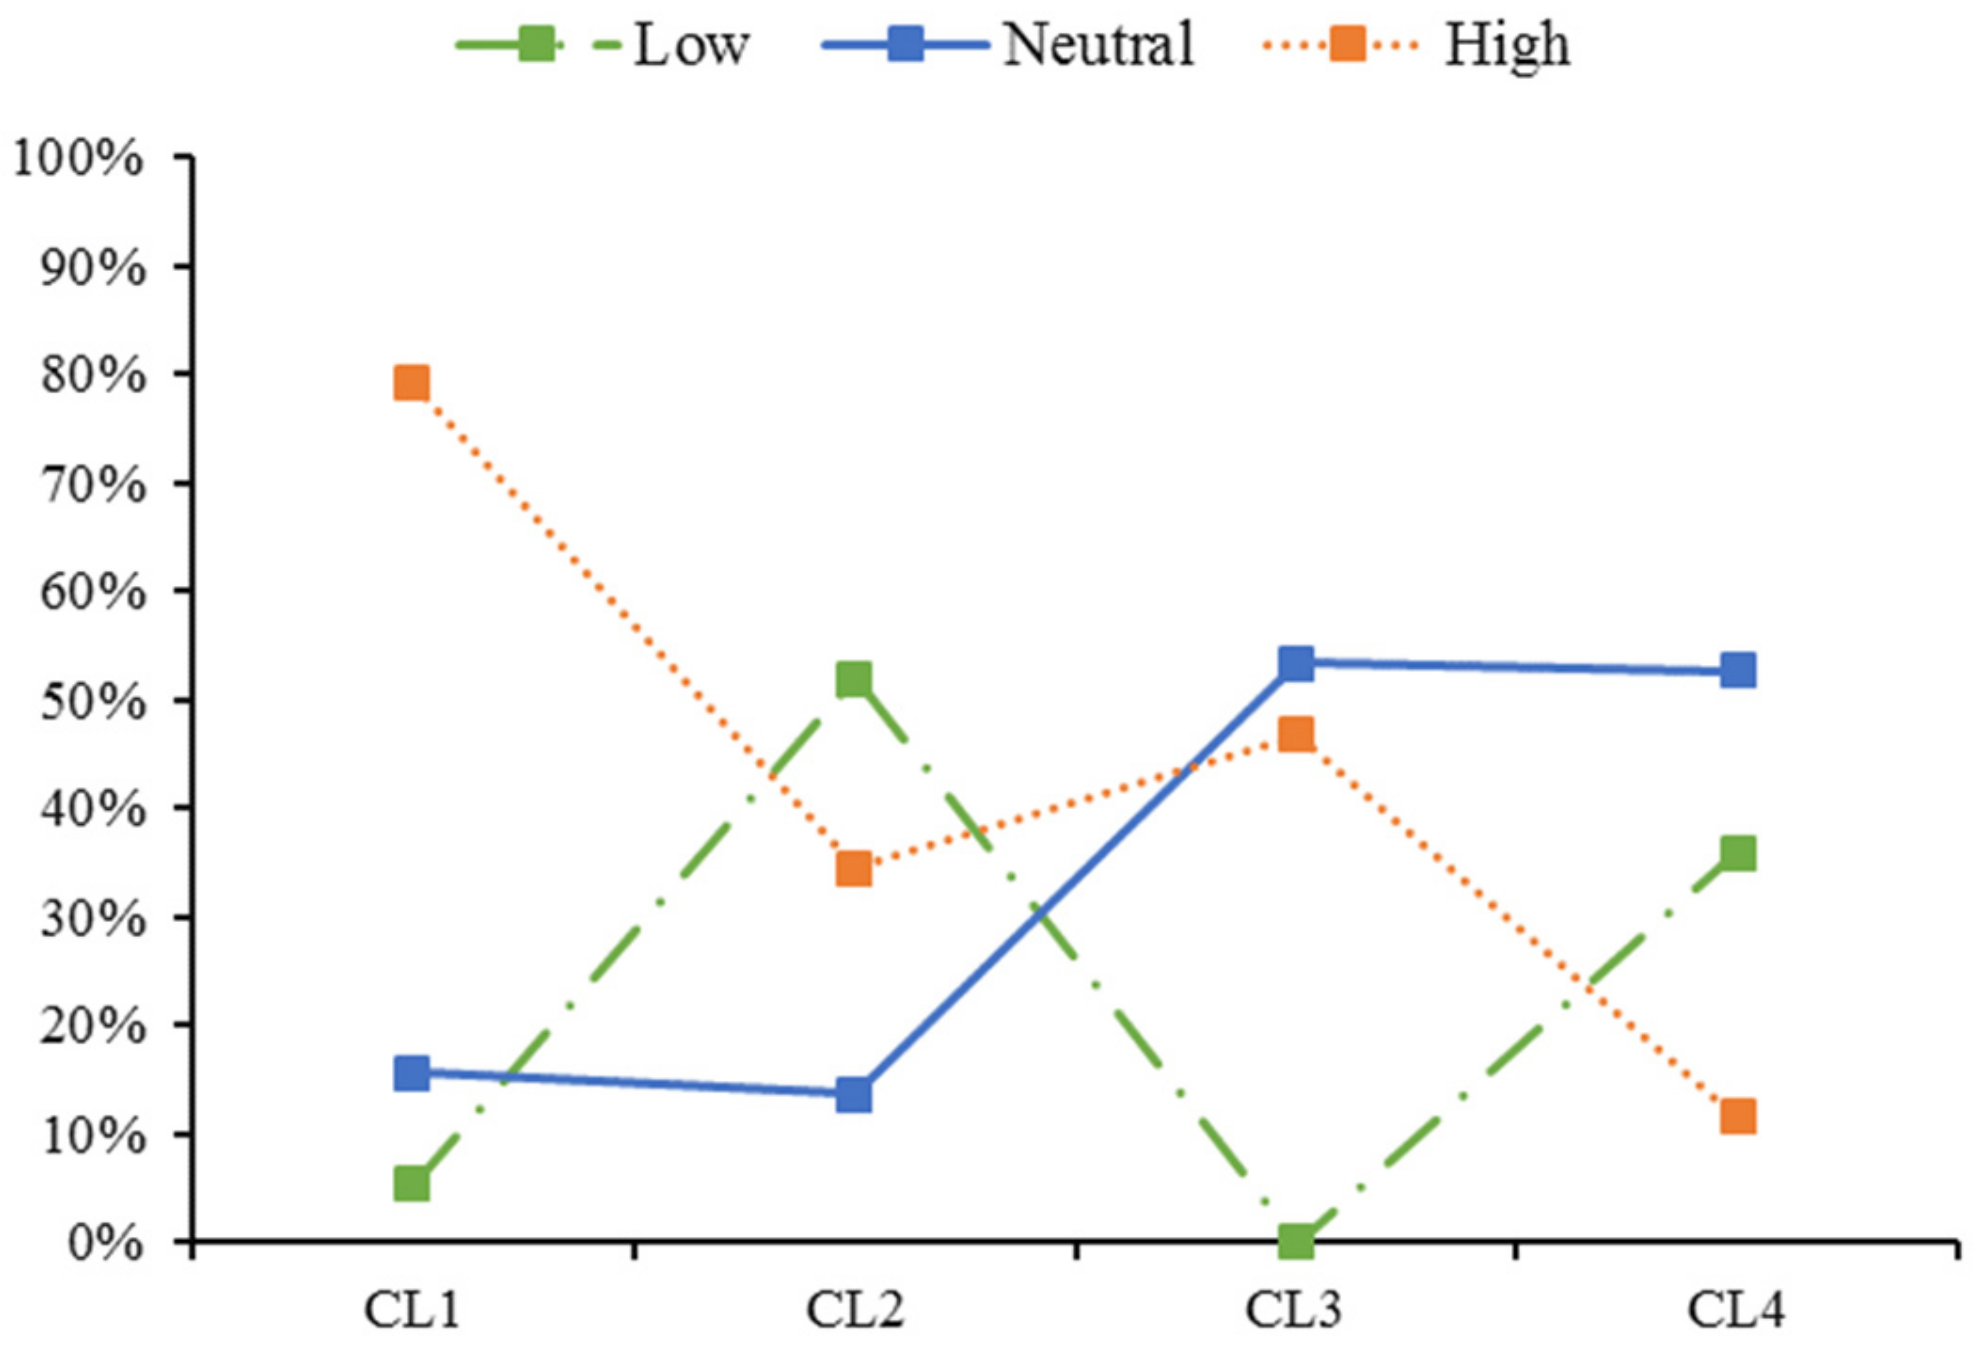
4.2.2. Parameter Estimation and Result Analysis
5. Conclusions
Author Contributions
Funding
Acknowledgments
Conflicts of Interest
References
- Xv, J.Q. Fundamentals of Traffic Engineering; China Communications Press: Beijing, China, 2015. [Google Scholar]
- Simon, H.S. A behavioral model of rational choice. Q. J. Econ. 1955, 1, 99–118. [Google Scholar] [CrossRef]
- Krishnan, K.S. Incorporating thresholds of indifference in probabilistic choice models. Manag. Sci. 1977, 23, 1224–1233. [Google Scholar] [CrossRef]
- Lioukas, S.K. Thresholds and transitivity in stochastic consumer choice a multinomial logit analysis. Manag. Sci. 1984, 30, 110–122. [Google Scholar] [CrossRef]
- Mahmassani, H.S.; Chang, G.L. On boundedly rational user equilibrium in transportation systems. Transp. Sci. 1987, 21, 89–99. [Google Scholar] [CrossRef]
- Mahmassani, H.S.; Chang, G.L. Experiments with departure time choice dynamics of urban commuters. Transp. Res. Pt. B-Methodol. 1986, 20, 297–320. [Google Scholar] [CrossRef]
- Mahmassani, H.S.; Jou, R.C. Transferring insights into commuter behavior dynamics from laboratory experiments to field surveys. Transp. Res. Pt. A-Policy Pract. 2000, 34, 243–260. [Google Scholar] [CrossRef]
- Di, X.; Liu, H.X.; Zhu, S.; David, M.L. Indifference bands for boundedly rational route switching. Transportation 2017, 44, 1169–1194. [Google Scholar] [CrossRef]
- Carrion, C.; Levinson, D.M. Route choice dynamics after a link restoration. Transp. B-Transp. Dyn. 2019, 7, 1155–1174. [Google Scholar] [CrossRef] [Green Version]
- Li, T.; Guan, H.Z.; Liang, K.K. Day-to-Day dynamical evolution of network traffic flow under bounded rational view. Acta Phys. Sin. 2016, 65, 17–27. [Google Scholar]
- Zhang, X.J.; Guan, H.Z.; Zhao, L.; Bian, F. Nested Logit Model on Travel Mode Choice under Boundebly Rational View. J. Transp. Syst. Eng. Inf. Technol. 2018, 6, 110–116. [Google Scholar]
- Wei, W.; Hui, J.S.; Zhi, W.W.; Wu, J.J. Optimal transit fare in a bimodal network under demand uncertainty and bounded rationality. J. Adv. Transp. 2014, 48, 957–973. [Google Scholar] [CrossRef]
- Guilford, J.P. Psychometric Methods; McGraw-Hill: New York, NY, USA, 1954. [Google Scholar]
- Quandt, R.E. A probabilistic theory of consumer behavior. Q. J. Econ. 1956, 70, 507–536. [Google Scholar] [CrossRef]
- Georgescu-Roegen, N. Threshold in Choice and the Theory of Demand. Econom. J. Econ. Soc. 1958, 157–168. [Google Scholar] [CrossRef]
- Han, Y.; Li, W.Y.; Wei, S.S.; Zhang, T.T. Research on Passenger’s Travel Mode Choice Behavior Waiting at Bus Station Based on SEM-Logit Integration Model. Sustainability 2018, 10, 1996. [Google Scholar] [CrossRef]
- Si, Y.; Guan, H.Z.; Cui, Y.C. Research on the Choice Behavior of Taxis and Express Services Based on the SEM-Logit Model. Sustainability 2019, 11, 2974. [Google Scholar] [CrossRef]
- Zhu, H.Y.; Guan, H.Z.; Han, Y.; Li, W.Y. A Study of Tourists’ Holiday Rush-Hour Avoidance Travel Behavior Considering Psychographic Segmentation. Sustainability 2019, 11, 3755. [Google Scholar] [CrossRef]
- Terry, L.; Cathy, H.C.H. Predicting behavioral intention of choosing a travel destination. Tour. Manag. 2006, 27, 589–599. [Google Scholar]
- Christian, A.K.; Anke, B. A comprehensive action determination model: Toward a broader understanding of ecological behaviour using the example of travel mode choice. J. Environ. Psychol. 2010, 30, 574–586. [Google Scholar] [Green Version]
- Zhang, L.; Ren, G.; Wang, W.J. Unsafe Behavior Improved Model for Bicycle Riding Based on Theory of Planned Behavior. China. Saf. Sci. J. 2010, 20, 43–48. [Google Scholar]
- Chen, J.; Yan, Q.P.; Yang, F. SEM-Logit Integration Model of Travel Mode Choice Behaviors. J. South China. Univ. Tech. 2013, 41, 51–57. [Google Scholar]
- Jing, P.; Juan, Z.C. Analysis of intercity travel mode choice in the theory of planned behavior. China. Sciencepaper. 2013, 8, 1088–1094. [Google Scholar]
- Szabolcs, D.; Sarbast, M. Sustainable Urban Transport Development with Stakeholder Participation, an AHP-Kendall Model: A Case Study for Mersin. Sustainability 2018, 10, 3647. [Google Scholar] [Green Version]
- Omid, G.; Sarbast, M.; Thomas, B.; Szabolcs, D. Sustainable Urban Transport Planning Considering Different Stakeholder Groups by an Interval-AHP Decision Support Model. Sustainability 2019, 11, 9. [Google Scholar]
- William, H.G.; David, A.H. A latent class model for discrete choice analysis: Contrasts with mixed logit. Transp. Res. Pt. B-Methodol. 2003, 37, 681–698. [Google Scholar]
- Wen, C.H.; Wang, W.C.; Fu, C. Latent class nested logit model for analyzing high-speed rail access mode choice. Transp. Res. Pt. E-Logist. Transp. Rev. 2012, 48, 545–554. [Google Scholar] [CrossRef]
- Molin, E.; Mokhtarian, P.; Kroesen, M. Multimodal travel groups and attitudes: A latent class cluster analysis of Dutch travelers. Transp. Res. Part A Policy Pract. 2016, 83, 14–29. [Google Scholar] [CrossRef] [Green Version]
- López-Bonilla, L.M.; López-Bonilla, J.M. Postmodernism and Heterogeneity of Leisure Tourist Behavior Patterns. Leis. Sci. 2009, 31, 68–83. [Google Scholar] [CrossRef]
- William, G.; Mark, N.H.; Bruce, H.; Pushkar, M. A latent class model for obesity. Econ. Lett. 2014, 123, 1–5. [Google Scholar] [Green Version]
- Wen, C.H.; Lai, S.C. Latent class models of international air carrier choice. Transp. Res. Pt. E-Logist. Transp. Rev. 2010, 46, 211–221. [Google Scholar] [CrossRef]
- Ajzen, I. The Theory of Planned Behavior. Org. Behav. Hum. Decis. Process. 1991, 50, 179–211. [Google Scholar] [CrossRef]
- Arellana, J.; Daly, A.; Hess, S.; de Dios Ortúzar, J.; Rizzi, L.I. Development of Surveys for Study of Departure Time Choice: Two-Stage Approach to Efficient Design. Transp. Res. Rec. J. Res. Board. 2012, 2303, 9–18. [Google Scholar] [CrossRef] [Green Version]
- Thorhauge, M.; Haustein, S.; Cherchi, E. Accounting for the Theory of Planned Behaviour in departure time choice. Transp. Res. Pt. F: Trac. Psychol. Behav. 2016, 38, 94–105. [Google Scholar] [CrossRef] [Green Version]


| Latent Variable | Observed Variable |
|---|---|
| Attitude (ATT) | Public transportation is cheaper (ATT1) |
| Public transportation saves time (ATT2) | |
| Public transportation is safer (ATT3) | |
| Public transportation is more punctual (ATT4) | |
| Public transportation is more convenient (ATT5) | |
| Public transportation is more comfortable (ATT6) | |
| Subject norm (SN) | Choosing public transportation is influenced by the attitudes of friends and relatives (SN1) |
| Choosing public transport is influenced by television, internet and other media and public opinion (SN2) | |
| Public transportation is influenced by the government’s preferential measures (SN3) | |
| Choosing public transportation because the families do (SN4) | |
| Perceived behavior control (PBC) | Public transport stations are easily accessible (PBC1) |
| Public transport has short waiting times (PBC2) | |
| Public transport is easy to transfer (PBC3) | |
| Easy access to public transport stations (PBC4) | |
| Public transportation utilities as a percentage of income are low (PBC5) | |
| Car travel accounts for a high proportion of income (PBC6) | |
| Behavior intention (BI) | I have a strong intention to choose public transportation (BI1) |
| I plan to choose public transportation instead of private transportation (BI2) | |
| I would like to encourage people around me to choose public transportation (BI3) |
| Variable | Description | Frequency | Percentage (%) |
|---|---|---|---|
| Gender | Male | 107 | 50.47% |
| Female | 105 | 49.53% | |
| Age (years) | 18–30 | 30 | 14.15% |
| 31–40 | 138 | 65.09% | |
| 41–50 | 31 | 14.62% | |
| 51–60 | 12 | 5.66% | |
| More than 60 | 1 | 0.47% | |
| Occupation | Student | 5 | 2.36% |
| Institution staff | 39 | 18.40% | |
| Corporate staff | 122 | 57.55% | |
| Individual businesses | 6 | 2.83% | |
| Freelance | 21 | 9.91% | |
| Retired | 3 | 1.42% | |
| Others | 16 | 7.55% | |
| Education level | High school or below | 11 | 5.19% |
| Junior college | 48 | 22.64% | |
| Bachelor’s degree | 92 | 43.40% | |
| Master’s/Doctorate degree | 61 | 28.77% | |
| Monthly income (RMB) | Less than 2500 | 7 | 3.30% |
| 2501–4000 | 21 | 9.91% | |
| 4001–5500 | 30 | 14.15% | |
| 5501–7000 | 22 | 10.38% | |
| 7001–1,0000 | 55 | 25.94% | |
| 10,001–20,000 | 50 | 23.58% | |
| More than 20,000 | 27 | 12.74% | |
| Family resident population | One | 10 | 4.72% |
| Two | 24 | 11.32% | |
| More than three | 178 | 83.96% |
| The Change in Time-Cost Producing a Mode Transfer (min) | Sensitivity to Changes in Time-Cost | Frequency | Percentage (%) |
| 5,10 | high | 64 | 30.2 |
| 15,20 | neutral | 85 | 40.1 |
| 25 | low | 63 | 29.7 |
| The Change in Expense-Cost Making Mode Transfer (yuan) | Sensitivity to Changes in Expense-Cost | Frequency | Percentage (%) |
| ≤5 | high | 58 | 27.4 |
| 10,15 | neutral | 84 | 39.6 |
| 20 | low | 70 | 33.0 |
| Factor 1 | Factor 2 | Factor 3 | Factor 4 | Factor 5 | |
|---|---|---|---|---|---|
| ATT2 | 0.156 | 0.845 | 0.085 | 0.116 | –0.006 |
| ATT3 | 0.203 | 0.779 | 0.079 | 0.163 | –0.023 |
| ATT4 | 0.216 | 0.807 | 0.016 | 0.170 | 0.014 |
| ATT5 | 0.076 | 0.853 | 0.188 | 0.072 | 0.077 |
| ATT6 | 0.079 | 0.722 | 0.270 | 0.076 | 0.136 |
| SN1 | 0.120 | 0.104 | 0.884 | 0.131 | 0.037 |
| SN2 | 0.082 | 0.130 | 0.893 | 0.065 | −0.049 |
| SN3 | 0.229 | 0.187 | 0.685 | 0.286 | 0.001 |
| SN4 | 0.148 | 0.150 | 0.851 | 0.131 | −0.055 |
| PBC1 | 0.853 | 0.058 | 0.174 | 0.090 | 0.047 |
| PBC2 | 0.865 | 0.132 | 0.136 | 0.065 | 0.026 |
| PBC3 | 0.872 | 0.173 | 0.095 | 0.167 | 0.094 |
| PBC4 | 0.860 | 0.226 | 0.100 | 0.096 | 0.080 |
| PBC5 | 0.804 | 0.165 | 0.095 | 0.146 | 0.074 |
| BI1 | 0.196 | 0.186 | 0.090 | 0.879 | 0.125 |
| BI2 | 0.109 | 0.134 | 0.318 | 0.812 | 0.110 |
| BI3 | 0.167 | 0.205 | 0.166 | 0.879 | 0.125 |
| SEN1 | 0.120 | 0.053 | 0.027 | 0.062 | 0.871 |
| SEN2 | 0.085 | 0.063 | −0.093 | 0.214 | 0.830 |
| Fitness Index | Result | Ideal Standard | Acceptable Standard |
|---|---|---|---|
| Likelihood-ratio Chi-square/degrees of freedom () | 1.459 | 1~3 | |
| Goodness-of-fit index (GFI) | 0.908 | >0.90 | >0.80 |
| Adjusted goodness-of-fit index (AGFI) | 0.873 | >0.90 | >0.80 |
| Root mean square residual (RMR) | 0.060 | <0.05 | <0.06 |
| Root mean square error of approximation (RMSEA) | 0.047 | <0.08 | <0.09 |
| Normed fit index (NFI) | 0.926 | >0.90 | >0.80 |
| Incremental fit index (IFI) | 0.976 | >0.90 | >0.80 |
| Comparative fit index (CFI) | 0.975 | >0.90 | >0.80 |
| Path | Estimate | S.E. | C.R. | P | ||
|---|---|---|---|---|---|---|
| SEN | ← | PBC | 0.258 | 0.052 | 2.824 | 0.005 |
| BI | ← | ATT | 0.211 | 0.069 | 2.875 | 0.004 |
| BI | ← | SN | 0.28 | 0.065 | 4.041 | *** |
| BI | ← | PBC | 0.142 | 0.083 | 1.906 | 0.057 |
| BI | ← | SEN | 0.294 | 0.153 | 3.723 | *** |
| ATT2 | ← | ATT | 0.85 | |||
| ATT3 | ← | ATT | 0.783 | 0.059 | 13.386 | *** |
| ATT4 | ← | ATT | 0.846 | 0.066 | 14.536 | *** |
| ATT5 | ← | ATT | 0.77 | 0.066 | 12.767 | *** |
| ATT6 | ← | ATT | 0.642 | 0.075 | 9.753 | *** |
| SN1 | ← | SN | 0.895 | |||
| SN2 | ← | SN | 0.864 | 0.057 | 16.551 | *** |
| SN3 | ← | SN | 0.741 | 0.064 | 11.765 | *** |
| SN4 | ← | SN | 0.831 | 0.059 | 15.524 | *** |
| PBC1 | ← | PBC | 0.78 | |||
| PBC2 | ← | PBC | 0.794 | 0.059 | 17.935 | *** |
| PBC3 | ← | PBC | 0.943 | 0.079 | 15.185 | *** |
| PBC4 | ← | PBC | 0.883 | 0.078 | 14.306 | *** |
| PBC5 | ← | PBC | 0.764 | 0.075 | 11.862 | *** |
| BI1 | ← | BI | 0.888 | |||
| BI2 | ← | BI | 0.810 | 0.051 | 15.427 | *** |
| BI3 | ← | BI | 0.941 | 0.055 | 19.475 | *** |
| MODE | ← | BI | 0.189 | 0.029 | 2.464 | 0.014 |
| MODE | ← | SEN | 0.215 | 0.03 | 2.967 | 0.003 |
| MODE | ← | PBC | 0.208 | 0.061 | 2.494 | 0.013 |
| SEN1 | ← | SEN | 0.656 | |||
| SEN2 | ← | SEN | 0.813 | 0.258 | 4.792 | *** |
| ATT | ↔ | SN | 0.341 | 0.091 | 4.193 | *** |
| ATT | ↔ | PBC | 0.419 | 0.08 | 4.9 | *** |
| SN | ↔ | PBC | 0.331 | 0.076 | 4.127 | *** |
| Factors | Variables | Level | Description |
|---|---|---|---|
| SEX | V1 | 1 | Male |
| 2 | Female | ||
| INCOME | V2 | 1 | Less than 5500 |
| 2 | 5501~10,000 | ||
| 3 | 10,001~20,000 | ||
| 4 | More than 20,000 | ||
| I think public transportation is more punctual. | V3 | 1 | Strongly disagree |
| 2 | Disagree | ||
| 3 | General | ||
| 4 | Agree | ||
| 5 | Strongly agree | ||
| I choose public transportation under the influence of media, such as television and the internet, and public opinion. | V4 | 1 | Strongly disagree |
| 2 | Disagree | ||
| 3 | General | ||
| 4 | Agree | ||
| 5 | Strongly agree | ||
| I think the waiting time for public transportation is short. | V5 | 1 | Strongly disagree |
| 2 | Disagree | ||
| 3 | General | ||
| 4 | Agree | ||
| 5 | Strongly agree | ||
| SEN1 | V6 | 1 | Low |
| 2 | Neutral | ||
| 3 | High | ||
| SEN2 | V7 | 1 | Low |
| 2 | Neutral | ||
| 3 | Low |
| Categories | AIC | BIC | Entropy | χ2 | G2 |
|---|---|---|---|---|---|
| 2 | 3650.465 | 3788.085 | 0.800 | 5620.719 (1.0000) | 1137.807 (1.0000) |
| 3 | 3605.291 | 3813.399 | 0.820 | 5338.779 (1.0000) | 1098.405 (1.0000) |
| 4 | 3582.367 | 3860.964 | 0.904 | 4261.356 (1.0000) | 1005.457 (1.0000) |
| 5 | 3583.681 | 3932.766 | 0.923 | 4000.536 (1.0000) | 964.252 (1.0000) |
| 6 | 3587.004 | 4006.577 | 0.898 | 3589.426 (1.0000) | 912.448 (1.0000) |
| Observed Variables | Variables | Level | Conditional Probability of Latent Class | |||
|---|---|---|---|---|---|---|
| CL1 | CL2 | CL3 | CL4 | |||
| Sex | V1 | 1 | 0.534 | 0.470 | 0.348 | 0.546 |
| 2 | 0.466 | 0.530 | 0.652 | 0.454 | ||
| Monthly income (RMB) | V2 | 1 | 0.167 | 0.265 | 0.403 | 0.281 |
| 2 | 0.377 | 0.328 | 0.358 | 0.370 | ||
| 3 | 0.288 | 0.132 | 0.239 | 0.246 | ||
| 4 | 0.168 | 0.275 | 0.000 | 0.103 | ||
| Attitude toward public transport punctuality | V3 | 1 | 0.025 | 0.518 | 0.077 | 0.000 |
| 2 | 0.000 | 0.000 | 0.209 | 0.173 | ||
| 3 | 0.343 | 0.151 | 0.092 | 0.369 | ||
| 4 | 0.456 | 0.115 | 0.000 | 0.390 | ||
| 5 | 0.176 | 0.216 | 0.622 | 0.068 | ||
| Influence of the media and public opinion | V4 | 1 | 0.040 | 0.271 | 0.267 | 0.062 |
| 2 | 0.312 | 0.309 | 0.000 | 0.084 | ||
| 3 | 0.288 | 0.128 | 0.286 | 0.510 | ||
| 4 | 0.361 | 0.042 | 0.000 | 0.292 | ||
| 5 | 0.000 | 0.250 | 0.447 | 0.053 | ||
| Public traffic waiting time | V5 | 1 | 0.000 | 0.592 | 0.069 | 0.026 |
| 2 | 0.023 | 0.327 | 0.000 | 0.023 | ||
| 3 | 0.289 | 0.000 | 0.298 | 0.415 | ||
| 4 | 0.615 | 0.000 | 0.000 | 0.410 | ||
| 5 | 0.072 | 0.081 | 0.632 | 0.126 | ||
| Sensitivities to time-cost difference between the modes | V6 | 1 | 0.066 | 0.410 | 0.090 | 0.417 |
| 2 | 0.006 | 0.348 | 0.302 | 0.583 | ||
| 3 | 0.927 | 0.243 | 0.608 | 0.000 | ||
| Sensitivities to expense-cost difference between the modes | V7 | 1 | 0.053 | 0.520 | 0.000 | 0.358 |
| 2 | 0.156 | 0.136 | 0.533 | 0.527 | ||
| 3 | 0.791 | 0.344 | 0.467 | 0.115 | ||
| Probability of the latent class | 0.189 | 0.156 | 0.132 | 0.523 | ||
| C1 | C2 | C3 | C4 | |
|---|---|---|---|---|
| C1 | 0.934 | 0.005 | 0.023 | 0.038 |
| C2 | 0.009 | 0.946 | 0.006 | 0.039 |
| C3 | 0.018 | 0.035 | 0.886 | 0.061 |
| C4 | 0.006 | 0.012 | 0.006 | 0.976 |
© 2019 by the authors. Licensee MDPI, Basel, Switzerland. This article is an open access article distributed under the terms and conditions of the Creative Commons Attribution (CC BY) license (http://creativecommons.org/licenses/by/4.0/).
Share and Cite
Zhang, X.; Guan, H.; Zhu, H.; Zhu, J. Analysis of Travel Mode Choice Behavior Considering the Indifference Threshold. Sustainability 2019, 11, 5495. https://doi.org/10.3390/su11195495
Zhang X, Guan H, Zhu H, Zhu J. Analysis of Travel Mode Choice Behavior Considering the Indifference Threshold. Sustainability. 2019; 11(19):5495. https://doi.org/10.3390/su11195495
Chicago/Turabian StyleZhang, Xinjie, Hongzhi Guan, Haiyan Zhu, and Junze Zhu. 2019. "Analysis of Travel Mode Choice Behavior Considering the Indifference Threshold" Sustainability 11, no. 19: 5495. https://doi.org/10.3390/su11195495
APA StyleZhang, X., Guan, H., Zhu, H., & Zhu, J. (2019). Analysis of Travel Mode Choice Behavior Considering the Indifference Threshold. Sustainability, 11(19), 5495. https://doi.org/10.3390/su11195495