Article

Do Government R&D Subsidies Cultivate Enterprises’ Voluntary National/Industry Standard-Setting for Sustainable Development?

1
Business School, Hohai University, Nanjing 211100, China
2
Government School, Nanjing University, Nanjing 210023, China
*
Author to whom correspondence should be addressed.
Sustainability 2019, 11(19), 5482; https://doi.org/10.3390/su11195482
Submission received: 30 August 2019 / Revised: 28 September 2019 / Accepted: 30 September 2019 / Published: 3 October 2019
(This article belongs to the Section Economic and Business Aspects of Sustainability)

Abstract

:
This study investigates the effects of government subsidies for R&D on resource and environmental enterprises’ voluntary national/industry standard- (N/IS-) setting, which is critical to sustainable development. Based on innovation motivation and capability theory, we propose a research framework and hypothesis, using a panel dataset on 11,556 Chinese resource and environmental enterprises from 2011 to 2013 to test our hypotheses. We find that government subsidies for R&D have a U-shaped relationship with N/IS-setting for sustainable development. Moreover, we also find that state ownership, position in industry, and patent properties are contingency factors suggesting that non-state-owned enterprises, industry-following enterprises, or enterprises with more patents come up with N/IS-settings of significantly greater value than state-owned enterprises, leading enterprises, or enterprises with fewer patents. Endogeneity issues are addressed by utilizing two-stage estimations with instrumental variables (IVs).

1. Introduction

Sustainable development depends on the application of green material, component, or technical parameters to reduce pollution or save energy. In particular, setting national/industry standards (N/IS) is considered to be one of the most important factors for enhancing enterprises’ energy-saving and environmental protection activities in developing countries [1,2]. Adapting and implementing environmentally friendly N/IS would relieve pressure on environmentally sensitive resources and capture sustainable development [3,4]. This has provided a strong signal to policy decision-makers to endorse standard-enhancing R&D policy for sustainable development.
N/IS are standards that set out requirements for a specific item, material, component, technical parameters, or that describe in detail a particular method or procedure used throughout the country or an industry and certified by an administrative department [5,6]. N/IS for sustainable development can benefit the environment via promoting minimal use of natural resources and mainly come from resource enterprises and environmental enterprises (from here on, REs and EEs) whose N/IS-setting activities usually are concerned with reduction of environmental risk, pollution, and other negative impacts of resource use and improving the efficiency of resource utilization. As a special innovation activity, N/IS-setting has obvious externalities qualities and qualities characteristic of public goods, such as non-competitive and non-exclusive features. Absent government intervention in N/IS-setting activities, it is expected that the social rate of return to N/IS-setting may exceed the private rate, leading to a socially suboptimal rate of investment in R&D [7]. Positive externalities due to incomplete appropriability of the results and uncertainty about their success further push enterprises’ voluntary N/IS setting below socially optimal levels [8]. The central rationale for government policy to stimulate enterprises’ voluntary N/IS-setting activities, such as subsidy for enterprises’ N/IS R&D, is to correct this type of market failure by reducing capital costs of N/IS-setting activities [5,9,10,11]. Therefore, more and more governments or policy makers try to adopt subsidies as a tool to stimulate REs’ and EEs’ N/IS-R&D activities concerning energy efficiency and environmental protection [12]. Some researchers also highlight the importance of subsidies for R&D in innovation [13] and suggest that governments stimulating enterprises’ voluntary N/IS-setting should pay attention to subsidies for R&D [13,14].
Even though there is a significant body of research that has investigated the effect of government subsidies on product and technology for R&D activities [15,16], the impact on N/IS-innovation activity has been ignored [2,17,18]. Regarding the effect of government subsidies, theory says that government subsidies can fund R&D activities and finally promote innovation [17]. However, empirical findings on this matter have been somewhat contradictory. Some studies have found evidence that government subsidies significantly increased the average intensity of R&D investment [19] and innovation performance [16,20,21]. Some other studies have indicated that government subsidies are less successful at promoting innovation, because grants may not fund additional projects and may be used, instead, to fund the project that would have been privately funded [22,23]. A large number of empirical studies from Spain [24], Ireland [25], and the United States [22] even show that government subsidies reduce investment in enterprise innovation. This may contribute to the fact that enterprises focus on rent-seeking or corrupt activities to obtain more subsidies from governments, crowding out actual R&D funds invested in enterprise innovation. In addition, Hussinger [26] believes that there is a reverse U-shaped relationship between government subsidies and enterprises’ R&D intensity; he claims that the effect of subsidies for R&D is positive up to some threshold level, above which it has a negative effect. The ambiguity of the relationship between subsidies for R&D and innovation may be partly attributable to discriminating between the different characteristics of enterprises, such as innovation motivation and capability [27,28,29]. Previous studies have identified state ownership, position in industry [30], and number of patents [31] as contingency factors that may affect an enterprise’s motivation and capability to innovate. Thus, it is critical to consider state ownership, position in industry, and number of patents in studying the impact of government-subsidized R&D on standard-setting or on R&D activities.
To better understand the moderating effect of state ownership, position in industry, and intellectual property, we integrate innovation motivation theory (IMT) and innovative capability theory (ICT). IMT takes motivation as the most important component of creativity [27], positing that enterprises will be motivated primarily by their interest in innovation [32]. ICT highlights the importance of the innovative capability that is necessary to N/IS development, such as funds and R&D employees [33]. According to IMT and ICT, enterprises should have a strong R&D motivation and capability to be involved in standard-setting, which is a special kind of innovation [27,34,35,36]. State ownership, position in industry, and intellectual property are three important factors influencing an enterprise’s standard innovation motivation and capability. State-owned enterprises can gain resources at lower cost [32] and form a resource-based capability for innovation [34,35]. The leading enterprises and enterprises with more patents have the motivation to engage in N/IS-setting, because they could benefit more from standard-setting, such as through scale efficiency and standard-essential patents [30,31]. In addition, leading enterprises and enterprises with more patents are usually able to be more innovative due to possessing more knowledge and R&D employees [30,31]. Based on IMT and ICT, we expect that the impact of government subsidies for R&D on standard innovation will be stronger when an enterprise is already among the leading enterprises and enterprises with more intellectual properties.
The rest of this paper is as follows: The second part introduces the theoretical background and research hypotheses. The third section describes the data and methods used. Section four gives the empirical results and the robustness test of the impact of government subsidies on standard innovation. Finally, we conclude the study with a discussion of the major findings, theoretical contributions and practice implications, as well as noting limitations and future research directions.

2. Theoretical Background and Research Hypotheses

In this study, we considered the advantages and disadvantages of government subsidies and hypothesized that government subsidies for R&D have a curvilinear relationship with N/IS-setting for sustainable development. Furthermore, the relationship between subsidies for R&D and N/IS-setting for sustainable development will be moderated by the enterprises’ heterogeneity, which influences their motivation and capability to innovate, such as state ownership, position in industry, and existing intellectual property. The conceptual framework is depicted in Figure 1.

2.1. Government Subsidies for R&D and Standard-Setting for Sustainable Development

N/IS concerning energy efficiency and environmental protection are keys to sustainable development [1,3,4] and have proliferated in the past 20 years, both nationally and internationally [5,37]. One example is the National Ambient Air Quality Standards (NAAQS), which is designed to prevent further degradation of air quality. It was established by the Environmental Protection Agency (EPA) to regulate pollutants in the air. Recently, there are thousands of N/IS in existence. They address different worries, ranging from environmental to human rights, in different ways. Government and individual companies that have a rule-setting purpose to design and steward standards for the regulation of market and non-market actors [37] can then develop and set standards separately or jointly [5].
The success of N/IS-setting for sustainable development depends greatly on N/IS R&D activities and funding [27]. However, REs and EEs cannot efficiently fund N/IS R&D activities using internal R&D investment due to the externalities of N/IS. Government subsidies can provide external funding for standard R&D activities and promote enterprises to carry out N/IS-setting for sustainable development [38]. In addition, government subsidies provide the recipient enterprises with an externally validated signal of quality that reduces the uncertainty of the project by informing others of its favorable prospects [39]. This encourages collaboration and enhances an enterprise’s ability to procure capable R&D resources, such as financial capital and human capital, which could result in increased N/IS innovation for sustainable development [40]. Finally, previous studies have found that government subsidies had a significant positive impact on the number of patents applied for by enterprises [17,19], which then can get revenue from their intellectual property rights. This will stimulate enterprises to conduct R&D activities for standard-setting, because N/IS R&D-matching patents applied for by enterprises would maximize the benefits of that intellectual property.
Nevertheless, some researchers have pointed out that government subsidies may also bring extra costs or inefficiency to enterprises [41]. Government agencies are likely to support projects that would benefit private business rather than projects that would bring social welfare but are privately unprofitable. If government subsidies for R&D fund the former case, it will fail to increase innovation [22]. In addition, some other studies have indicated that government subsidies for R&D create opportunities for rent-seeking activities or corruption between enterprises and governments [42]. Existing studies have found that as long as the rent-seeking cost of enterprises does not exceed the benefits, enterprises are more willing to obtain government subsidies through rent-seeking to increase their profits [41,43]. As a result, in order to obtain more government subsidies, enterprises will actively seek links with the government. These huge rent-seeking costs squeeze out the actual R&D investment funds of enterprise innovation, thus creating a situation where government subsidies have a crowding-out effect on an enterprise’s standard innovation activities [41]. At the same time, after obtaining high government subsidies, enterprises will reduce their enthusiasm for obtaining excess profits through R&D innovation and weaken their motivation to carry out standard innovation. Further, due to information asymmetry, in order to obtain these higher government subsidies, enterprises can deceive the government by releasing false signals, which seriously weakens the incentivizing effect of government subsidies [44]. Especially in China, the government provides R&D subsidies to enterprises that usually have more product and technology innovation, as assessed by patents. So recipient enterprises will prefer funding product and technology R&D activities rather than N/IS R&D activities, thus causing a crowding-out effect on N/IS innovation. Therefore, government subsidies for R&D may fail to promote innovation [22,23] or even become a barrier to an enterprise’s standard innovation for sustainable development [24,25].
Based on the arguments in the literature and taking into account that government subsidies for R&D have both advantages and disadvantages, Hussinger [26] proposes that increasing government subsidies for R&D positively affects R&D activities up to a certain extent, due to its being external financing. However, after a certain threshold is reached, the costs or inefficiencies of receiving government subsidies for R&D begin to outweigh the benefits, which is mainly attributable to corruption. This means that government subsidies for R&D can stimulate innovation at the early stages. However, further increasing the intensity of subsidies past a certain point can crowd out an enterprise’s innovation activities, which occurs as a result of their tendency to conduct rent-seeking for more government subsidies. Based on the above analysis, we expect a reverse U-shaped curvilinear relationship between subsidies for R&D activities. Hence, we form the following hypothesis:
Hypothesis 1.
There is a curvilinear relationship (reverse U-shaped) between government subsidies for R&D and N/IS-setting for sustainable development.

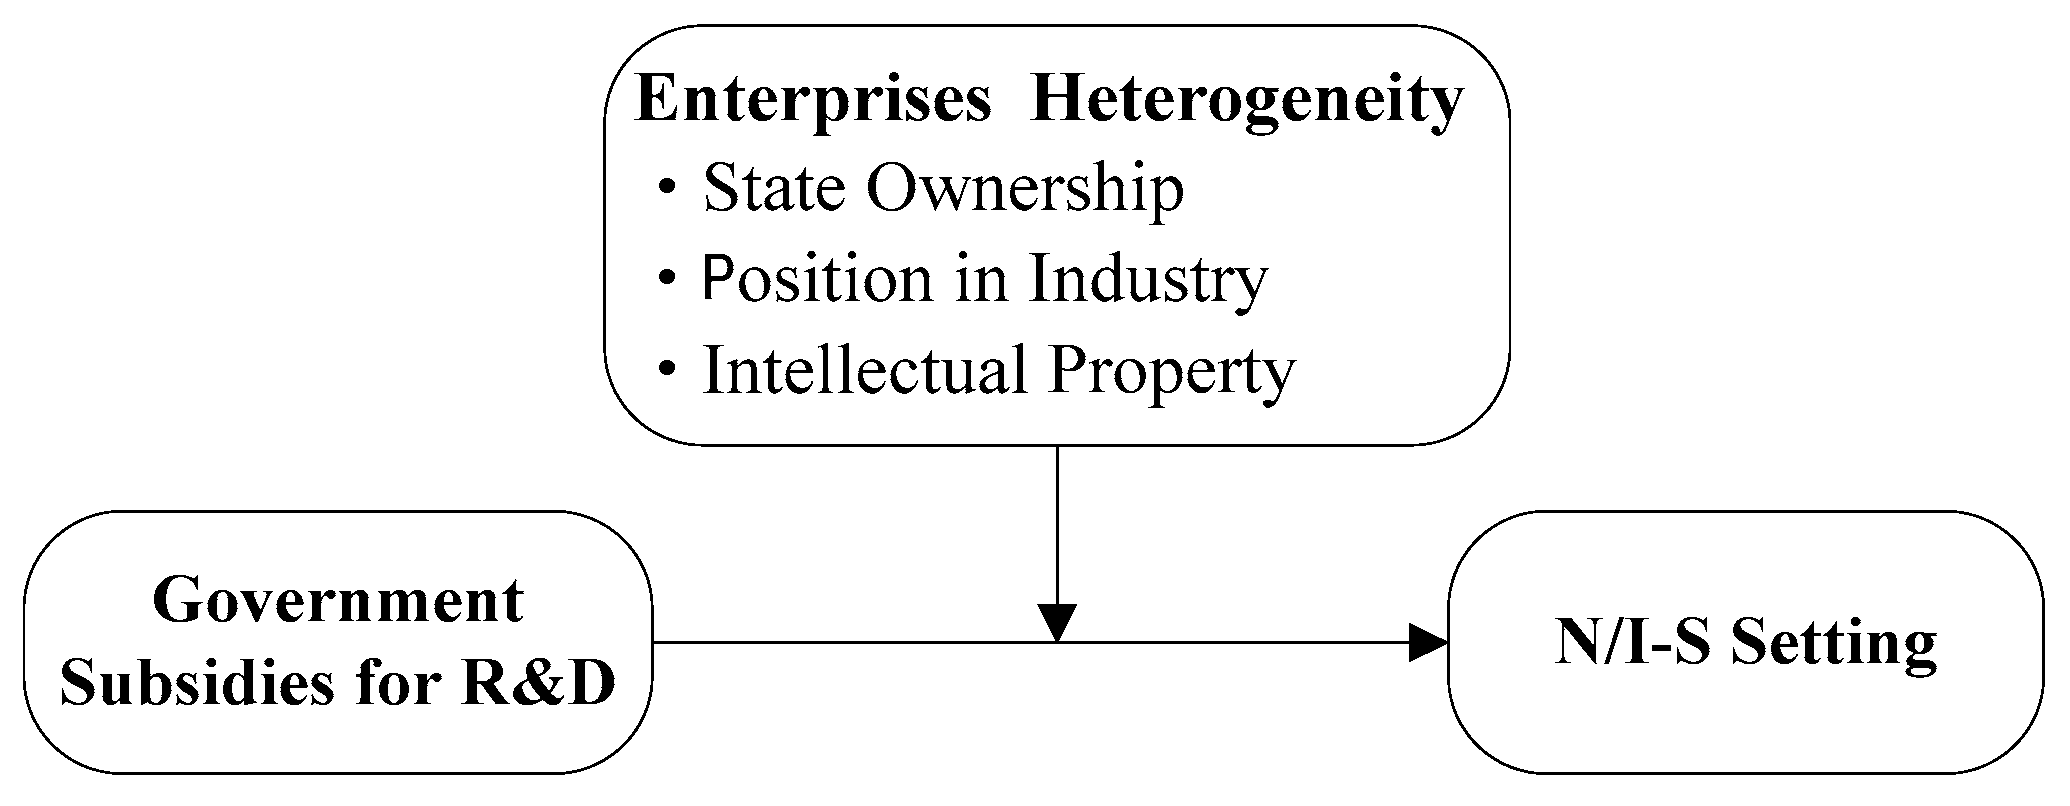
2.2. Moderating Effect of Enterprises’ Heterogeneity

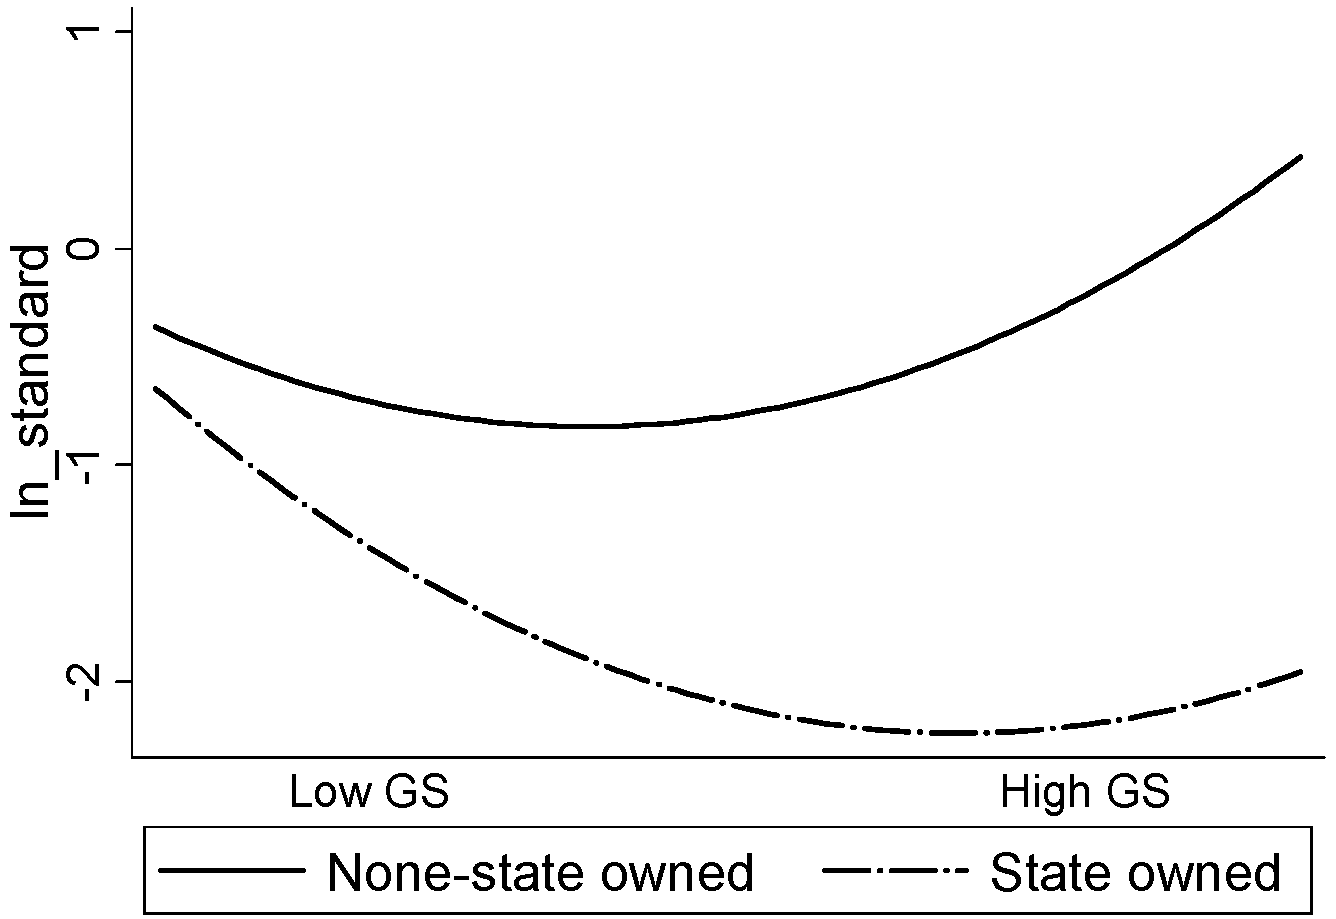
2.2.1. Moderating Effect of State Ownership

State ownership negatively influences the relation between government subsidies for R&D and N/IS-setting for sustainable development. First, due to government intervention, state ownership can enable enterprises to make super-profits, have secure financial support, and mobilize capital and resources at lower cost [35], which will sufficiently fund R&D activities. As a result, state-owned enterprises can enhance innovation capability through capitalizing on organizational and financial resources. It is unnecessary to get external financial resources for N/IS R&D activities [37], such as government subsidies. Second, R&D resources of state-owned enterprises cannot be transferred efficiently due to these enterprises’ very low efficiency in knowledge production [45,46]. State-owned enterprises’ poor efficiency may be the result of institutional arrangements, including weak incentive mechanisms and government interference in decision-making [47]. In addition, because they act as both managers and government officials, the leaders of Chinese state-owned enterprises tend to give top priority to their political careers, requiring that they maintain the security of state assets or social stability or other public goals [48], and they are held less accountable for their innovation performance. Therefore, state-owned enterprises are likely to shortchange their economic and innovative potential [49,50]. We expect R&D subsidies for state-owned enterprises would have lower N/IS-setting for sustainable development than non-state-owned enterprises. We form the following hypothesis:
Hypothesis 2.
State ownership negatively moderates the relationship between government subsidies for R&D and N/IS-setting for sustainable development.

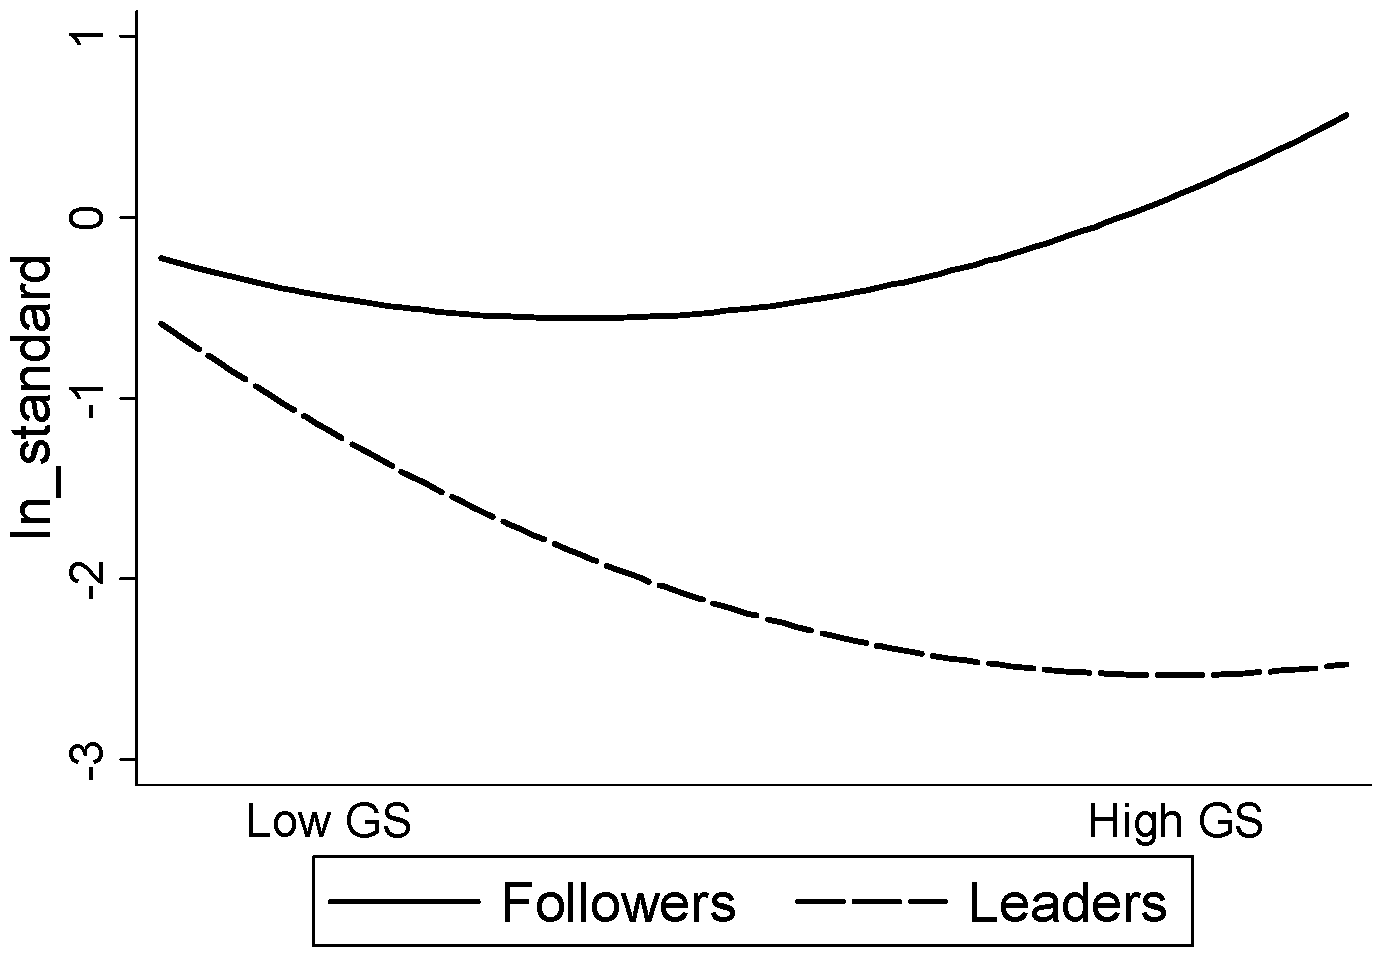
2.2.2. Position in Industry

Position in industry may affect the relationship between government subsidies for R&D and N/IS-setting for sustainable development. First, industry leaders have a great incentive to innovate. An industry-leading enterprise has a bigger market share than following enterprises. In order to raise the barriers for potential entrants into the market and maintain their own dominance, they tend to innovate more [51,52,53]. As the marginal value of an innovation is positively correlated with market share [54], industry leaders usually gain more from additional innovation than industry followers. Therefore, they usually have more intention to invest in R&D. Second, leading enterprises often possess more R&D employees, stronger innovation capability, and strong financial support. They face less liquidity and financing constraints. Even without the support of government subsidy funds, enterprises also have ability to carry out standard innovation activities. Third, N/IS R&D activities are risky and increase the volatility of cash flows or the risk of the enterprise [55]. Usually, leading enterprises have better cash flow and may have a stronger ability to withstand innovation risks [30,51,53]. Therefore, even without government subsidies, leading enterprises will still have greater incentive to carry out “national/industry standard” innovation for sustainable development. Just as Wallsten [22] pointed out: If government subsidizes R&D that would otherwise be funded by leading enterprises themselves, it will fail to increase innovation. Based on this, we propose the following hypothesis:
Hypothesis 3.
Compared with following enterprises, the effect of government subsidies on the R&D of leading enterprises has a weaker effect on N/IS-setting for sustainable development.

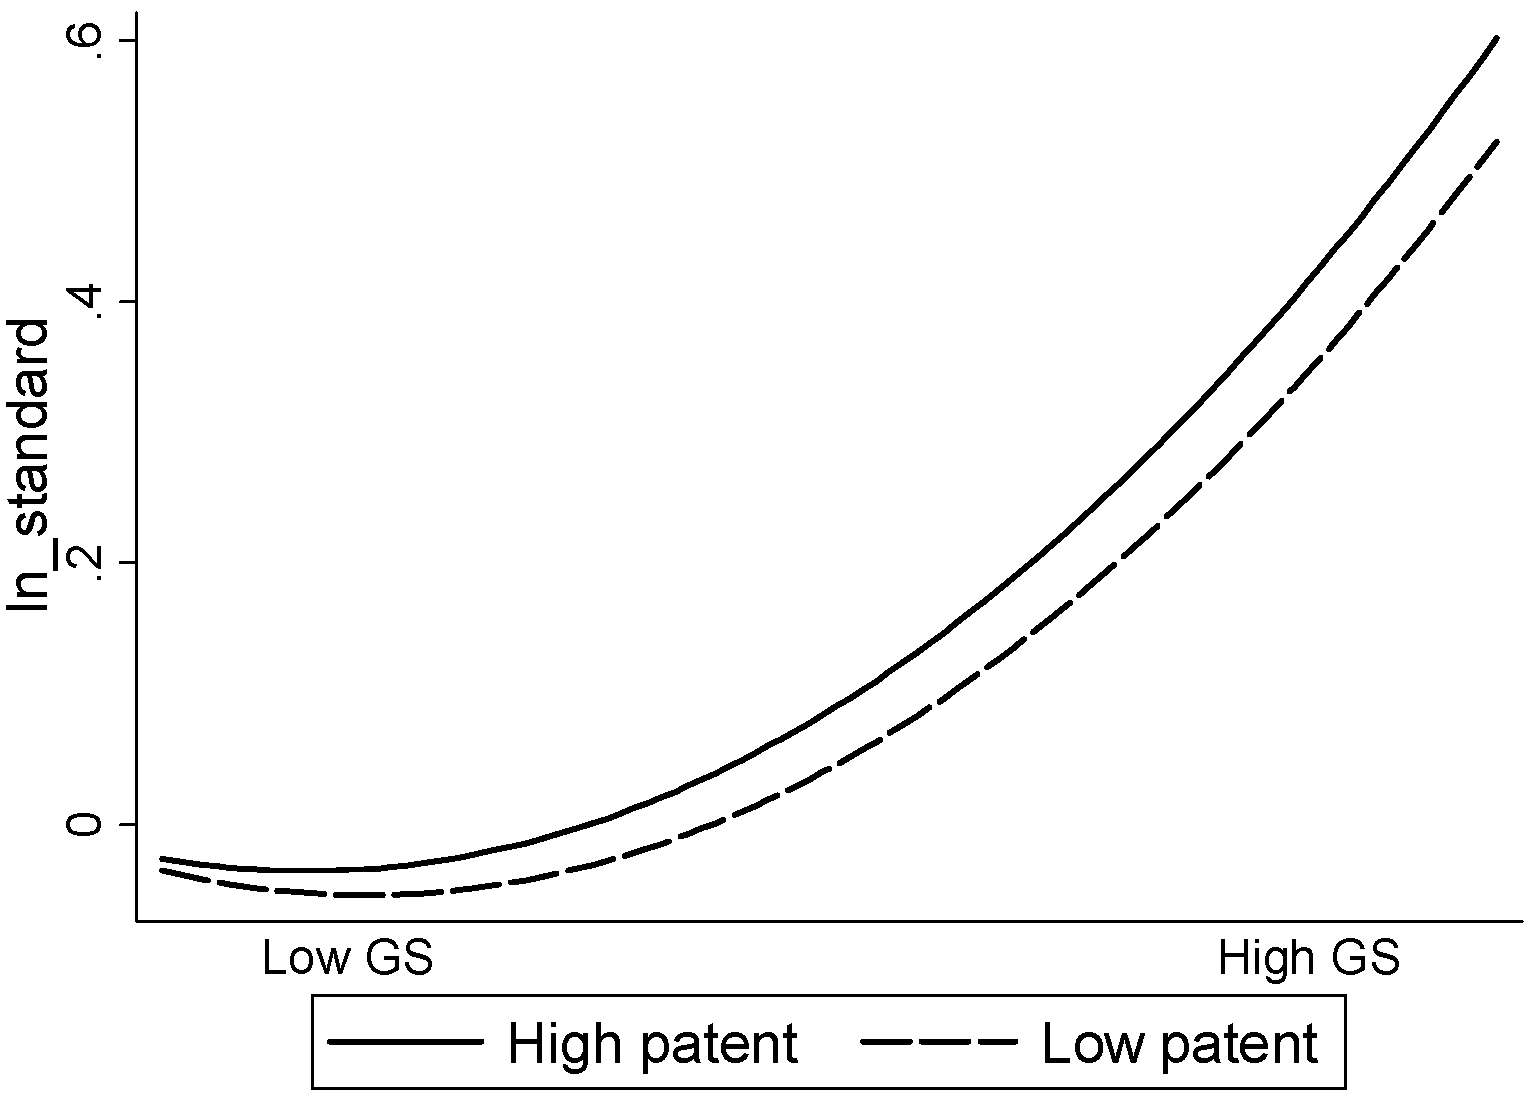
2.2.3. Intellectual Property

Intellectual property owned by enterprises would also affect the relation between government subsidies for R&D and N/IS-setting for sustainable development. First, intellectual property will increase the knowledge-based capability of innovation [27,56]. An enterprise’s intellectual properties are related to its expertise, technical skills, intelligence, and talent in the particular domain, which are the bases upon which the enterprise can draw during the creative process [27]. In multiple research studies, these skills are summarized as knowledge: All the relevant information that an individual can bring to deal with a problem. Intellectual property can expand the depth and breadth of knowledge that is required for creativity [57]. In-depth knowledge allows enterprises to build the technical expertise that serves as a basis for creativity within a certain area [58], and breadth of knowledge increases the ability to combine disparate elements in new ways, which, in itself, implies the need for a broader focus and a wide range of interests. Second, intellectual property can help companies make super-profits to provide internal financing support for other R&D activities. N/IS-setting will cultivate patents owned by enterprises to become standard-essential patents, thus giving the company a technological monopoly [59,60], which will maximize the benefits of its intellectual property. Therefore, enterprises with more patents have a stronger incentive to conduct N/IS R&D activities. Based on this, we propose the following assumptions:
Hypothesis 4.
Intellectual property positively moderates the relationship between government subsidies for R&D and N/IS-setting for sustainable development.

3. Data and Methodology

3.1. Data Collection and Sample

The data used in this paper are from the “China Industrial Enterprise Science and Technology Activity Database” and the “China Industrial Enterprise Database” collected by the National Bureau of Statistics of China. The “China Industrial Enterprise Science and Technology Activities Database” contains many indicators of the R&D activities of more than 60,000 enterprises, such as national/industry standards newly applied and certified, R&D personnel, government subsidies for R&D activities, R&D expenditures, and the number of R&D employees. In order to obtain information for other control variables, such as profit, size, and age, etc., we merged it with the dataset of the “China Industrial Enterprise Database”.
In order to obtain information on N/IS-setting for sustainability, we selected REs and EEs samples from resource development, high pollution, or environment-protecting industries. Since REs’ and EEs’ N/IS-setting activities usually are concerned with reduction of environmental risk, pollution, and other negative impacts of resources use, as well as on improving the efficiency of resource utilization [24], it is critical to sustainable development. REs are enterprises whose main business involves natural resources, such as minerals, energy (e.g., electric power and hot power), etc. [61]. EEs refers to enterprises whose main business involves environmental pollution or environmental protection, such as papermaking, plastics, chemical materials and products, waste materials recycling and processing, etc. [62]. The latest database of the China Industrial Enterprise by the Chinese Statistical Bureau covers up to 2013, and the “China Industrial Enterprise Science and Technology Activity Database” started in 2011. Therefore, we got data from REs and EEs in different years spanning 2011 to 2013, which are very suitable for this study. Since before 2012, Chinese environmental pollution had become increasingly serious given the country’s sustained and rapid economic growth, rapid industrialization, and urbanization, after 2012 environmental protection entered a new era. The government’s R&D subsidies for environmental protection enterprises around 2012 varied greatly, which enables us to examine the impact of government subsidy on N/IS-setting for sustainable development.
In order to avoid the impact caused by the emergence and collapse of enterprises, we screened for resource development, high pollution, and environmental protection enterprises that continued to exist in 2011–2013, thus forming panel data with a time span of three years. After eliminating the invalid or abnormal data, such as samples with patents fewer than zero, a suspect number of R&D employees, or sales income equal to zero between 2011–2013, none of which are consistent with the successful operation of such businesses, our final sample contained 11,556 enterprises. The industry distribution of the sample is shown in Table 1. In addition, we needed to do logarithmic calculation on variables such as innovation subsidy, tax deductions, and profits. In order to avoid errors in calculation, we added the values of subsidies, tax deductions, and profits to one and then took the logarithm.

3.2. Methodology

3.2.1. Regression Model

We use the following regression model to study whether government subsidies stimulate an enterprise’s N/IS-setting:
ln _ standard i t = β 0 + β 1 ln _ G S i t + β 1 ln _ G S i t 2 + K 1 ( d m × ln _ G S i t )          + K 2 ( d m × ln _ G S i t 2 ) + α X i t + μ i n d u s t r y + μ p r o v i n c e + ε i t
ln _ standard i t is N/IS-setting measured by the natural logarithm of the number of N/IS newly applied and certified in year t for enterprise i. ln _ G S is government subsidies for R&D measured by the natural logarithm of the government subsidies for enterprise i at year t. X i t denotes a control variable. d m is seen in the variables reflecting motivation or capability of innovation, including state ownership, position in industry, and intellectual property. State ownership is one if an enterprise was state-owned or if the state was the largest shareholder, otherwise it equals zero. Position in industry reflects whether the enterprise is within the top three enterprises in that market share, defined by a four-digit industry code. Intellectual property is measured by the natural logarithm of patents possessed by enterprises. d m ln _ G S i t is seen in the interactions between ln _ G S i t and d m . X i t are control variables for enterprise i at year t. The control variable X includes: (1) Enterprise size, which can reflect the heterogeneity of the enterprise in terms of knowledge stock, R&D accumulation, and market status, all of which may have an impact on innovation [63]. Therefore, we included it in our model in line with previous studies. In the data of the “China Industrial Enterprise Database” there is an enterprise size variable, so enterprises were divided into four types according to total sales, which is the most popular proxy for firm size in previous literature [64]: Extra-large enterprises, large enterprises, medium-sized enterprises, and small enterprises. (2) The number of R&D employees reflects the innovation ability of enterprises, so we put it into the regression model as a control and measured it by the natural logarithm of the average annual number of R&D employees. (3) Enterprise age is an important heterogeneous characteristic factor affecting all aspects of enterprise innovation activities, so it is also controlled in the regression model. (4) We also used the variable of internal R&D expenditure to control for its effect on enterprise innovation performance. We measured it using the natural logarithm of the enterprise’s R&D expenditure. (5) Enterprise profits provide financial support to R&D activities. Therefore, we controlled enterprise profits as an agent variable reflecting enterprise innovation financing constraints. In order to eliminate the influence of measurement units, we used the logarithmic value of enterprise after-tax profits to measure it. (6) We also used the variable of R&D investment to control for its effect on enterprise innovation performance [65]. We measured it using the natural logarithm of the enterprise’s R&D expenditure. (7) Financial leverage was the total debt divided by total assets for an enterprise, which influences the ability of the enterprise to fund innovation. (8) We also controlled industrial and regional fixed effects using a series of dummy variables of two-digit industries ( μ i n d u s t r y ) and provincial ( μ p r o v i n c e ) dummy variables. ε i t denotes a random perturbation term. The definition and measurement of variables in our study is shown in Table 2.

3.2.2. Endogeneity Problem and Remedies

The issue of endogeneity of government subsidies for R&D activities is the major problem in this empirical research. Two situations can lead to this situation [66]. The first is the omitted variable that government subsidies and N/IS-setting for sustainable development have no direct effect on each other. Instead, they are spuriously correlated with opportunities or some other variables that change across the industry or province such that we may overestimate the relationship between N/IS-setting for sustainable development and government subsidies. For example, suppose that there is no causal relationship between government subsidies and N/IS-setting, but for a special industry its enterprises have a high opportunity to get government subsidies and conduct N/IS innovation. In this situation, a spurious positive relationship between the two variables may be estimated, although there is no causal relationship between them in our assumption. Therefore, we adopted the industry fixed effects and province fixed effects to overcome this problem (just as shown in Formula (1)).
The second situation is that causality runs both ways. A random shock that enters the regression model through the error term affects N/IS-setting for sustainable development. Since N/IS-setting affects the government subsidies (e.g., successful N/IS-setting may increase the opportunities to gain government subsidies), government subsidies will be correlated with the error term, generating a biased coefficient on the N/IS-setting for sustainable development. To address the issue of the endogeneity of government subsidies caused by two-way causality, we employ an instrumental variable (IV) approach. Following Aiello [67] and Wooldridge [68], we use the fitted value of government subsidy choice as an instrument which is correlated with government subsidies for R&D activities but not with the structural residual of the N/IS-setting. First, we use the probit model to quantify government subsidies choice (when government subsidies for R&D activities is greater than zero, the value is one; otherwise, the value is zero). Second, we calculate the fitted value of government subsidy choice by the probit model and use the fitted value as the instrumental variables of government subsidies for R&D activities. This method has been applied in the existing empirical research literature to deal with endogenous problems. For example, Aiello [67] used the fitted value of the probit model of R&D choice as the instrument of R&D input in the study of R&D spillover effect and output performance. The fitted value of R&D internationalization decision-making is a good instrumental variable. The reasons are: First, since government subsidies for R&D activities are the result of government subsidy choice, it is more convincing to calculate the fitted value of government subsidy choice through the probit model. Second, the fitted value of government subsidy choice is highly correlated with real government subsidies for R&D activities, which satisfies the basic requirement that an instrumental variable must be related to endogenous variables. Meanwhile, the explanatory variables of the probit model for government subsidy choice are exogenous variables. So, the fitted value is exogenous variables and satisfies the assumption that an instrumental variable is irrelevant with error.
Based on the above analysis and the panel data of Chinese REs and EEs, we use the probit model to fit the government’s subsidy decisions for enterprises. D government   subsidy denotes the decision-making of government subsidies, defining 0–1 variables as Formula (2):
D government   subsidy   = { 1 , if   government   subsidies   for   RD   activities = 0 > 0 0 , if   government   subsidies   for   RD   activities = 0
D government   subsidy i t = 1 { X i t β + ω i + p i + ε i t > 0 }
Formula (3) is the selection model for whether the government provides subsidies for enterprises i at year t. Among them, ω i reflects the heterogeneity of industries; p i reflects the heterogeneity of provinces; ε i t represents the error term and obeys i.i.d. distribution; X i t is the explanatory and controlled variable.

4. Empirical Analysis and Results

Table 3 provides descriptive statistics for all variables. Standard deviations of government subsidies for R&D, position in industry, and the number of patents possessed by enterprises show enough variation, which is helpful in identifying the relationship of interest. The correlation coefficient between government subsidies for R&D and standard innovation is positive (r = 0.239, p < 0.05).

4.1. Probit Model Estimation of Government Subsidy Choice

Considering that government subsidies for R&D activities (endogenous variables) is the natural logarithm of accumulated value over the past three years, we calculated the fitted value of government subsidy choice for each of the past three years and used them as instrumental variables. Table 4 reports the estimation results of the probit model of government subsidies choice for each of the past three years. After controlling the fixed effect of industry and region, the result shows that government subsidy choice is positively correlated with state ownership, position in industry, and patents, suggesting that enterprises with a higher capability of innovation would have a higher probability of getting government subsidies for R&D. Results also show that government subsidy choice is positively correlated with the enterprise’s size and age. This is mainly because the Chinese government tends to support big and excellent enterprises, which are usually the large and old enterprises, when selecting the target of government subsidies. This is consistent with the research of Shao and Bao [69]. In addition, the decision-making surrounding government subsidies for R&D is significantly negatively correlated with an enterprise’s financial leverage. This means that with the increase of financial leverage, enterprises will face pressure from liquidity and credit constraints, fewer funds will be used for R&D investment, and the probability of obtaining government innovation subsidies is reduced. With the increase of enterprise profits and RD employees, enterprises have a higher probability to get government subsidies for R&D.
We calculated the predicted value of government subsidy choice base on the above probit model for each year, and then calculated the correlation with actual government subsidies (see Table 5). According to the correlation analysis, the fitted value of government subsidies choice from 2011 to 2013 were all significantly positively correlated with the actual total government R&D subsidies (r > 0.4, p < 0.001).

4.2. Test of Main Effect

We used two-stage least squares (2SLS) regression to estimate the most common approach of IV [70]. In step one, we regressed government subsidies for R&D on all the control variables and the IVs (fitted government subsidy choice from 2011 to 2013) and predicted the value of government subsidies for R&D ( R & D _ GS ^ ). Then, we replaced government subsidies for R&D with their predicted value R & D _ GS ^ in regression. The first step of IV regression shows a positive relationship between IVs and government subsidies for R&D; the Cragg-Donald Wald F statistic is 184.368, indicating our IVs are valid and strong (see M1 in Table 6).
Results of regression are shown in Table 6. To verify our argument in Hypothesis 1, we first regressed N/IS-setting for sustainable development on all the control variables (M2) and then added the variable of the predicted value of government subsidies for R&D ( R & D _ GS ^ ) and its squared term ( R & D _ GS ^ 2 ) in our regression model to test its effect on enterprise N/IS-setting for sustainable development (M3). As shown in Model 3, the result revealed a U-shaped relationship between government subsidies for R&D and N/IS for sustainable development, which is contrary to our H1 that a reverse U-shaped relationship would exist. This may be due to government subsidies stimulating product and technology R&D activities that crowded out N/IS R&D.
Next, we analyzed the moderating effects of state-ownership, position in industry, and the number of patents owned by enterprises on the relationship between government subsidies for R&D and N/IS-setting for sustainable development. Specifically, in Model 4 we incorporated the interactions of state ownership with government subsidies for R&D and its squared term, finding that state ownership negatively moderated the effect of government subsidies for R&D on its N/IS-setting for sustainable development, which supports Hypothesis 2. Likewise, we incorporated the interactions of the position in industry with government subsidies for R&D and its squared term in Model 5, and found that position in industry negatively moderated the effect of government subsidies for R&D on N/IS-setting for sustainable development. Hypothesis 3 is supported. In Model 6 we incorporated the interactions of patents owned by enterprises with government subsidies for R&D and its squared term. The result shows that this interaction is not significant, but the squared term is positive and significant, which partly supports Hypothesis 4.
In addition, we followed the procedure recommended by Aiken and West [71]. According to two levels of moderating variables—that is, one standard deviation above and one below the mean—we plotted the relationship between government subsidies for R&D and N/IS-setting for sustainable development to visually interpret the pattern of the moderating effect of an enterprise’s position in industry and the number of patents owned. As illustrated in Figure 2; Figure 3, the predicted U-shaped relationship between government subsidies for R&D and N/IS-setting for sustainable development is more negative for state-owned enterprises and industry leaders. Figure 4 shows that the predicted U-shaped relationship between government subsidies for R&D and N/IS-setting for sustainable development is more positive for enterprises with more patents.

4.3. Robustness Test

In order to test the robustness of the results, we further used the intensity of government subsidy for R&D in each province as an instrumental variable. The intensity of government subsidy for R&D in each province is positively related to government subsidies for R&D activities and is irrelevant to the error item, which means that it satisfies the prerequisites for instrumental variables. Considering R&D intensity depends on the total subsidies and the number of high-tech enterprises in each province. We used these two variables simultaneously as instrumental variables. We calculated the natural logarithm of the number of high-tech enterprises and the natural logarithm of total innovation subsidies, which originate from the “China Statistical Yearbook”. Results are shown in Table 7. The Cragg-Donald Wald F statistic is greater than 10 (F = 11.411), indicating that there is no weak IV problem. We found only slight changes in coefficients, so there was no change of interpretation. Our hypothesis is further supported.

5. Discussion, Contribution and Implication

5.1. Discussion

Most countries stimulate innovation motivations and encourage their enterprises to invest in R&D through government subsidies. This paper represents one of the first attempts to estimate the effects of government subsidies for R&D on N/IS-setting, which is critical to sustainable development [3,4], and further examines how state ownership, position in industry, and intellectual property owned by companies influence the effect of government subsidies for R&D.
Based on Chinese resource development, high pollution, and environmental protection enterprises, we found that government subsidies for R&D have a significant U-shaped effect on N/IS innovation for sustainable development, suggesting that government subsidies for R&D negatively affect N/IS-setting performance up to a certain extent. The negative effect may be due to the fact that government subsidy may not fund additional projects [22,23] or due to the enterprises’ focus on rent-seeking activities to obtain more subsidies from governments, which crowds out actual R&D investment in enterprise innovation [56,65]. However, after a threshold, the stimulating effect of government subsidies for R&D begins to outweigh the crowding-out effects in N/IS-setting. This may be because standards for R&D, both in setting them and spreading them, require coordination across organizational boundaries and costs a lot of money. Ergo, only when government subsidies are sufficient are enterprises willing to invest in standard R&D activities. Our result is different from the conclusion of [72] that government subsidies for R&D have a reverse U-shaped relation with product and technology innovation. This may be due to R&D activities in product and technology stimulated by government subsidies crowding out more standard R&D activities [56,65]. This means that enterprises may first realize benefits in product and technology innovation from government subsidies for R&D. Only after further increasing these subsidizes can enterprises deeply enhance their R&D activities of N/IS for sustainable development.
In addition, this interpretation is further boosted by our finding that non-state-owned enterprises, industry-following enterprises or enterprises with more patents come up with N/IS-setting of significantly greater value than state-owned enterprises, leading enterprises, or enterprises with fewer patents. Those results confirmed that complex relationships could largely be explained by combing IMT and ICT, which suggests that innovation motivation and innovation capability are contingency factors. These results are consistent with arguments of IMT and ICT, which suggest that state-owned enterprises, industry-leading enterprises, or enterprises with more patents would have high N/IS-setting motivation or ability, by our finding that state-owned enterprises, industry-leading enterprises, and enterprises with more patents provide N/IS-setting of significantly greater value than non-state-owned enterprises, industry-following enterprises, or enterprises with less patents.

5.2. Contribution

This paper represents one of the first attempts to uncover how government subsidies for R&D affect N/IS-setting for sustainable development. It contributes to the literature on sustainable development and N/IS-innovation in the following ways: First of all, different from the existing literature concerned with the impact of government subsidies on product and technology innovation, this study focuses on innovation of N/IS. We found that government subsidies have a U-shaped relationship with N/IS-setting for sustainable development, which is different from the reverse U-shaped relationship with patents [72]. Second, although prior studies acknowledge the essential role of government subsidy for R&D in innovation performance, there is limited empirical evidence on contingent influence on the relationship. Our study is a beneficial supplement of this research area by integrating IMT and ICT, which allows us to consider state ownership, industry position, or a firm’s international experience as contingency factors that might influence the relationship between government subsidy and N/IS-innovation for sustainable development. We identified the negative moderation effect of state ownership and position in industry and the positive moderation effect of patents owned by enterprises, which reflect the heterogeneity of innovation motivation and capability. The impact of those factors, which is important in improving the efficiency and effectiveness of government subsidies for R&D, is neglected by extant literature. Third, our study examines the issue in the context of green industries, which is an important supplement to the current research. While previous studies on government subsidy mainly focused on high-tech enterprises or non-REs and EEs, our empirical data consists of firm-level data from Chinese REs and EEs of the green industry and is a new effort in this research area. Finally, as distinct from previous literature using data collected by the questionnaire, we mainly used second-hand big data, which helped us to solve the problem of endogeneity using the instrumental variables method.

5.3. Implications

Our findings have important policy implications for how governments can intervene to influence and stimulate enterprises’ voluntary national/industry standard-setting for sustainable development. The Chinese government has actively carried out many financial plans and provided subsidies for R&D and innovation activities of enterprises to enhance their independent innovation capabilities [73]. Although those subsidies for R&D would encourage enterprises to conduct product and technology innovation, it also causes enterprises to prefer rent-seeking behavior and product and technology R&D rather than N/IS R&D activities. Therefore, subsidies for R&D tend to crowd out N/IS-setting activities up to a certain extent, at which point it stimulates N/IS-setting activities for sustainable development [15]. Therefore, governments should be cautious in using subsidies for R&D to stimulate N/IS-setting, which is an important need for determining the parameters of sustainable development. In addition, as government-subsidized, state-owned enterprises, enterprises that are industry leaders and enterprises with a smaller number of intellectual property rights receive government subsidies, the marginal crowding-out effect on N/IS-setting is more obvious. This means that governments should be cautious in subsidizing the above-mentioned three types of enterprises.

6. Limitations and Future Research

While we believe that our study contributes importantly to understanding the association of government subsidy and REs’ and EEs’ voluntary N/IS-setting activities, it also has some limitations. First, data limitations prevent us from exploring why government subsidies have a reverse-U shape effect on N/IS-setting of REs and EEs. Future studies could extend the current research by testing the influence mechanisms of government subsidies on N/IS-setting for sustainable development using a more in-depth study of individual firms. Second, we just consider the moderation effect of state-ownership, industry position, and intellectual property. Future studies could continue our research by examining other contingency factors that might influence the effect of government subsidy on REs’ and EEs’ voluntary N/IS-setting for sustainable development. Finally, this research also suffers from the limitation associated with REs and EEs and single-country analysis. In the future, researchers could extend this study to other emerging countries or other types of companies, which is sure to provide insights to policy makers and enterprises’ managers interested in this issue.

Author Contributions

Conceptualization, X.Z. and B.X.; Methodology, B.X.; Software, B.X.; Validation, X.Z., M.S., and B.X.; Formal Analysis, B.X.; Resources, X.Z. and M.S.; Data Curation, B.X.; Writing—Original Draft Preparation, X.Z. and M.S.; Writing—Review and Editing, B.X. and X.Z.

Funding

“This research was funded by NATIONAL NATURAL SCIENCE FOUNDATION OF CHINA, grant number 71473116”, “NATIONAL NATURAL SCIENCE FOUNDATION OF CHINA, grant number 71874080” and “NATIONAL NATURAL SCIENCE FOUNDATION OF CHINA, grant number 71802070”.

Acknowledgments

Thanks go to Brenda Denzler for her editorial assistance.

Conflicts of Interest

The authors declare no conflict of interest.

References

  1. Drupp, M.A. Does the Gold Standard label hold its promise in delivering higher Sustainable Development benefits? A multi-criteria comparison of CDM projects. Energy Policy 2011, 39, 1213–1227. [Google Scholar] [CrossRef]
  2. Brandi, C.A. Sustainability standards and sustainable development–synergies and trade-offs of transnational governance. Sustain. Dev. 2017, 25, 25–34. [Google Scholar] [CrossRef]
  3. Pepe, F.; Paternostro, S.; Monfardini, P. Sustainability standard setting as local government matter: An Italian experience. Public Manag. Rev. 2018, 20, 176–200. [Google Scholar] [CrossRef]
  4. Schultz, T. Setting the Standard for Environmental Sustainability: The Need for Good Metrics. Des. Manag. Rev. 2015, 26, 28–35. [Google Scholar]
  5. Bendell, J.; Miller, A.; Wortmann, K. Public policies for scaling corporate responsibility standards: Expanding collaborative governance for sustainable development. Sustain. Acc. Manag. Policy J. 2011, 2, 263–293. [Google Scholar] [CrossRef]
  6. Anderson, J.D. Standards for indexing: Revising the American National Standard guidelines Z39.4. J. Am. Soc. Inf. Sci. 1994, 8, 628–636. [Google Scholar] [CrossRef]
  7. David, P.A.; Hall, B.H.; Toole, A.A. Is public R&D a complement or substitute for private R&D? A review of the econometric evidence. Res. Policy 2000, 29, 497–529. [Google Scholar] [Green Version]
  8. Arrow, K.J. Readings in Industrial Economics; Palgrave MacMillan: London, UK, 1972; pp. 219–236. [Google Scholar]
  9. Lu, T. On technical standardization and industrial standard strategy. China Ind. Econ. 2005, 7, 43–49. [Google Scholar]
  10. Gandenberger, C.; Garrelts, H.; Wehlau, D. Assessing the effects of certification networks on sustainable production and consumption: The cases of FLO and FSC. J. Consum. Policy 2011, 34, 107–126. [Google Scholar] [CrossRef]
  11. Bredgaard, T. Corporate social responsibility between public policy and enterprise policy. Transf. Eur. Rev. Labour Res. 2004, 10, 372–392. [Google Scholar] [CrossRef] [Green Version]
  12. Reddy, P. The Globalization of Corporate R & D: Implications for Innovation Systems in Host Countries; Routledge: London, UK, 2000. [Google Scholar]
  13. Arfi, W.B.; Hikkerova, L.; Sahut, J.M. External knowledge sources, green innovation and performance. Technol. Forecast. Soc. Chang. 2018, 129, 210–220. [Google Scholar] [CrossRef]
  14. Lahiri, N. Geographic distribution of R&D activity: How does it affect innovation quality? Acad. Manag. J. 2010, 53, 1194–1209. [Google Scholar]
  15. Guo, D.; Guo, Y.; Jiang, K. Government-subsidized R&D and firm innovation: Evidence from China. Res. Policy 2016, 45, 1129–1144. [Google Scholar]
  16. Jaffe, A.; Le, T. The Impact of R&D Subsidy on Innovation: A Study of New Zealand Firms; NBER Working Paper; Motu Economic and Public Policy Research: Wellington, New Zealand, 2015; No. 21479. [Google Scholar]
  17. Kappos, D.J. Innovation-Based Technology Standards Are Under Threat. MIT Sloan Manag. Rev. 2018, 59, 1–5. [Google Scholar]
  18. Murphy, C.N. Voluntary Standard Setting: Drivers and Consequences. Ethics Int. Aff. 2015, 29, 443–454. [Google Scholar] [CrossRef]
  19. Czarnitzki, A.D. The effects of public R&D subsidies on firms’ innovation activities: The case of eastern Germany. J. Bus. Econ. Stat. 2003, 21, 226–236. [Google Scholar]
  20. Binelli, C.; Maffioli, A. A micro-econometric analysis of public support to private R&D in Argentina. Int. Rev. Appl. Econ. 2007, 21, 339–359. [Google Scholar]
  21. Romero-Martínez, A.M.; Ortiz-De-Urbina-Criado, M.; Ribeiro Soriano, D. Evaluating European Union support for innovation in Spanish small and medium enterprises. Serv. Ind. J. 2010, 30, 671–683. [Google Scholar] [CrossRef]
  22. Wallsten, S.J. The effects of government-industry R&D programs on private R&D: The case of the small business innovation research program. RAND J. Econ. 2000, 31, 82–100. [Google Scholar]
  23. Hall, B.H.; Maffioli, A. Evaluating the impact of technology development funds in emerging economies: Evidence from Latin America. Eur. J. Dev. Res. 2008, 20, 172–198. [Google Scholar] [CrossRef]
  24. Busom, I. An empirical evaluation of the effects of R&D subsidies. Econ. Innov. New Technol. 2000, 9, 111–148. [Google Scholar]
  25. Görg, H.; Strobl, E. The effect of R&D subsidies on private R&D. Economica 2007, 74, 215–234. [Google Scholar]
  26. Hussinger, K. R&D and subsidies at the firm level: An application of parametric and semiparametric two-step selection models. J. Appl. Econ. 2008, 23, 729–747. [Google Scholar]
  27. Adams, K. The Sources of Innovation and Creativity; National Center on Education and the Economy: Washington, DC, USA, 2005. [Google Scholar]
  28. Zawislak, P.A.; Cherubini Alves, A.; Tellogamarra, J.; Barbieux, D.; Reichert, F.M. Innovation capability: From technology development to transaction capability. J. Technol. Manag. Innov. 2012, 7, 14–27. [Google Scholar] [CrossRef]
  29. Gordon, S.R.; Tarafdar, M. How do a company’s information technology competences influence its ability to innovate? J. Enterp. Inf. Manag. 2007, 20, 271–290. [Google Scholar] [CrossRef]
  30. Gay, B.; Dousset, B. Innovation and network structural dynamics: Study of the alliance network of a major sector of the biotechnology industry. Res. Policy 2005, 34, 1457–1475. [Google Scholar] [CrossRef]
  31. Gibson, C.S. Globalization and the technology standards game: Balancing concerns of protectionism and intellectual property in international standards. Berkeley Tech. L J. 2007, 22, 1403. [Google Scholar]
  32. Amabile, T.M. The social psychology of creativity: A componential conceptualization. J. Pers. Soc. Psychol. 1983, 45, 357. [Google Scholar] [CrossRef]
  33. Cohen, W.M.; Levinthal, D.A. Absorptive capacity: A new perspective on learning and innovation. Adm. Sci. Q. 1990, 35, 128–152. [Google Scholar] [CrossRef]
  34. Wang, L.; Jin, J.L.; Banister, D. Resources, state ownership and innovation capability: Evidence from Chinese automakers. Creat. Innov. Manag. 2019, 28, 203–217. [Google Scholar] [CrossRef]
  35. Kroll, H.; Kou, K. Innovation output and state ownership: Empirical evidence from China’s listed firms. Ind. Innov. 2019, 26, 176–198. [Google Scholar] [CrossRef]
  36. Wang, E.T.G.; Tai, J.C.F.; Grover, V. Examining the relational benefits of improved interfirm information processing capability in buyer-supplier dyads. MIS Q. 2013, 37, 149–173. [Google Scholar] [CrossRef]
  37. Litovsky, A.; Rochlin, S.; Zadek, S.; Levy, B. Investing in Standards for Sustainable Development: The Role of International Development Agencies in Supporting Collaborative Standards Initiatives; AccountAbility: London, UK, 2007. [Google Scholar]
  38. Zhang, J.; Chen, Z.Y.; Yang, L.X.; Xu, F. On evaluating china’s innovation subsidy policy: Theory and evidence. Econ. Res. J. 2015, 50, 4–17. [Google Scholar]
  39. Lee, C.; Lee, K.; Pennings, J.M. Internal Capabilities, External networks and performance: A study on technology-based ventures. Strateg. Manag. J. 2001, 22, 615–640. [Google Scholar] [CrossRef]
  40. Shinkle, G.A.; Suchard, J.A. Innovation in Newly Public Firms: The Influence of Government Grants, Venture Capital, and Private Equity. Aust. J. Manag. 2019, 44, 248–281. [Google Scholar] [CrossRef]
  41. Wei, C.; Can, Z.; Deming, Y. Rent-Seeking and Firm Performance: From the Perspective of the Eight-Point Regulation and Government Subsidies. China Econ. 2017, 12, 72–83. [Google Scholar]
  42. Yu, M.; Hui, Y.F.; Pan, H.B. Political Connections, Rent Seeking, and the Fiscal Subsidy Efficiency of Local Governments. Econ. Res. J. 2010, 45, 65–77. [Google Scholar]
  43. Murphy, K.M.; Shleifer, A.; Vishny, R.W. Why Is Rent-Seeking So Costly to Growth? Am. Econ. Rev. 1993, 83, 409–414. [Google Scholar]
  44. Tongliang, A.; Shaodong, Z.; Jiancai, P. The Stimulating Effects of R&D Subsidies on Independent Innovation of Chinese Enterprises. Econ. Res. J. 2009, 10, 87–97. [Google Scholar]
  45. Zhang, A.; Zhang, Y.; Zhao, R. A Study of the R&D Efficiency and Productivity of Chinese Firms. J. Comp. Econ. 2003, 31, 444–464. [Google Scholar]
  46. Jefferson, G.H.; Bai, H.; Guan, X.; Yu, X. R&D performance in Chinese industry. Econ. Innov. New Technol. 2006, 15, 345–366. [Google Scholar]
  47. Park, S.H.; Li, S.; David, K.T. Market liberalization and firm performance during China’s economic transition. J. Int. Bus. Stud. 2006, 37, 127–147. [Google Scholar] [CrossRef]
  48. Li, S.; Xia, J. The roles and performance of state firms and non-state firms in China’s economic transition. World Dev. 2008, 36, 39–54. [Google Scholar] [CrossRef]
  49. Shirley, M.M. Bureaucrats in business: The roles of privatization versus corporatization in state-owned enterprise reform. World Dev. 1999, 27, 115–136. [Google Scholar] [CrossRef]
  50. Vickers, J.; Yarrow, G.K. Privatization: An Economic Analysis; MIT Press Series on the Regulation of Economic Activity; The MIT Press: Cambridge, MA, USA, 1988; Volume 18. [Google Scholar]
  51. Adjei, F.; Adjei, M. Market share, firm innovation, and idiosyncratic volatility. J. Econ. Financ. 2017, 41, 569–580. [Google Scholar] [CrossRef]
  52. Gilbert, R.J.; Newbery, D.M.G. Preemptive patenting and the persistence of monopoly. Am. Econ. Rev. 1982, 72, 514–526. [Google Scholar]
  53. Choung, J.Y.; Hameed, T.; Ji, I. Catch-up in ICT standards: Policy, implementation and standards-setting in South Korea. Technol. Forecast. Soc. Chang. 2012, 79, 771–788. [Google Scholar] [CrossRef]
  54. Blundell, R.; Griffith, R.; Van Reenen, J. Market share, market value and innovation in a panel of British manufacturing firms. Rev. Econ. Stud. 1999, 66, 529–554. [Google Scholar] [CrossRef]
  55. Jensen, M.C. The modern industrial revolution, exit, and the failure of internal control systems. J. Financ. 1993, 48, 831–880. [Google Scholar] [CrossRef]
  56. Chandler, G.N.; Hanks, S.H. Market attractiveness, resource-based capabilities, venture strategies, and venture performance. J. Bus. Ventur. 1994, 9, 331–349. [Google Scholar] [CrossRef]
  57. Gardner, H.; Policastro, E. From Case Studies to Robust Generalizations: An Approach to the Study of Creativity; Handbook of Creativity; Sternberg, R.J., Ed.; Cambridge University Press: London, UK, 1994; pp. 213–225. [Google Scholar]
  58. Simonton, D.K. Creativity: Cognitive, personal, developmental, and social aspects. Am. Psychol. 2000, 55, 151. [Google Scholar] [CrossRef] [PubMed]
  59. Lerner, J.; Tirole, J. Standard-essential patents. J. Political. Econ. 2015, 123, 547–586. [Google Scholar] [CrossRef]
  60. Un, C.A.; Cuervo-Cazurra, A.; Asakawa, K. R & D collaborations and product innovation. J. Prod. Innov. Manag. 2010, 27, 673–689. [Google Scholar]
  61. Oltra, V.; Saint Jean, M. Sectoral systems of environmental innovation: An application to the French automotive industry. Technol. Forecast. Soc. Chang. 2009, 76, 567–583. [Google Scholar] [CrossRef]
  62. Uhlaner Hendrickson, L.; Tuttle, D.B. Dynamic management of the environmental enterprise: A qualitative analysis. J. Organ. Chang. Manag. 1997, 10, 363–382. [Google Scholar] [CrossRef]
  63. Scott, T.J., Jr.; Schreiner, S.T.; Osman, I.A. Proscribed Conduct for Patent Holders Participating in Standard-Setting Organizations. Intell. Prop. Tech. Law J. 2008, 20, 14. [Google Scholar]
  64. Dang, C.; Li, Z.F.; Yang, C. Measuring Firm Size in Empirical Corporate Finance. J. Bank. Financ. 2018, 86, 159–176. [Google Scholar] [CrossRef]
  65. Lu, J.W.; Beamish, P.W. International diversification and firm performance: The S-curve hypothesis. Acad. Manag. J. 2004, 47, 598–609. [Google Scholar]
  66. Li, F. Endogeneity in CEO power: A survey and experiment. Invest. Anal. J. 2016, 45, 149–162. [Google Scholar] [CrossRef]
  67. Aiello, F.; Cardamone, P. R&D spillovers and firms’ performance in Italy. Empir. Econ. 2008, 34, 143–166. [Google Scholar]
  68. Wooldridge, J.M. Econometric Analysis of Cross Section and Panel Data; MIT Press: Cambridge, MA, USA, 2010. [Google Scholar]
  69. Shao, M.; Bao, Q. Government Subsidies and Firm’s Productivity—An Empirical Study Based on Chinese Industrial Plants. China Ind. Econ. 2012, 7, 70–82. [Google Scholar]
  70. Jean, R.J.B.; Deng, Z.; Kim, D.; Yuan, X. Assessing endogeneity issues in international marketing research. Int. Mark. Rev. 2016, 33, 483–512. [Google Scholar] [CrossRef]
  71. Aiken, L.S.; West, S.G. Multiple Regression: Testing and Interpreting Interactions; Sage: Newbury Park, CA, USA, 1991. [Google Scholar]
  72. Liu, D.; Chen, T.; Liu, X.; Yu, Y. Do more subsidies promote greater innovation? Evidence from the Chinese electronic manufacturing industry. Econ. Model. 2019, 80, 441–452. [Google Scholar] [CrossRef]
  73. Van Noorden, R. China tops Europe in R&D intensity. Nat. News 2014, 505, 144–145. [Google Scholar] [Green Version]
Figure 1. Research framework.
Sustainability 11 05482 g001
Figure 2. Moderating effect of state ownership.
Sustainability 11 05482 g002
Figure 3. Moderating effect of position in industry.
Sustainability 11 05482 g003
Figure 4. Moderating effects of intellectual property.
Sustainability 11 05482 g004
Table 1. Industry distribution of sample.
2-Digit IndustryIndustryEnterprise NumberPercent (%)
1.10Nonmetal minerals580.50%
2.20Wood processing2912.52%
3.22Papermaking and paper products3803.29%
4.23Printing and recording media copying2762.39%
5.25Oil processing, coking & nuclear fuel processing1881.63%
6.26Chemical materials and other polluting industries 280824.30%
7.28Chemical fiber2752.38%
8.29Rubber products6905.97%
9.30Plastic products119610.35%
10.31Nonmetallic mineral products117910.20%
11.32Metallurgy industry (black metals)7726.68%
12.33Metallurgy industry (nonferrous metals)217618.83%
13.36Environmental pollution prevention and other special equipment manufacturing9788.46%
14.43Waste resources and materials recycling and processing420.36%
15.44Electric power and hot power production2472.14%
Total11,556100%
Table 2. Definition and measurement of variables.
VariablesDefinition and Measurement
ln_standardN/IS-setting for sustainable development: Natural logarithm of the number of N/IS newly applied by REs and EEs and certified in the current year
ln_GSGovernment subsidies for R&D activities: Natural logarithm of accumulated government subsidies for R&D over the past three years
State_ownershipState ownership: 1. State-owned or state is the largest shareholder; 0. Other
Position in industryIndustry leader: 1. Industry leader—top three enterprises in market share by four-digit industry; 0. Industry follower—enterprises after top three enterprises in market share by four-digit industry
ln_patentIntellectual property: Natural logarithm of patents possessed by enterprises
Enterprise_sizeEnterprise scale: 1. Extra larger; 2. Large; 3. Medium; 4. Small
ln_total_profitsEnterprise profit: Natural logarithm of accumulated enterprise’s profit over the past three years
Enterprise_ageEnterprise age: Company establishment time (year)
Financial leverageFinancial leverage: Measured by the total debt/total assets of the enterprise
ln_RDInternal R&D expenditure: Natural logarithm of accumulated R&D expenditure from enterprise over the past three years
ln_rd_employeeR&D employees: Natural logarithm of the average number of R&D employees
Table 3. Descriptive statistics and correlation matrix a.
VariablesMeanSD12345678910
1. ln_standard b0.170.501.000
2. ln_GS b6.681.860.227 *
3. State–ownership0.130.330.094 *0.227 *
4. Position in industry0.040.200.113 *0.155 *0.069 *
5. ln_patent b1.411.190.228 *0.304 *0.105 *0.141 *
6. Enterprise_size2.450.70−0.204 *−0.342 *−0.280 *−0.225 *−0.278 *
7. ln_profits b8.273.560.083 *0.152 *−0.069 *0.139 *0.121 *−0.232 *
8. Enterprise_age14.2911.450.163 *0.172 *0.288 *0.050 *0.084 *−0.245 *−0.015 *
9. Financial_leverage0.530.25−0.026 *−0.050 *0.088 *−0.008−0.018 *−0.041 *−0.306 *0.014 *
10. ln_RD b9.751.460.253 *0.475 *0.201 *0.227 *0.400 *−0.577 *0.292 *0.181 *−0.023 *
11. ln_rd_employee b5.921.040.174 *0.252 *0.225 *0.191 *0.215 *−0.607 *0.125 *0.211 *0.070 *0.457 *
Note: *: p < 0.05; a: N = 11,556; b: Logarithm.
Table 4. Probit regression results of government subsidies choice model (Formula (3)).
D government   subsidy :   Probit   Model
201120122013
State ownership0.096 ***0.119 ***0.178 ***
[0.001][0.000][0.000]
Position in industry0.0650.103 **0.083 **
[0.107][0.010][0.041]
ln_patent0.158 ***0.173 ***0.165 ***
[0.000][0.000][0.000]
Enterprise_size0.084 ***0.091 ***0.087 ***
[0.000][0.000][0.000]
Total profits b−0.013 ***−0.006 **−0.009 ***
[0.000][0.021][0.000]
ln_rd_employee b−0.047 ***−0.050 ***−0.045 ***
[0.000][0.000][0.000]
Enterprise_age0.003 ***0.003 ***0.004 ***
[0.000][0.000][0.000]
ln_RD b0.158 ***0.149 ***0.146 ***
[0.000][0.000][0.000]
Financial leverage−0.115 ***−0.089 **−0.095 ***
[0.001][0.013][0.006]
_cons−1.700 ***−1.865 ***−1.937 ***
[0.000][0.000][0.000]
N11,55611,32811,325
Note: [] is p value. ***: p < 0.01, **: p < 0.05, * p < 0.1. Fixed effects of two-digit industry and province are controlled in regression model. b: Logarithm.
Table 5. Descriptive statistics and correlation matrix a.
1234
1.fitted_Dgovernment subsidy20111.000
2.fitted_Dgovernment subsidy20120.982 ***1.000
3.fitted_ Dgovernment subsidy20130.943 ***0.955 ***1.000
4.government subsidies0.432 ***0.434 ***0.427 ***1.000
Note: p-values in brackets; * p < 0.1, ** p < 0.05, *** p < 0.01.
Table 6. Results of regression analysis on standard innovation.
Step1 Step2: OLS+IV
EV: ln_GS Dependent Variable: ln_standard
M1M2M3M4M5M6
Fitted_Dgovernment subsidy20117.989 **
[0.015]
Fitted_Dgovernment subsidy2012−5.531 *
[0.070]
Fitted_Dgovernment subsidy2013−0.911
[0.201]
Position in industry0.214 ***0.170 ***0.117 ***0.118 ***0.637 ***0.109 ***
[0.000][0.000][0.000][0.000][0.000][0.000]
ln_patent0.215 ***0.056 ***0.042 ***0.045 ***0.044 ***−0.025
[0.000][0.000][0.000][0.000][0.000][0.304]
Enterprise_size0.040 **−0.017 ***−0.009 ***−0.010 ***−0.016 ***−0.016 ***
[0.021][0.000][0.009][0.003][0.000][0.000]
ln_total_profits b0.008 *0.000−0.000−0.000−0.0000.000
[0.056][0.500][0.604][0.517][0.721][0.736]
ln_rd_employee b−0.053 ***0.011 ***0.006 **0.005 *0.005 *0.007 **
[0.000][0.000][0.023][0.051][0.053][0.012]
Enterprise age0.005 ***0.004 ***0.004 ***0.004 ***0.004 ***0.004 ***
[0.000][0.000][0.000][0.000][0.000][0.000]
State ownership0.405 ***0.054 ***0.0080.675 ***0.0150.002
[0.000][0.000][0.563][0.000][0.296][0.884]
ln_RD b0.579 ***0.048 ***0.0310.039 *0.0340.005
[0.000][0.000][0.182][0.097][0.147][0.832]
Financial leverage−0.274 ***−0.031 ***−0.029 **−0.034 **−0.033 **−0.015
[0.000][0.000][0.043][0.020][0.021][0.300]
ln ( GS ) ^ −0.302 ***−0.285 ***−0.226 ***−0.034
[0.000][0.000][0.000][0.409]
ln ( GS ) ^ 2 0.027 ***0.024 ***0.020 ***0.006 ***
[0.000][0.000][0.000][0.000]
GS_STATE −0.181 ***
[0.000]
GS2_STATE 0.012 ***
[0.000]
ln ( GS ) ^ *STATUS −0.231 ***
[0.000]
ln ( GS ) ^ 2 *STATUS 0.021 ***
[0.000]
ln ( GS ) ^ *PATENT −0.006
[0.310]
ln ( GS ) 2 *PATENT 0.002 ***
[0.000]
_cons2.413 ***−0.599 ***0.503 ***0.428 ***0.328 ***−0.072
[0.000][0.000][0.000][0.000][0.000][0.396]
R20.3270.127 0.1390.1410.1410.143
F273.75155.68182.70178.6182.46184.04
N590011,55611,52511,52511,52511,525
Note: p-values in brackets; * p < 0.1, ** p < 0.05, *** p < 0.01. b: Logarithm. EV: Endogenous variables. Fitted Dgovernment subsidy: Fitted value of government subsidies choice. Fixed effects of two-digit industries and provinces are controlled in regression model.
Table 7. Results of robustness test.
Dependent Variable: ln_standard
M3M4M5M6
ln ( GS ) ^ −1.772 ***−1.736 ***−1.653 ***−1.540 ***
[0.000][0.000][0.000][0.000]
ln ( GS ) ^ 2 0.027 ***0.024 ***0.020 ***0.006 ***
[0.000][0.000][0.000][0.000]
GS_SOE −0.219 ***
[0.000]
GS2_SOE 0.015 ***
[0.000]
ln ( GS ) ^ _STATUS −0.240 ***
[0.000]
ln ( GS ) ^ 2 STATUS 0.022 ***
[0.000]
ln ( GS ) ^ PATENT 0.003 ***
[0.000]
ln ( GS ) 2 _PATENT 0.011 **
[0.045]
Cragg−Donald Wald F: 11.411
R20.1360.1390.1390.138
F168.96165.67169.1417.52
N11,39411,39411,39411,394
Note: p-values in brackets; * p < 0.1, ** p < 0.05, *** p < 0.01. Fixed effect of two-digit industry and province are controlled in regression model.

