1. Introduction
Sustainability is increasingly a strategic imperative [
1]. Companies implement sustainability for a variety of motivations. A small number of self-selecting companies, for instance, are true believers [
2]. They pursue sustainability because it is the right thing to do, and make investments without concern for the cost. Most companies, by contrast, are motivated by a desire to improve their corporate image or achieve operational efficiencies [
3]. That is, sustainability supports companies’ competitive strategies by protecting a firm from reputational risk and reducing operational costs [
4,
5,
6]. Although these companies desire to protect or burnish their reputations, they are much more cost conscious. They must make the business case for sustainability, demonstrating a positive return on the investment made.
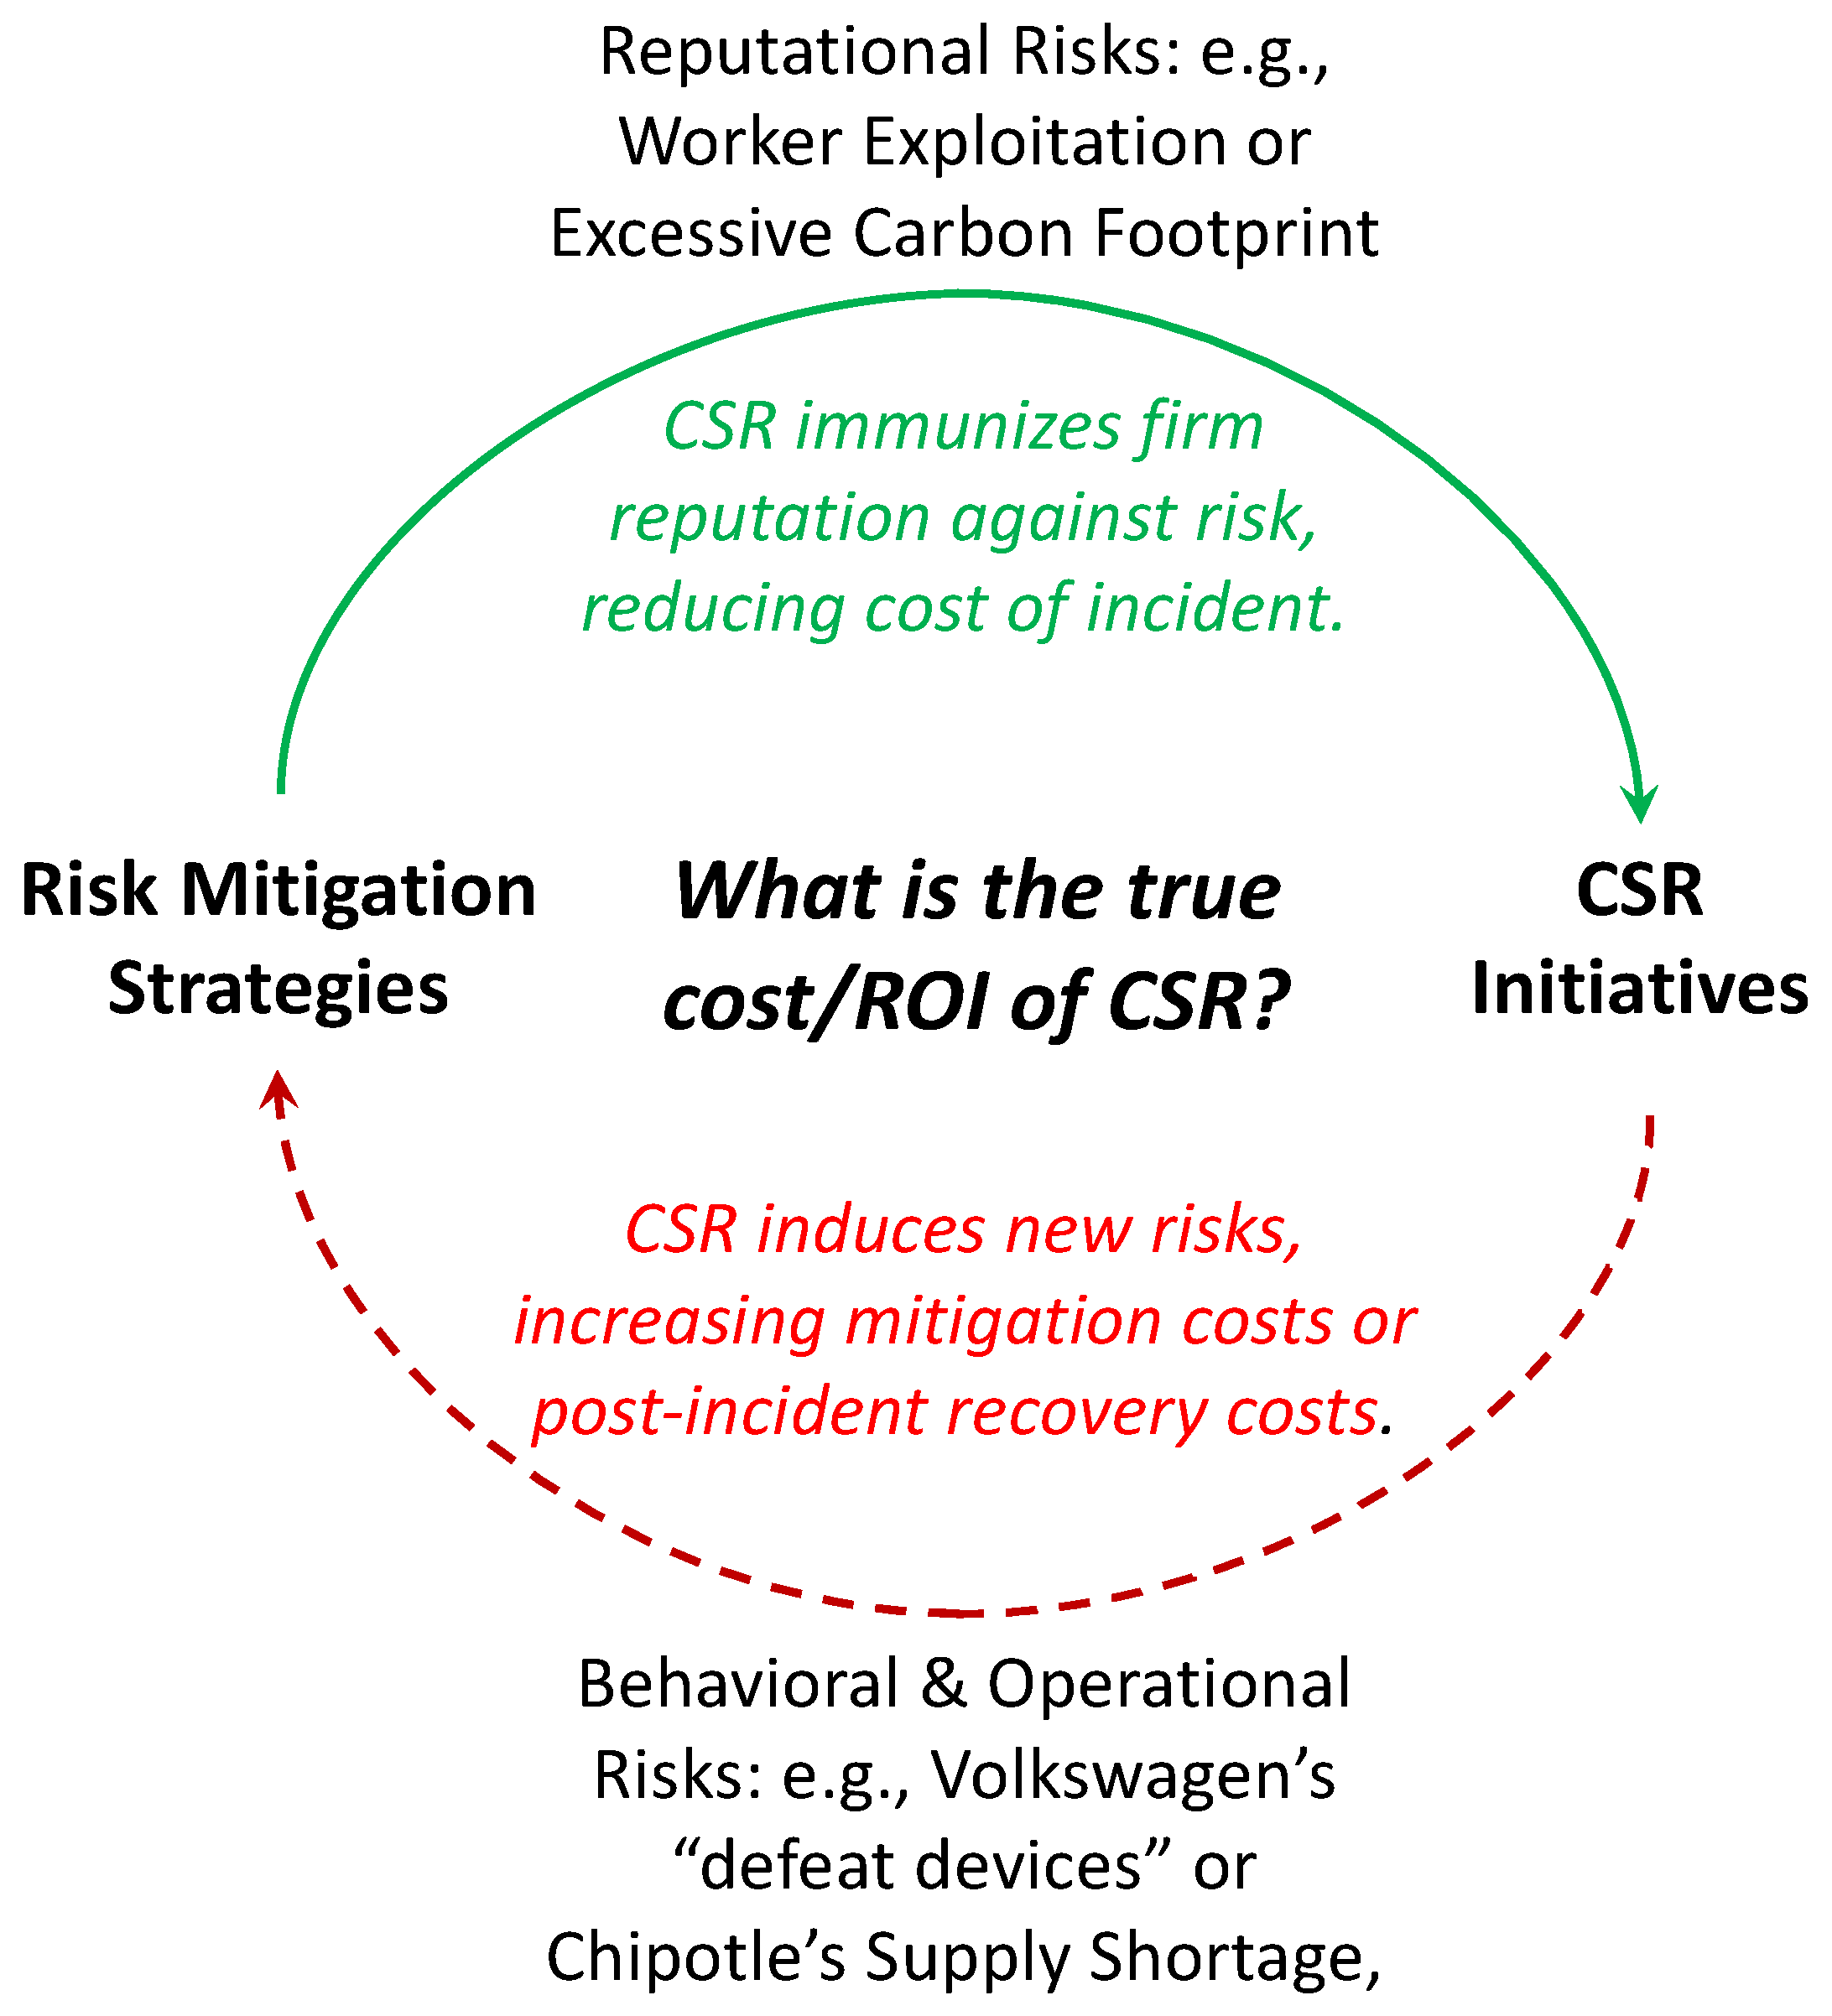
However, the sustainability–risk relationship may be more nuanced (see
Figure 1).
Anecdotal evidence, for instance, suggests that sustainability strategies may actually increase operational risks, disrupting both supply chain and organizational performance [
7]. Consider how glitches associated with sustainability-driven branding negatively affected operations at Chipotle and Volkswagen.
Supply Shortages and Food Safety. Chipotle Mexican Grill built its identity on the popular notion of “Food with Integrity”. However, repeated supply shortages of eco-friendly inputs such as beef and pork required Chipotle to pull fast-selling products from its menu. Worse, food contamination caused E. coli and norovirus outbreaks, damaging Chipotle’s reputation and leading to a 29.7% drop in same store sales [
8].
Unrealistic Pressure to Perform. For years, Volkswagen built its identity on high-performing, highly efficient clean diesel technology. The carbon footprint-reducing technology, however, did not actually exist. To perpetuate the clean diesel narrative, software-driven “defeat devices” had been installed to cheat on emissions tests [
9]. Volkswagen was given an
$18.2 billion fine. Worse, Volkswagen incurred billions more in lost sales.
These sustainability-induced behavioral and operational risks—and the subsequent operational disruptions—increase a variety of costs even as they expose the firm to a different kind of reputational risk [
10,
11,
12]. The research on supply chain glitches, in fact, reveals that regardless of cause, disruptions negatively impact operational and stock performance [
13]. Critically, as costs go up, sustainability programs become more difficult to justify [
2]. The existence of these economic tradeoffs threatens to undermine the viability of sustainability initiatives. Yet, this contingent sustainability–risk–cost relationship is largely overlooked and remains poorly understood [
14]. If the goal is to promote sustainability as a mainstream practice applicable to all firms, not just true believers, research that better delineates this relationship is relevant and timely.
Part of mainstreaming sustainability is to encourage sustainable production in emerging markets. This contingent sustainability–risk–cost sequence; however, is likely to have a more-pronounced adverse impact on sustainability efforts in emerging economies. Specifically, the primary competitive advantage of emerging economies is low production costs [
15].
Domestic producers, for instance, rely on lower-cost resources—especially low-cost labor—to fend off foreign rivals. Likewise, to access these same low-cost resources, multinational enterprises invested over
$646 billion in emerging economies in 2016 [
16]. To the extent that sustainability induces risks and increases costs, companies will either invest less in emerging markets or forego sustainability initiatives in these markets. Thus, to enhance the viability of emerging-market sustainability strategies, it is the time to conduct research that explicitly explores how sustainability efforts in emerging markets influence companies’ risk profiles and subsequent costs.
To improve the viability of sustainability initiatives for the long-term in emerging markets, we elaborate theory on the sustainability–risk interaction across diverse industries. The goal is to define the contingent sustainability–risk–cost relationship to help decision-makers develop effective risk-management strategies, a process that begins by recognizing and prioritizing risks [
17,
18,
19,
20]. To do this, we pursued a multi-method research program. To gain insight into industry-specific risk profiles, we employed a Fuzzy AHP methodology with managers from the food, automotive, apparel, and white goods industries operating in Turkey, a leading emerging market. To contextualize the findings and better grasp why certain tradeoffs exist and how they are managed, we used semi-structured interviews.
We contribute to the literature by elaborating the sustainability–risk relationship, demonstrating that it is bi-directional. Thus, we introduce a framework to begin to address the critical question, “What is the true cost of corporate social responsibility?” We further delineate the sustainability–risk–cost relationship. Importantly, we inform as to how and why sustainability-induced risk profiles vary across industries, documenting distinct risk profiles for four industries that are targets for foreign direct investment in emerging economies. The identification of risk profiles provides a starting point for companies to design proactive risk-mitigation programs, reducing the cost and improving the economic viability of sustainability programs. Our findings further highlight barriers hindering environmental sustainability and offer guidance to improve the design of sustainable supply chains.
2. Theoretical Background: The Sustainability–Risk Relationship
The extant research indicates that sustainability and risk are related. In effect, Carter and Rogers [
18] (p. 366) defined sustainability explicitly as “the ability of a firm to understand and manage its economic, environmental and social risks in the supply chain”. Even so, scholars acknowledge that our understanding of the sustainability–risk relationship is fragmented, meager and unsatisfactory (e.g., [
14,
21]). Indeed,
Table 1, which summarizes the recent research on the sustainability–risk relationship, shows that there is neither agreement on the direction of the relationship nor a holistic and nuanced view of how these critical management domains interact.
Despite the paucity of empirical research on the sustainability–risk relationship, research alludes to three pertinent points related to our research.
- 1.
Sustainability Is a Response to Stakeholder Priorities. Hofmann et al. [
11] suggest that sustainability-related risks likely behave distinctly from other risks. Specifically, they posit that ordinary supply chain risks are triggered by disruptions related to product, service or financial flows. By contrast, the reputational risks that lead to the implementation of sustainability programs are triggered by the social or environmental reactions of the stakeholders.
- 2.
Sustainability May Engender Risks. Anderson and Anderson [
27] warn that sustainability programs may actually induce risks and increase operating costs and that businesses must ultimately cover those costs.
- 3.
Risk Mitigation Strategies May Require Customization. Giannakis and Papadopoulos [
10] argue that because sustainability-induced risks may differ based on a firm’s supply chain operations and competitive environment, a generic, standardized risk mitigation approach may not be appropriate.
These ideas, which are embedded in the sustainability literature, are neither explored in depth nor empirically tested by the extant research. This reality calls for (1) a brief review of risks identified by the supply chain literature, as well as (2) an empirical exploration that considers the nuanced bi-directional sustainability–risk relationship.
2.1. Risk Identification and Prevalence in Supply Chain Management
To ensure that the risk dimensions we explore empirically are consistent with the extant literature, we performed a systematic literature search using the Web of Knowledge database. We identified 488 relevant articles—that is, articles that discussed risk in the context of supply chain management. Using NVivo software, we performed a content analysis to identify the most-frequently identified sustainability-related risks. Two risk sources are discussed extensively in the extant research. Specifically, organizational routines are mentioned 594 times. Production processes and safety and traceability routines are identified 426 times. Within these overarching risk categories, the literature focuses on planning, information, safety, quality, and control. Three other risk sources were also mentioned: Systems design, behavioral, and opportunism risks (see
Table 2). As discussed in the methods section, we use these risk dimensions in our fuzzy analysis of risk prioritization.
2.2. Understanding Risk Profiles and Risk Mitigation
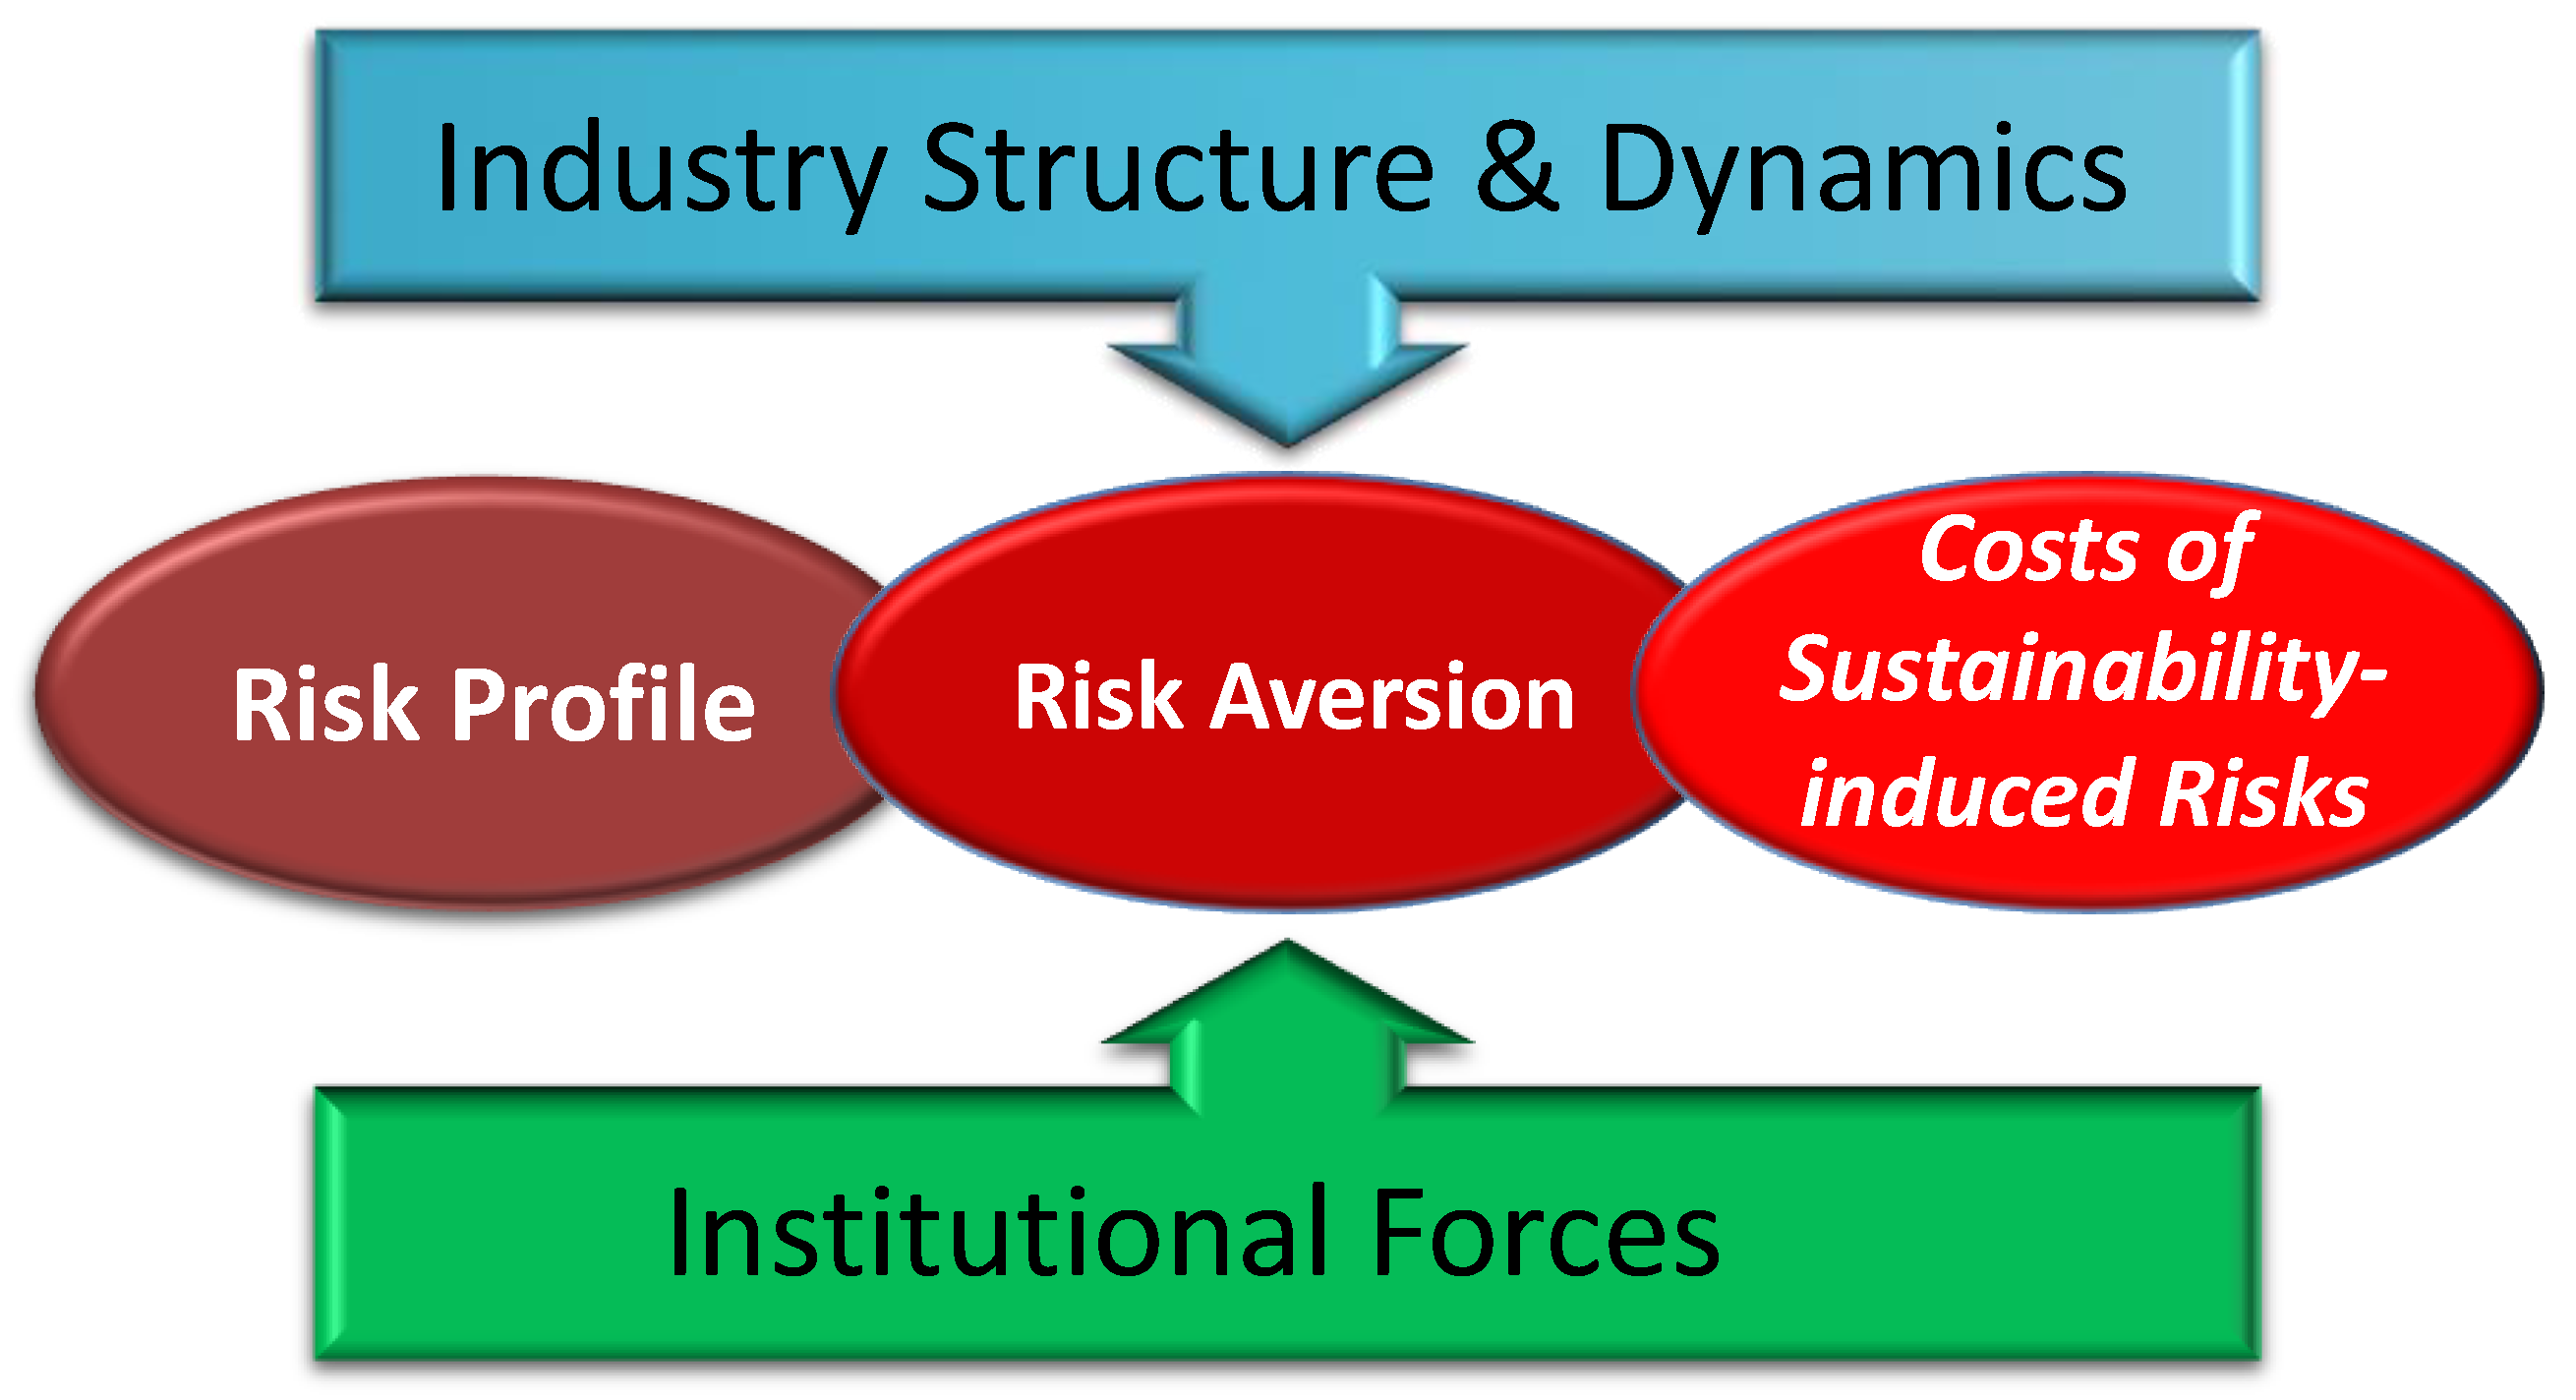
A firm’s sustainability efforts and supply chain risk are subject to influence from a combination of industry level dynamics and its institutional environment (e.g., [
28,
29]). Accordingly, we draw on a theoretical framework that considers both industry and institutional factors and how they influence the net sustainability–risk–cost relationship (see
Figure 2). At the industry level, firm performance is generally determined by unique structural issues that influence the level and nature of competition. The extent to which a firm is embedded in a complex network of relationships influences strategy, resource utilization, and competitive advantage [
2,
30,
31,
32,
33]. How a firm responds to these forces shapes its overall risk profile [
34,
35,
36,
37]. That is, firms may place different priorities on risk dimensions in reaction to characteristics unique to their industry.
On the other hand, institutional theory emphasizes homogeneity, isomorphism, and adaptive change as the three forms of pressure on firms to conform to their institutional environment. It suggests that commonly accepted policies and norms translate organizational members, their structures, and their processes into an isomorphic format [
38]. Following institutional theory, firms and their industries are assumed to converge on a shared approach, which could effectively reduce the costs of risk mitigation. Thus, when possible firms will attempt standardize their approach to risk prioritization and mitigation.
2.2.1. Industrial Structure View, Competitive Dynamics and Risk Aversion
There are two perspectives through which an industry is believed to influence firm action. Under the static view, an industry’s structure is believed to be exogenous to a firm and largely stable [
39,
40]. Industrial organization theory suggests that the industry structure influences individual firm strategy and performance [
39]. The Schumpeterian perspective believes that an industry’s market structure is dynamic and constantly evolving [
41,
42]. Similar to the static view, the dynamic perspective also prescribes that firm strategy and performance derive from both its own conduct as well as that of rivals [
43]. Therefore, it is argued that unit of analysis is not an individual firm, but the firm and its industry [
43] with a dynamic structure [
30].
Ultimately, firms make calculated strategic choices based on varying value propositions within their industry to formulate corresponding business policies [
40]. However, a firm’s competitive actions are still subject to its industry competitors’ reactions within parameters defined by common industry attributes [
30,
32]. Thus, the performance outcomes of a firm’s decisions are subject to additional influence from its industry’s structural characteristics, including its overall embeddedness in its network of relationships [
31,
44].
The dual influence from both firm-level decisions as well as industry-level structure and market competition, the latter two being unique to different industries [
30], causes a firm’s sustainability strategy and risk tradeoffs to be strategically idiosyncratic [
32]. For instance, a grocery retailer may embrace environmental sustainability and position itself to be a purveyor of premium, organic products. In doing so, it must procure only organic produce from certified suppliers, which substantially limits its ability to diversify its supply base to mitigate the risk of supply disruption. Competitors may choose not to follow a similar strategy in order to avoid becoming exposed to the same supply chain risk. That is, risk profiles and patterns under the industrial structure view are expected to differ among firms based on their competitive positioning within their own industry. Therefore, we propose:
Proposition 1. Industry structure will influence competitive strategy and firm-level adoption of sustainability programs that will in turn drive industry-specific risk profiles.
Furthermore, industry structure and its competitive dynamics influence a firm’s attitudes toward risk. Under the tenets of risk aversion theory, structural characteristics and competitive intensity unique to different industries will impel firms to behave differently toward risk [
34,
45]. For instance, firms in highly competitive industries tend to operate with low margins (e.g., [
46]). As a result, they are preoccupied with activities concerning revenue and cash flow maximization at the expense of sustainability strategies and risk mitigation. Such firms tend to overlook vital environmental and social sustainability risks [
7,
11,
14].
Extant literature also provides ample documentation that the overall level of competition [
32,
47,
48], resource availability (e.g., [
49]), and degree of uncertainty [
50,
51] in an industry further influence the general attitude among its members toward investment decisions. As Giannakis and Papadoplous [
10] noted, firms are subject to influence from sustainability-related risks that are outside of their control. Specifically, we believe that unique risk profiles and the associated costs of risk mitigation are likely to create different approaches to risk management across industries. Therefore,
Proposition 2. Industry-specific risk profiles that derive from unique structural characteristics will drive distinctive risk-mitigation strategies.
2.2.2. Institutional Theory
Under institutional theory, forces exogenous to a firm’s industry such as regulations and cultural norms are believed to drive organizations to become increasingly similar, and shift towards isomorphism [
52]. Coercive pressures stem from societal expectations and inter-organization interdependence; whereas normative pressures derive from professionalization and mimetic pressures arise from environmental uncertainty [
53]. Organizations in the same field develop similar sets of administrative structures, as they encounter similar coercive, normative, and mimetic pressures [
53]. For this reason, institutional pressures result in organizational homogeneity [
54].
Although firms operating under the same environment possess different capabilities and competencies, they still experience common coercive, normative, and mimetic pressures that influence strategy [
55]. Efforts to conform to institutional pressures minimize the general risk of their business operations violating core norms, rules, values, and beliefs [
53,
56,
57,
58]. For instance, in the United States of America, the Environmental Protection Agency (EPA) set a “Universal Waste” program to regulate how businesses across all industries handle hazardous waste (e.g., mercury-containing equipment). Such an exogenous force homogenizes firms’ risk profiles as well as how they approach those risks. Risk mitigation tends to standardize to the lowest-cost viable solution. As a result, it is possible that institutional forces drive similar risk profiles and standardized risk-mitigation strategies. Formally stated:
Proposition 3. Common institutional forces drive similar sustainability-induced risks and a standardized approach to mitigating them.
3. Methodology
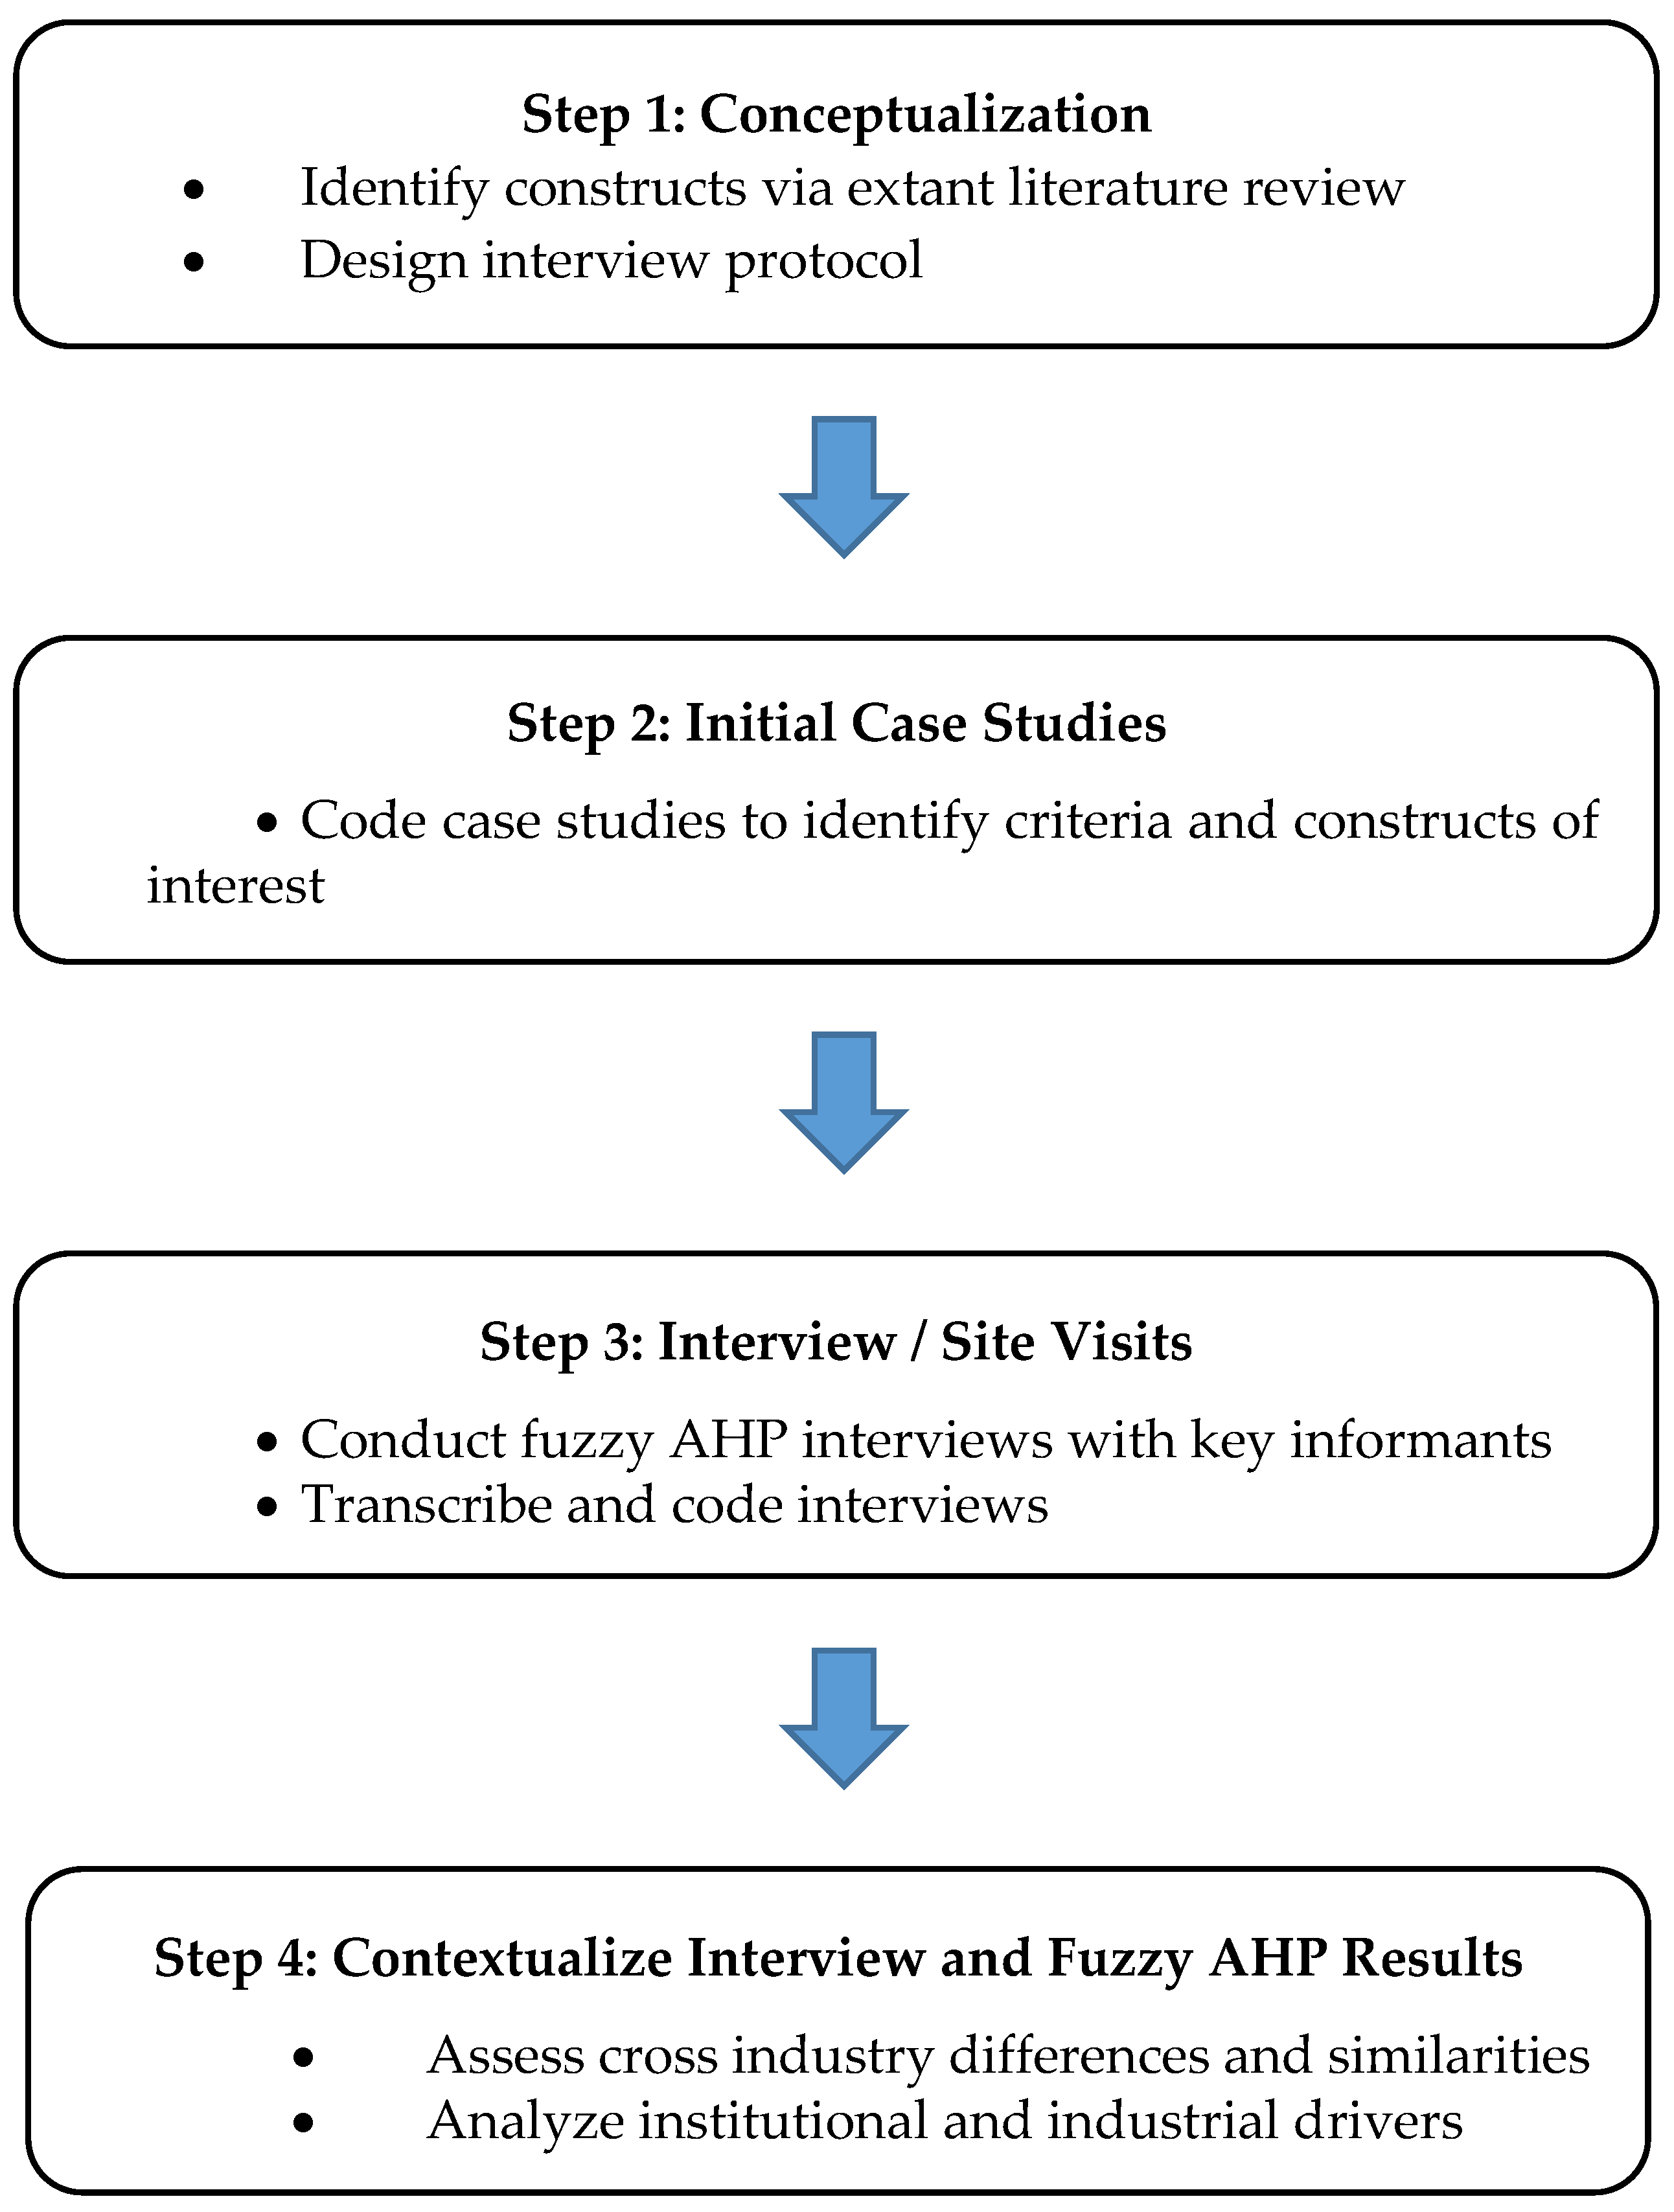
This study employs a multi-method research design, which includes quantitative analysis and qualitative interviews (
Figure 3). We first apply Fuzzy AHP analysis to inductively derive priorities for five dimensions of risk salient to environmental sustainability initiatives in food industry. We further conducted a series of in-depth interviews to understand the dynamics behind how environmental sustainability affects each dimension of risk in the Turkish economy. We then expanded our analysis by collecting both quantitative and qualitative data from three other industries—apparel, automotive, and white goods—and developed their risk–cost profiles to examine the extent to which companies can standardize their approaches to mitigating the risks created or exacerbated by sustainability initiatives.
This study explores the contingent sustainability–risk–cost sequence as it is manifested in an emerging economy. Importantly, 70% of world’s growth is occurring in emerging countries. For sustainability to become mainstream practice, we must become more concerned with making sustainability practices viable in emerging economies. Otherwise, MNEs may begin to reduce their investments in these countries because suppliers cannot meet sustainability screening standards [
59]. Turkey possesses both the characteristic of an emerging economy, as well as a diverse range of industries that serve domestic and foreign customers [
60,
61,
62]. We recruited supply chain experts from four industries in Turkey—automotive, apparel, food, and white goods. These industries attract significant investment, but manifest distinct industry structures [
14]. Thus, we can expect diverse strategic priorities and unique supply chain practices. We purposefully recruited partnering firms positioned at different points along the supply chain within each industry (
Appendix A). Commonly, we recruited multiple respondents from firms with particularly complex operations. For example, the Turkish food manufacturing supply chain is more concentrated upstream whereas the reverse is true for automotive. Thus, we recruited one food supplier to three different food manufacturers but four different automotive suppliers to one manufacturer.
3.1. Initial Case Study—Risk Dimensions Salient to Environmental Sustainability
To begin to understand the sustainability–risk–cost sequence in emerging economies, we recruited participants from five different Turkish food supply chains for interviews and on-site observations [
63]. Specifically, we conducted 41 semi-structured interviews at 32 companies with managers and consumers by using an interview protocol assembled through a systematic literature review. These interviews typically lasted about an hour and were transcribed for interpretive analysis by multiple researchers [
64,
65]. This initial study identified five major risk categories [
63], and established the baseline for comparison as interviews were conducted in the automotive, apparel, and white goods industries.
3.2. The Methodological Approach to Exploring Distinctive Risk Profiles
To identify distinct risk profiles across industries, we employed a Fuzzy AHP approach using the five risk dimensions identified in the initial study. We sent each key informant a copy of the questionnaire before meeting for the face-to-face interview. Via Fuzzy AHP, managers quantified their risk priorities relative to each other in the context of environmental sustainability. Probing, open-ended questions are asked to gain insight into the rational that underlie their priorities [
66]. This methodological framework enabled us to explicitly understand and explore the risk profiles across four distinct industries concerning environmental sustainability.
3.2.1. Fuzzy AHP Methodology
Decision-making in multi-criteria problems becomes very challenging when some parameters are not in quantitative form. Analytical hierarchy process (AHP) overcomes this challenge, and offers an approach to incorporate qualitative assessment parameters, specifically for the cases where expressing preferences through exact numbers is very difficult [
67,
68]. In AHP, a hierarchy of criteria and sub-criteria are introduced, and pairwise comparisons are made between those criteria by professionals or experts in the subject to quantify their qualitative responses. Fuzzy AHP further extends this method by taking the fuzziness of decision-makers into account for valid cross-case comparison and consider potential uncertainty of responses [
69,
70]. By using fuzzy ratio scales, Fuzzy AHP builds a fuzzy judgment matrix to represent the strength of each factor relative to its pair and enables triangulation of the most preferred factor among a range of options [
67,
68]. Fuzzy AHP methodology is used in various areas of research, including sustainability and risk [
68,
71,
72].
3.2.2. Defining the Decision Problem and Formulating the Preference Scales
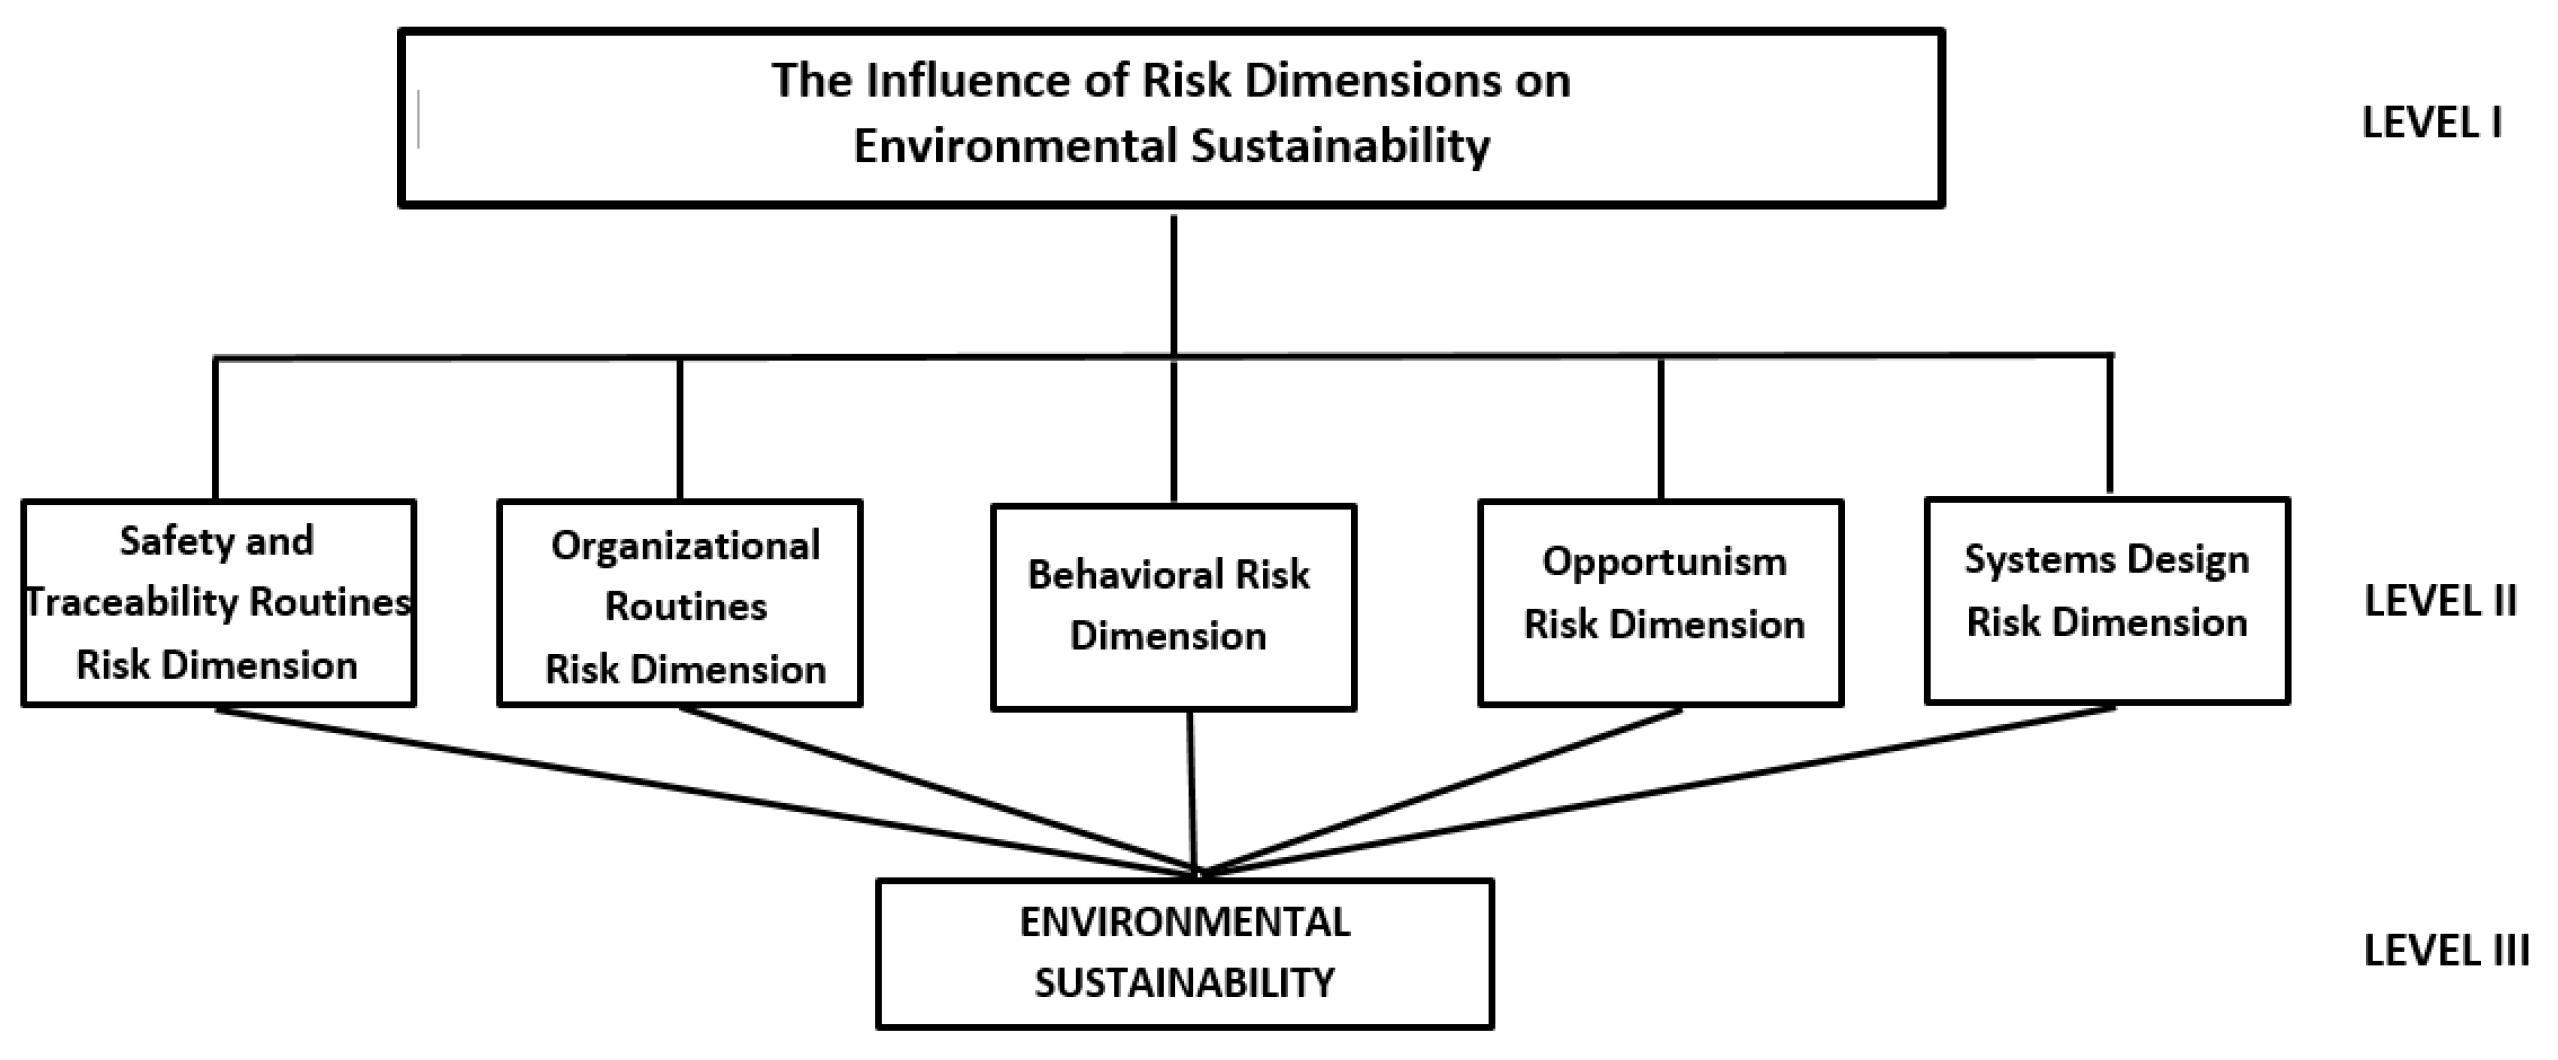
The fundamental steps in AHP start with elaborating the decision hierarchy through decomposing the decision into sub-independent elements. Therefore, first, the decision problem was represented in a hierarchal view in
Figure 4 for visualizing the structure of the analysis.
The main goal of the analysis is introduced in Level I. The five risk dimensions, which were evaluated for their prominence on environmental sustainability, are shown in Levels II and III, respectively.
Next, pairwise comparisons were employed among those decision elements to form comparison matrices and establish the priorities. The pairwise comparisons are carried out through the one-to-nine ratio scale of Saaty [
73] for the given criterion
i and criterion
j. The relative importance scale offered by Saaty is a standard preference scale which attributes values from 1 to 9 when comparing two alternatives, and the weights, calculated accordingly, help to position each element inside the defined hierarchy [
73,
74]. Each scale measurement has a different meaning (
Table 3).
Therefore, if two risk dimensions were assumed to have equal impact on sustainability consequences, the comparison scale would be 1; if one risk dimension was assumed to have moderately more negative impacts in terms of sustainability, the analysis scale would be 3. Similarly, scales 5, 7 and 9 are used to describe impacts which are negative, strongly negative, and extremely negative, respectively. The corresponding reciprocals 1, 1/2, 1/3, 1/5, 1/9 were used for the reverse comparison [
73].
Applied to our study, we asked respondents to make qualitative evaluations of the risk dimensions and make pairwise comparisons with respect to environmental sustainability (
Figure 4). For each pair (e.g., behavioral versus opportunism), respondents rated their relative importance through a 9-point Likert scale (
Table 3), ranging from equally preferred (1) to extremely preferred for the more important dimension (9).
Each respondent rated all possible permutations of pair-wise comparisons, which are then used to determine a triangular fuzzy number [
73]. Finally, each dimension’s triangular fuzzy numbers were defuzzified using CFCS [
75].
3.2.3. Fuzzy Set Theory
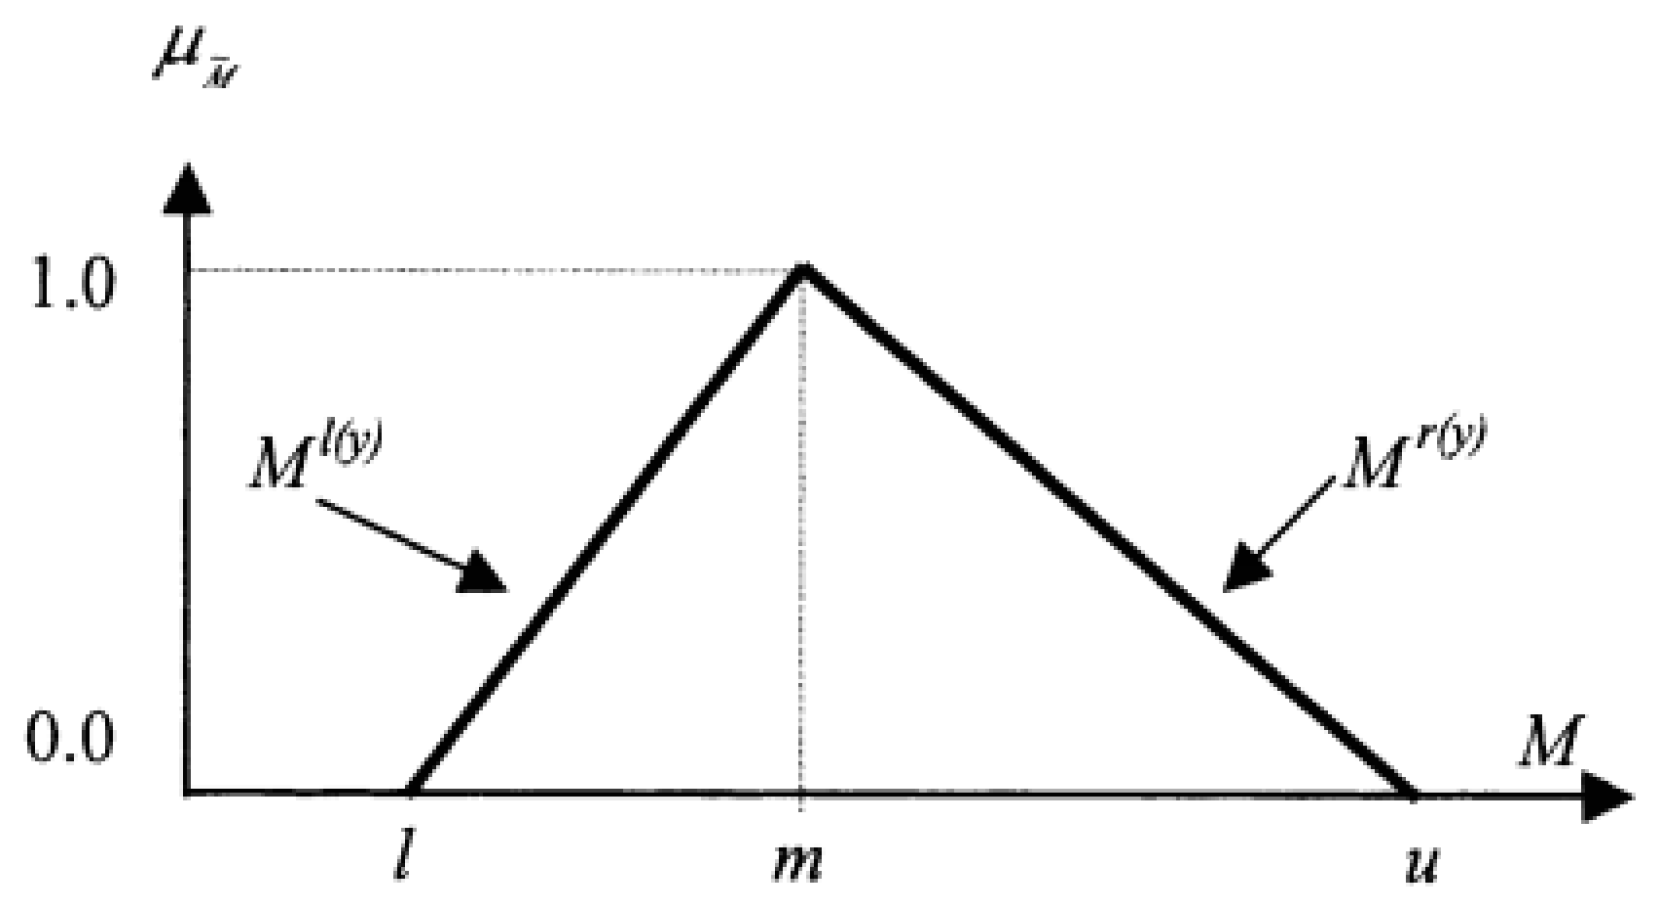
Fuzzy sets conveniently express memberships at various levels, different from crisp types of membership. This is particularly useful for the representation of linguistic values, where human subjectivity and vagueness limit expressions. Fuzzy sets are an object class that contains a continuum of grades of membership characterized by a membership function. A fuzzy number is a special fuzzy set that is defined as , where value ranges on the real line and is a continuous mapping from R1 to the close interval .
A triangular fuzzy number can be denoted by
. Here, the symbol “
” represents a fuzzy set for a triangular fuzzy number. Its membership function,
assigns a grade of membership between zero and one to each grade. Triangular fuzzy numbers (TFNs) are employed to translate the fuzzy values of quantitative data and to facilitate the generation of functions in applications. It can be denoted as
, where
,
,
respectively represent the smallest, the most promising, and the largest possible values in a fuzzy case [
76] (
Figure 5).
Cases where
do not represent any fuzzy numbers. The membership function
,
can be defined as [
73,
77];
A fuzzy number has a left-hand side
and right-hand side
representation of each degree of membership:
The fundamental rules for the operations between two fuzzy numbers are as below [
78]:
3.2.4. Fuzzy AHP and Defuzzification
In Fuzzy AHP, fuzzy synthetic values are calculated as follows [
76] (p. 138);
The TFNs for each goal
is represented by
that,
Therefore, this can be represented as;
is obtained by performing the fuzzy addition operation of
t values for a particular matrix such that,
while
is derived by implementing the fuzzy addition operation of
values, that,
The inverse vector
is computed by,
[
73,
77]
The geometric mean was applied in order to combine the fuzzy weights of the respondents in each industry [
79] (p. 50):
Here, respresents the combined fuzzy weight of decision element of respondents, and is the fuzzy weight of decision element i of respondent d, and D shows the number of decision-makers.
The fuzzy synthetic values are subsequently defuzzified into crisp values. This process involves the selection of a crisp element according to the output fuzzy set, and fuzzy numbers are also converted into crisp scores [
80]. In this research, to convert the fuzzy data into crisp values (CFCS), we follow Opricovic and Tzeng [
75]’s method, which has a similar development to Chen and Hwang [
80]’s fundamental CFCS method. In Chen and Hwang’s method [
80], for every
i-th criterion, and evaluation of alternatives is done with fuzzy numbers
for
, and
is the number of alternatives. The TFNs for this set is
,
and
i-th (one) criterion are contained in the defuzzification calculation. The algorithm for determining the crisp values for the
i-th criterion has four steps;
1. Normalization:
compute for all criteria
.
Compute left (
ls) and right (
us) normalized values, for
.
Compute total normalized crisp value, for
.
Compute crisp values for
.
This computation is performed for all criteria,
; where
denotes the set of criteria evaluated with fuzzy numbers [
75].
3.2.5. Measurement of Consistency
AHP methodology permits non-consistent pairwise comparisons. Thus, measuring and reporting the consistency ratio (CR) is critical to ensuring a degree of consistency that will verify that AHP results are meaningful. Perfect consistency is rare, but the pairwise comparisons in a judgement matrix are considered to be consistent when the corresponding CR is under 10% for all matrices above 5 (
) [
73]. In cases with a greater CR value, judgments are not considered as consistent, and therefore, the evaluation process needs improvement. The requirement in consistency calculations is the calculation of either the eigenvectors, or the relative weights, global weights and the maximum eigenvalue
) for al matrices. The eigenvectors or relative weights and
for each matrix of alternatives of criterion
n are therefore calculated to estimate the first consistency index (CI).
value is a critical validating parameter in AHP; it functions as a reference index CR calculation [
73,
74].
For each matrix, CI is calculated by the following formula:
Then, to calculate CR, CI is divided by random index (RI) value.
RI is the average value of CI and random entries in
A, which depends on the number of criterions.
Table 4 shows the value of RI for matrices with 1 to 10 criterions:
The acceptance of the pairwise comparison matrices is confirmed by the resulting CR ratio lower than 0.1 [
73,
74], (
Table 5).
4. Findings and Discussion
We posited that the nature and prioritization of risks for each industry would be influenced by both industrial and institutional forces. We used weights obtained through fuzzy AHP analysis to develop industry-specific risk profiles.
Table 6 displays these risk weights and rankings.
Whereas differences in weights and rankings illustrate the trade-offs idiosyncratic to each industry’s competitive dynamic [
30,
32,
34], their commonalities support the idea that there are forces driving the four industries toward limited isomorphism [
52,
53,
54]. Next, we analyze each industry, highlighting distinctive characteristics of each industry’s risk profile.
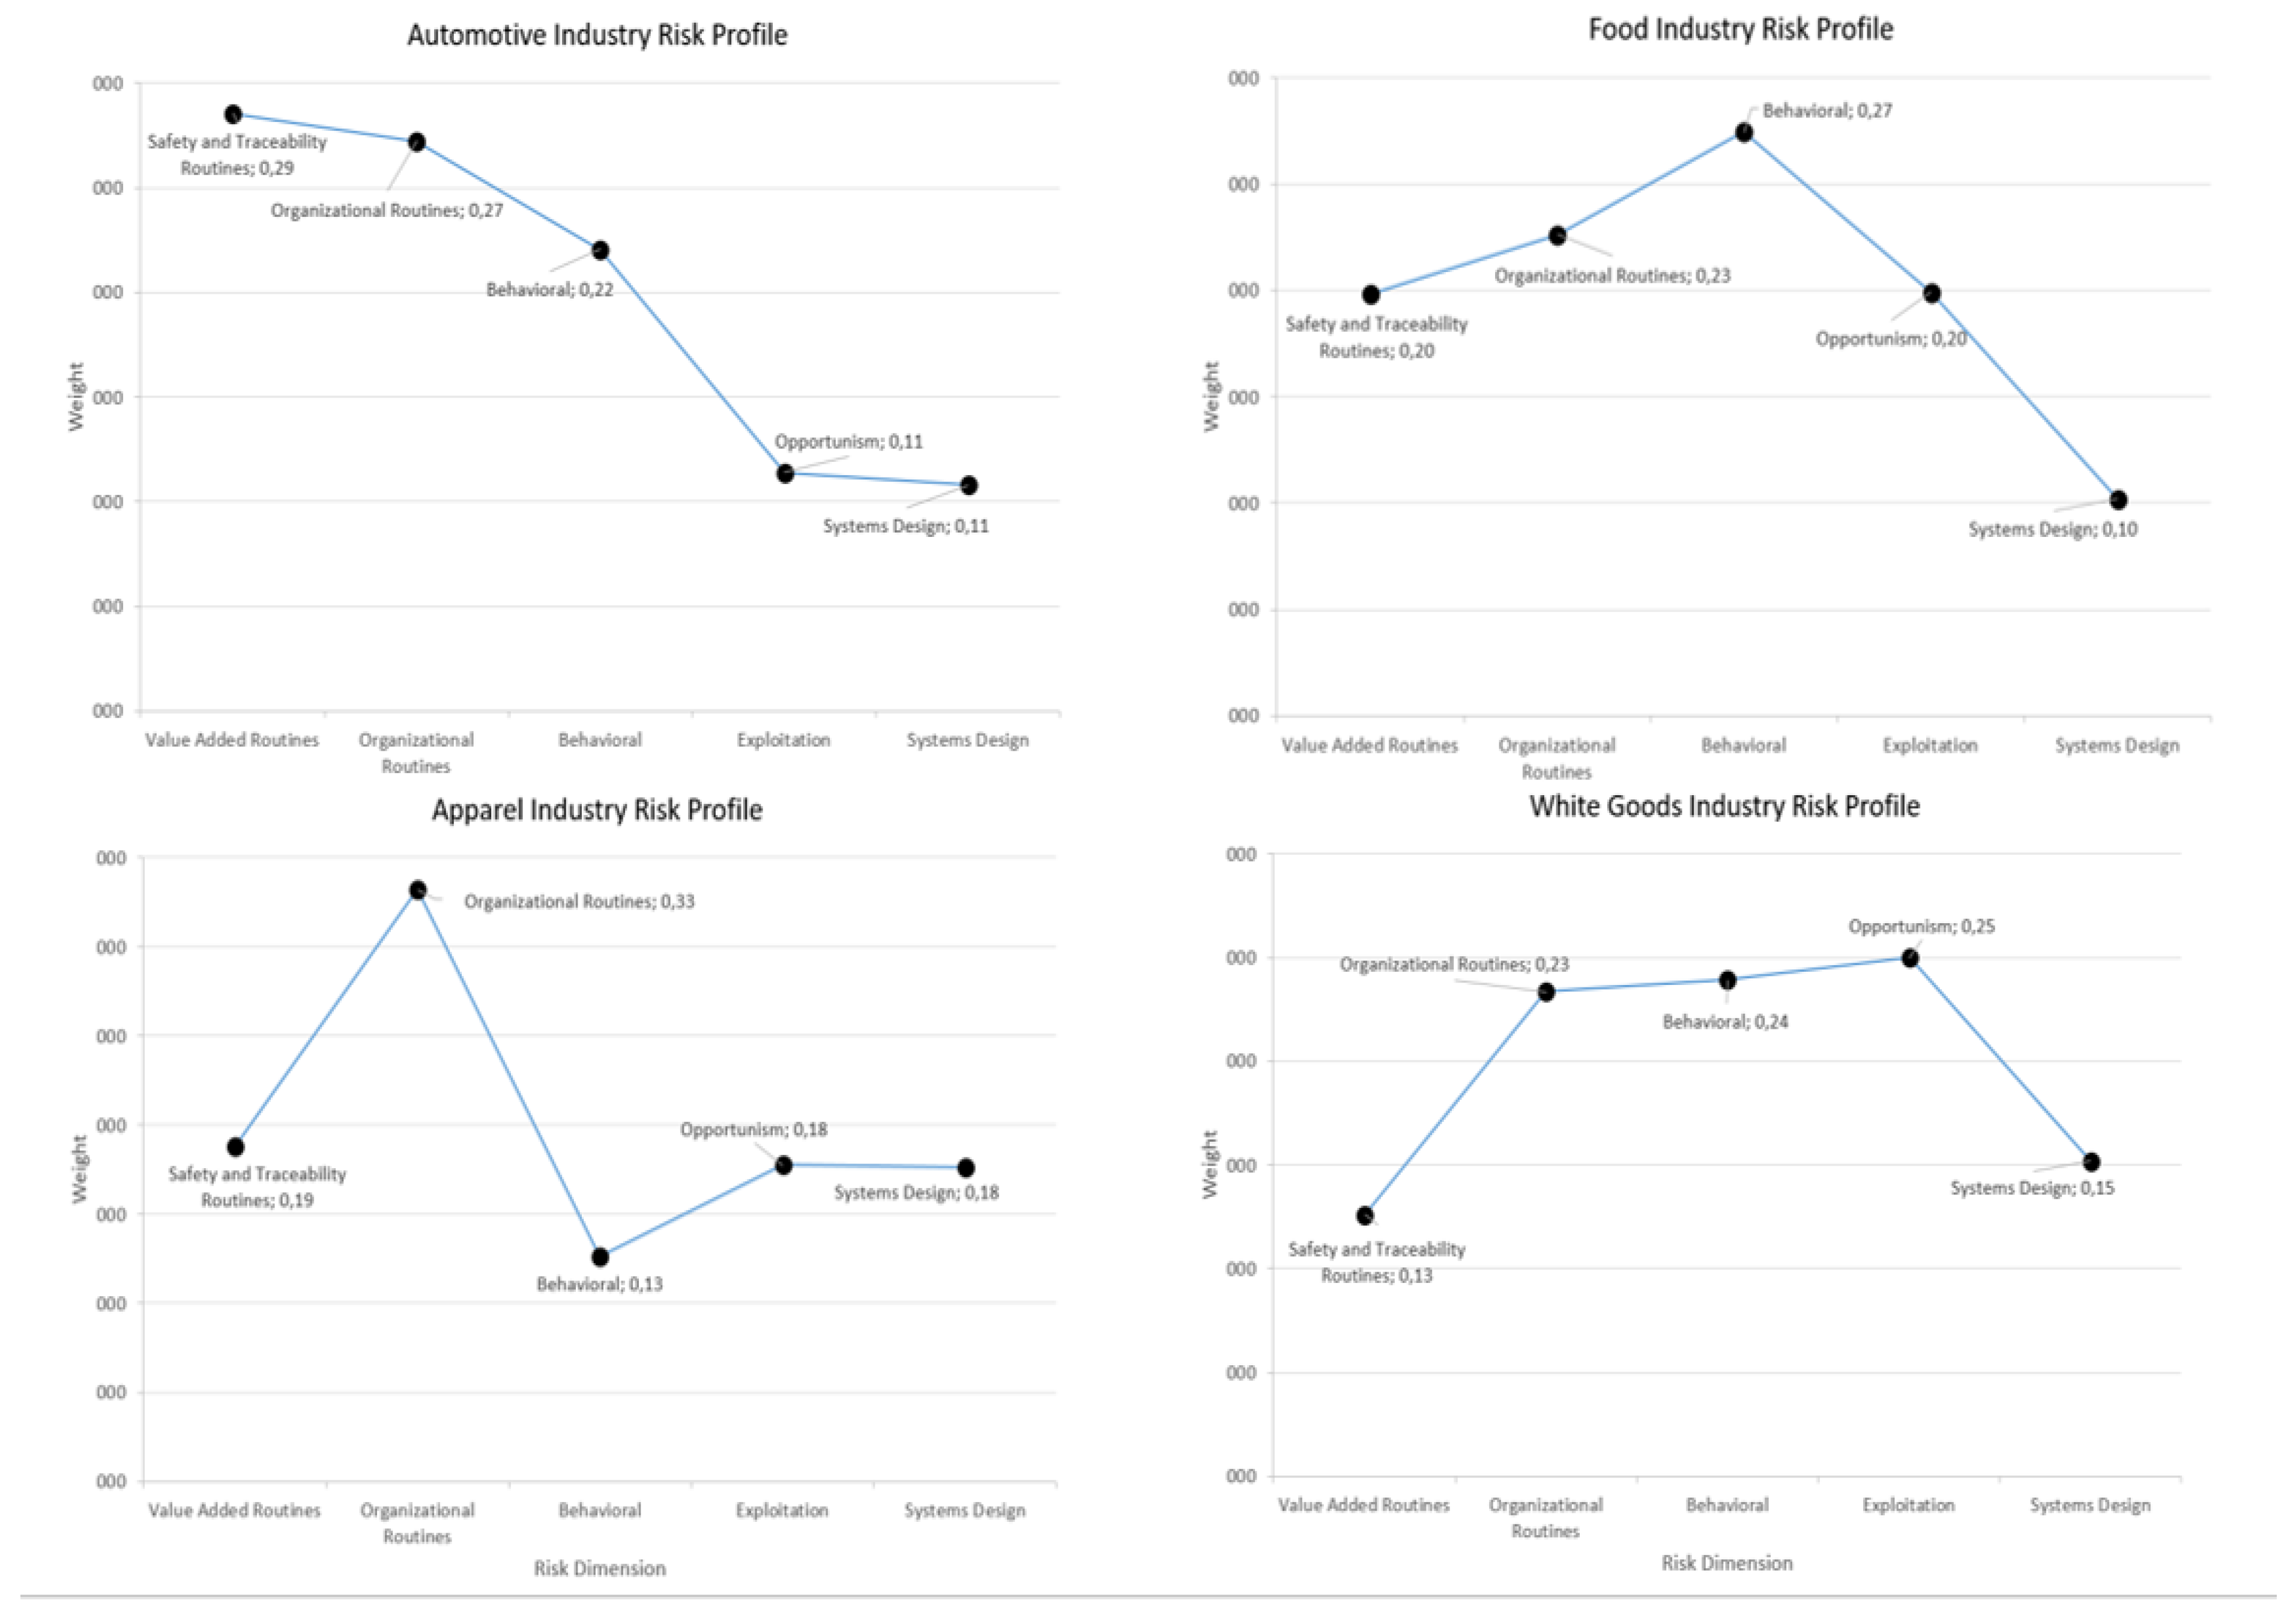
4.1. Within-Industry Analysis
Figure 6 shows the risk profiles for each Turkish industry examined in this study. For the automotive industry, the five sustainability-driven risk dimensions separate into two groups. The first group contains high-priority risks, namely safety and traceability and organizational routines (ST, OR) and behavioral (BE). Managers reported that rapidly advancing production technologies require them “to implement new technologies to survive” in an industry that “has been turned into a computer model”. Managers concur that “if your operational technology is insufficient, it means you will disappear”. Organizational routines direct capital investments in advanced production technology to emphasize effective responses to “environmental pressures [that] are shrinking the market”. Despite the emphasis on technology adoption, key informants stressed that “[they] do all of [their] work with people” who are tasked with ensuring environmental and quality standards. A lapse here threatens dire consequences. Hence, they discuss “the best of technology to control people’s behavior”. This socio-technical approach serves the industry well [
81].
The second group consists of low-priority risks: Opportunism (OP) and Systems Design (SD). An “institutionalized structure” results from a combination of market stability and longstanding relationships with supply partners. In particular, automotive OEMs tend to be headquartered in developed economies with highly stringent environmental regulations. Strict codes of conduct render “moral issues [as] not a concern”. Overall, because many firms in the Turkish automotive supply chain “use the global company’s brand name and implement their standards”, high degrees of control and standardization reduce opportunism and systems risks.
In the Turkish food industry, sustainability induces the greatest risks in the behavioral area. Specifically, a pervasive lack of awareness, knowledge, and care pertaining to environmental sustainability permeates the food industry. Most firms have yet to widely recognize its importance. One manager lamented: “It is necessary to raise people’s awareness about their environmental impact, because they are responsible for doing things such as recycling to improve the environment”. Managers pointed out that behavioral risks exacerbate organizational and opportunism risks. The low level of “awareness and knowledge” makes driving change difficult. Furthermore, intense competition in the food industry makes profits razor-thin. As a result, investments in automation to reduce waste are often eschewed in favor of low capital investment and revenue-maximizing strategies. As one manager expressed, “I usually face [sustainability] problems with manual processes”. Profit pressures also motivate opportunism as decision-makers cut corners to protect profits. For example, in the cold chain, managers explained that fish that “should be disposed of” is actually “frozen again to resell”.
Managers in the food industry also place minimal priority on system design risks when considering environmental sustainability, but for the opposite reason. In contrast to the automotive industry’s adoption of systems established by long-term global partners, food industry members have no incentive to invest in standardized systems to improve environmental sustainability. Characteristic of a hypercompetitive industry [
48], frequent entries and exits by partners in the food supply chain have created a perception among managers that “subcontracting is risky in Turkey” and requires firms to pursue flexibility over a standardized system so as to maximize their ability to work with diverse suppliers and customers.
Turkey’s apparel industry also has low barriers to entry and is heavily reliant on labor, and often generates hazardous waste (e.g., chemical dyes) that are loosely regulated and expensive to properly dispose of. As is typical in an emerging economy, “the waste disposal side of the (apparel) business in Turkey is very weak. It needs some rules and standards”. Managers thus isolate organizational routines as the most pervasive and potentially costly. Specifically, managers confirmed the need for procedure-based rules to ensure that process standards are achieved [
81]. These rules must extend to worker conduct and waste disposal.
Intense competition complicates the sustainability challenge because “anyone who buys a textile machine calls himself a textile manufacturer”. Cost is a primary differentiator. For example, buyers often demand higher environmental standards, but if “the manufacturer says ‘OK…, but my cost goes 10% higher’, the customer says ‘no price increase is accepted’”. Furthermore, “customers can always threaten (suppliers) with something” to extract the minimum cost. As a result, emphasis on near-term survival significantly hinders Turkish apparel makers from accumulating the necessary level of experience and sophistication to steadily improve organizational routines needed to promote greater environmental sustainability.
The Turkish white goods industry is dominated by local brands, rather than global producers. Managers reported that “Turkish people … (prefer) to go to a local dealer, sharing a friendly conversation and a cup of tea with the dealer while deciding on what (household appliances) to buy”. Hence, competition is fierce among local brands, all of which utilize a modular and labor-reliant production process of common components, resulting in goods that offer nearly identical performance and are thus mostly differentiated by cost or branding. Managers describe the industry as “…a bloody market… (where) everyone is at each other’s throat”.
To compete, decision-makers at Turkish white goods firms are tempted to “cut corners” when it comes to promoting sustainability. In this case, behavioral and opportunism risks comingle, exacerbating each other. For instance, employees at the retail level turn to greenwashing or they mischaracterize sustainability performance to secure sales, relying on consumers’ ignorance and apathy regarding product sustainability. The tendency toward corner cutting is pervasive across the entire supply chain network. One manager, speaking about upstream suppliers, lamented that, “You cannot trust anyone”. Managers thus described a need for stronger organizational routines to curb corner cutting and promote more legitimate efforts to enhance sustainability.
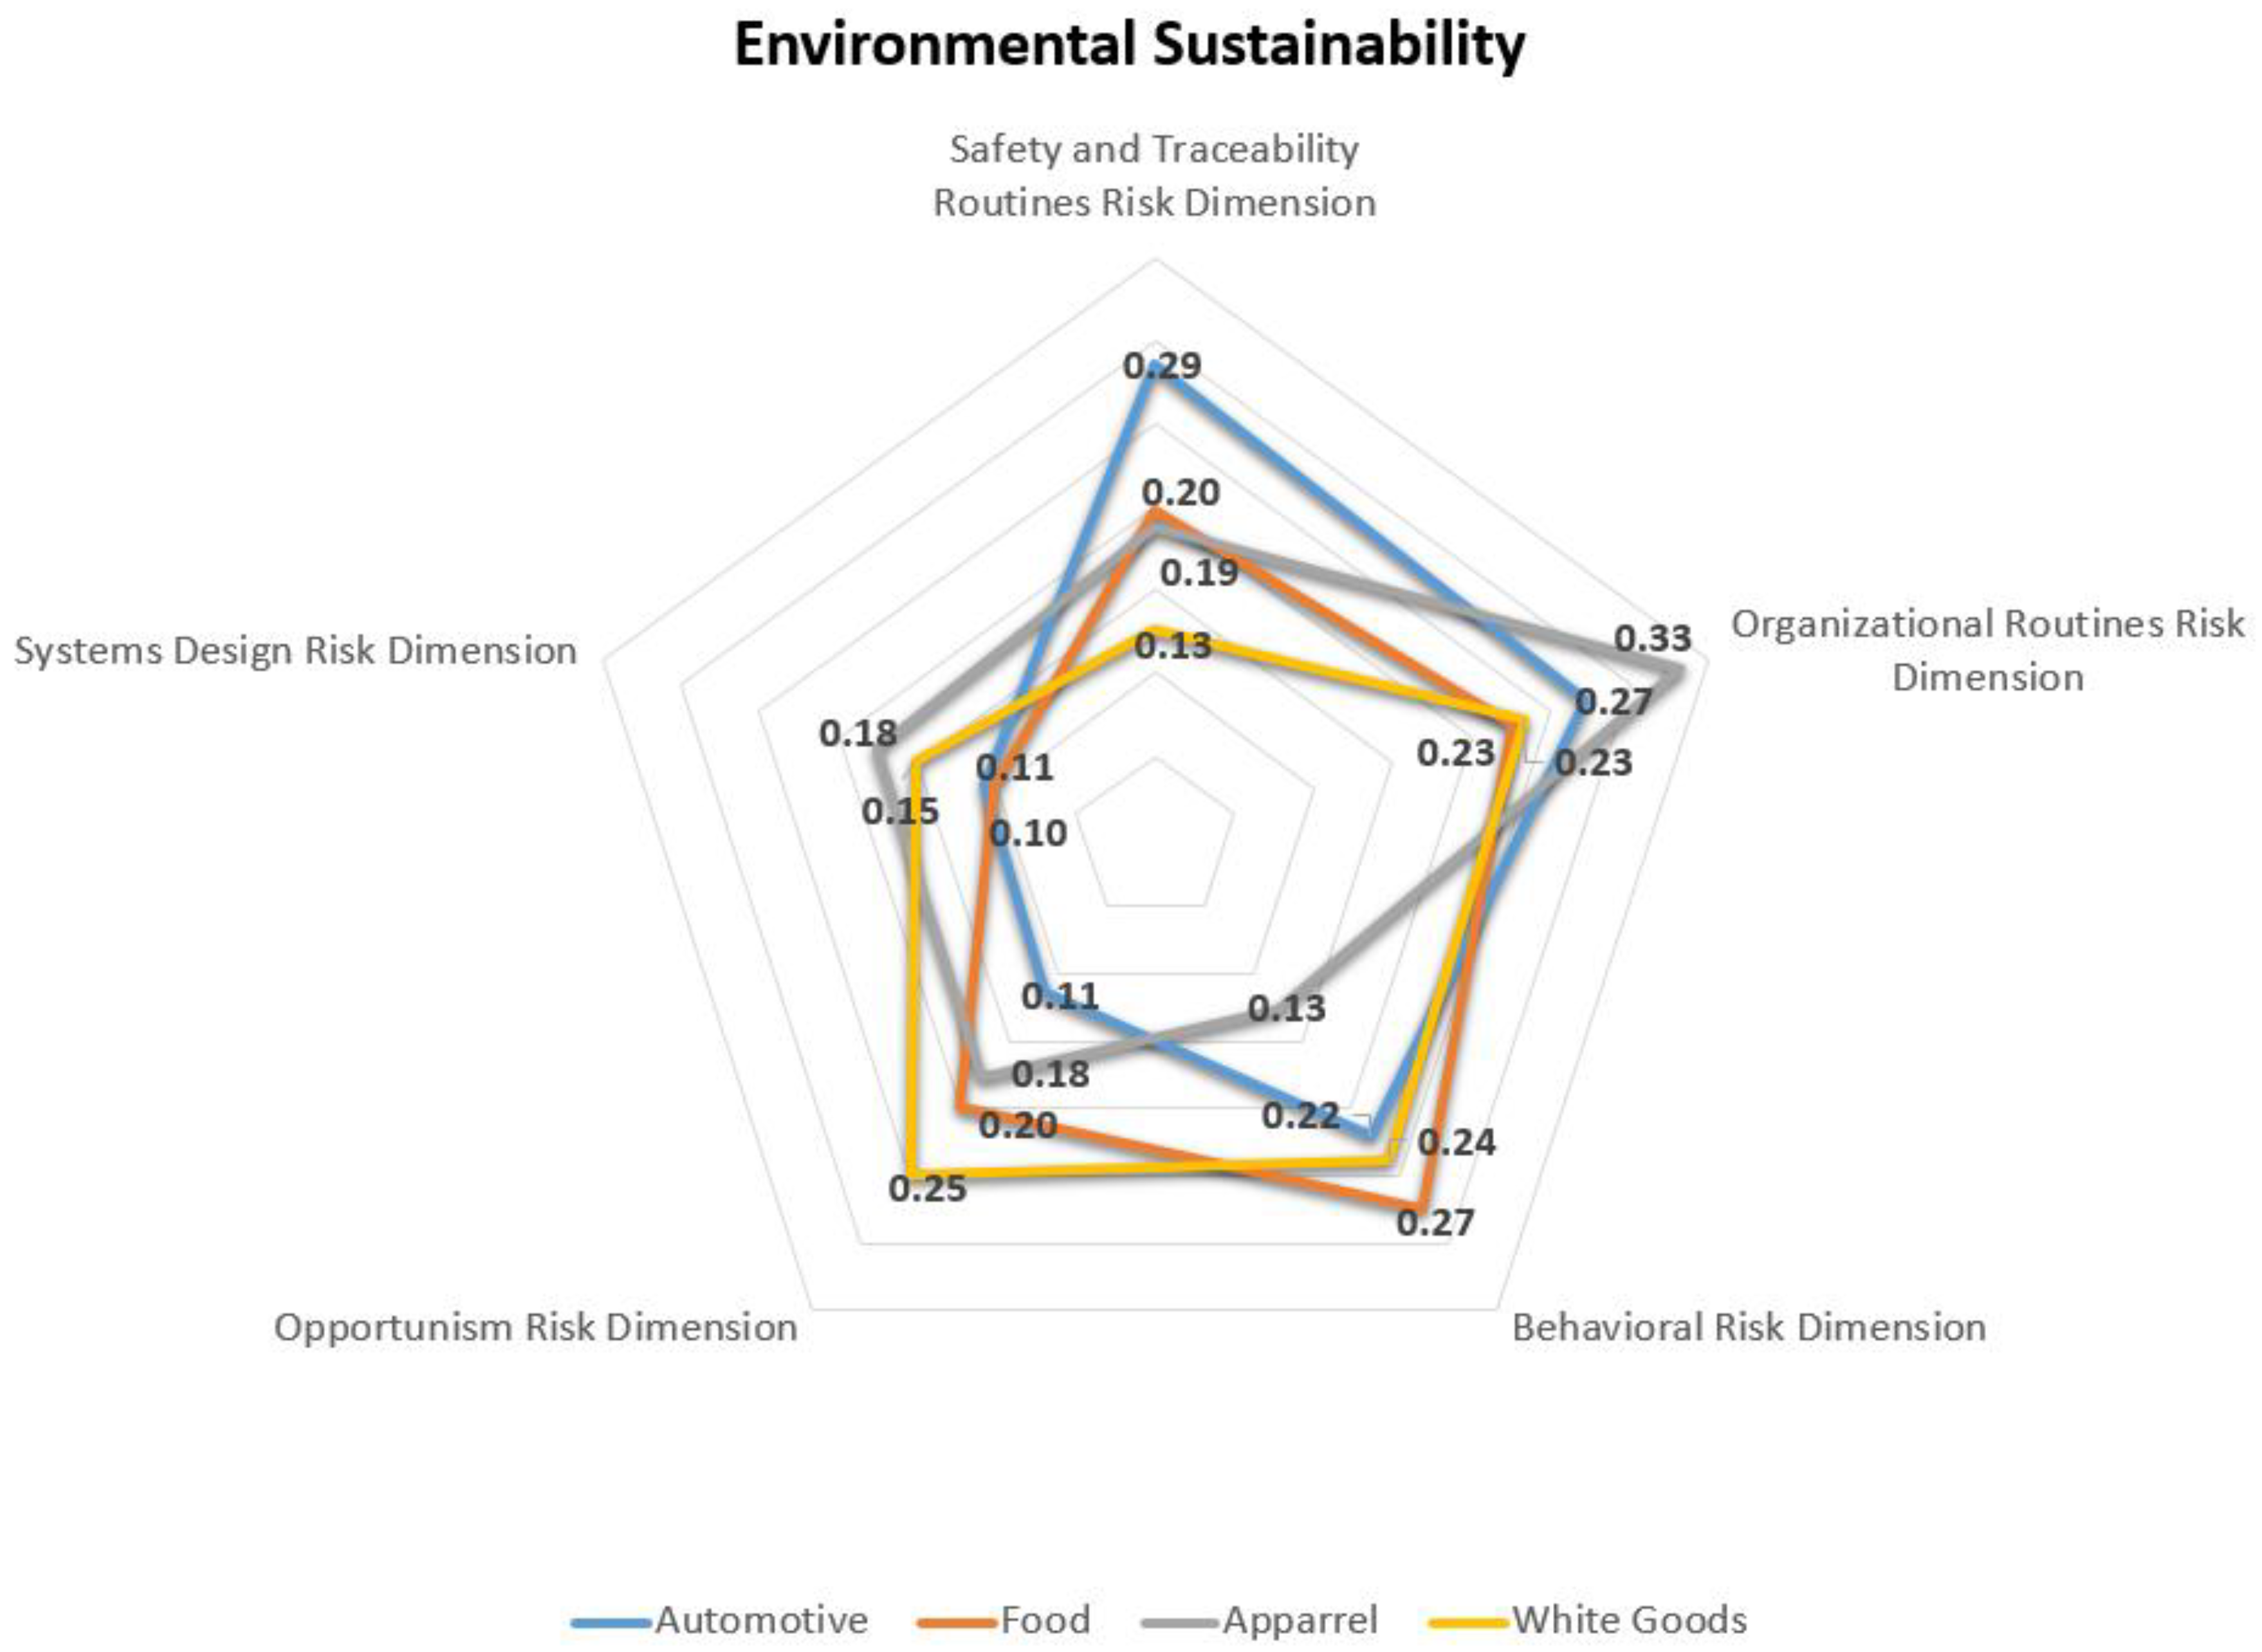
4.2. Cross-Industry Comparison
To accentuate the similarities and differences among risk profiles across the four industries, we map their respective weights for the five sustainability-related risk dimensions in a radar chart (
Figure 7). Similarities are shown when points along a dimension for all industries are clustered close together. By contrast, differences are visible when the points are dispersed. Additionally,
Table 7 contains a summary of each industry’s characteristics. Together,
Figure 7 and
Table 7 reveal that industry effects are more relevant and stronger than institutional effects when it comes to understanding and mitigating the risks.
4.2.1. Differences in Risk Profiles across Industries
As clearly illustrated in
Figure 7, the safety and traceability, organizational, opportunism and behavioral risk dimensions exhibit substantive dispersion across the four focal industries. This finding empirically supports Giannakis and Papadopoulous’ [
10] warning that sustainability-induced risks may differ based on a firm’s operations and competitive environment. For instance, safety and traceability routines are heavily influenced by capital investments and the level of industry consolidation. Thus, the automotive industry, which is very capital intensive, is highly sensitive to safety and traceability risks.
The organizational risk dimension is primarily driven by the degree to which companies are dependent on foreign customers. As sustainability is a strategic undertaking [
18,
82], increased dependence on foreign customers—commonly from developed economies—results in a decision-making process that necessarily adheres to more stringent standards [
2]. Thus, managers from the apparel and auto industries indicated that their day-to-day operations must satisfy customer demands beyond simply cost and quality, which is also in agreement with the notion of endogenous risks [
10]. An inability to establish organizational routines that adhere to customer standards could result in substantial lost sales, particularly for the highly competitive apparel industry.
Similarly, as posited by Porter [
40] and supported by empirical research (e.g., [
47,
48]), intense competition coupled with relative independence from multinational buyers incentivize Turkish firms in the white goods industry to exploit customers through greenwashing [
83]. While the food industry reflects similar levels of competition and customer profile, the immediate and personal impact of unscrupulous acts (e.g., selling spoiled food) limits their exploitative practice, despite relatively low sustainability standards and verification processes.
Sensitivity to behavioral risks is primarily driven by costs and prevalence of misbehavior. The food industry possesses both. As intense competition lowers overall margins, workers in the food industry are especially incentivized to sell products with questionable quality in the name of sustainability but can be hazardous to consumer health and result in public outrage and possibly legal actions by the government [
84]. Although the white goods industry has similar levels of competition and prevalence of misbehavior, an abundance of suppliers selling homogenous products mutes costs associated with misbehavior with any single supplier [
11].
Finally, systems design risks demonstrate a smaller dispersion, largely because these risks are neglected across all four industries. In the automotive industry, a high level of process standardization, an institutional effect, reduces concern for systems design risks. Across the other three industries, managers indicate a lack of awareness of sustainability induces risks across systems design. This lack of awareness makes it difficult to accurately calculate resultant operating costs [
27]. Additionally, a lack of awareness also prevents firms from saliently identifying potential risks of supply chain disruption, which leads firms to further underestimate sustainability-related costs due to system design [
11].
4.2.2. Risk Tradeoffs and Commonalities
The discussion above of differences and similarities in the respective risk profiles across the four industries show that differences are primarily driven by industry idiosyncrasies. We observed that industries that emphasize safety and traceability routines for environmental sustainability tend to de-emphasize opportunism risk. We believe this tradeoff exists for both industry and institutional reasons. Industries primarily serving multinational buyers from developed economies (automotive and apparel) commonly abide by clearly defined sustainability objectives as a part of their safety and traceability and organizational routines, which increases costs associated with violation in either dimension. Institutionally, Turkish laws and regulations as well as cultural customs concerning food handling and safety [
84] also encourage food industry to be mindful of safety and traceability routines. However, regulatory frameworks in emerging economies are often lax as compared to their counterparts in developed economies [
85]. As a result, industries primarily serving domestic consumers (white goods and food) are particularly sensitive to risks associated with acts of opportunism and a lack of ethics. Finally, as shown by the damaging diesel emissions scandal [
9], an industry’s emphasis on safety and traceability routines for improving sustainability does not mean that it is free of opportunism risk, and vice versa.
A second set of distinct tradeoffs occurs between organizational routines risk and behavioral risk, as exemplified by the apparel industry. For the apparel industry, environmental sustainability has mostly to do with handling hazardous materials (e.g., chemical dyes). Because this process adds little value to the end product, having the proper organizational routines becomes vital for ensuring its success by implementing proper controls and administrative tools designed to meet regulatory requirements and manage contingencies. However, a focus on organizational routines presents a tradeoff to firms in our study in terms of their attention to behavioral risks. While social sustainability is outside of the scope of this study, this tradeoff also offers a possible explanation for the apparel industry’s continued struggles with labor.
Finally, whereas all industries in our study are aware of the need for a well-established organizational routine for improving environmental sustainability, their collective negligence of system design risk illustrate the isomorphic influence of institutional forces [
52,
53]. Inadequate regulatory framework coupled with export-oriented industries task domestic firms with implementing sustainability processes within their organizations and adjusting them as necessary to serve their international customers. Without sufficient domestic regulation, these firms across all industries have little incentive to develop and implement their own system designs for sustainability and instead follow prescriptions made by their international partners. While advantageous to unsophisticated firms, this also hinders them from developing sustainability-oriented competitive positions and shift from adopting environmental sustainability reactively to proactively, as institutional pressures apply common pressure to firms across all industries to minimize risks of violating core norms, rules, values, and beliefs [
57,
58].
To summarize, whereas competitive intensity, capital intensity, and labor intensity induce tradeoffs among safety and traceability routines, opportunism, and behavioral risks, institutional forces guide the organizational routines and system design risks.
5. Conclusions and Implications
Sustainability has increased in visibility, and arguably in strategic importance, over the past decade. Yet, companies struggle to cost justify investments in sustainability, especially once the low-hanging fruit has been harvested [
2]. Adding to the challenge is the realization that the sustainability–risk interaction may be more nuanced than previously perceived. Specifically, sustainability has long been viewed as strategic response to reputational risk. Recent anecdotal evidence; however, suggests that sustainability may actually induce new risk, increasing the long-term costs of sustainability programs.
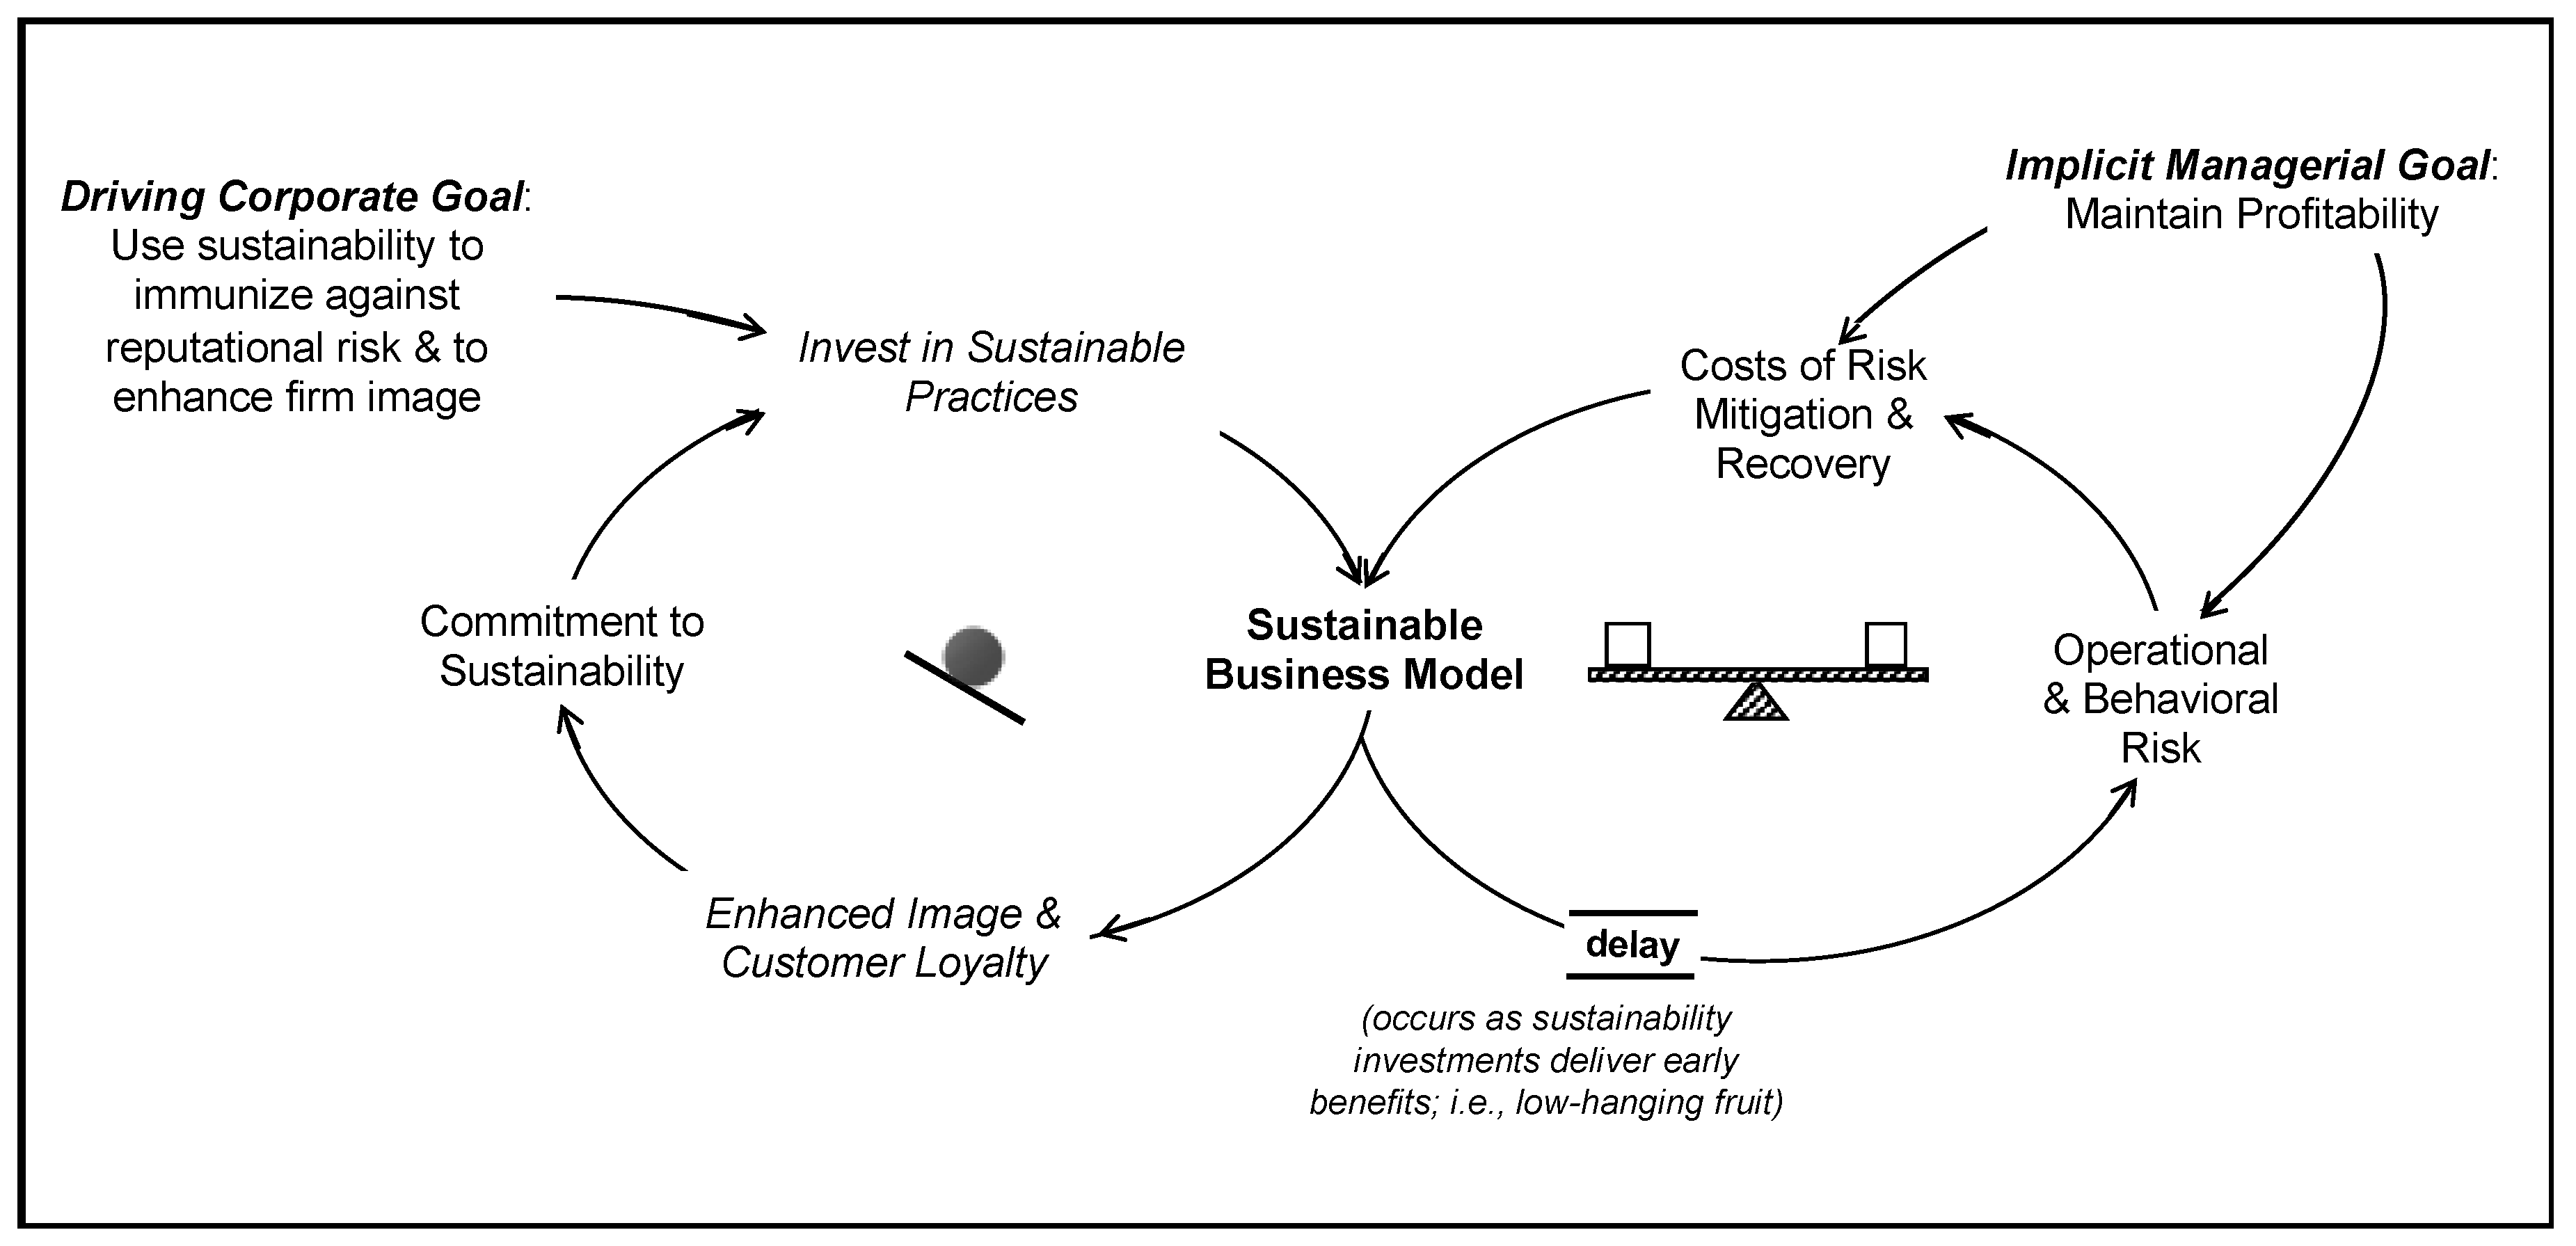
Our research empirically validated this more nuanced view of the sustainability–risk interaction. Specifically, our research documented a contingent sustainability–risk–cost relationship, suggesting that the sustainability–risk relationship possesses the characteristics and behavior of a limits-to-growth systems archetype [
86]. As companies invest in more complex and holistic sustainability initiatives, new behavioral and operational risks emerge (see
Figure 8). These risks increase mitigation costs and/or risk exposure, in addition to the costs incurred to bring operations back on line after a disruption incident occurs (e.g., Chipotle’s food safety incidents). This contingent relationship, with its attendant costs, acts as a balancing mechanism, undermining the growth of sustainability as a strategic imperative.
The framework depicted in
Figure 8 introduces a critical question that academics and practitioners must begin to take more seriously, “What is the true cost of corporate social responsibility?” To the extent that sustainability behaves as a limits-to-growth system, the key to future growth is not to push sustainability more aggressively, but rather to understand and mitigate the limiting forces. To this end, we delineate the sustainability–risk–cost relationship, informing how and why sustainability-induced risk profiles vary across industries.
Indeed, managers confirmed that sustainability initiatives cause or exacerbate a diverse set of risks, increasing the cost of operating sustainably. This reality makes it more difficult to cost-justify sustainability initiatives. We document distinct risk profiles for four industries in Turkey—a vibrant emerging economy. These four industries—apparel, automotive, food, and household appliances—are targets for foreign direct investment in emerging economies. The identification of distinct risk profiles provides a starting point for decision-makers to understand the nature of risks their companies are likely to encounter. Decision-makers can then do a better job of designing proactive risk-mitigation programs, reducing the long-term costs of implementing sustainability programs. More targeted and appropriate risk mitigation diminishes critical limiting forces, improving sustainability’s economic viability and providing impetus to the reinforcing loop.
By demonstrating the need for industry-specific risk mitigation strategies, we respond to Giannakis and Papadopoulos’ [
10] call for research on the nature of risk mitigation at the industry level. Ultimately, companies should seek to transfer best practices within an industry rather than across industries. Particularly with respect to an emerging economy such as Turkey, a significant source of influence comes from an industry’s common international partners. As illustrated by the automotive industry, suppliers with longstanding relationships tend to adopt best practices in order to both promote greater supply chain integration and adhere to international regulations. However, these best practices do not extend beyond the automobile industry as firms in the food and apparel industries focus on different elements of sustainability (e.g., handling chemical dyes), and thus require different risk-mitigation investments. Idiosyncratic sustainability–risk strategies are needed.
However, institutional factors clearly apply isomorphic influence to all industries in our study. For instance, an overall lack of emphasis on system design illustrates the combination of inadequate regulatory framework and generally export-dependent industries. An overall lack of awareness among both consumers and workers resulted in both apparel and food industries adopting environmental sustainability focused on waste handling. Furthermore, cultural values placed on performance-related sustainability measures (e.g., energy efficiency) drive sustainability awareness at the firm level. For instance, both automotive and white goods industry firms reported that they believe it is important to satisfy consumer demand for improved operating efficiency of their products.
Although both industry-level idiosyncrasies and economy-level institutional forces guide an industry’s sustainability–risk interaction, the result is often that firms across all industries lack a holistic view on sustainability. Consequentially, blind spots are developed for specific risk elements not deemed important by managers, thereby increasing the possibility of potential disruption. These risk-induced costs threaten the long-term viability of sustainability programs. Managers should therefore conduct a sustainability-induced risk assessment program explicitly recognizing both institutional and industry factors.
Lastly, the results from this study further illustrate potential pitfalls for multinational corporations. Often, these firms are accustomed to operating in an institutional environment with clear regulatory guidelines that apply isomorphic influence to maintain a certain level of uniform standard regarding sustainability. As our study shows, risk profiles among various industries are largely driven by both their view and awareness of sustainability’s necessity as well as a general lack of institutional guidelines. Those multinational firms in our study that successfully work with local suppliers, issue clear guidelines and hold suppliers accountable via various transparency and intervention measures. These investments help overcome inadequacy of regulations. Thus, our study highlights the importance of diffusing environmental sustainability standards across national borders.
Further Research
This study has some limitations, which offer further research opportunities in the area. First and foremost, the area of research, which integrates sustainability and risk specifically across different industrial settings, still needs to be explored deeply. A further examination of industries in different country settings would provide a rich discussion to compare the characteristics across industries as well as across different country settings. More importantly, the focus on environmental pillar of sustainability can be extended towards social and economic pillars to outline whether the tenets of industry structural view, risk aversion or institutional theory are found in the risk profiles and tradeoffs addressing social and economic dimensions. Furthermore, this area can be explored by different methodologies, like observing secondary data analytics or conducting in-depth interviews, which may allow for a deeper understanding on industrial and institutional risk profiles and tradeoffs under different settings.


