Life Cycle Costs Analysis of Reclaimed Asphalt Pavement (RAP) Under Future Climate


 , , ,
, , , 


Abstract
1. Introduction
2. Methodology
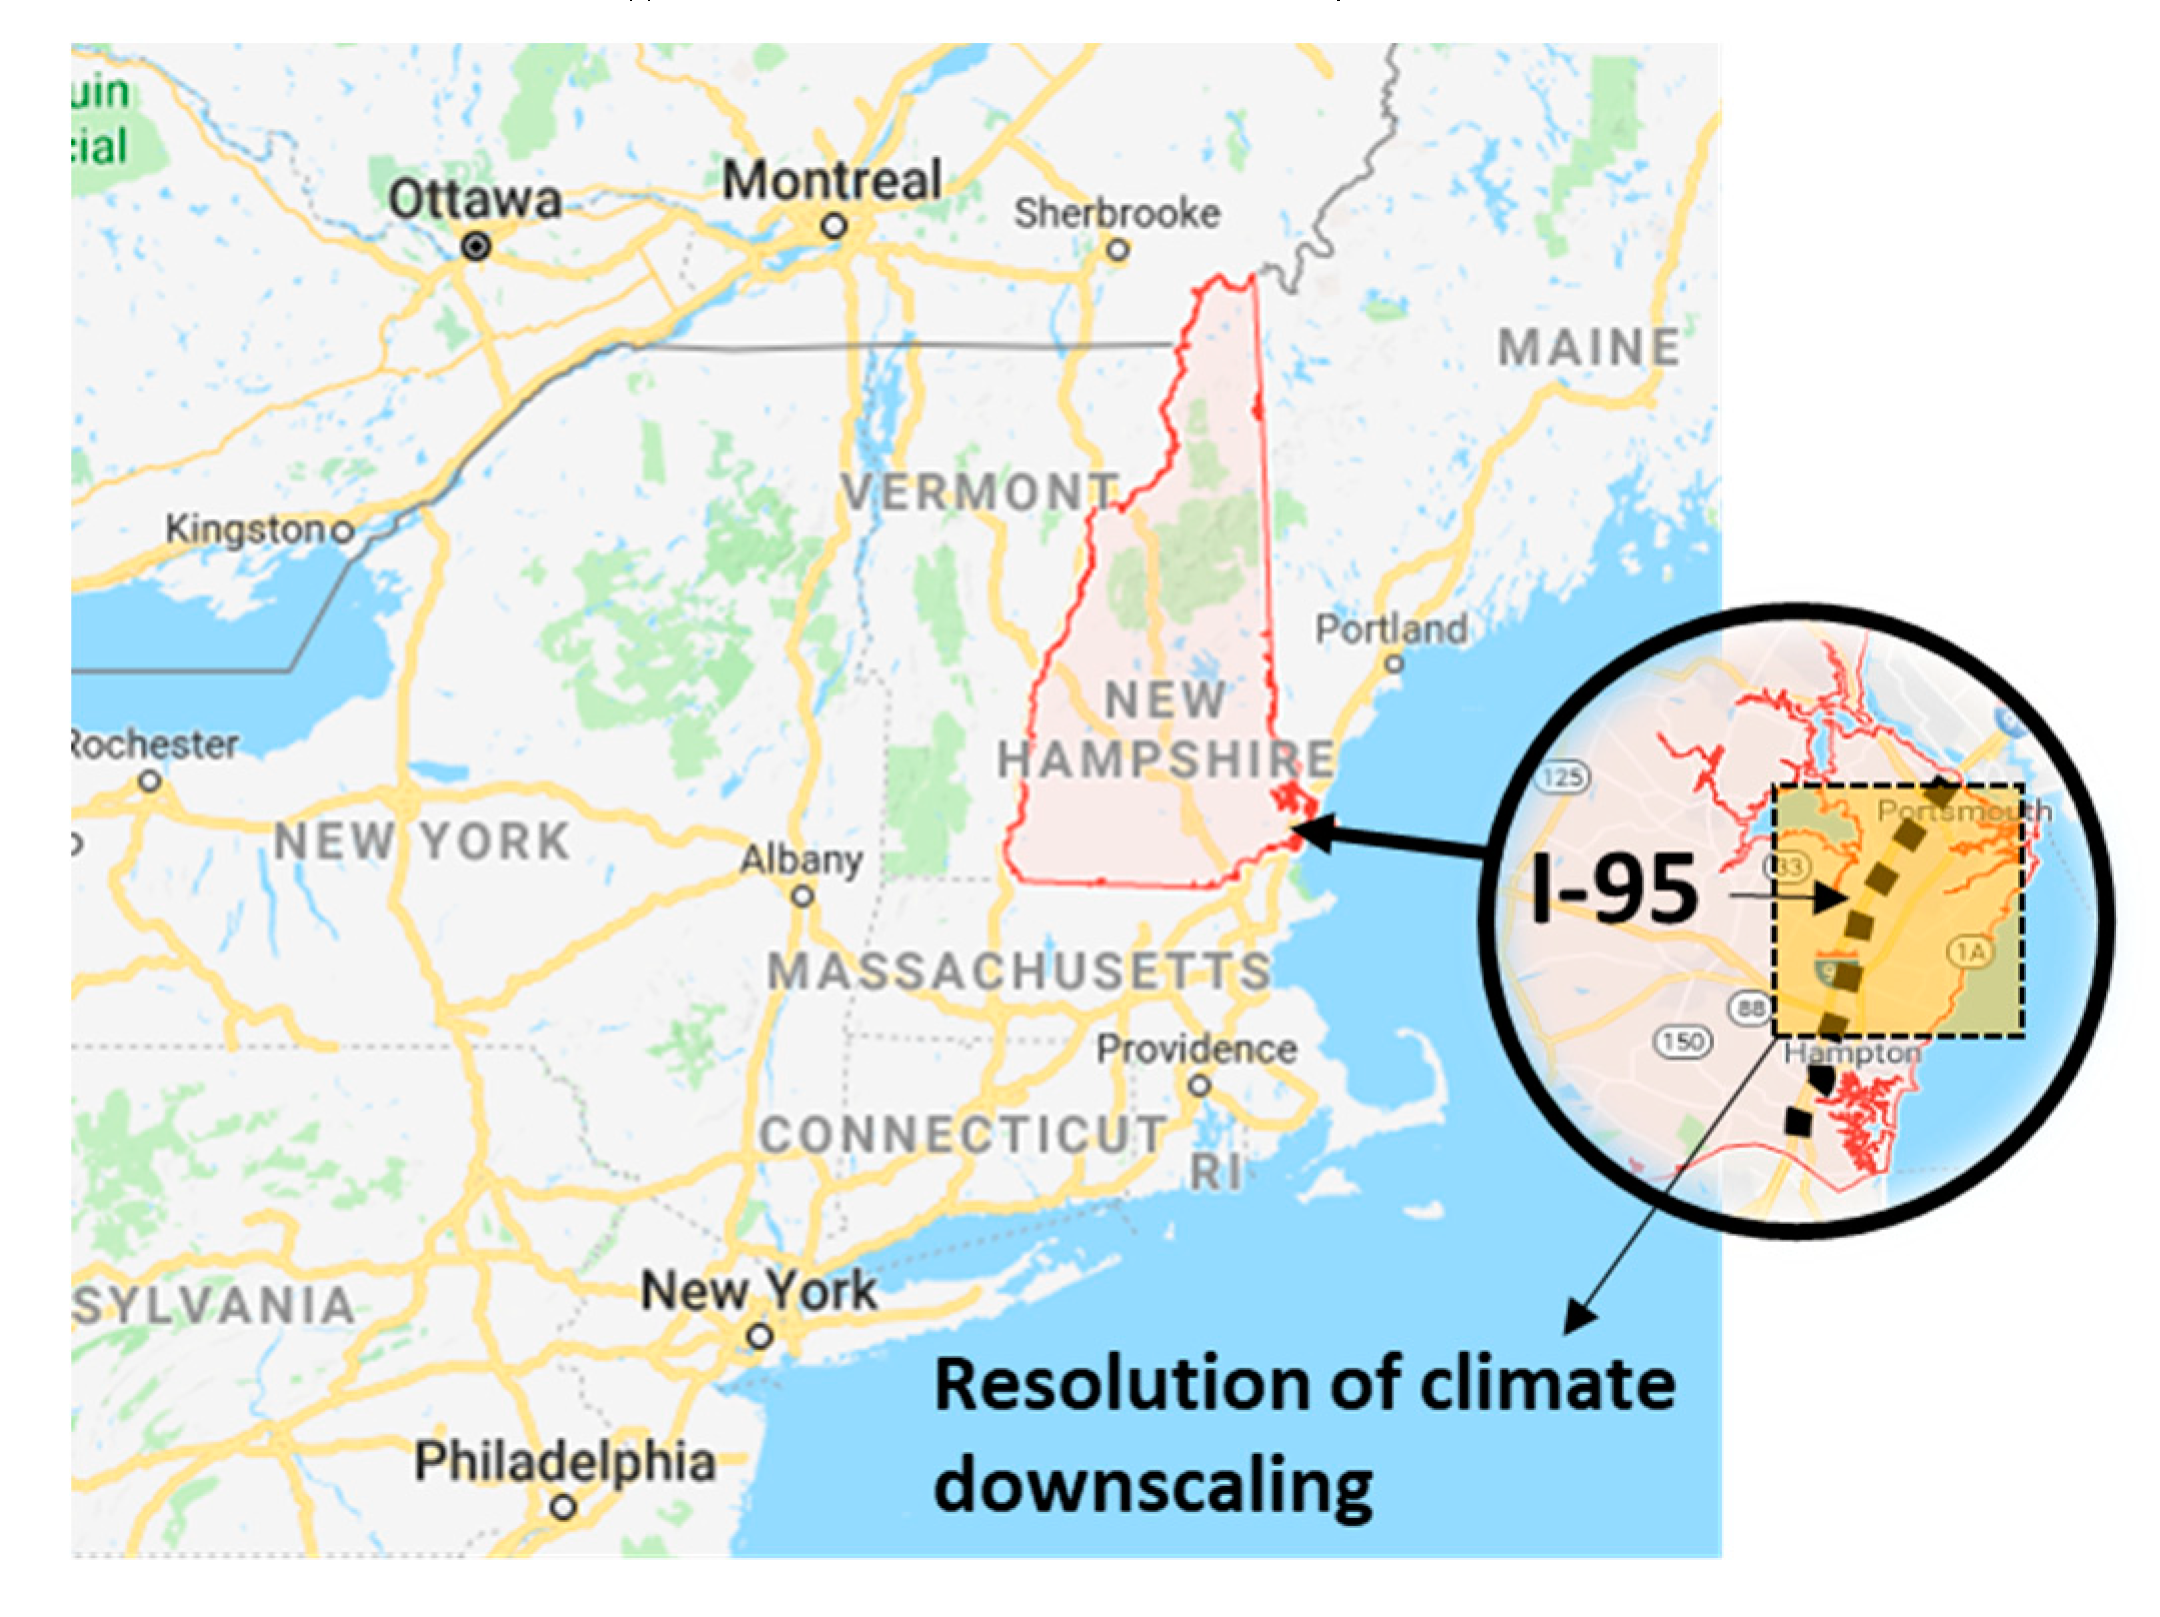
2.1. Case Study
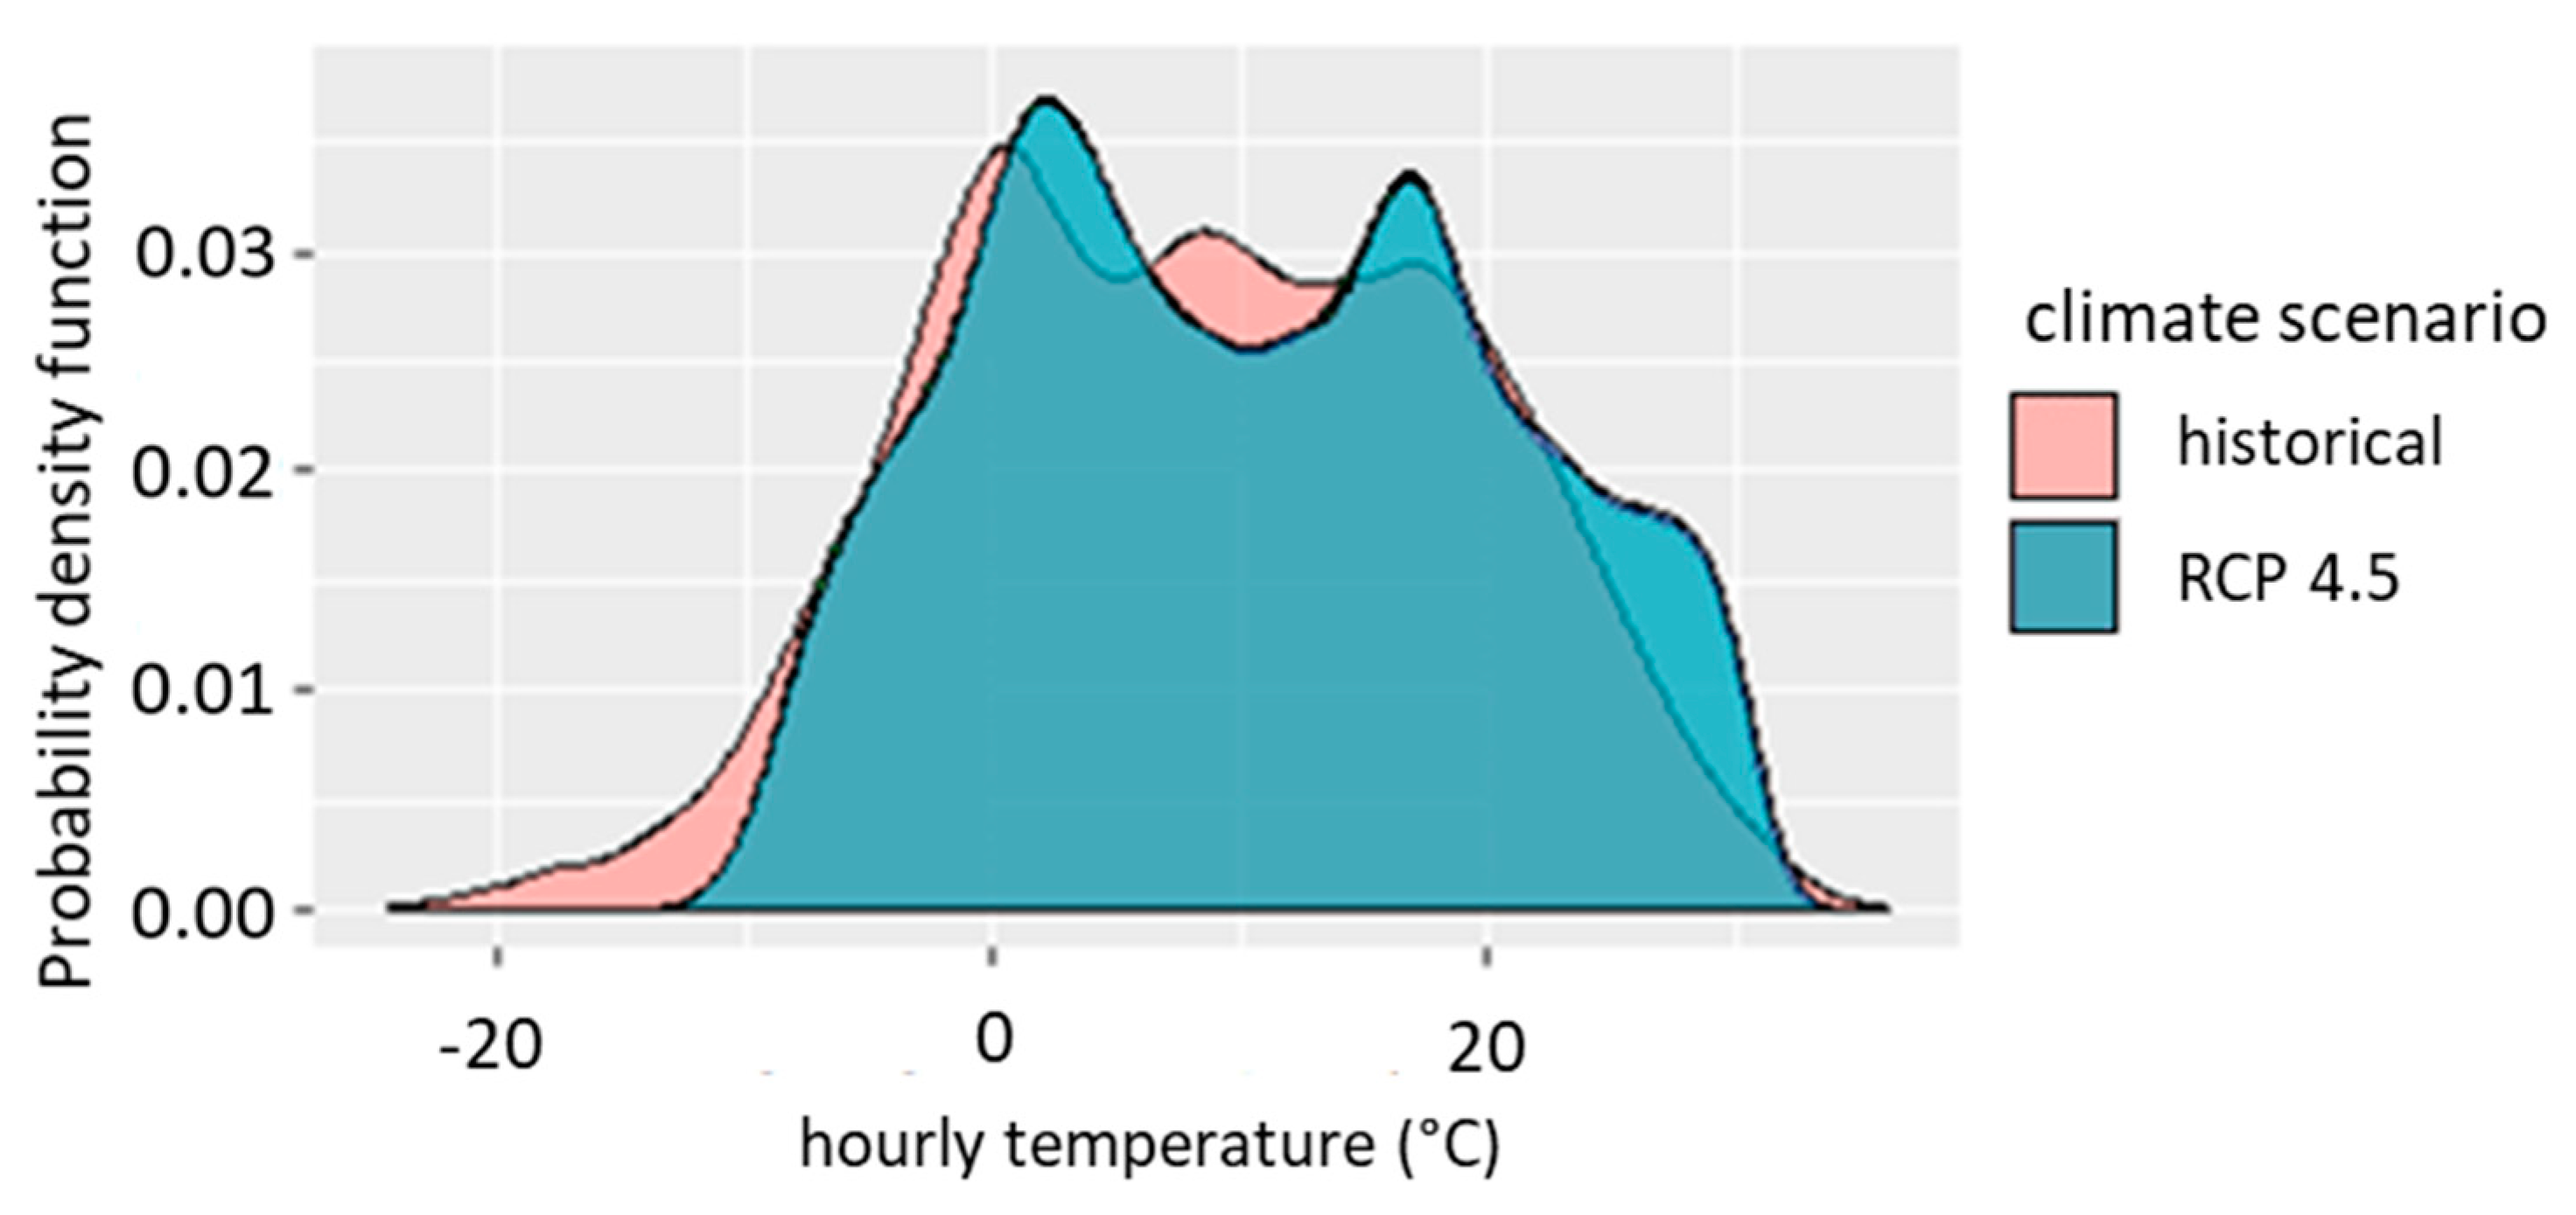
2.2. Future Climate Data
2.3. Life Cycle Performance
2.4. Life Cycle Cost Analysis
- = net present value,
- = the cash flow of phase n in year t (i includes Phase a–f as described above),
- = discount rate (2%),
- = year.
3. Results and Discussion
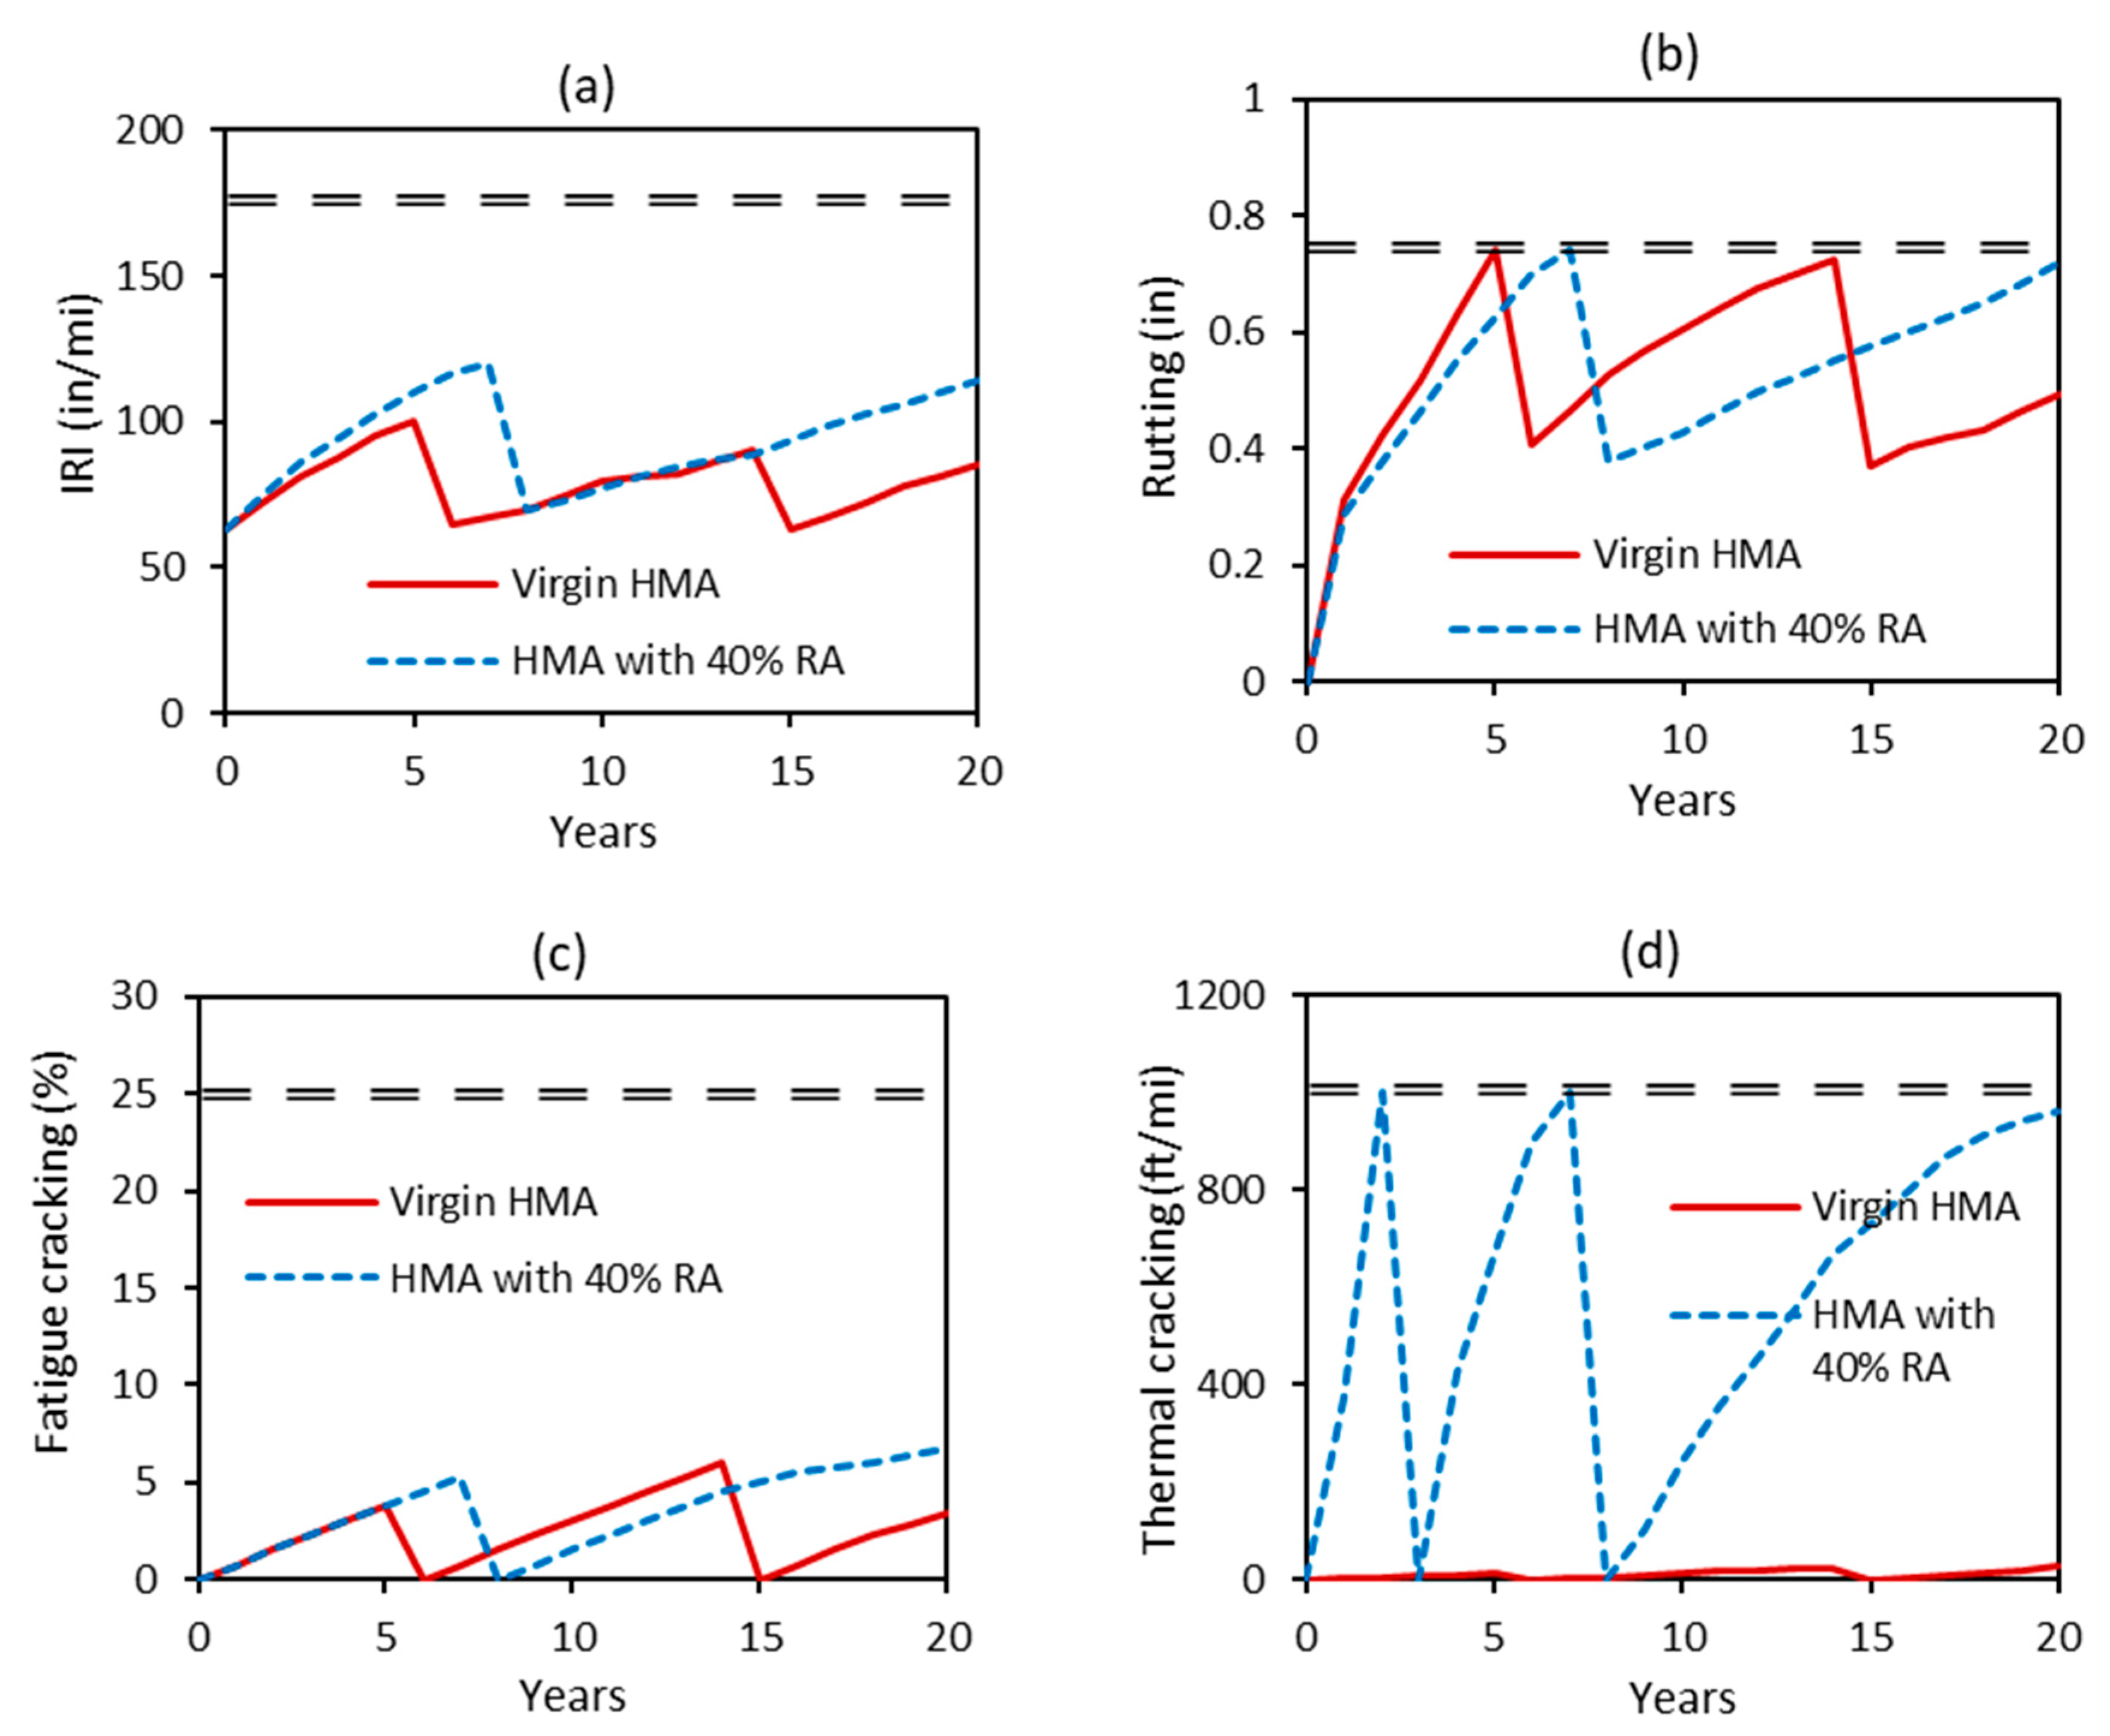
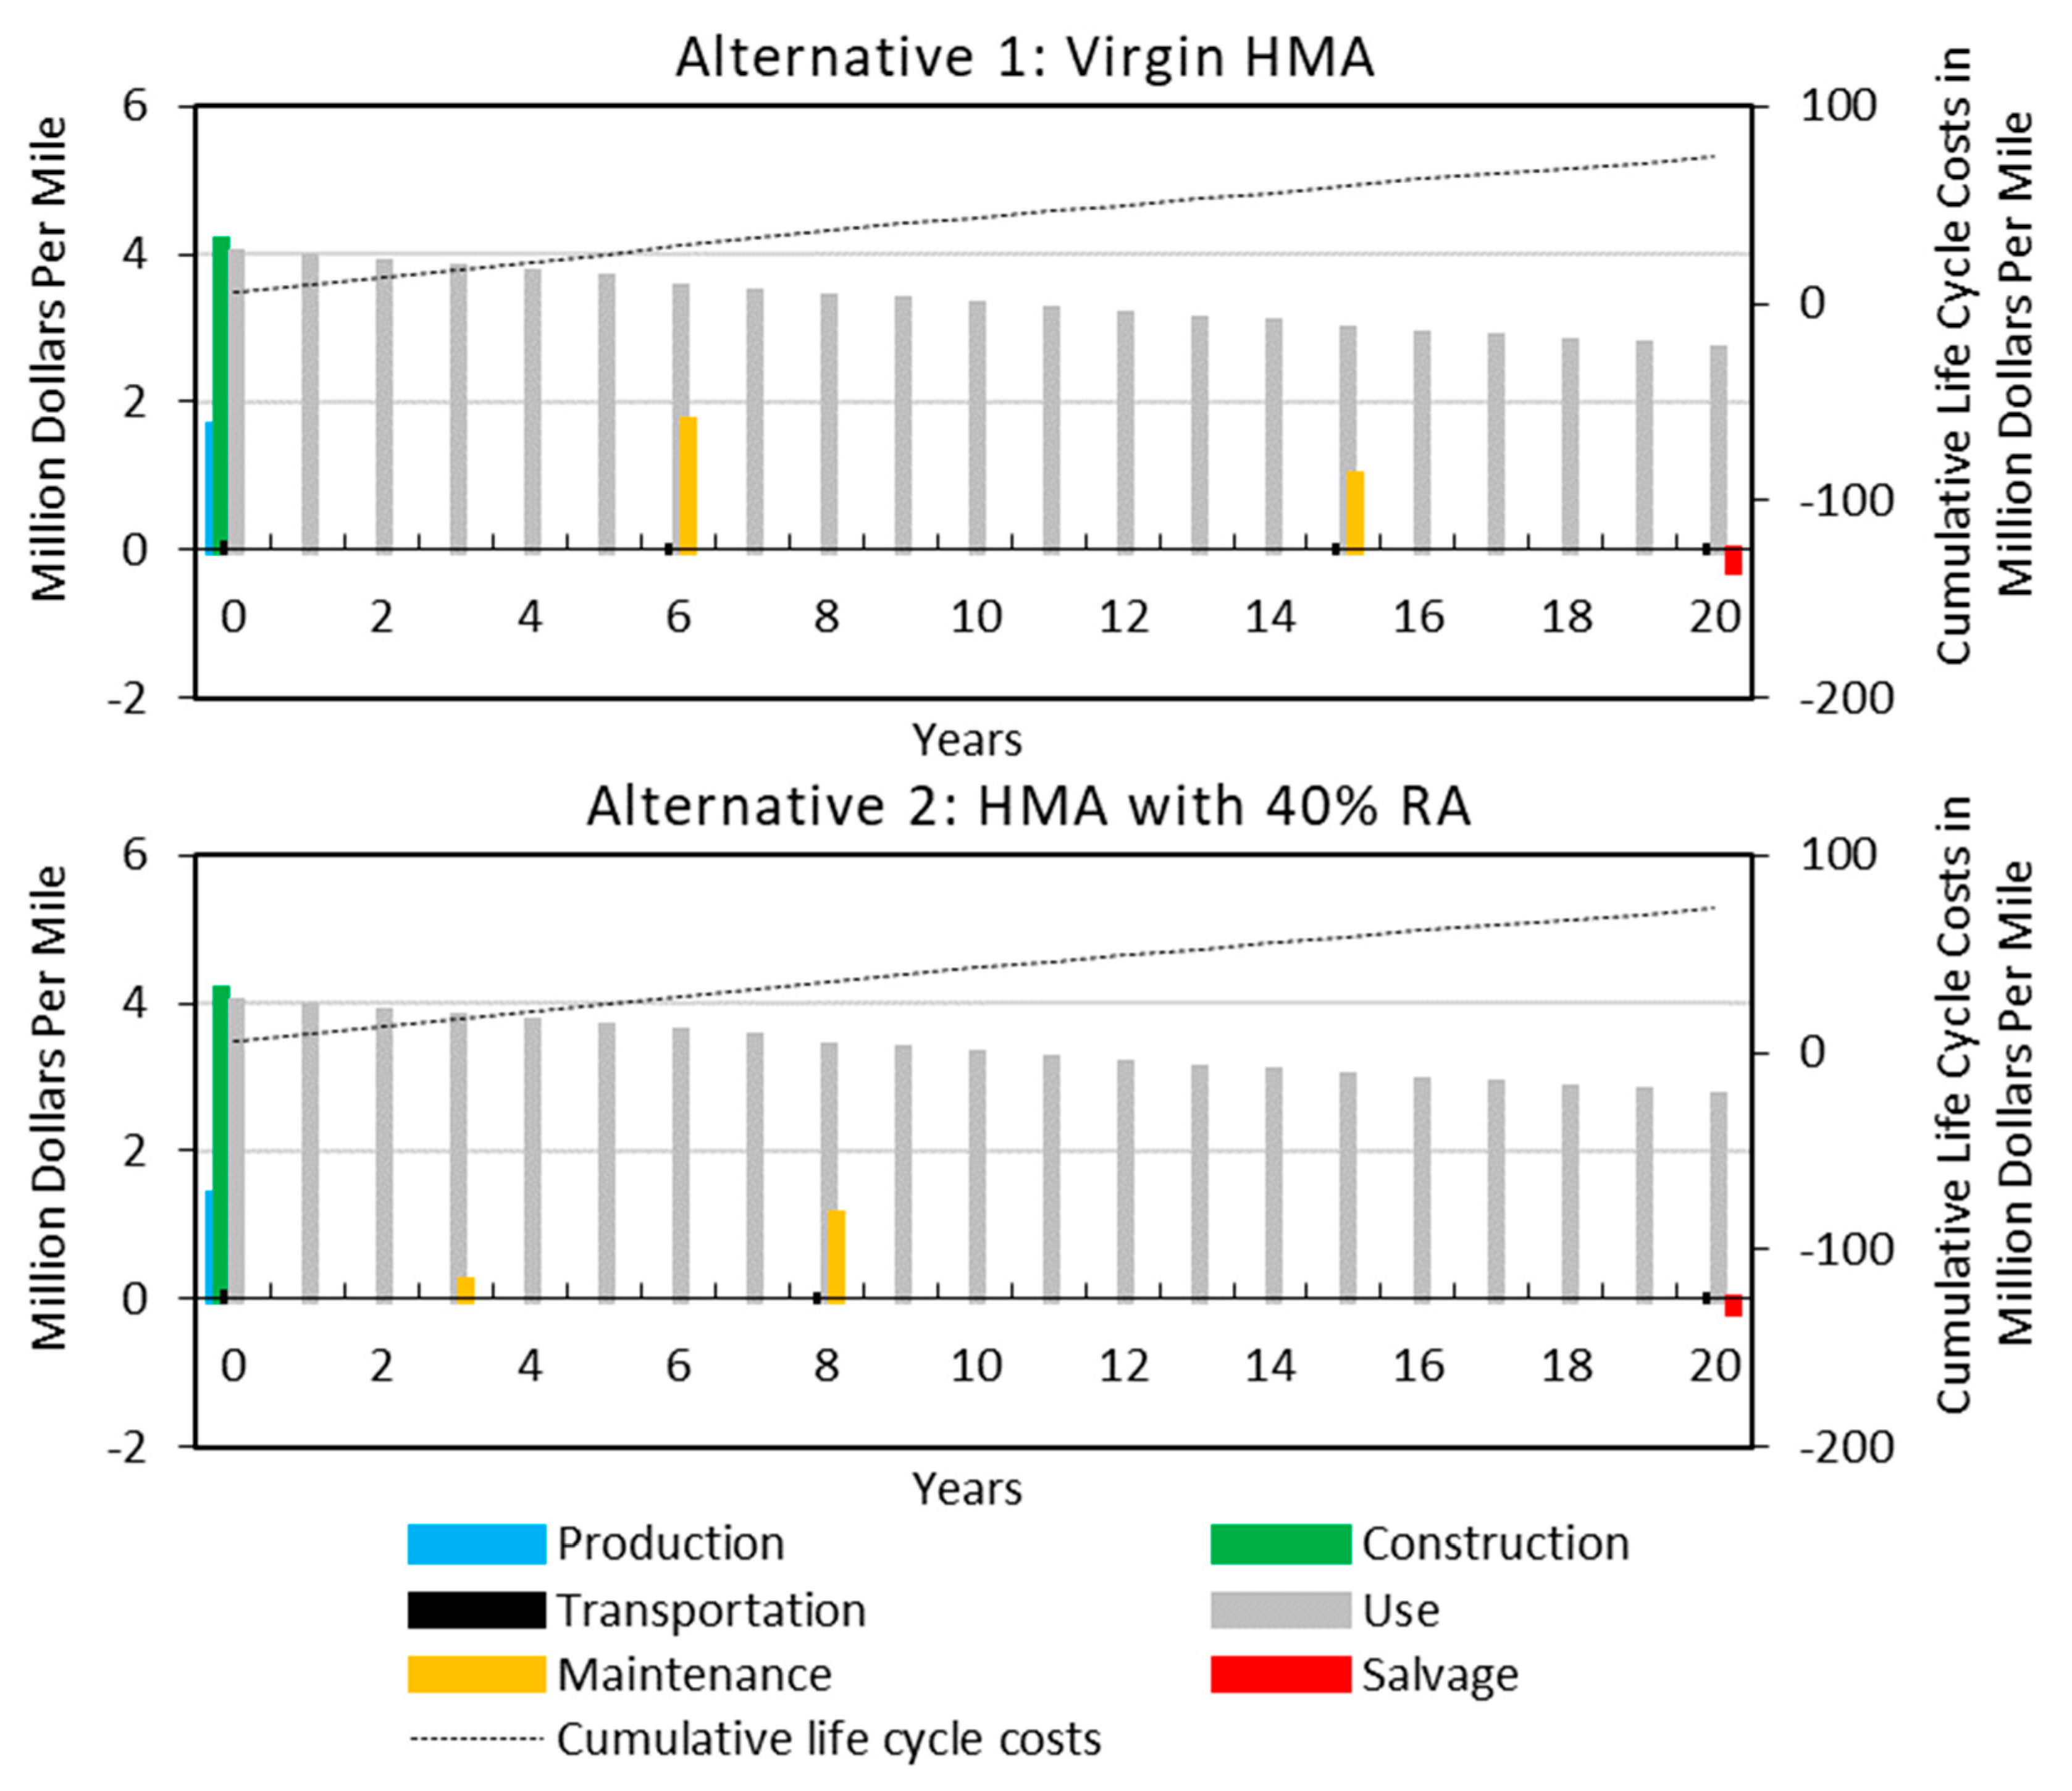
3.1. Results for the Standard Strength Structure
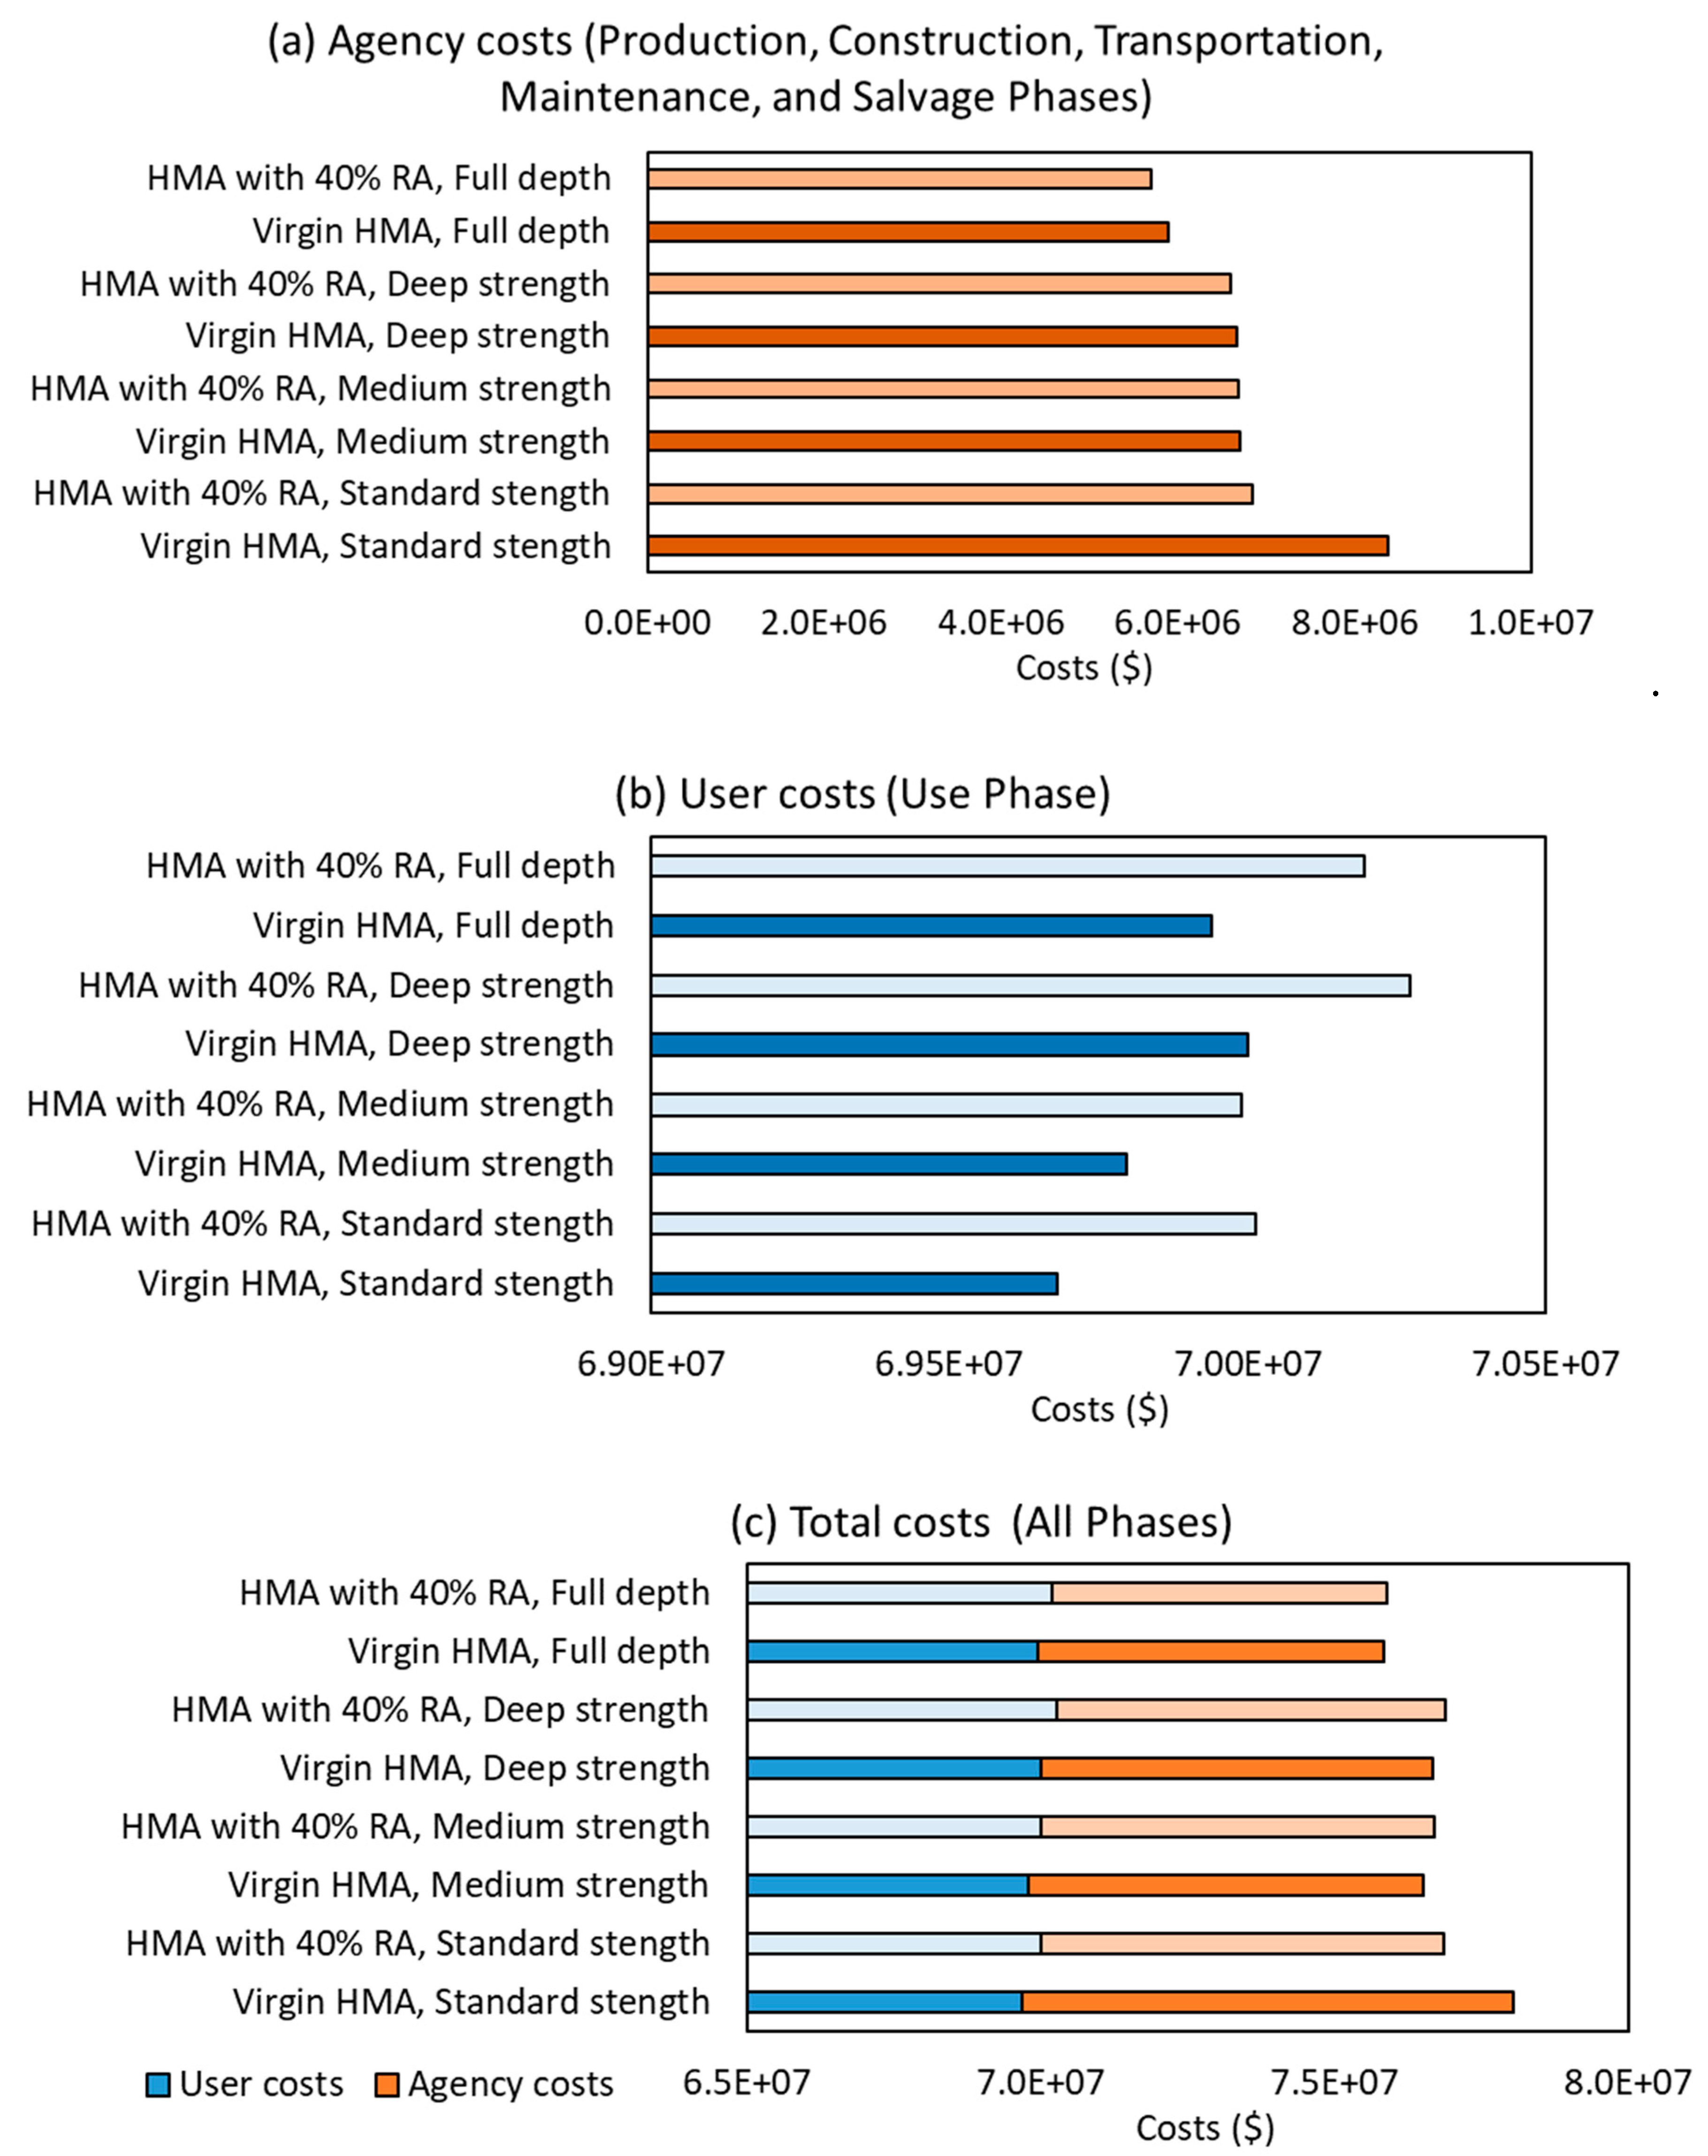
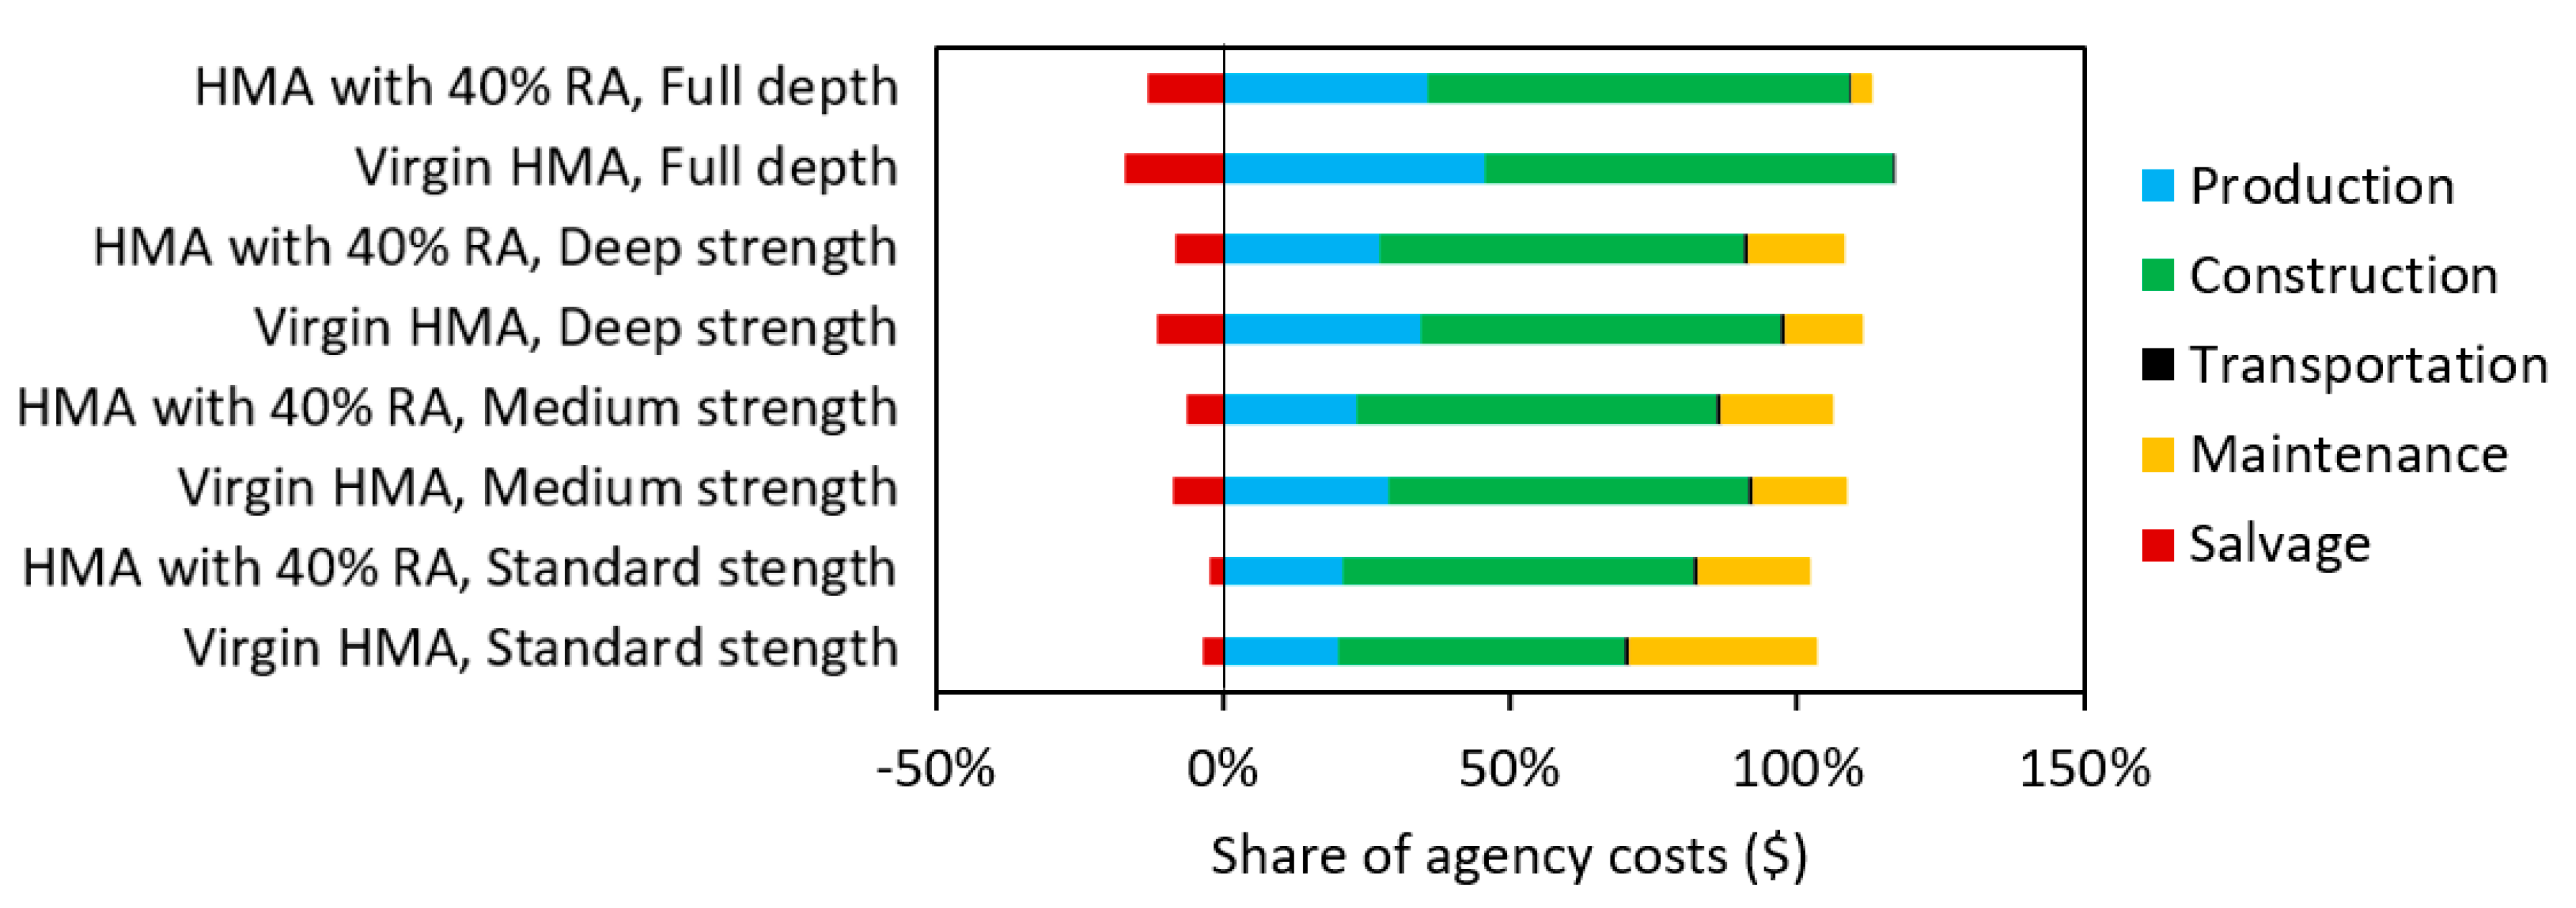
3.2. Results of All Structures
4. Conclusions and Recommendations
- For road agencies, using 40% RA can remain a more economic practice than using 100% virgin HMA for I-95 in New Hampshire under 2020–2040 climates.
- User costs, not including work zone delay costs, in terms of fuel consumption may increase or decrease on pavements with 40% RA compared with pavements with virgin hot mix asphalt, however, the increase/decrease was found to be insignificant.
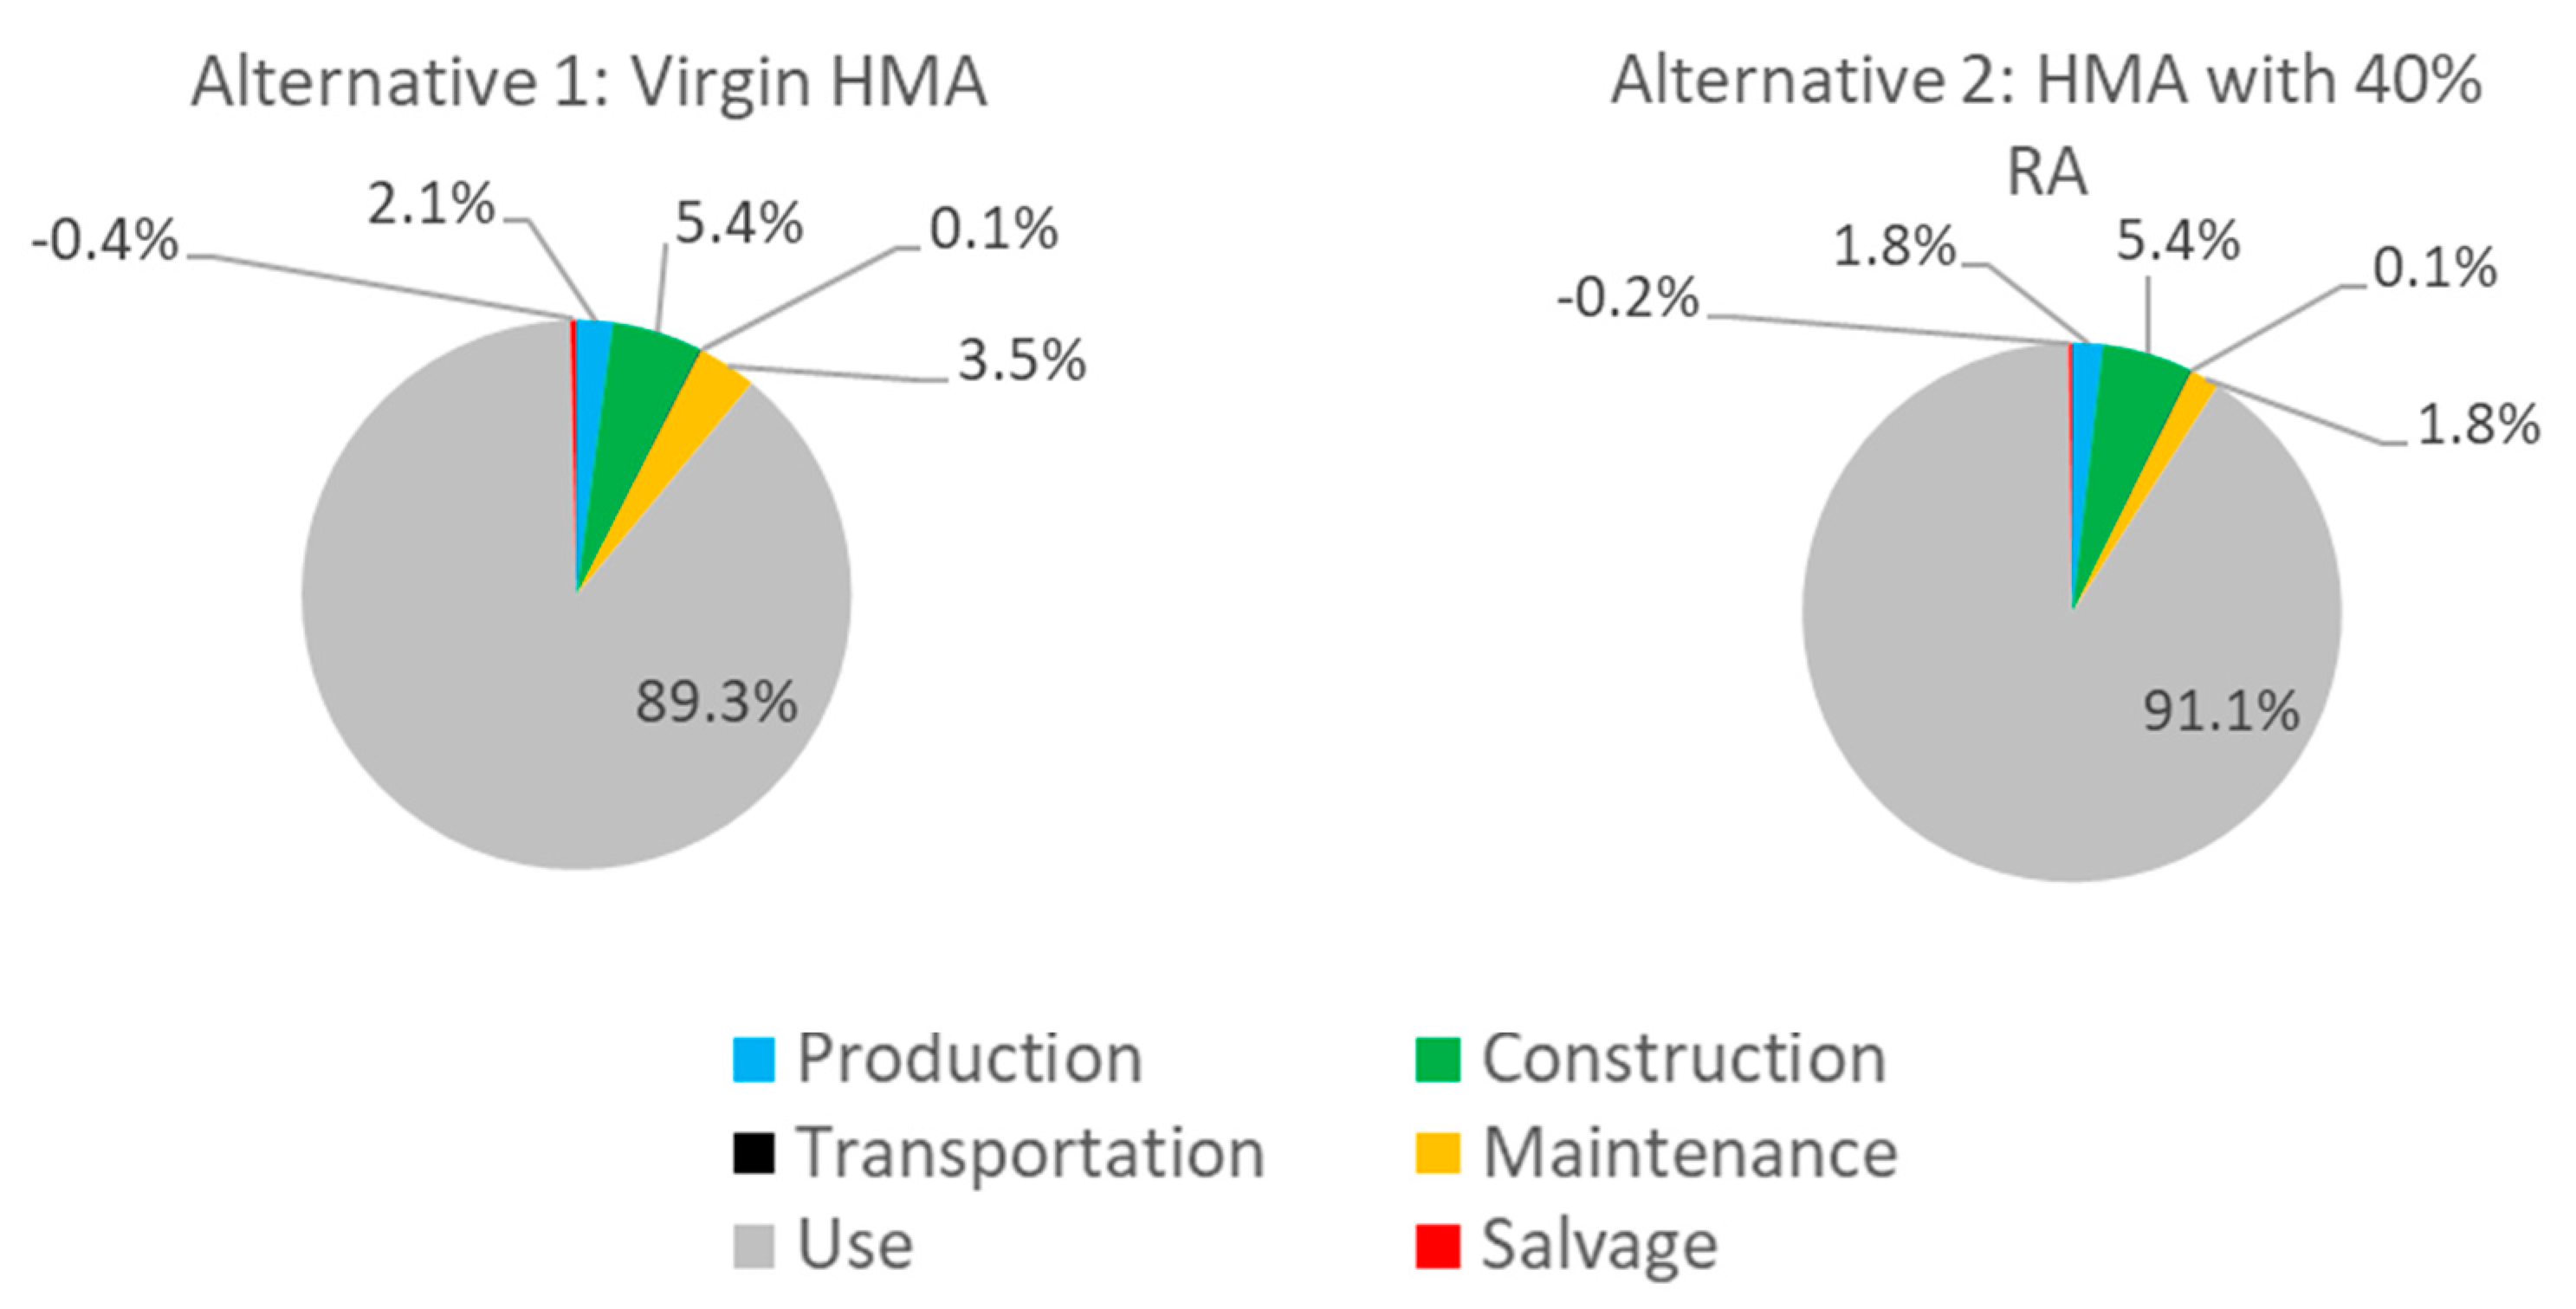
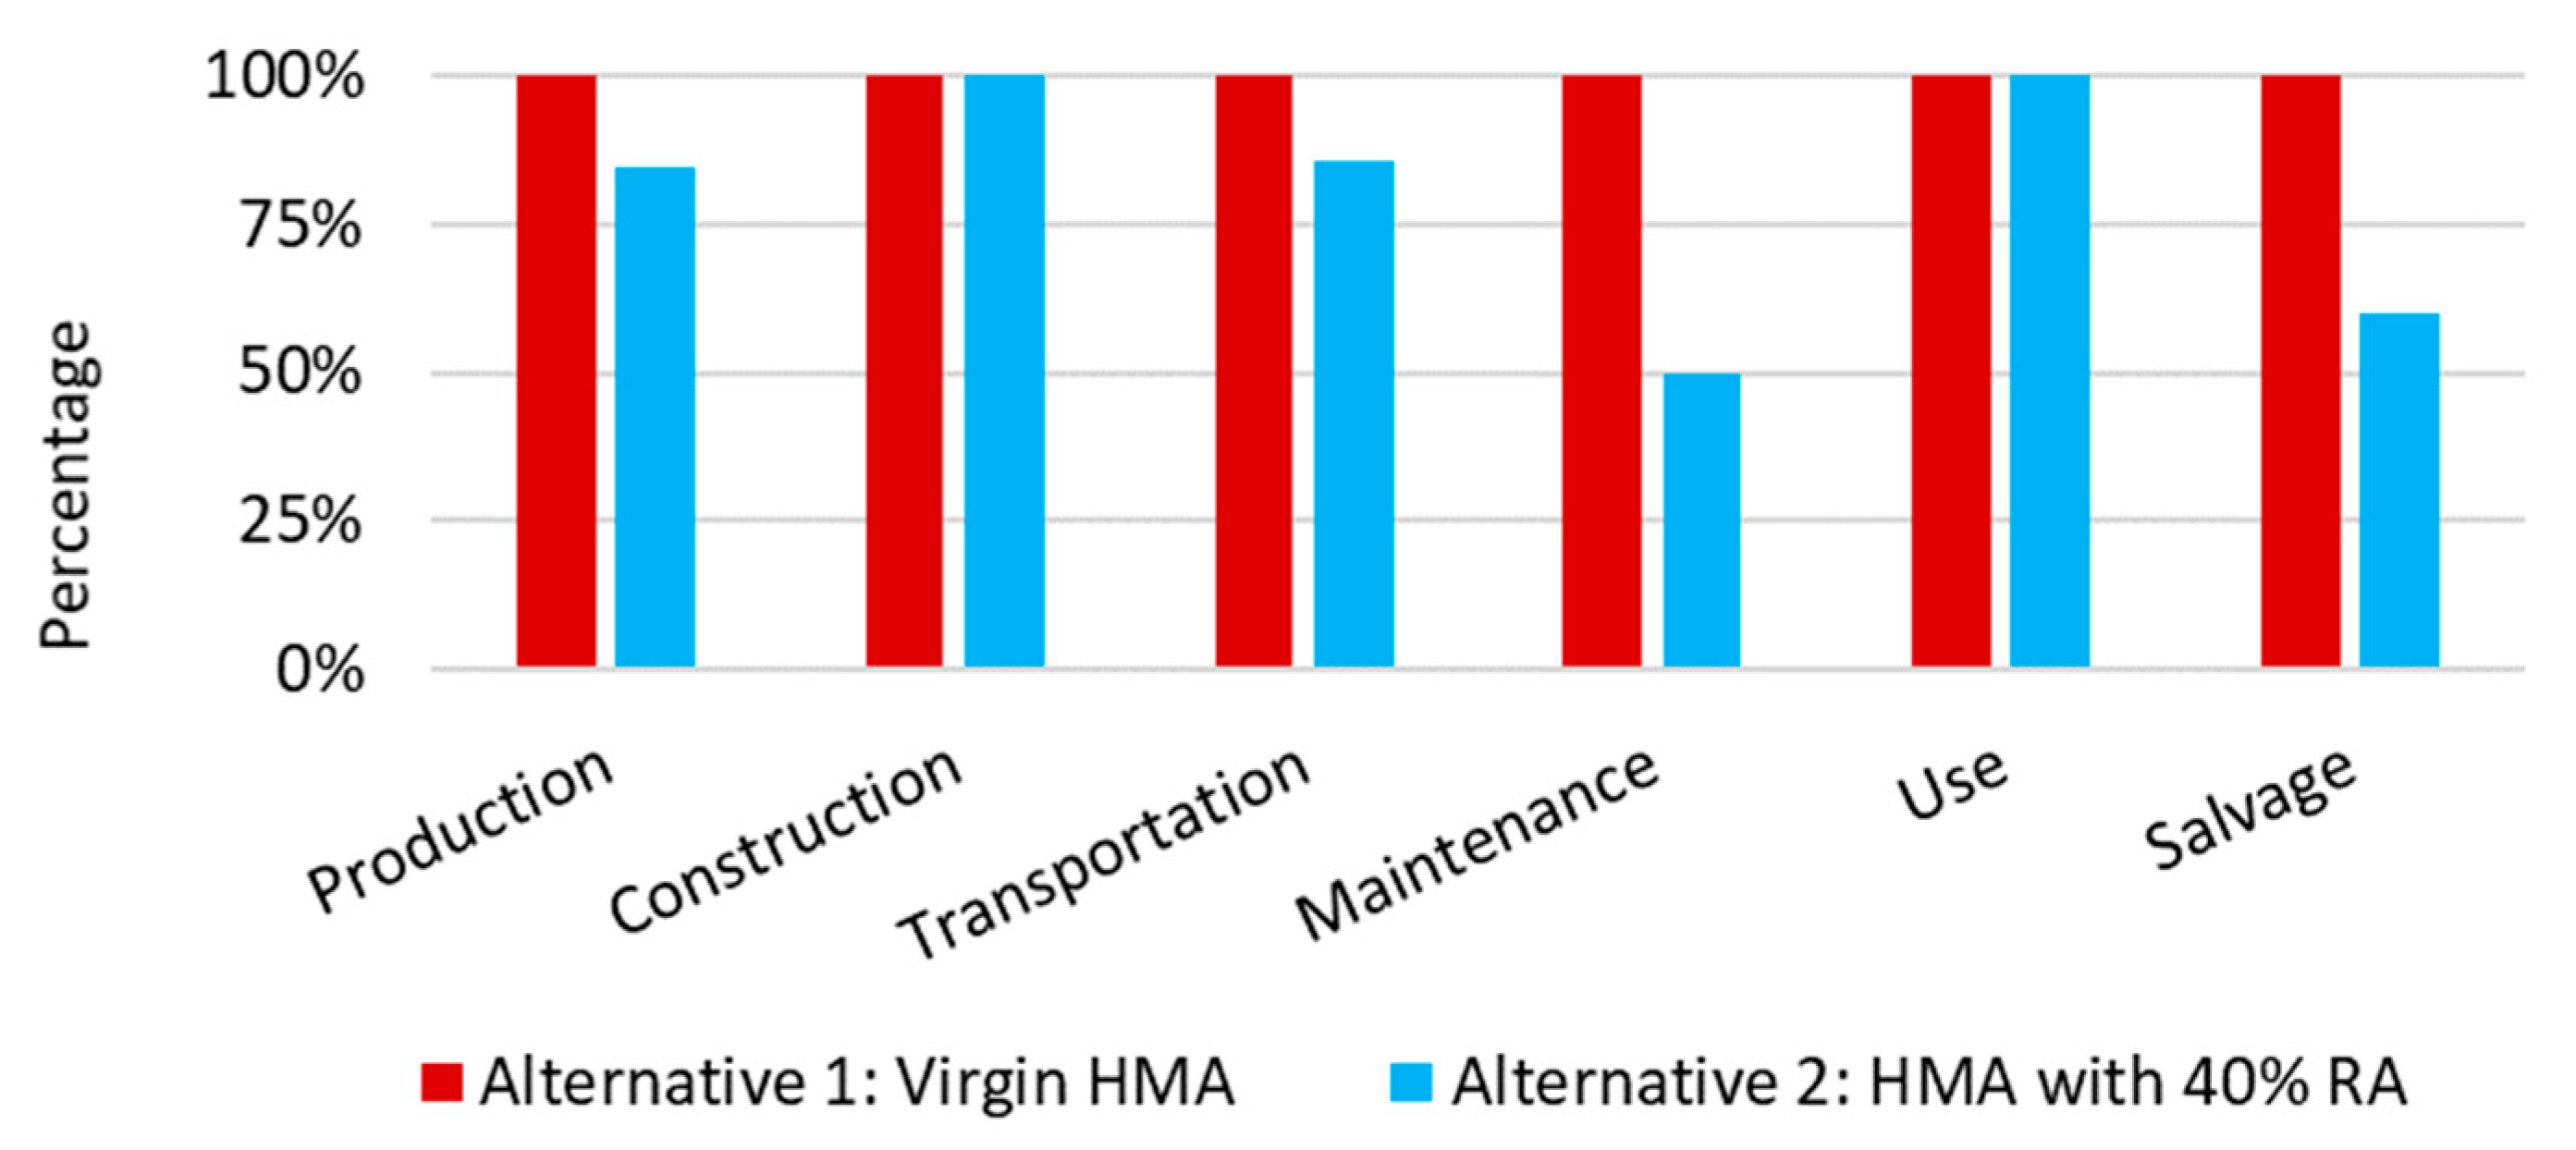
- Agency costs were found to reduce by up to 18.3% over the pavements’ service lives when 40% RA is used, compared to virgin hot mix asphalt. The reduction was found to be greater for thinner pavements (e.g., the standard structure in Table 1).
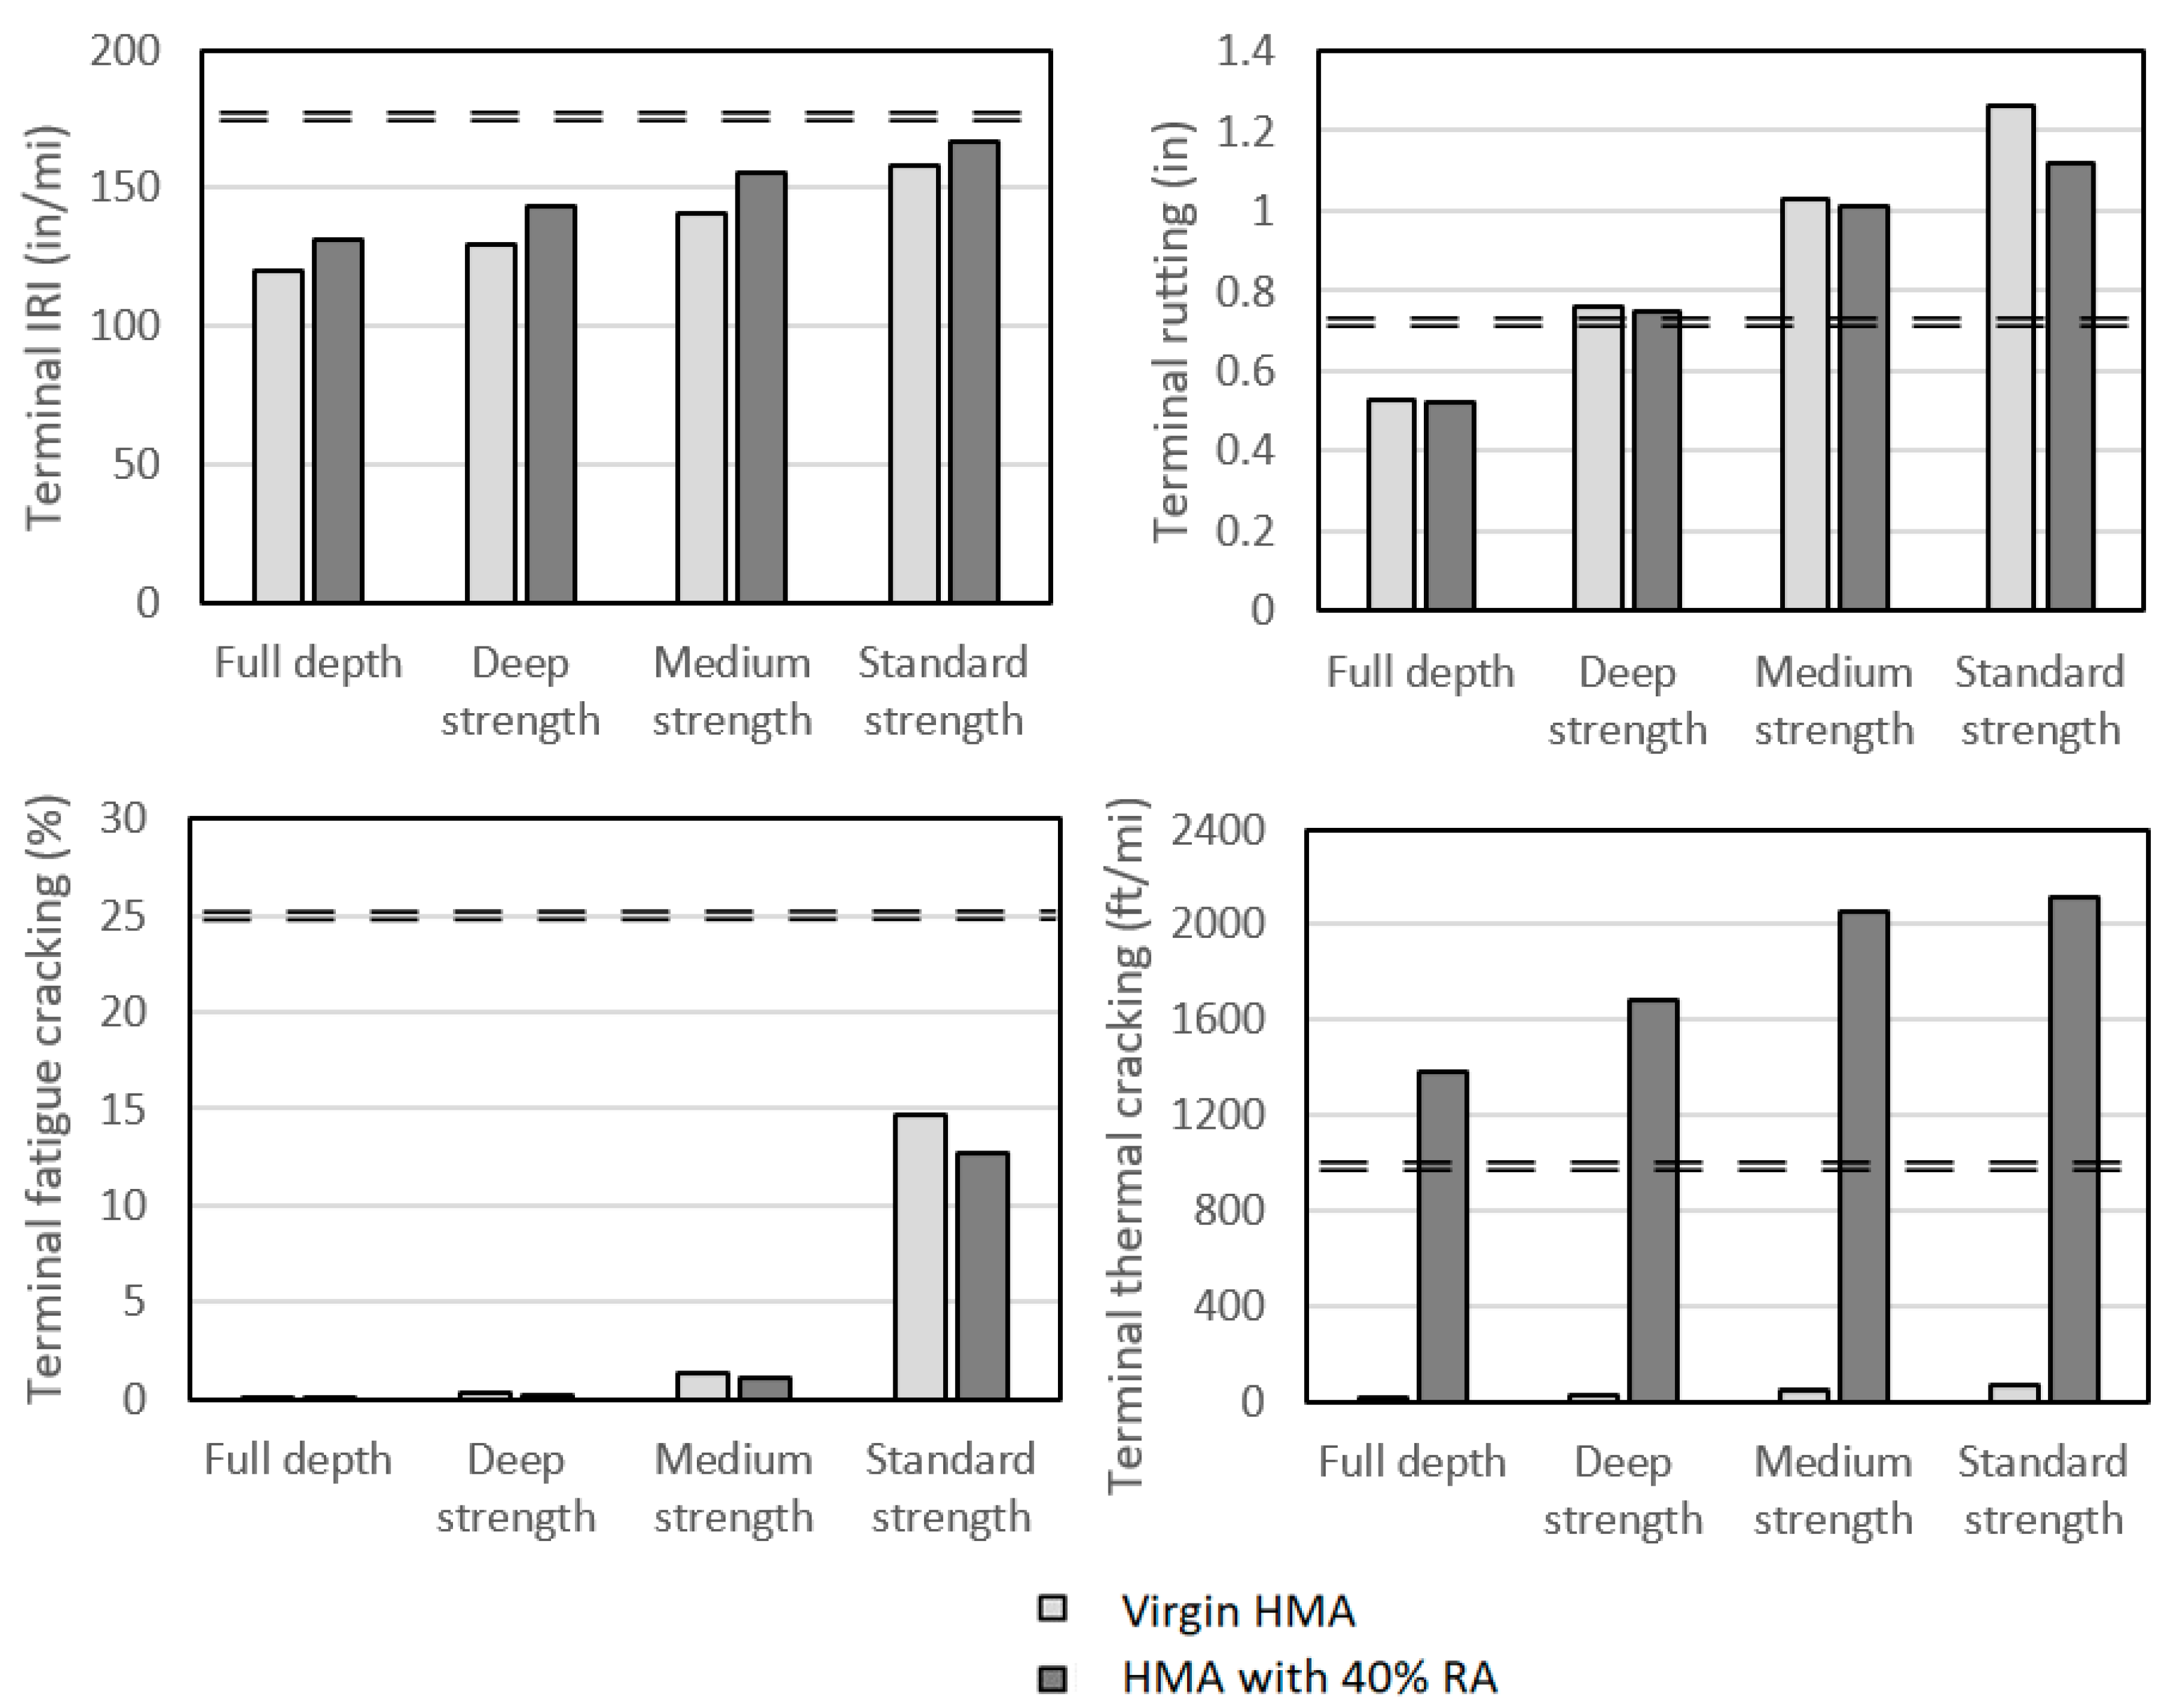
- In the production phase, net present values were found to reduce approximately 15%–25% when 40% RA is used. HMA with 40% RA is predicted to have improved resistance to rutting but cracking will be expected to be worse.
Author Contributions
Funding
Conflicts of Interest
References
- Giani, M.I.; Dotelli, G.; Brandini, N.; Zampori, L. Comparative life cycle assessment of asphalt pavements using reclaimed asphalt, warm mix technology and cold in-place recycling. Resour. Conserv. Recycl. 2015, 104, 224–238. [Google Scholar] [CrossRef]
- Aurangzeb, Q.; Al-Qadi, I.L.; Ozer, H.; Yang, R. Hybrid life cycle assessment for asphalt mixtures with high RAP content. Resour. Conserv. Recycl. 2014, 83, 77–86. [Google Scholar] [CrossRef]
- Yang, R.; Ozer, H.; Kang, S.; Al-Qadi, I.L. Environmental Impacts of Producing Asphalt Mixtures with Varying Degrees of Recycled Asphalt Materials. In Proceedings of the International Symposium on Pavement LCA, Davis, CA, USA, 14–16 October 2014. [Google Scholar]
- Santos, J.; Bryce, J.; Flinsch, G.; Ferreira, A.; Diefenderfer, B. A life cycle assessment of in-place recycling and conventional pavement construction and maintenance practices. Struct. Infrastruct. Eng. 2015, 11, 1199–1217. [Google Scholar] [CrossRef]
- Del Ponte, K.; Natarajan, B.M.; Ahlman, A.P.; Baker, A.; Elliot, E.; Edil, T.B. Life-Cycle Benefits of Recycled Material in Highway Construction. Transp. Res. Rec. 2017, 2628, 1–11. [Google Scholar] [CrossRef]
- Copeland, A. Reclaimed Asphalt Pavement in Asphalt Mixtures: State of the Practice; Report FHWA-HRT-11-021; FHWA: Washington, DC, USA, 2011.
- Federal Highway Administration (FHWA). Life-Cycle Cost Analysis in Pavement Design; FHWA-SA-98-079; Federal Highway Administration: Washington, DC, USA, 1998.
- Lee, J.C.; Edil, T.B.; Tinjum, J.M.; Benson, C.H. Quantitative Assessment of Environmental and Economic Benefits of Recycled Materials in Highway Construction. Transp. Res. Rec. 2010, 2158, 138–142. [Google Scholar] [CrossRef]
- Santos, J.; Bryce, J.; Flintsch, G.; Ferreira, A. A comprehensive life cycle costs analysis of in-place recycling and conventional pavement construction and maintenance practices. Int. J. Pavement Eng. 2015, 18, 727–743. [Google Scholar] [CrossRef]
- Wang, Y. The effects of using reclaimed asphalt pavements (RAP) on the long-term performance of asphalt concrete overlays. Constr. Build. Mater. 2016, 120, 335–348. [Google Scholar] [CrossRef]
- Coleri, E.; Zhang, Y.; Wruck, B.M. Mechanistic-Empirical Simulations and Life-Cycle Cost Analysis to Determine the Cost and Performance Effectiveness of Asphalt Mixtures Containing Recycled Materials. Transp. Res. Rec. 2018, 2672, 143–154. [Google Scholar] [CrossRef]
- Aurangzeb, Q.; Al-Qadi, I. Asphalt Pavements with High Reclaimed Asphalt Pavement Content: Economic and Environmental Perspectives. Transp. Res. Rec. 2014, 2456, 161–169. [Google Scholar] [CrossRef]
- Chatti, K.; Zabaar, I. Estimating the Effects of Pavement Condition on Vehicle Operating Costs; NCHRP Report 720; NCHRP: Washington, DC, USA, 2012. [Google Scholar]
- Trupia, L.; Parry, T.; Neves, L.; Lo Presti, D. Rolling resistance contribution to a road pavement life cycle carbon footprint analysis. Int. J. Life Cycle Assess. 2017, 22, 972. [Google Scholar] [CrossRef]
- Wang, T.; Lee, I.-S.; Kendall, A.; Harvey, J.; Lee, E.-B.; Kim, C. Life cycle energy consumption and GHG emission from pavement rehabilitation with different rolling resistance. J. Clean. Prod. 2012, 33, 86–96. [Google Scholar] [CrossRef]
- Al-Qadi, I.L.; Elseifi, M.; Carpenter, S.H. Reclaimed Asphalt Pavement—A Literature Review; Report: FHWA-ICT-07-001; FHWA: Washington, DC, USA, 2007.
- Shu, X.; Huang, B.; Vukosavljevic, D. Laboratory evaluation of fatigue characteristics of recycled asphalt mixture. Constr. Build. Mater. 2008, 22, 1323–1330. [Google Scholar] [CrossRef]
- Silva, H.M.R.D.; Oliveira, J.R.M.; Jesus, C.M.G. Are totally recycled hot mix asphalts a sustainable alternative for road paving? Resour. Conserv. Recycl. 2012, 60, 38–48. [Google Scholar] [CrossRef]
- Qiao, Y.; Dawson, A.R.; Parry, T.; Flintsch, G.W. Evaluating the effects of climate change on road maintenance intervention strategies and Life-Cycle Costs. Transp. Res. D Transp. Environ. 2015, 41, 492–503. [Google Scholar] [CrossRef]
- Underwood, B.S.; Guido, Z.; Gudipudi, P.; Feinberg, Y. Increased costs to US pavement infrastructure from future temperature rise. Nat. Clim. Chang. 2017, 7, 704–707. [Google Scholar] [CrossRef]
- Chinowsky, P.; Scheikert, A.E.; Strzepek, N.L.; Strzepek, K. Road Infrastructure and Climate Change in Vietnam. Sustainability 2015, 7, 5452–5470. [Google Scholar] [CrossRef]
- American Association of State Highway and Transportation Officials (AASHTO). Mechanistic-Empirical Pavement Design Guide (MEPDG), version 1.1; National Cooperative Highway Research Program: Washington, DC, USA, 2009. [Google Scholar]
- Zapata, C.E.; Andrei, D.; Witczak, M.W.; Houston, W.N. Incorporation of Environmental Effects in Pavement Design. Road Mater. Pavement Des. 2007, 8, 667–693. [Google Scholar] [CrossRef]
- Melillo, J.M.; Richmond, T.; Yohe, G.W. Climate Change Impacts in the United States: The Third National Climate Assessment; U.S. Global Change Research Program: Washington, DC, USA, 2014. [Google Scholar]
- State of New Hampshire Department of Transportation Bureau of Traffic (NHDOT). I-95 Traffic Volume Report; State of New Hampshire Department of Transportation Bureau of Traffic: Concord, NH, USA, 2016. [Google Scholar]
- Valle, O.; Qiao, Y.; Dave, E.; Mo, W. Life Cycle Assessment of Pavements under a Changing Climate. In Proceedings of the Pavement LCA Conference, Champaign, IL, USA, 12–13 April 2017; Taylor & Francis Group: London, UK, 2017. [Google Scholar]
- DeCarlo, C.; Mo, W.; Dave, E.V.; Locore, J. Sustainable Pavement Rehabilitation Strategy Using Consequential Life Cycle Assessment: An Example of Interstate 95. In Proceedings of the Tenth International Conference on the Bearing Capacity of Roads, Railways and Airfields (BCRRA 2017), Athens, Greece, 28–30 June 2017; Loizos, A., Al-Qadi, I., Scarpas, T., Eds.; CRC Press: Boca Raton, FL, USA, 2017. [Google Scholar]
- Stoner, A.; Daniel, J.; Jacobs, J.; Hayhoe, K.; Scott-Fleming, I. Quantifying the Impact of Climate Change on Flexible Pavement Performance and Lifetime in the United States. Transp. Res. Rec. 2019, 2673, 110–122. [Google Scholar] [CrossRef]
- Meagher, W.; Daniel, J.S.; Jacobs, J.; Linder, E. Method for Evaluating Implications of Climate Change for Design and Performance of Flexible Pavements. Transp. Res. Rec. 2012, 2305, 111–120. [Google Scholar] [CrossRef]
- Saymohamadi, S.; Zarafshani, K.; Tavakoli, M.; Mahdizadeh, H.; Amiri, F. Prediction of Climate Change Induced Temperature & Precipitation: The Case of Iran. Sustainability 2017, 9, 146. [Google Scholar] [CrossRef]
- Kristvik, E.; Johannessen, B.G.; Muthana, T.M. Temporal Downscaling of IDF Curves Applied to Future Performance of Local Stormwater Measures. Sustainability 2019, 11, 1231. [Google Scholar] [CrossRef]
- Brekke, L.; Thrasher, B.L.; Maurer, E.P.; Pruitt, T. Downscaled CMIP3 and CMIP5 Climate Projections. Release of Downscaled CMIP5 Climate Projections, Comparison with Preceding Information, and Summary of User Needs; United States Bureau of Reclamation: Washington, DC, USA, 2013. [Google Scholar]
- Qiao, Y.; Flintsch, G.; Dawson, A.; Parry, T. Examining Effects of Climatic Factors on Flexible Pavement Performance and Service Life. Transp. Res. Rec. 2013, 2349, 100–107. [Google Scholar] [CrossRef]
- Yang, X.; You, Z.; Hiller, J.; Watkins, D. Sensitivity of flexible pavement design to Michigan’s climatic inputs using Pavement ME design. Int. J. Pavement Eng. 2015, 18, 622–632. [Google Scholar] [CrossRef]
- Hoogenboom, G.; Huck, M.G. A dynamic Simulation of Root Growth, Water Uptake, and Biomass Partitioning in a Soil-Plant-Atmosphere Continuum: Update and Documentation; Agronomy and Soils Department Series 109; Alabama Agricultural Experiment Station: Auburn, AL, USA, 1986. [Google Scholar]
- Wang, J.; Feng, L.; Tang, X.; Bentley, Y.; Höök, M. The implications of fossil fuel supply constraints on climate change projections: A supply-side analysis. Futures 2017, 86, 58–72. [Google Scholar] [CrossRef]
- Daniel, J.S.; Bennert, T.; Kim, Y.R.; Mogawer, W.; Congalton, A.; Elwardany, M.; Mensching, D.; Saboury, M. TPF 5(230): Evaluation of Plant Produced RAP Mixtures in North-East; US DOT Transportation Pooled Fund Program: Washington, DC, USA, 2015. [Google Scholar]
- Qiao, Y.; Dawson, A.; Parry, T.; Flintsch, G.W. Immediate effects of some corrective maintenance interventions on flexible pavements. Int. J. Pavement Eng. 2018, 19, 502–508. [Google Scholar] [CrossRef]
- Kerali, H.G.R.; Odoki, J.B.; Standard, E.E. Overview of HDM-4; Highway Development and Management Series; International Study of Highway Development and Management: Birmingham, UK, 2006. [Google Scholar]
- Odoki, J.B.; Kerali, H.G.R.; Highway Development and Management. HDM-4, Technical Reference Manual; PIARC: Paris, France, 1999. [Google Scholar]
- Djarf, L. Road Deterioration and Maintenance Effects Models in Cold Climates; Swedish Road Research Institute: Stockholm, Sweden, 1995. [Google Scholar]
- Nathman, R.K. PALATE User Guide, Example Exercise, and Contextual Discussion. Master’s Thesis, University of Delaware, Newark, DE, USA, 2008. [Google Scholar]
- Goedkoop, M.; Oele, M.; Leijting, J.; Ponsioen, T.; Meijer, E. Introduction to LCA with SimaPro; Pré Consultants: San Francisco, CA, USA, 2016. [Google Scholar]


| Structures | Thickness (inch) | ||
|---|---|---|---|
| Asphalt Concrete | Granular Base | Subbase | |
| 1. Standard strength (SS) | 6 | 28 | 8 |
| 2. Medium strength (MS) | 9 | 18 | 8 |
| 3. Deep strength (DS) | 12 | 12 | 8 |
| 4. Full depth (FD) | 16 | 8 | without subbase |
| Alternative Material 1: Virgin HMA (MPa) | ||||||
| Temperature (°C) | Frequency (Hz) | |||||
| 0.1 | 0.5 | 1 | 5 | 10 | 25 | |
| −10 | 12,614 | 15,392 | 16,506 | 18,840 | 19,727 | 20,787 |
| 4 | 3818 | 6047 | 7124 | 9786 | 11,006 | 12,677 |
| 20 | 696 | 1347 | 1732 | 3062 | 3798 | 4941 |
| 35 | 144 | 304 | 430 | 933 | 1294 | 1914 |
| 55 | 33 | 67 | 92 | 199 | 278 | 431 |
| Alternative Material 2: HMA with 40% RA (MPa) | ||||||
| Temperature (°C) | Frequency (Hz) | |||||
| 0.1 | 0.5 | 1 | 5 | 10 | 25 | |
| −10 | 13,493 | 16,418 | 17,630 | 20,268 | 21,313 | 22,255 |
| 4 | 5939 | 8359 | 9487 | 12,167 | 13,380 | 14,900 |
| 20 | 1366 | 2402 | 2939 | 4665 | 5556 | 6885 |
| 35 | 297 | 591 | 782 | 1507 | 1970 | 2717 |
| 55 | 49 | 100 | 137 | 285 | 375 | 580 |
| Phase | Input | Value | Unit |
|---|---|---|---|
| Production | Virgin HMA | 75 | $/ton material |
| RAP | 55 | $/ton material | |
| Gravel | 12.5 | $/ton material | |
| Sand | 13.5 | $/ton material | |
| Density of virgin HMA | 2.52 | ton/cubic meter | |
| Density of RAP | 2.52 | ton/cubic meter | |
| Density of Gravel | 1.77 | ton/cubic meter | |
| Density of Sand | 1.63 | ton/cubic meter | |
| Transportation | Distance from raw material supplier to construction and maintenance site | 24 | km |
| Distance from site to recycling plant | 24 | km | |
| Volume of transportation truck | 7.6 | cubic meter | |
| Fuel efficiency of transportation truck | 1.7 | km/liter | |
| Gasoline price | 0.53 | $/liter fuel | |
| Diesel price | 0.63 | $/liter fuel | |
| Construction | Productivity of asphalt paving | 200 | ton/hour |
| Productivity of asphalt rolling | 884 | ton/hour | |
| Productivity of granular material placement | 300 | ton/hour | |
| Productivity of granular material compaction | 1832 | ton/hour | |
| Costs of asphalt paving and rolling | 43 | $/square meters | |
| Costs of granular material placement and compaction | 22 | $/square meters | |
| Costs of crack sealing and filling | 124 | $/km (cracking length) | |
| Maintenance | Costs of asphalt overlay material production | 75 | $/ton material |
| Costs of asphalt overlay paving and rolling | 43 | $/square meters | |
| Costs of crack sealing and filling | 125 | $/km | |
| Use | Passenger car (medium car) percentage | 90% | - |
| Light truck percentage | 6% | - | |
| Articulated truck percentage | 4% | - | |
| Salvage | Percentage of recycled RAP (salvage value) | 40% | - |
| Transportation distance to recycling plant as mentioned in the transportation phase | 24 | km |
© 2019 by the authors. Licensee MDPI, Basel, Switzerland. This article is an open access article distributed under the terms and conditions of the Creative Commons Attribution (CC BY) license (http://creativecommons.org/licenses/by/4.0/).
Share and Cite
Qiao, Y.; Dave, E.; Parry, T.; Valle, O.; Mi, L.; Ni, G.; Yuan, Z.; Zhu, Y. Life Cycle Costs Analysis of Reclaimed Asphalt Pavement (RAP) Under Future Climate. Sustainability 2019, 11, 5414. https://doi.org/10.3390/su11195414
Qiao Y, Dave E, Parry T, Valle O, Mi L, Ni G, Yuan Z, Zhu Y. Life Cycle Costs Analysis of Reclaimed Asphalt Pavement (RAP) Under Future Climate. Sustainability. 2019; 11(19):5414. https://doi.org/10.3390/su11195414
Chicago/Turabian StyleQiao, Yaning, Eshan Dave, Tony Parry, Omar Valle, Lingyun Mi, Guodong Ni, Zhenmin Yuan, and Yuefeng Zhu. 2019. "Life Cycle Costs Analysis of Reclaimed Asphalt Pavement (RAP) Under Future Climate" Sustainability 11, no. 19: 5414. https://doi.org/10.3390/su11195414
APA StyleQiao, Y., Dave, E., Parry, T., Valle, O., Mi, L., Ni, G., Yuan, Z., & Zhu, Y. (2019). Life Cycle Costs Analysis of Reclaimed Asphalt Pavement (RAP) Under Future Climate. Sustainability, 11(19), 5414. https://doi.org/10.3390/su11195414