Article

A Comparative Life Cycle Assessment of Meat Trays Made of Various Packaging Materials

Fraunhofer Institute for Environmental, Safety, and Energy Technology UMSICHT, Osterfelder Strasse 3, 46047 Oberhausen, Germany
*
Author to whom correspondence should be addressed.
Sustainability 2019, 11(19), 5324; https://doi.org/10.3390/su11195324
Submission received: 22 August 2019 / Revised: 19 September 2019 / Accepted: 24 September 2019 / Published: 26 September 2019
(This article belongs to the Special Issue Sustainable Packaging During Product Purchase and Recycling)

Abstract

:
In light of the debate on the circular economy, the EU strategy for plastics, and several national regulations, such as the German Packaging Act, polymeric foam materials as well as hybrid packaging (multilayered plastic) are now in focus. To understand the environmental impacts of various tray solutions for meat packaging, a comparative environmental assessment was conducted. As an environmental assessment method, a life cycle assessment (LCA) was applied following the ISO standards 14040/44. The nine packaging solutions investigated were: PS-based trays (extruded polystyrene and extruded polystyrene with five-layered structure containing ethylene vinyl alcohol), PET-based trays (recycled polyethylene terephthalate, with and without polyethylene layer, and amorphous polyethylene terephthalate), polypropylene (PP) and polylactic acid (PLA). The scope of the LCA study included the production of the tray and the end-of-life stage. The production of meat, the filling of the tray with meat and the tray sealing were not taken into account. The results show that the PS-based trays, especially the mono material solutions made of extruded polystyrene (XPS), show the lowest environmental impact across all 12 impact categories except for resource depletion. Multilayer products exhibit higher environmental impacts. The LCA also shows that the end-of-life stage has an important influence on the environmental performance of trays. However, the production of the trays dominates the overall results. Furthermore, the sensitivity analysis illustrates that, even if higher recycling rates were realised in the future, XPS based solutions would still outperform the rest from an environmental perspective.

1. Introduction

With around 8.3 billion metric tons produced since the 1950s and 6.3 billion metric tons generated as waste thus far [1], plastics have become a ubiquitous part and parcel of anthropogenic lifestyle. Especially considering that 79% of all the generated plastic waste thus far globally have ended in landfills, the environmental impacts of plastics, in particular that from packaging materials, are now of increasing focus [1,2]. Hence, several countries across the world in recent years have devised strategies and policies to avert the near-permanent risk of plastic pollution into the biosphere. They address both the consumption side (e.g., banning single-use plastics) and the end-of-life (EoL) management side [3].
In the European Union (EU), with approximately 60% of the plastic waste stream emerging from packaging materials, the recently implemented Packaging and Packaging Waste Directive sets a mass-based recovery and recycling target, wherein 65% of packaging waste is ought to be recycled by the year 2025 and 70% by 2030, of which the target for recycled plastic content is 50% and 55%, respectively [2,4]. In Germany, a similar Packaging Act (VerpackG) came into effect in January 2019 [5]. These and several other regulations worldwide are now directed towards strengthening the concepts of extended producer responsibility (EPR) and product stewardship in order to monitor and potentially optimise the life cycle stages of plastics, primarily from an environmental perspective [3].
One such popular concept in recent times, which is perceived as a pathway for sustainable development, is the Circular Economy (CE). CE aims to deviate from the linear production systems to a closed loop industrial ecosystem [6]. In doing so, it promises delinking continuous economic growth from the rising resource consumption of primary materials. This concept is embraced by the EU and several other countries including China, Japan, UK, Canada, Sweden and Finland [7]. In addition, adopted in 2018, the European strategy for plastics within the CE action plan has a greater emphasis on increasing quality of recyclates as well as achieving higher recycling rates through improving product design as key measures [2]. However, as a mass-based target, the European plastics strategy for CE neither provides sufficient guidance on the quality of the recycled materials nor sets any target to substitute a specific share of virgin materials [4].
When exploring the effectiveness of the recycling of plastic trays in a CE, for the reduction of environmental impacts, the quality of the recyclates to substitute primary materials is often more important than the volume of waste recycled. Studies show that the quality of recycled plastics from post-consumer (PC) waste today is insufficient and therefore has limited usability and impedes their contribution to a CE [8]. PC waste recycling in general is a complex, expensive and low-margin business when compared to the processing of a rather clean post-industrial (PI) waste. Nonetheless, to achieve a functioning CE, it is vital that all waste streams are effectively recycled independent of their source.
In addition, the main challenge of CE arises from its practical implementation, wherein there is often an over-emphasis on recovery and recycling aspects but limited attention on expanding life-time and use intensity by reuse, refurbishing or repairing and most importantly reducing (consumption). Focusing on recycling alone, however, can lead to rebound effects resulting in higher environmental impacts emerging from both primary and secondary production [9]. Zink and Greyer [9] pointed to several convincing parallels to energy efficiency rebound in past studies. As discussed by Haupt and Zschokke [10], environmental impacts mainly result from primary production and consumption, while, in comparison, the environmental impacts from waste management, although important, are nonetheless much lower.
Considering common criticisms that includes the lack of a scientific definition of CE [11], as well as the impulse to simply close the loop ignoring the wider environmental impacts that generate from increased secondary production [9] based on an industrialised vision largely built on traditional recycling [11], it is therefore important to quantitatively evaluate all possible EoL options in order to identify the net positive scenario or treatment pathway for a specific product or material. For example, Dinkel and Kägi [12] showed that, when comparing 57 beverage packaging options, the environmentally best option was not the most circular one. The most circular packaging option for milk was reusable glass bottle, while the most environmentally friendly option was the PE pouch.
Packaging plastic trays are a complex but necessary product that come in many shapes and sizes and are predominantly based on polyethylene terephthalate (PET), polypropylene (PP), polystyrene (PS) and to smaller extent on polylactic acid (PLA). Trays can consist of either single-material polymeric films or a multilayered films, and they can be rigid or foamed. The primary materials as well as the type of packaging depend on fulfilling several end-use needs such as storage, improving shelf-life, providing heat resistance, providing barrier properties, etc. [13]. Owing to their low density and poor optical sorting efficiency, PS based packaging and black plastics are now under scrutiny [14], as they reduce overall recycling efficiency or negatively affect the quality of the recycled materials [15].
Concerning the environmental evaluation of packaging trays, LCA studies have been carried out on recycled PET trays [16,17], extruded PS trays [17,18], (foamed) PLA [17,19], PP [17] and recycled moulded pulp [17]. Additionally, one study investigated plastic boxes made of PS, PLA and PLA-starch compound [20], while Gallego-Schmid et al. [21,22] analysed the environmental performance of different food containers made of XPS and PP among others. The study from Belley [17] focused on packaging trays for dry fruits and vegetables. Consequently, the results cannot be transferred for meat trays. Only the studies from Ingrao et al. [18,19] and Wikström et al. [16] investigated the environmental impacts of meat trays made from XPS, foamed PLA and PET. Nonetheless, there is no study which investigated and consistently compared a broad spectrum of meat tray solutions against their environmental performance. In addition, no study has considered the influence of using recyclates and the influence of higher recycling rates at the end-of-life stage for meat trays.
In this regard, the purpose of this study was to compare various common tray solutions for meat packaging in Europe against their environmental impacts along their life cycle. In addition, against the background of circular economy strategies, it was attempted to understand the importance and influence of the end-of-life pathway for meat trays. Therefore, a life cycle assessment (LCA) to assess nine different types of meat packaging plastic trays (see Figure 1) was applied. This LCA study was subjected to a critical review in accordance with ISO 14040/44 [23,24]. Section 2 presents the methodology, investigated products, systems under study and the implemented scenarios for EoL treatment. Section 3 provides the LCA results and interpretation for the investigated nine products across all environmental impact categories long with sensitivity analysis concerning various EoL scenarios. Section 4 contains the discussion.

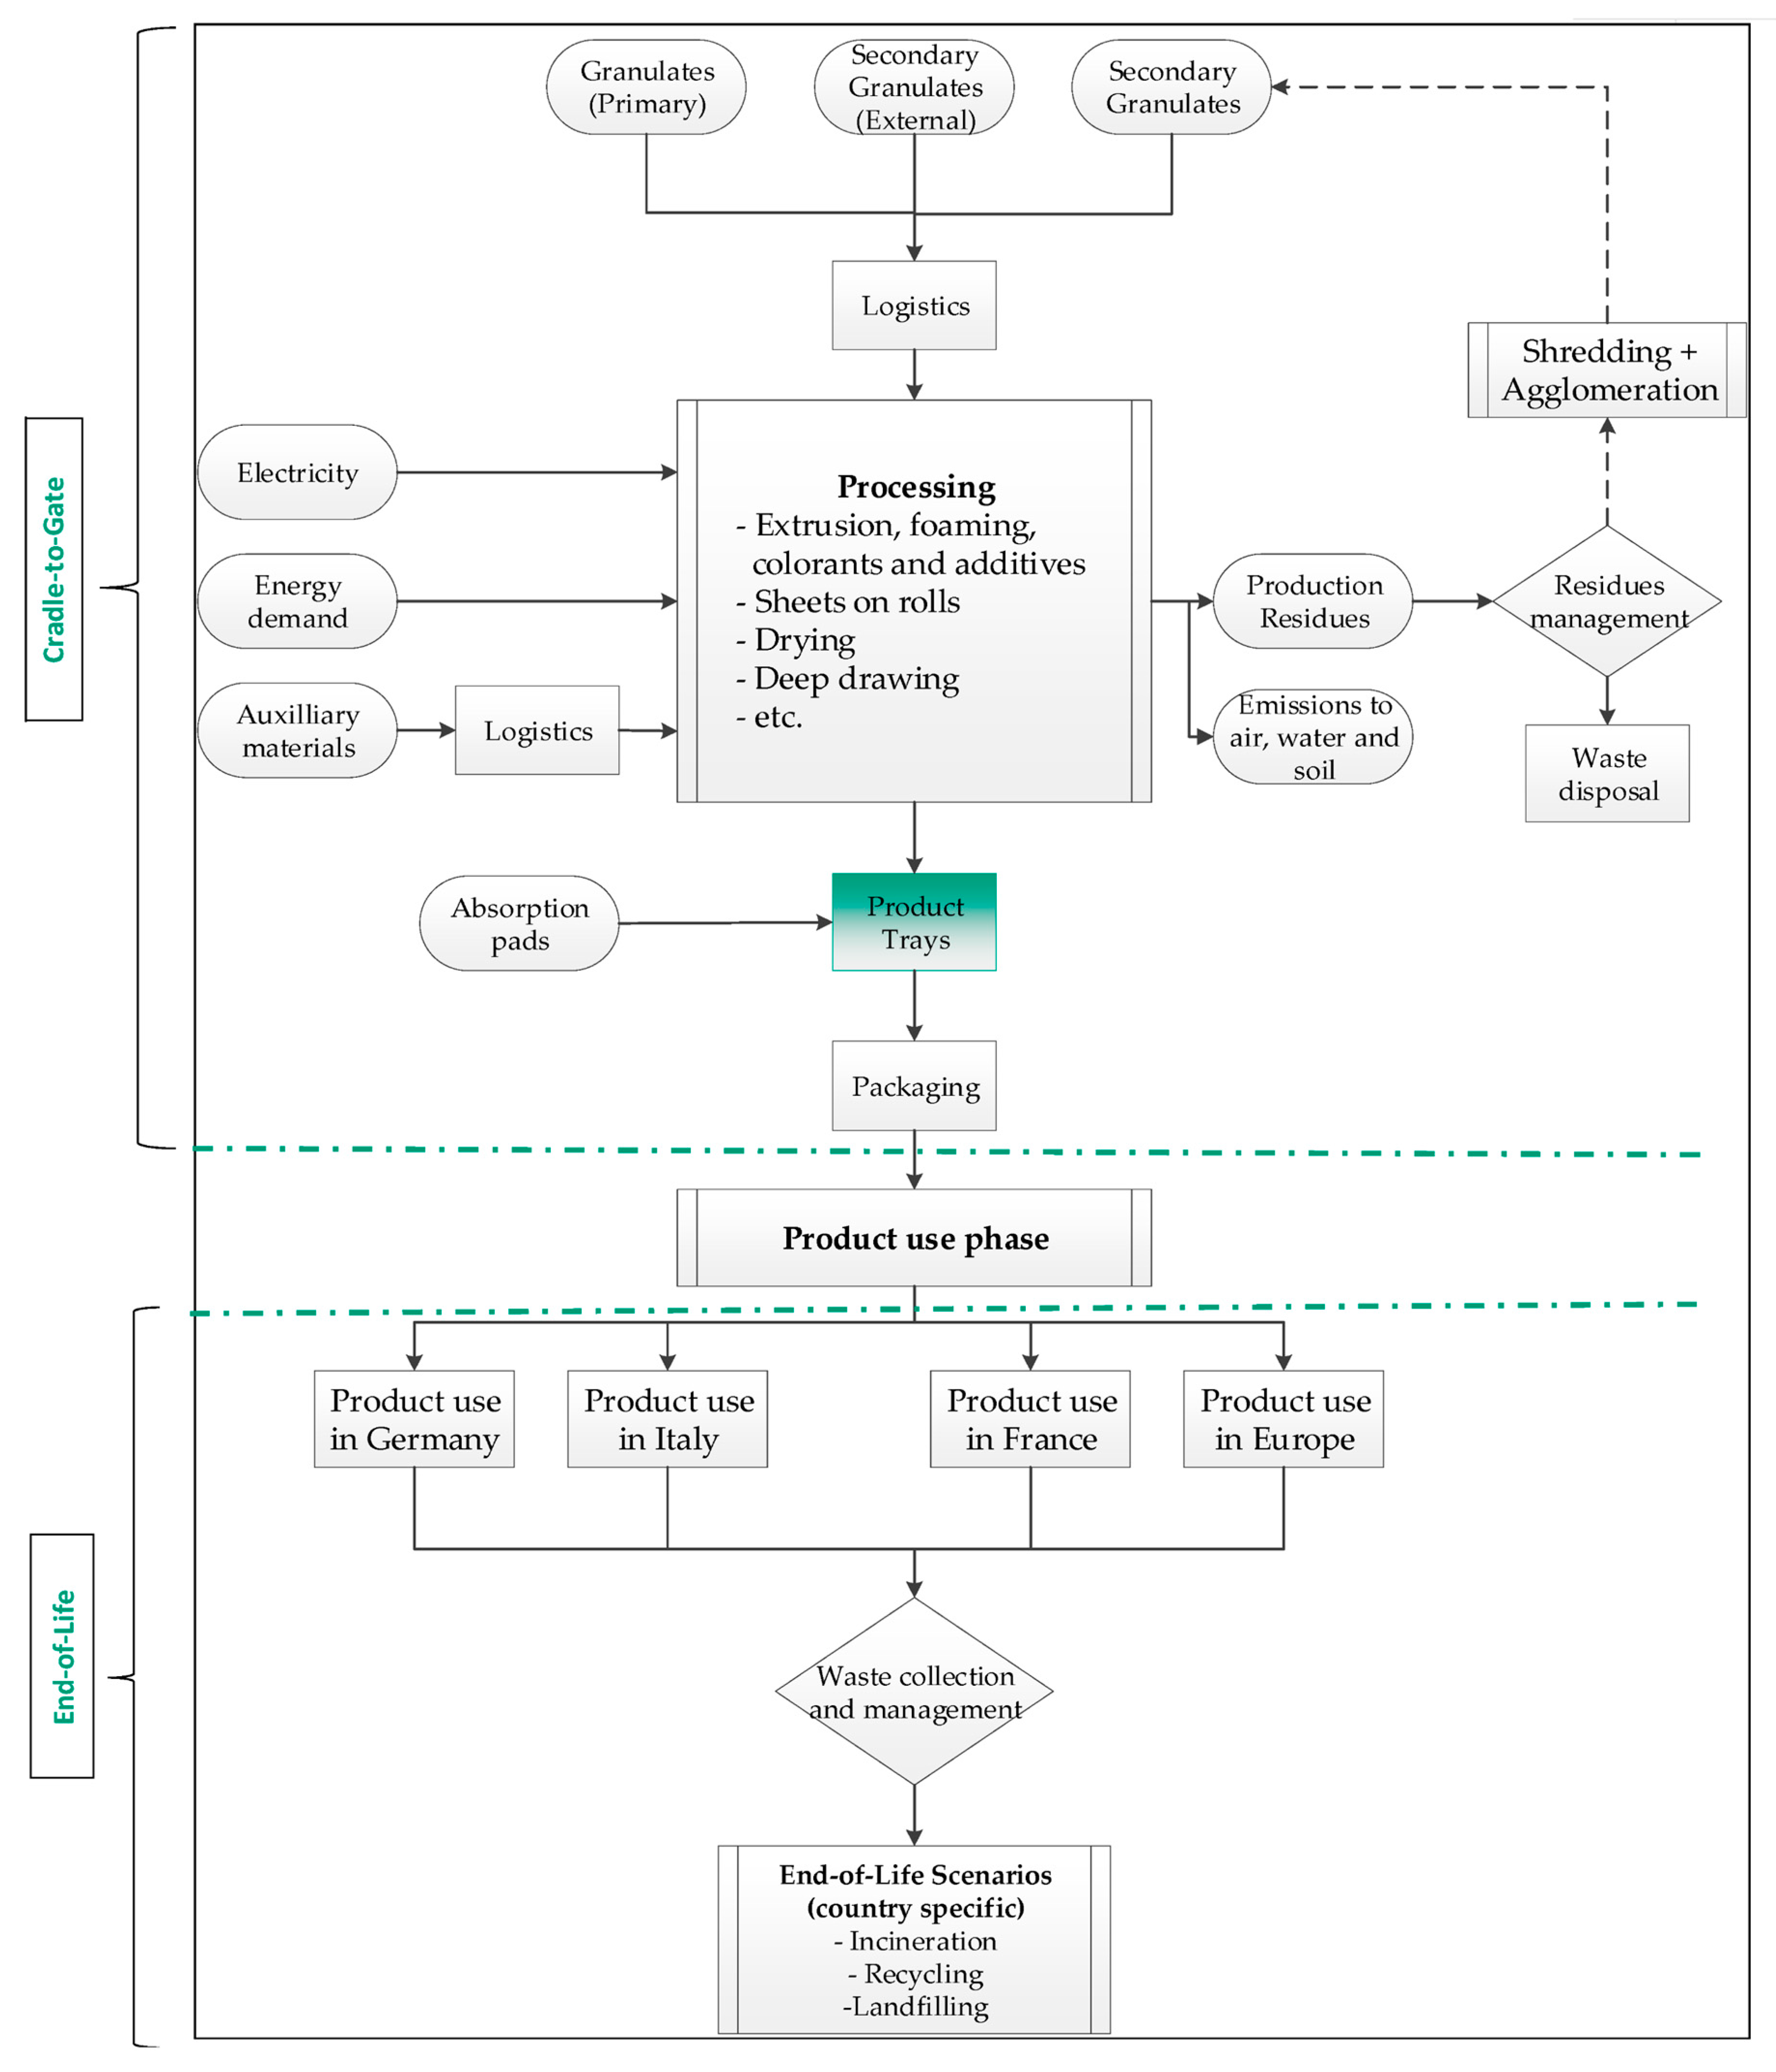
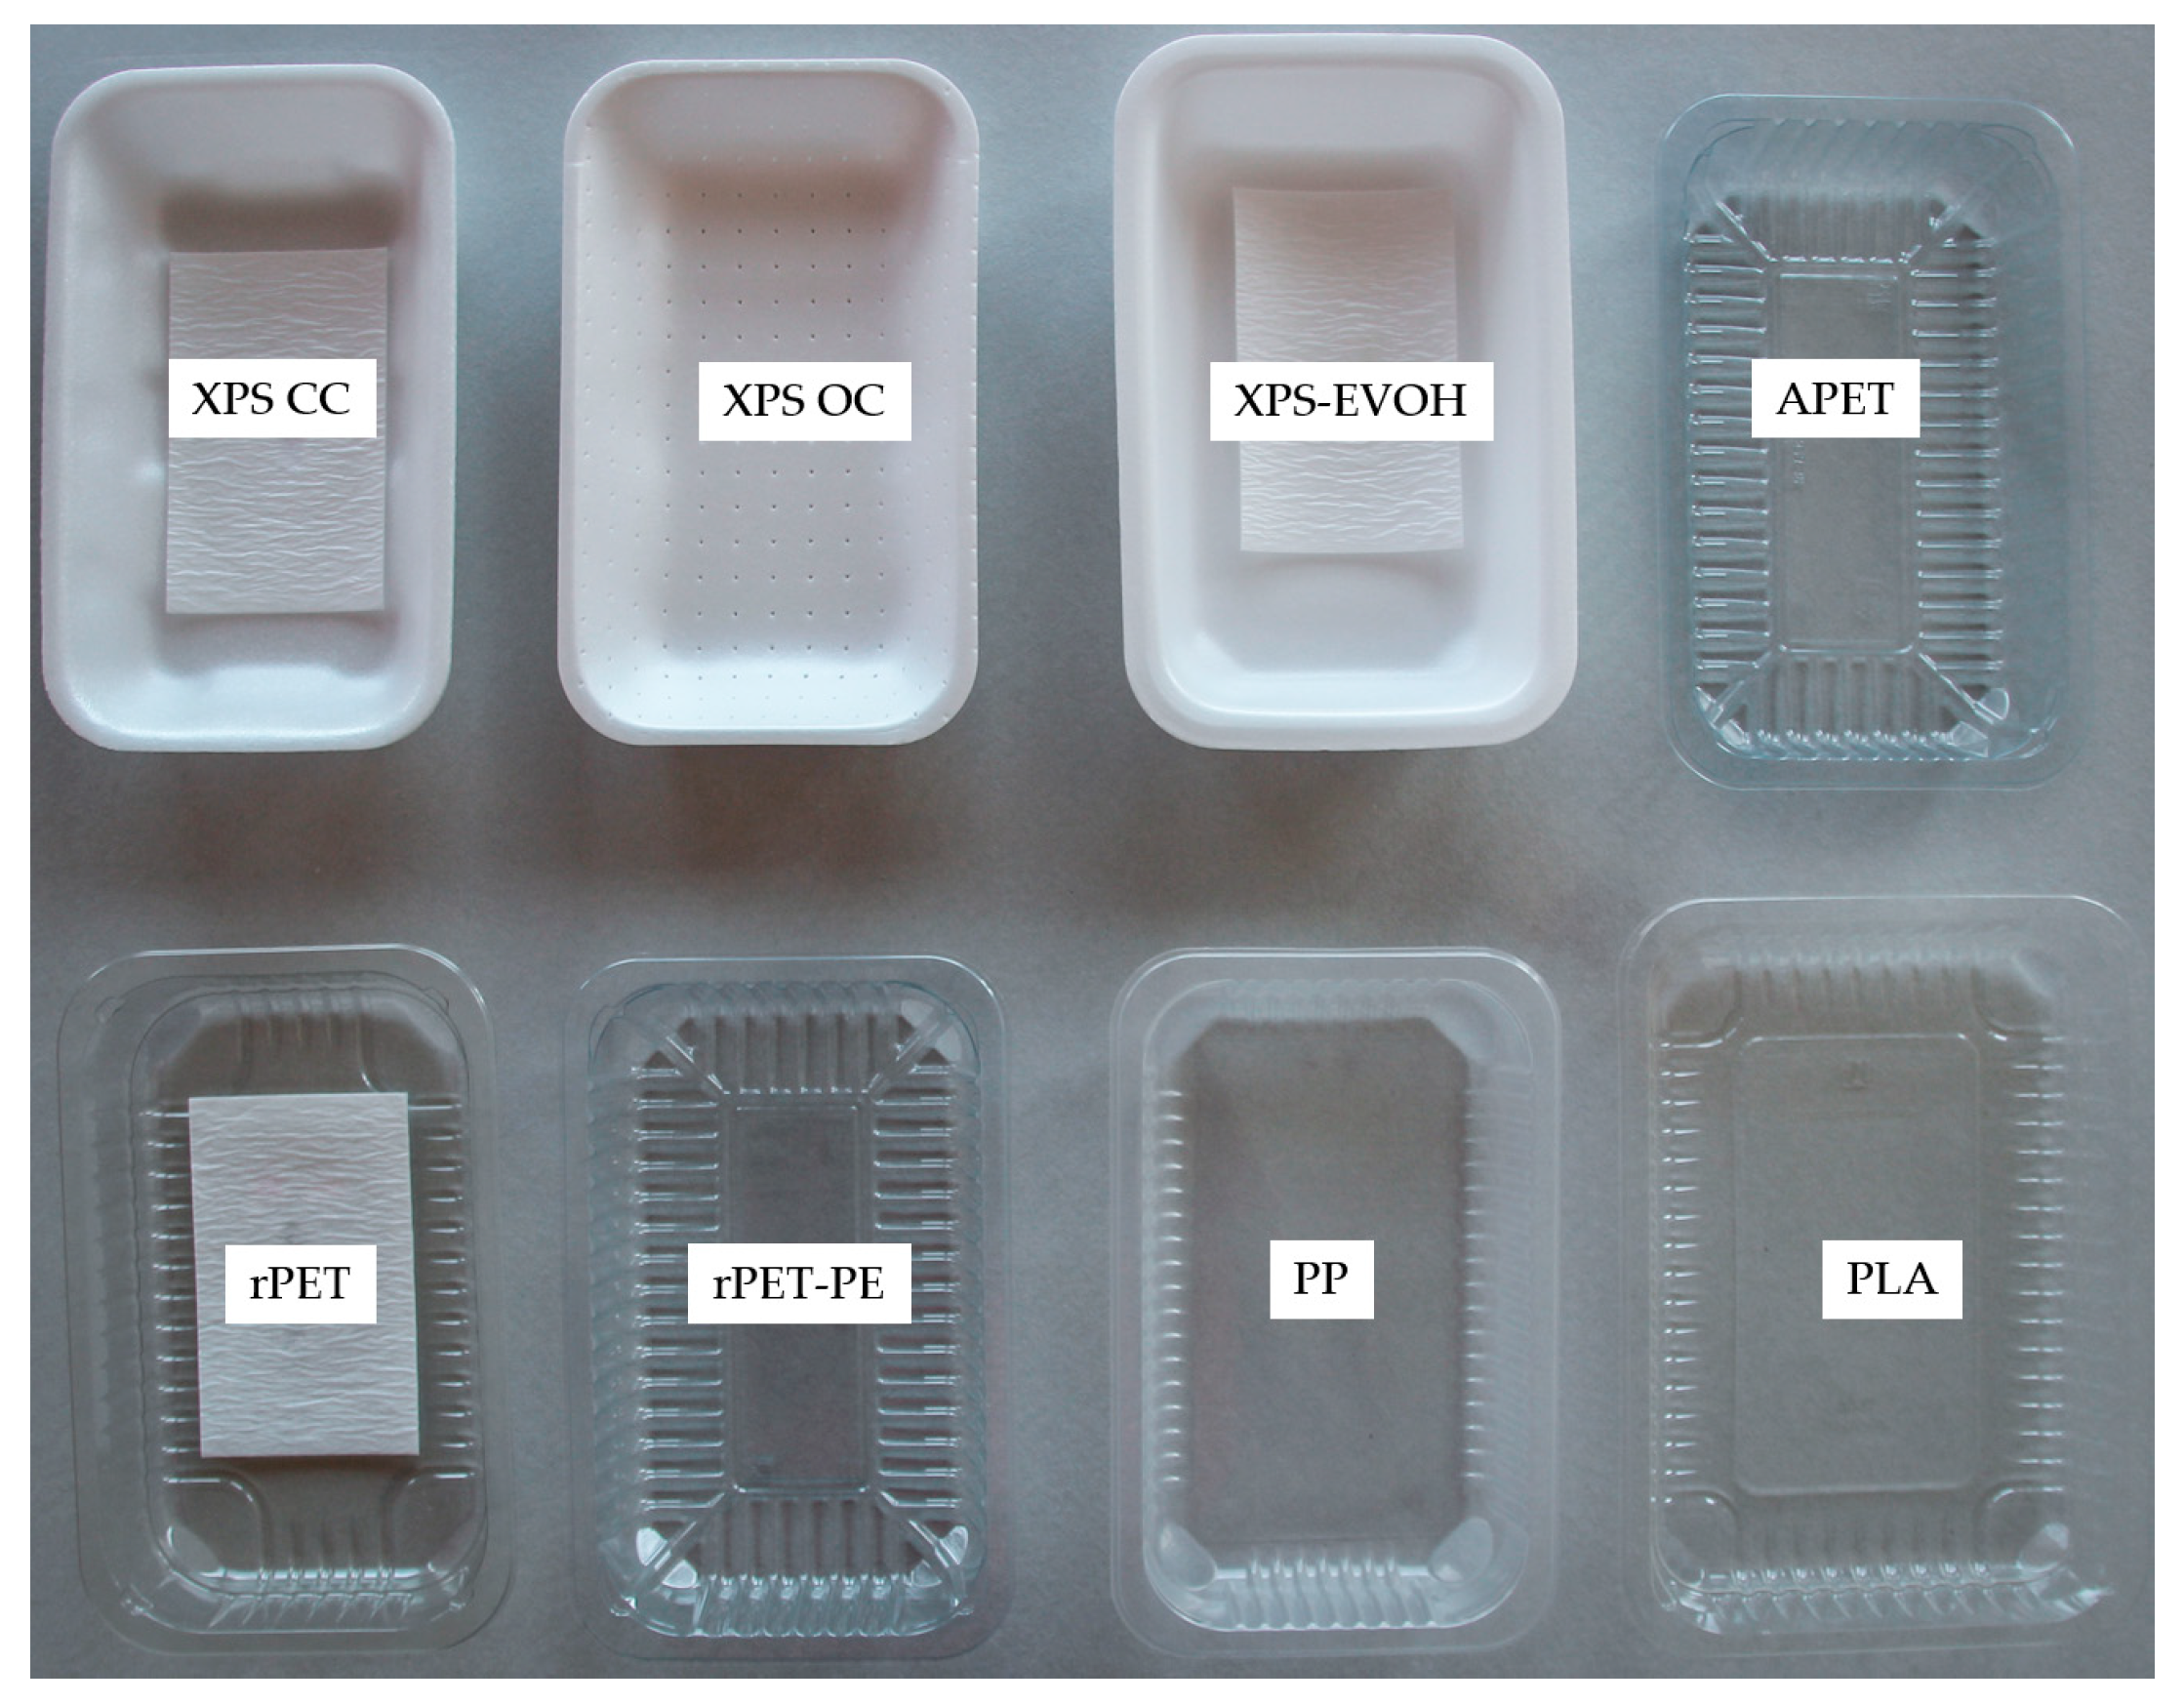
2. Materials and Methods

To evaluate the environmental performance of meat trays along their life cycle starting from the extraction of raw materials to product disposal at the end-of-life (EoL), LCA is the most appropriate tool. It is a structured methodology which is standardised in ISO 14040/44 [23,24] and allows assessing the potential environmental impacts in a product’s life cycle. Apart from the product assessment, which allows manufacturers to become fully aware of the environmental consequences of their products, LCA is used for decisions on product procurement, design and optimisation of products. The purpose of this study was to compare the environmental performance of fresh meat packaging trays made from different plastics employing LCA following the ISO standards 14040/44 [23,24], including an external critical review.
The following nine materials were investigated in this study: extruded polystyrene closed cells foam (XPS CC), extruded polystyrene open cells foam (XPS OC), extruded polystyrene with five-layer structure containing ethylene vinyl alcohol (XPS-EVOH), polystyrene with five-layer structure containing ethylene vinyl alcohol (PS-EVOH), recycled polyethylene terephthalate (rPET), recycled polyethylene terephthalate with polyethylene layer (rPET-PE), amorphous polyethylene terephthalate (APET), polypropylene (PP) and polylactic acid (PLA). Figure 1 shows the investigated meat trays. All trays except of XPS OC have an absorption pad, although some are not illustrated in Figure 1. PS-EVOH is not presented as this particular tray type is still in the R&D phase.
The system boundaries comprise the extraction of materials to the EoL excluding the use phase. This is a so-called “cradle-to-gate with end-of-life” approach. The production of meat, filling of the tray with meat, and sealing the trays are out of the scope of this study, since it is assumed that these processes are the same for all tray systems under consideration. The product use phase is also excluded since it is assumed that all the content is consumed and the user behaviour is independent from the tray solution. Finally, as shelf life (packaging properties to protect the food) is not only influenced by the tray itself but strongly depends on the sealing film and the storage conditions, it is therefore not considered. Figure 2 illustrates the scope and system boundaries of the LCA study.
The functional unit (FU) for this study is defined as a “tray with a volume of about 1 L for preserving 500 g of fresh meat”. All investigated tray types allow for absorbing liquids released from the meat. This is achieved through an absorption pad except in the case of XPS OC which allows absorbing liquids without additional pad due to distinctive design. The investigated tray sizes were 230 mm × 145 mm × 40 mm, 223 mm × 135 mm × 40 mm, and 218 mm × 135 mm × 40 mm, while the base materials of packaging products were PS, PET, PP, and PLA. Nonetheless, all tray types refer to the same volume (1 L) and the same amount of meat which is packaged (500 g portion of red meat).
Table 1 shows the different products, their average material weights with and without liner in grams, and the used film and the film structure of the materials for different meat packaging trays.
The primary data were provided by the tray producing companies silver plastics® GmbH & Co. KG (Troisdorf, Germany) and Sirap Gema SpA (Verolanuova (BS), Italy) whose processes can be seen as representative for other European tray producers. No major technological differences or notable difference in product designs is expected in comparison to other European tray producers. Due to confidentiality, only the necessary inventory data are presented. The collected data reflect average figures for the year 2018. The primary data cover the material composition of trays (type and amounts), additives (amounts and types), auxiliary materials for extrusion, foaming agents, transport distances of raw materials, consumables and supplies used for the production of trays, the electricity demand for extruders or deep drawing machines, consumables for transporting materials within the production plant, the amount and types of production residues, the energy demand for different machines allowing internal recycling of residues, materials and energy requirements to produce absorption pads including transport distances from suppliers, the electricity demand to place absorption pads into the trays, the packaging materials for secondary packaging, and amounts of production wastes and spatial distribution of sales markets.
For modelling the absorption pad, a product composition of approximately 64% cellulose, 10% super absorber and 26% PE film was assumed. The super absorber was modelled based on the life cycle inventory data published for sodium poly-acrylate [25]. Primary data were complemented with background data taken predominantly from the GaBi databases [26] service pack version 38. The background data are listed in the Supplementary Materials (SM) in Table S2. For the assessment, average values, e.g., regarding material and energy demands from the primary data provided by both companies, were used. For calculating the environmental impacts, the International Life Cycle Data (ILCD) method (ILCD/PEF recommendation v1.09) was used [27].
During the production process of trays, residues occur from extrusion (~2%) and deep drawing (~30%). For internal recycling of production residues, it was assumed that they undergo further processing in all the investigated cases (as in closed-loop recycling). Production residues that are not recycled into the same product replace virgin material in other products (open-loop recycling), either internally or externally. As for closed-loop recycling, for the cases involving open-loop recycling, a 100% credit for substituting virgin materials is considered. This assumption, however, does not incentivise for internal recycling, which should be favoured.
For modelling the EoL, two scenarios were investigated. Scenario 1 (base case) investigated the current EoL management situation in Europe, namely in Italy, France, and Germany [28,29,30,31]. Although PET waste can be recycled, PET trays are commonly not recycled, e.g., because sorting machines cannot differentiate between PET and PET-PE trays. Scenario 2 (forecast case) is based on the European strategy for plastics in a circular economy in 2030. It is assumed that multilayer trays, PET and PLA trays as well as any foamed trays are not recycled today. They end up in landfill, in waste incineration or in the production of refuse-derived fuel (RDF). Monolayer PP trays may additionally be recycled. To calculate the shares of material ending up in the different EoL pathways, the recycling situation in Italy, France, and Germany was combined with the information provided by the two tray producers. Hence, the distribution of EoL pathways presented in Table 2 was set up. The share of waste that is directed to produce refuse-derived fuels (RDF) was assigned to waste incineration due to lack of background data for the production of RDF and its application. A detailed summary of the EoL pathways in Europe in 2018 is provided in Table S1 in the SM.
For distributing burdens among products, waste, and recyclates, the polluter pays principle (PPP) was applied as suggested by the Product Category Rules for packaging [32]. In the case of thermal treatment, credits were given for energy recovery. In contrast, for recycling of trays at the EoL—following the PPP—no environmental impacts were considered for the recycling process and no credits were given for the recyclate. Consequently, benefits of recycling in-line with the PPP were taken into account for the product that uses the recyclates and not for the product that delivers these recyclates (starting material). In the case of using rPET as starting material, the PET bottle waste is assumed to have zero burdens. Following the PPP, the carbon footprint of rPET is calculated to be 0.74 kg CO2-eq./kg rPET. Compared to the carbon footprint of virgin PET (2.95 kg CO2-eq./kg PET, cradle-to-gate), the carbon footprint of rPET is rather low.
To understand the influence of EoL impacts caused by future developments, a forecast EoL scenario for 2030 was investigated in accordance to the targets listed in the European strategy for plastics in a circular economy [2]. The strategy demands that all plastic packaging placed on the EU market is either reusable or can be recycled cost-effectively by the year 2030. By the year 2030, the recycling rate of plastics in packaging is targeted to be 55% [4] and landfilling is reduced to a maximum of 10% according to the Circular Economy Package. Consequently, incineration will be limited to a maximum of 35%. To fulfil these ambitious recycling targets, it is assumed that all types of plastics, namely foamed, multilayer and rigid plastics will be recycled in the future. PLA is assumed to be thermally treated since recycling technology will probably not be established until the year 2030 due to small amounts of this plastic in the market. However, the recycling of PLA can reduce environmental impacts of PLA considerably [33]. Table 3 summarises the shares of EoL options for the year 2030 following the European strategy for plastics in a circular economy. For consistency, the influence of a future power mix is analysed additionally. To reflect impacts from future power generation, the following GaBi-datasets are considered both for production processes and for substitution processes in the EoL: “EU-28: Electricity grid mix (2030)”, “IT: Electricity grid mix (2030)” and “DE: Electricity grid mix (2030)”. The Gabi datasets refer to inventory data partly based on primary industry data and partly on secondary data published in [34].
The life cycle model was set up in the GaBi software, version 8. The model consists of the following process modules: (1) polymer production; (2) production of additives and fillers; (3) auxiliaries; (4) transport to extrusion; (5) extrusion; (6) storage of rolls; (7) multilayer production and transport; (8) lamination; (9) thermoforming; (10) recycling of residues; (11) credits for open-loop recycling (residues); (12) absorption pad production; (13) secondary packaging; and (14) EoL tray. The LCA model is shown in Figure S1 in SM.

3. Results

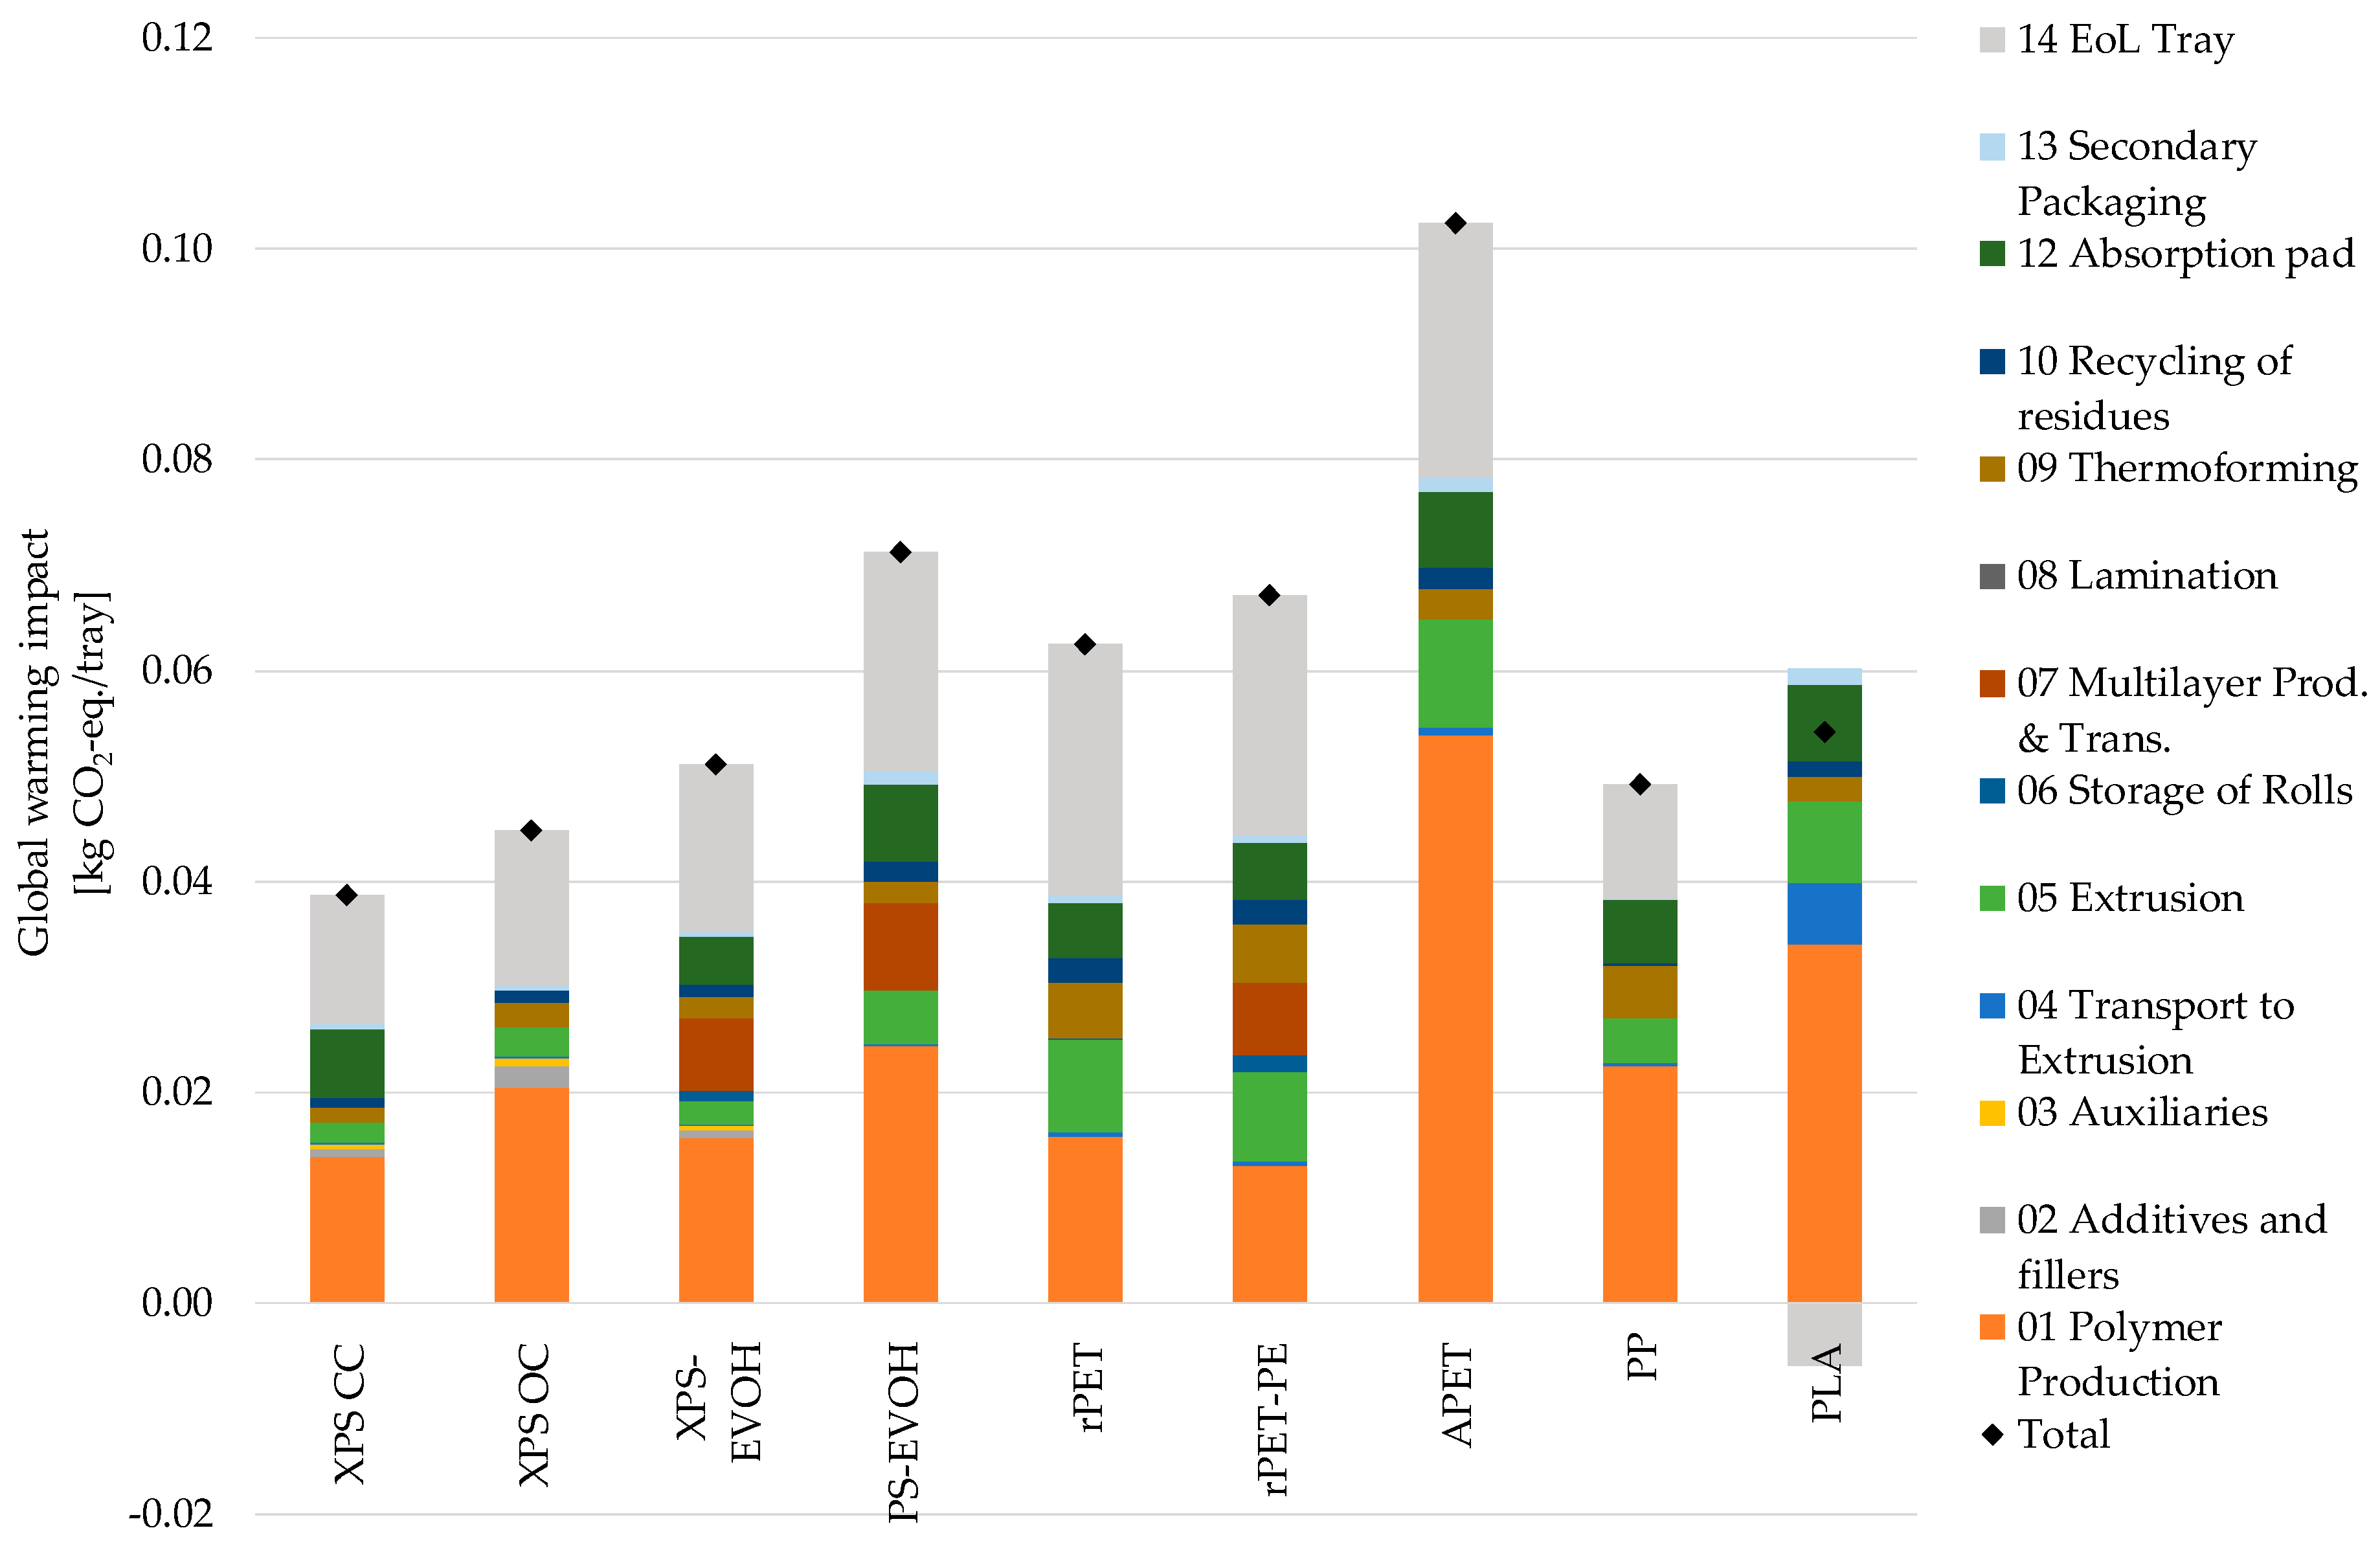
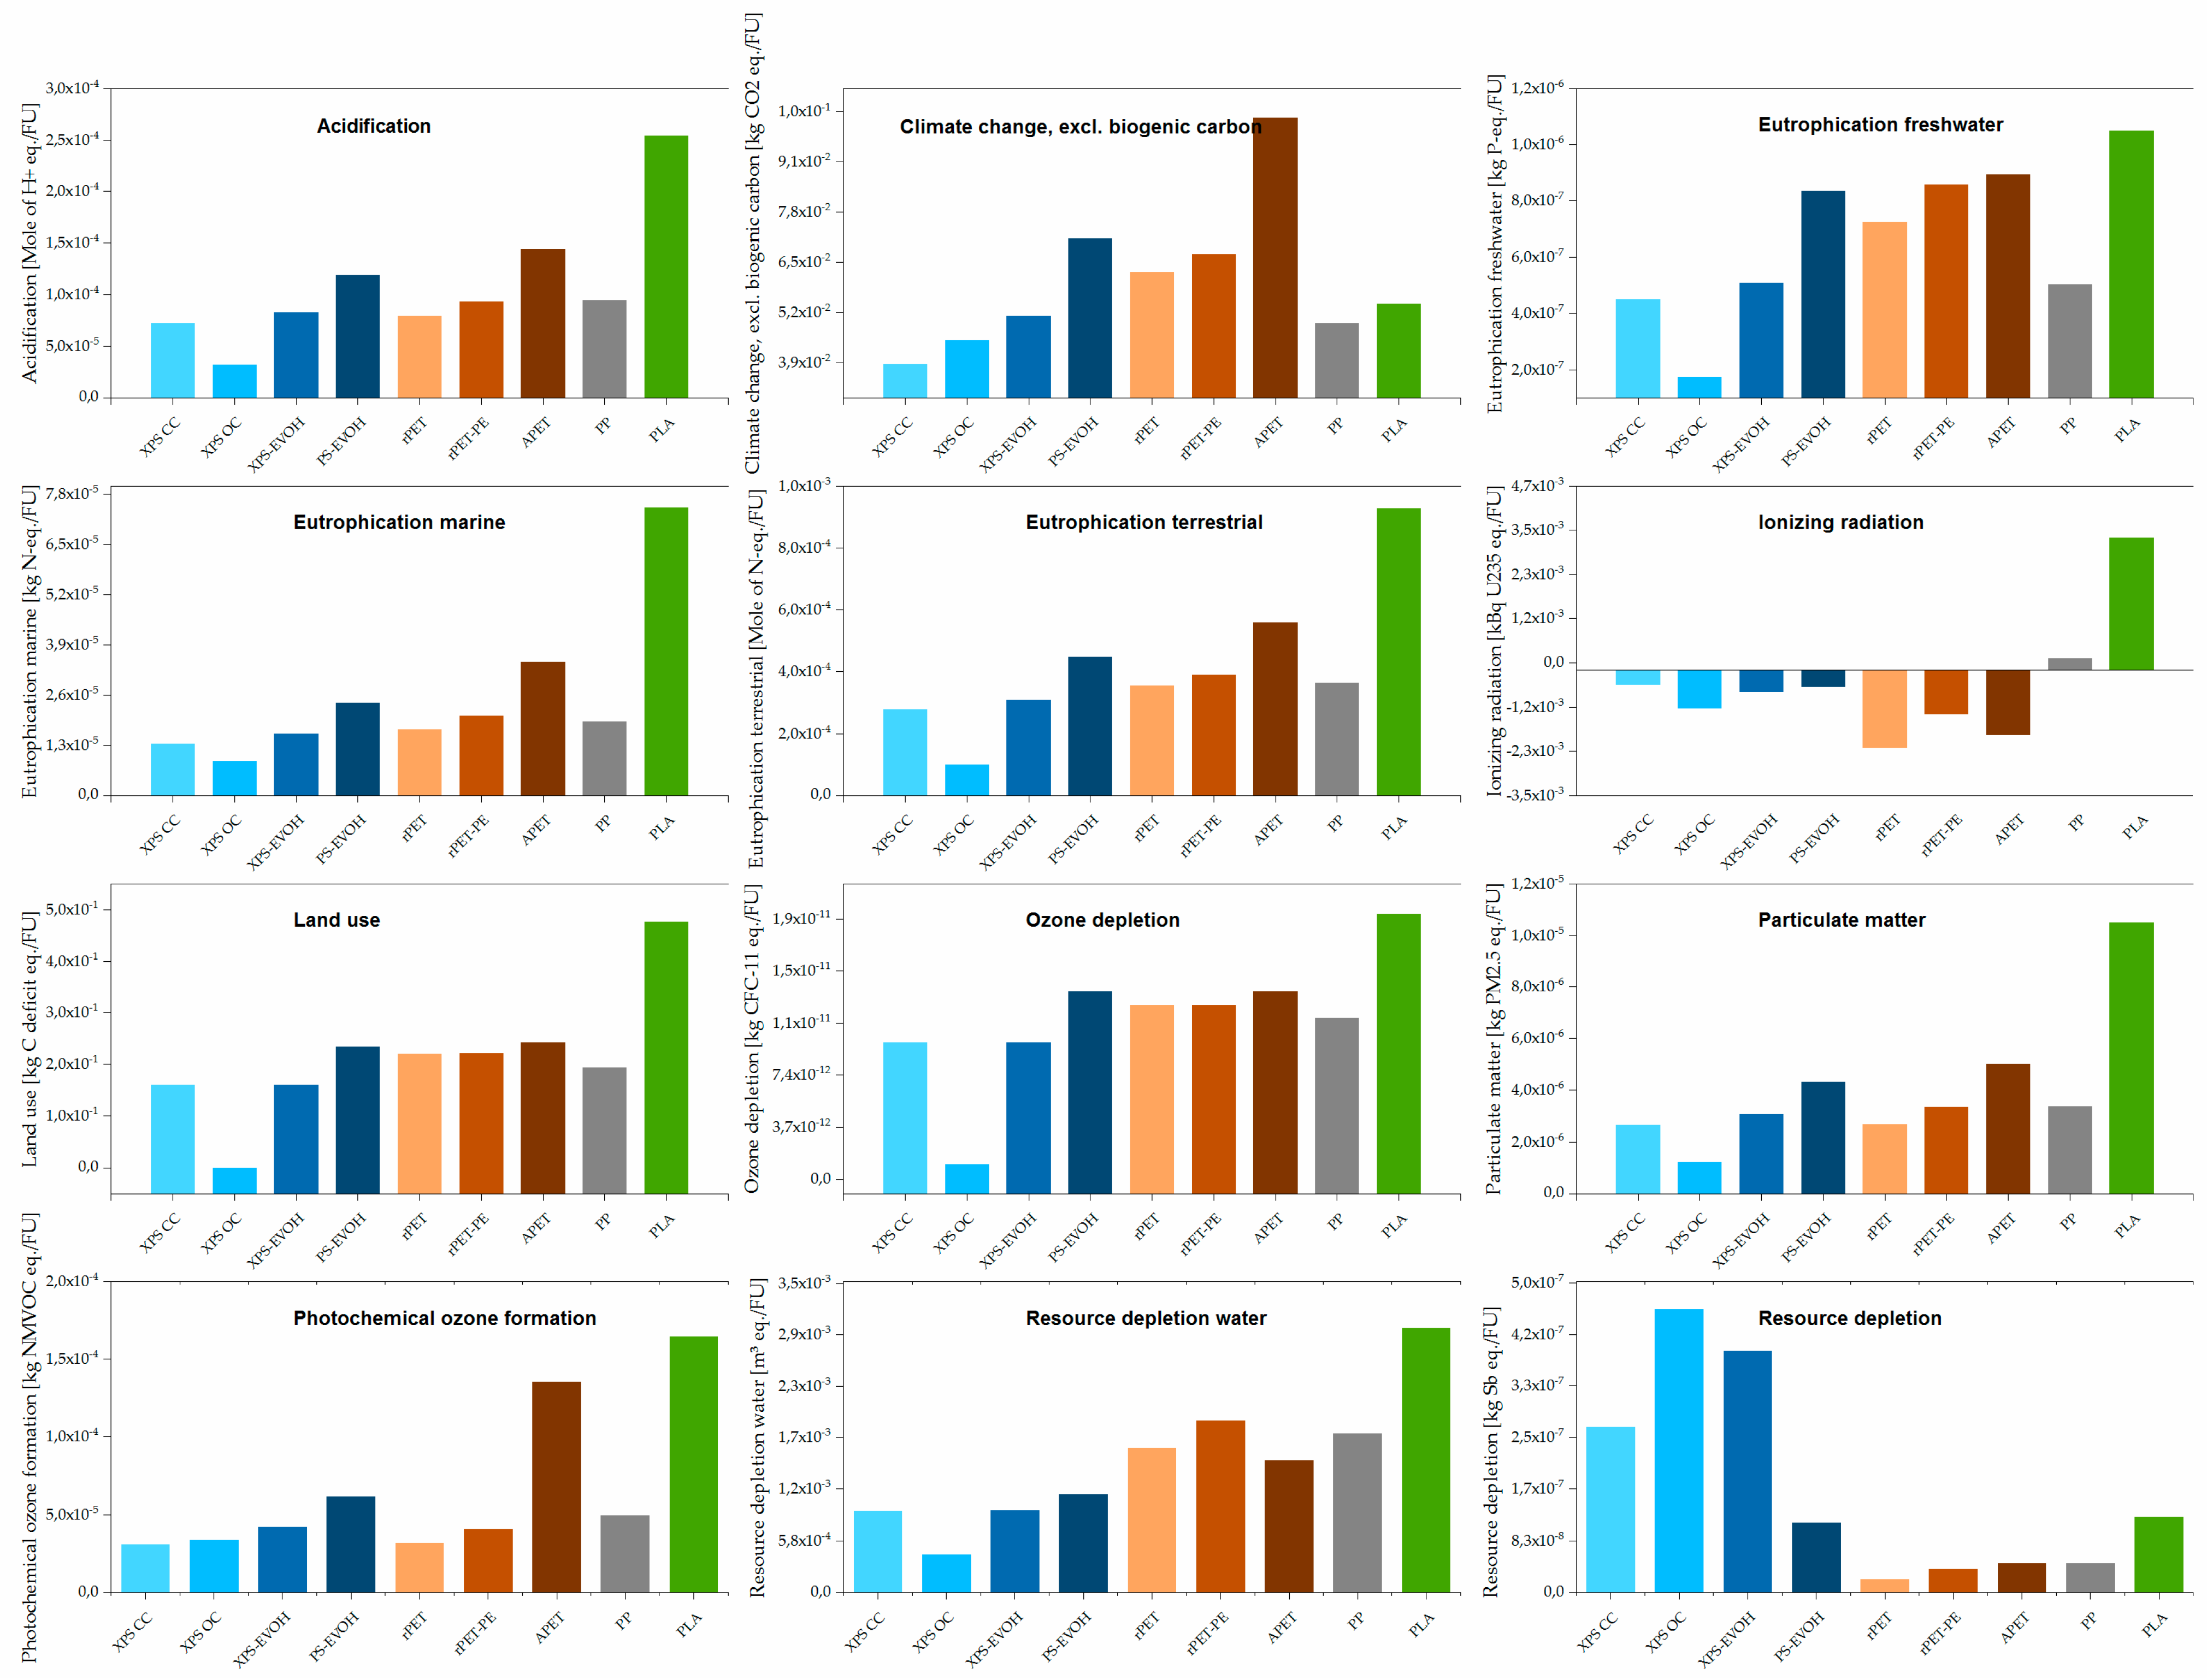
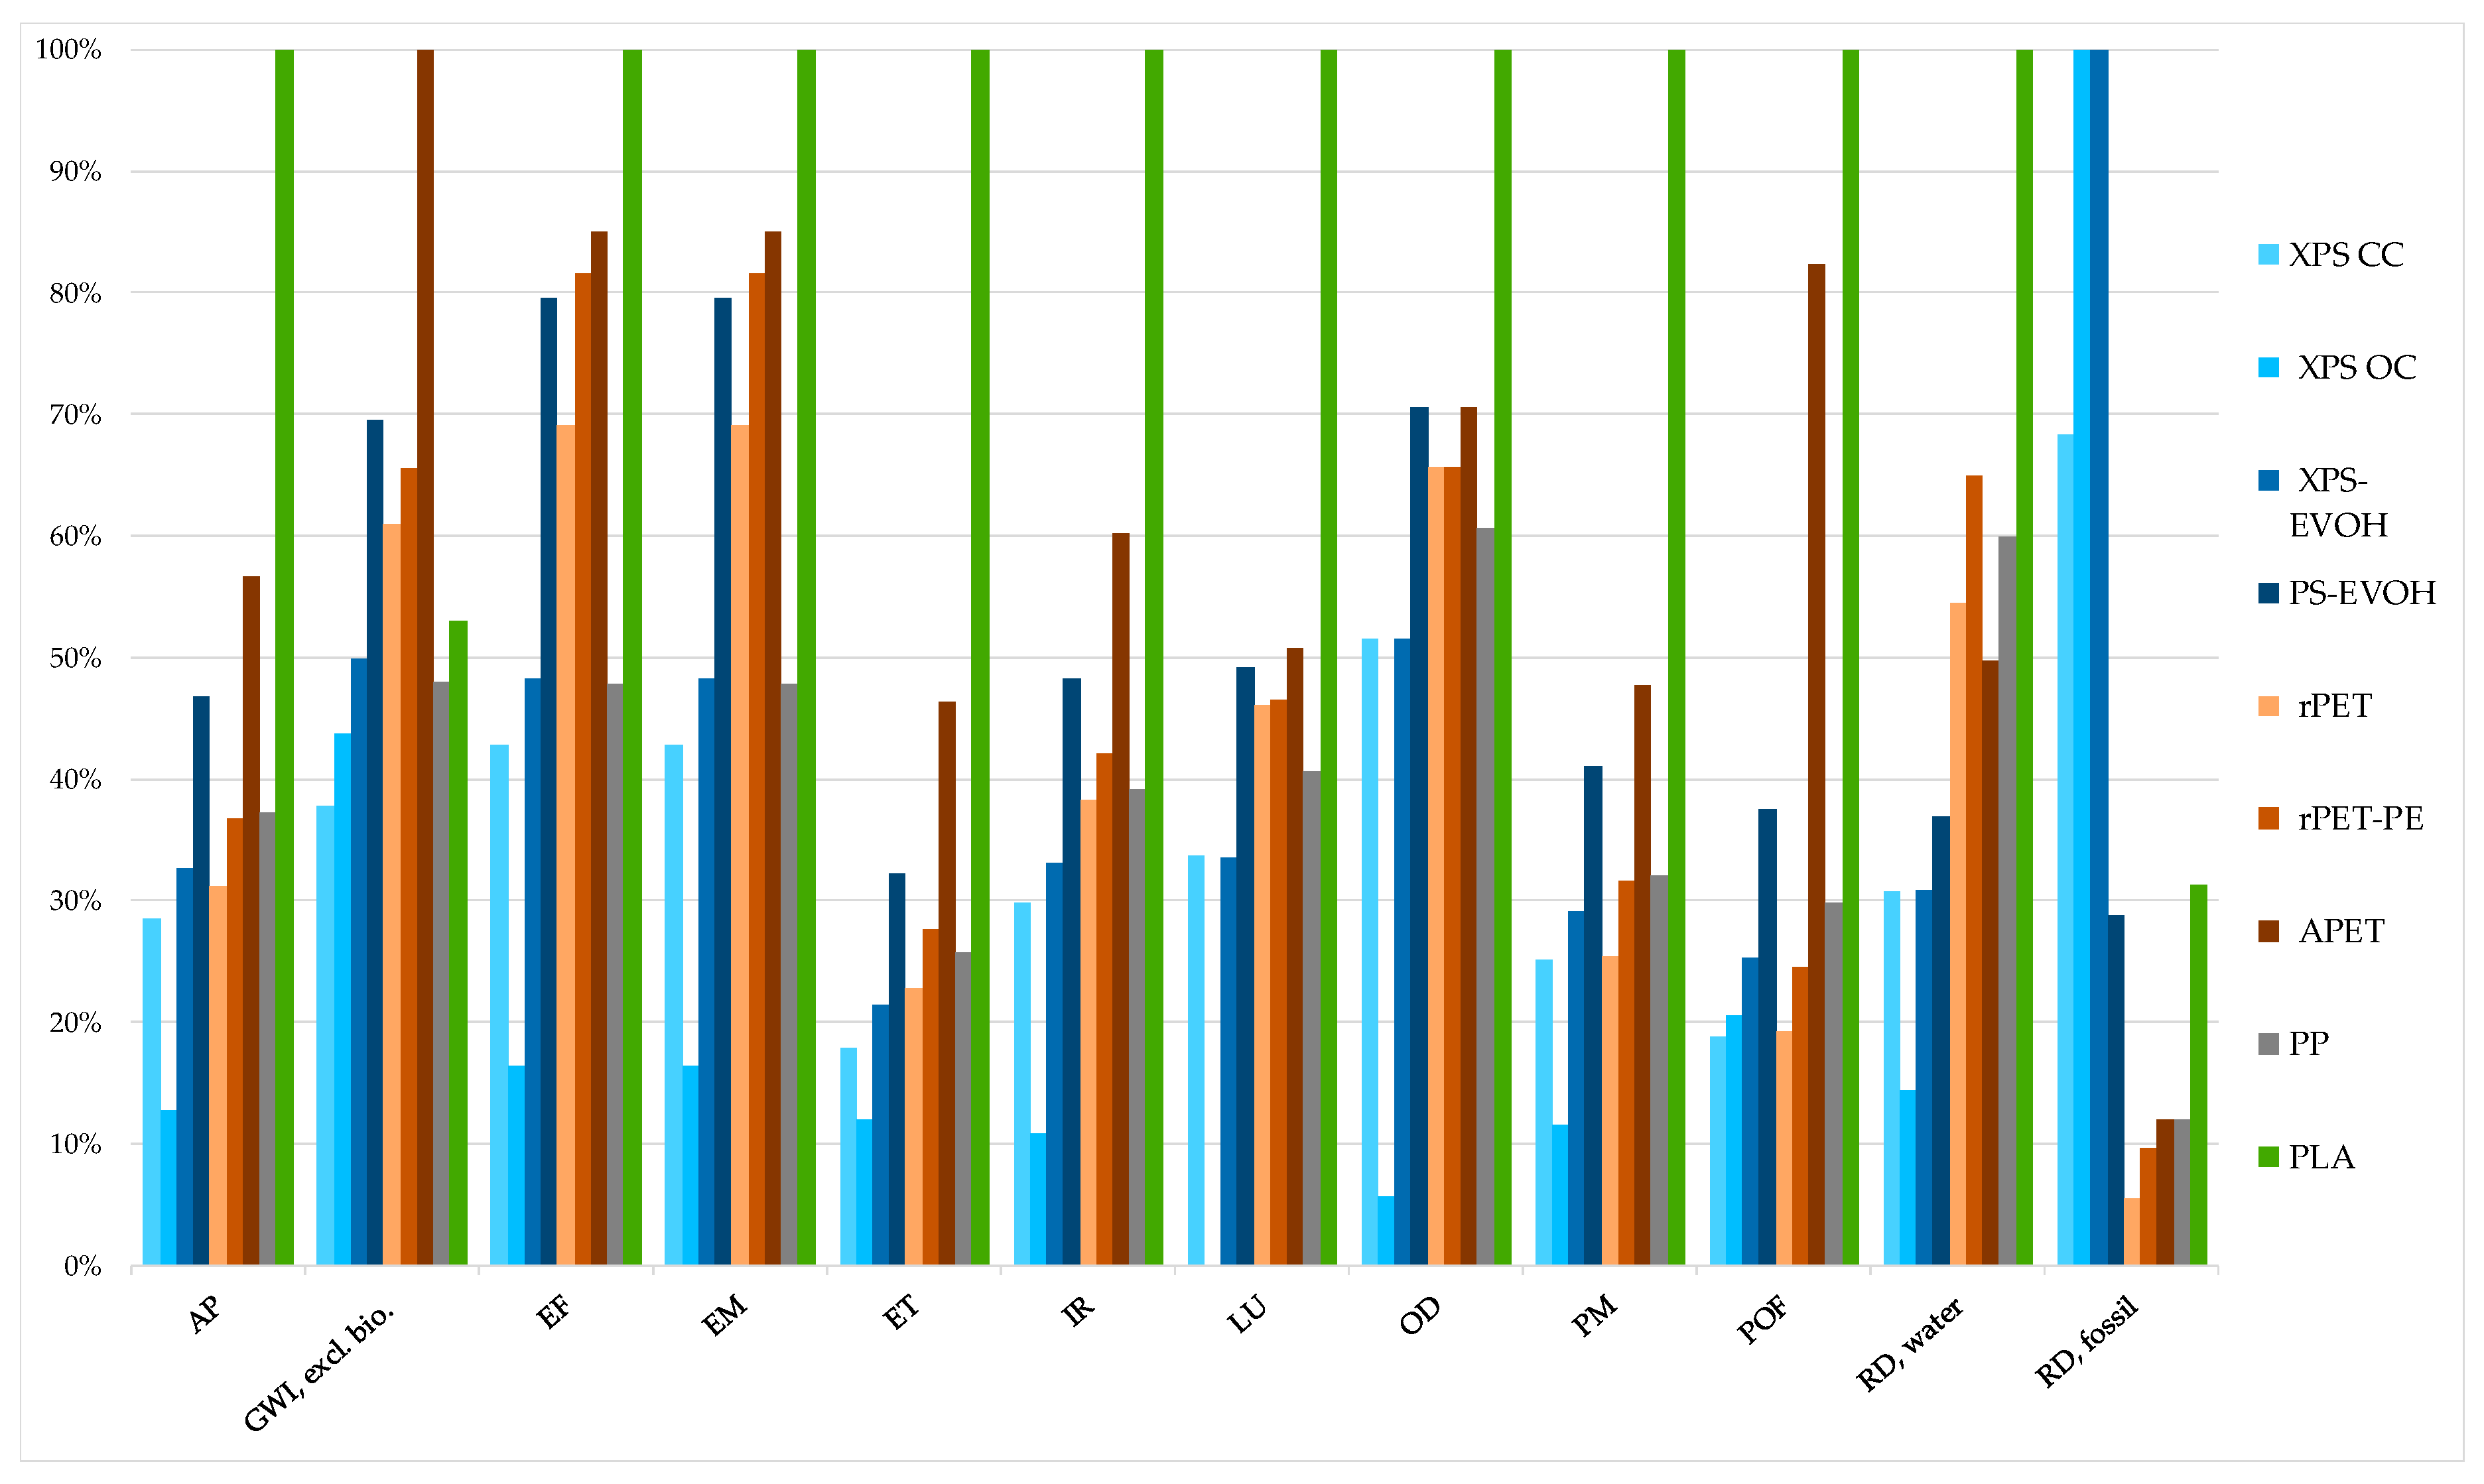
3.1. Life Cycle Impact Assessment

The carbon footprint (greenhouse gas (GHG) emissions excluding biogenic carbon) of the nine tray alternatives are presented in Figure 3. To increase transparency, the net GHG emissions per tray are visualised (marked as diamonds). To improve the readability of the bar chart, the footprint of the process “credit residues” is not displayed individually but is included in the footprint of the process “polymer production”. Here, the carbon footprint of polymer production considers both the reduction of the footprint by closed-loop recycling (internal recycling) and the credits considered for open-loop recycling (external recycling).
When analysing XPS based trays, the tray made of XPS (closed cells) shows the lowest carbon footprint (0.039 kg CO2-eq./tray) followed by the XPS tray with open cells (0.045 kg CO2-eq./tray). The PS-based multilayer alternatives XPS-EVOH and PS-EVOH show a higher carbon footprint: 0.051 and 0.071 kg CO2-eq./tray, respectively.
When analysing PET based trays, the APET-based tray shows the highest carbon footprint with 0.103 kg CO2-eq./tray. The use of recycled PET (rPET) instead of virgin PET (APET) allows reducing the carbon footprint by approximately 40%. In comparison, the mono-material rPET performs better (0.063 kg CO2-eq./tray) than the multilayer alternative rPET-PE (0.067 kg CO2-eq./tray).
Finally, the trays made of PP and PLA show a similar carbon footprint (0.049 and 0.054 kg CO2-eq./tray). For the case of PLA, the biogenic carbon is not accounted for since the amount of CO2 incorporated in PLA is released to the atmosphere by thermal treatment during the EoL stage.
In the case of PLA, in the EoL stage, GHG savings are realised from energy recovery in a municipal solid waste incinerator (MSWI), as the savings realised by the substitution of fossil energy exceed the direct GHG emissions during the incineration. In all other cases, GHG emissions from EoL treatment exceed possible savings from recycling or energy recovery. Consequently, inclusion of the EoL stage shows net GHG emissions (marked as diamond) for each tray type.
The polymer production (in the form of granulates) and the GHG emissions from EoL treatment mostly contribute to the total GHG emissions. The polymer production contributes between 25% (for rPET) and 63% (for PLA) to the overall GHG emissions. In the case of multilayer solutions, the process “multilayer production and transport” needs to be attributed to polymer production. The EoL stage contributes to a 11% savings (for PLA) and 38% burdens (for rPET) towards the product carbon footprint.
Apart from polymer production and EoL treatment, the extrusion process, in particular in the case of PET-based trays, shows a significant contribution to the overall carbon footprints. Although the absorption pad weights only about 2 g, its impact on climate change is also notable. Thermoforming, additives, auxiliaries, recycling of residues, storage of produced product rolls, lamination, packaging and transportation also play a minor role regarding climate change.
Apart from the global warming impact, several other impact categories were investigated. Figure 4 summarises all the environmental impacts for the investigated tray solutions. In the case of acidification, a similar pattern of environmental impacts was observed as that found for global warming. Wherein, XPS mono-material solutions perform better than PP and PET solutions, while PLA shows the highest impacts. The lowest acidification impact is observed for the XPS OC tray. One reason is that the production of the absorption pad notably influences the acidification results, as shown in Figure S2 in the SM. In particular, relevant contributions to the acidification potential result from the cotton fibre production used for the absorption pad.
The results for freshwater eutrophication perform similar to those for acidification. Here again, beside impacts caused by the EoL treatment and the polymer production, the cotton production for the absorption pad mainly influences the results. Accordingly, XPS OC shows the lowest impacts on freshwater eutrophication. With regard to marine and terrestrial eutrophication, lowest impact result from XPS solutions followed by PP, PET and PLA.
When analysing the impact on ionising radiation, all tray solutions show negative impacts except for trays made from PP and PLA. The negative impacts result from credits given for energy recovery in the EoL treatment. Impacts on ionising radiation mainly emerge from nuclear power generation which is part of the electricity grid mix. Consequently, notable contributions result from extrusion and thermoforming processes which consume electricity. In the case of PLA trays, energy recovery from EoL treatment is smaller than the energy recovery from other plastics. This is because PLA has a lower heating value (17.9 MJ/kg) compared to other plastics (PS, PP and PET with ~39, ~31 and ~22 MJ/kg respectively).
Land use is mainly driven by two aspects: production of cotton for the absorption pad and the production of corn for producing PLA. Accordingly, XPS OC performs best followed by all others tray solutions except of PLA which performs the worst.
In the case of ozone depletion, there are very low impacts caused by any of the investigated meat tray solutions. XPS OC shows the lowest impact since the absorption pad production mainly contributes to the ozone depletion potential. However, PLA production shows higher impacts compared to PS-, PP- or PET-based trays.
Particulate matter can result, e.g., from transportation processes or agricultural activities, which is why again the lowest impact is from XPS OC which does not require an absorption pad (cotton production). Since the production of PLA requires additional agricultural activities and goes along with longer transportation distances (PLA is provided by NatureWorks LLC, Minnetonka, MN, USA), the highest impacts of particulate matter are calculated for the PLA tray. PET-based trays and the PP tray show slightly higher impacts compared to XPS-based mono material trays. XPS-EVOH and PS-EVOH perform similarly to PET-based trays and the PP tray. As highlighted in Figure S3 in the SM, apart from agricultural activities and transportation, polymer production, electricity for extrusion as well as thermoforming contribute to the overall impacts.
With regard to photochemical ozone formation, XPS and rPET show the lowest impacts. Higher impacts were observed for APET and PLA. In both cases, the polymer production was mainly responsible for the higher impacts.
Looking at water depletion, the PS-based trays perform best. Water depletion can be traced back in particular to agricultural activities (irrigation for corn production required as feedstock for PLA, cotton production for absorption pad) and the electricity generation needed in particular for extrusion and thermoforming.
Finally, resource depletion addresses the decreasing expected lifetime of worldwide resources and reserves due to the extraction of resources. The life cycle impact assessment (LCIA) results are shown in Figure 4. The highest impacts were calculated for XPS-based trays due to the use of talcum (mining of talc) and titanium dioxide (mining of ilmenite). The production of EVOH also contributes to resource depletion, as visualised in Figure S4 in the SM. The use of fossil raw materials for electricity generation leads to resource depletion, too. Consequently, electricity consuming processes such extrusion and thermoforming also contribute to fossil depletion. However, the recovery of energy in a MSWI at the EoL yields credits as resources for power generation, primarily from fossil fuels, can be saved elsewhere.
To compare the relative advantageousness of the nine different tray solutions, the highest observed impact was set to 100%. Figure 5 compares different tray solutions concerning their relative environmental performance. In comparison, XPS OC shows the lowest impacts in most of the investigated impact categories and PLA the highest. PET-based trays perform worse than XPS trays across all investigated impact categories except for resource depletion. When comparing APET to rPET to rPET-PE, APET performs worst followed by rPET-PE and rPET. The comparison between XPS and PP shows lower impacts from XPS except in the case of resource depletion. The reason for the high impacts of XPS towards the impact category resource depletion is driven by the use of additives, namely talcum (mining of talc) and titanium dioxide (mining of ilmenite).

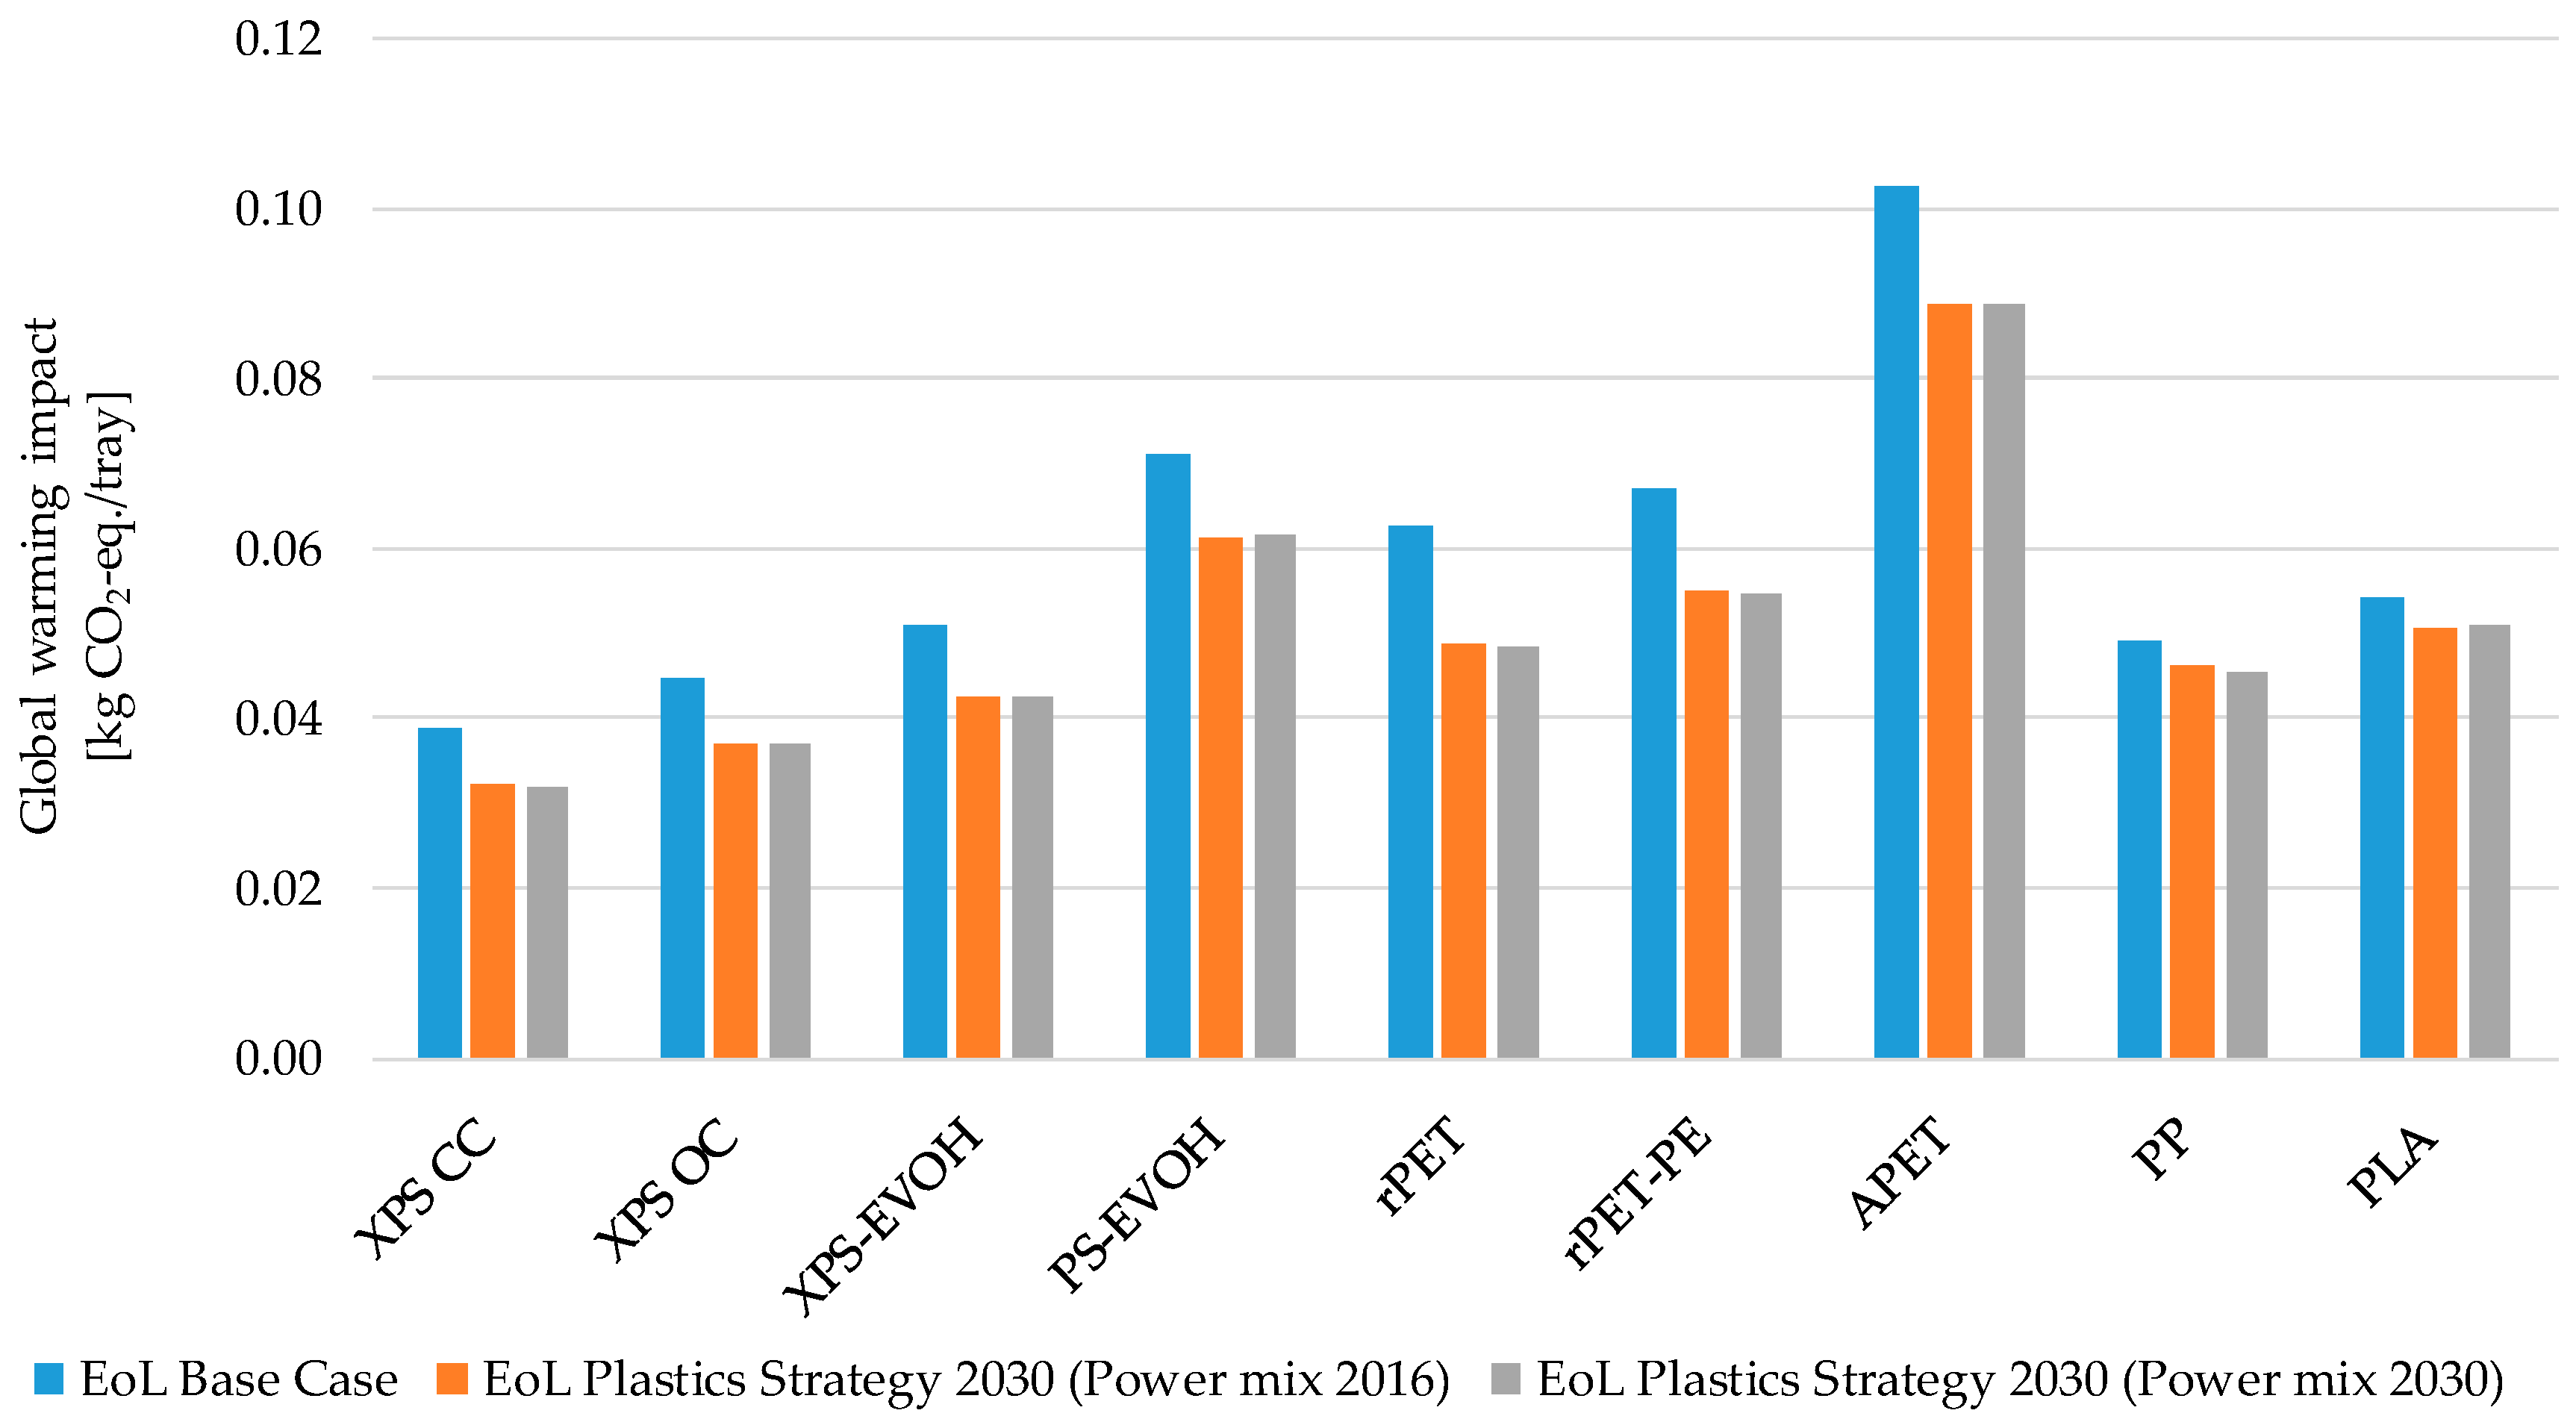
3.2. Sensitivity Analysis on End-Of-Life

By 2030, the European Commission demands an increase in recycling of plastics. The mass-based recycling target is expected to be 55% and landfill is limited to 10%. Consequently, the remaining fraction of 35% would be incinerated. Considering this EoL scenario (EoL Plastics Strategy 2030) for all trays, except for PLA where 100% incineration was assumed, the carbon footprint decreases, as shown in Figure 6 in comparison to the base case scenario (year 2018). The benefits towards the reduction of global warming impact when considering the European Plastics Strategy scenario lies between 6% (for PLA) and 22% (for rPET). Furthermore, when changing the background data for electricity generation to reflect the electricity mix for 2030 in Europe, the results were similar (orange vs. grey bars in Figure 6). In this case, the reduction of environmental impacts caused by the production of trays through the use of “greener” power offset the reduction of savings realised by energy recovery at their EoL.
However, environmental impacts might also increase in other impact categories. Table 4 shows the improvements or savings (negative numbers) and also the increase in environmental impacts (positive numbers). Savings are mainly achieved in two impact categories: global warming and freshwater eutrophication. In the case of ozone depletion, no differences occur as a consequence of the change of EoL pathways, as the EoL only accounts for a small contribution, and furthermore incineration of PLA is environmentally beneficial compared to landfilling due to energy recovery [33]. For PLA, most of the investigated environmental impacts decrease. In the case of ionising radiation, savings calculated in the base case scenario switch to emissions due to less energy recovery along with the substitution of nuclear power. This change of sign is symbolised by “>” in Table 4.

4. Discussion

4.1. Discussions of Results

The LCIA results reveal that meat trays made from XPS OC show the lowest impacts in most of the investigated impact categories while trays made from PLA have the highest. In general, foam solutions (XPS trays) allow for reducing the material demand which dominates the LCIA results. In addition, XPS-based trays weigh less than PP-, PLA- and PET-based trays. Consequently, all of these materials perform worse than XPS trays across all investigated impact categories except for resource depletion. Multilayer-solutions do not allow for material reductions compared to mono-material solutions and are difficult to recycle and therefore show higher environmental impacts. These disadvantages are also reflected by the LCIA results. Hence, mono-material solutions should be preferred upon multilayer solutions.
The use of recyclates as starting material for tray production allows for the reduction of environmental impacts. Accordingly, rPET shows lower environmental impacts compared to APET. Principally, PS-based trays might also be also produced from recycled PS [35,36]. This case was not investigated within this study since there is no recycled PS for food applications on the market. However, we expect lower impacts for trays made from recycled PS. To realise these savings, we encourage the industry to speed up developments for the recycling of styrenic waste streams. Trays made of PLA show high environmental impacts except for global warming. This is partly due to the higher weight of the rigid design and partly due to the burdens from agricultural operations. The alleged benefit of compostability does not offer any environmental advantages since composting of PLA is the worst EoL option compared to recycling or thermal treatment [33]. Moreover, since meat trays are normally not littered but collected by the waste disposal system, compostability is not applicable for this application. The contribution analysis show that the EoL stage has an important influence on the environmental performance of trays but that the production of the tray dominates the overall results. Furthermore, the sensitivity analysis illustrated that, even if higher recycling rates were realised in the future, XPS solutions would still perform best from an environmental perspective.
Similar results were found in other studies investigating PS based take away food containers. According to Gallego-Schmid et al. [21], extruded polystyrene containers have the lowest environmental impacts compared to food containers made from aluminium or PP. This is mainly because of the lower material and electricity demand for their production. In the case of packaging for vegetables and fruits, Belley found that trays made from XPS and moulded pulp have the best overall performances while trays made from PLA, PET and PP perform the worst [17].

4.2. Limitations of the Study

The scope of the conducted study only focused on the direct environmental impact of the tray itself and not its content (meat). As investigated by Wikström et al. [16], food waste might also be influenced by packaging solutions. Environmental impacts caused by meat are much higher compared to that from packaging and can be around 20 kg CO2-eq./500 g in the case of US beef [37]. Secondly, the choice of tray material and tray design influences the shelf life of meat and therefore could be a relevant aspect. However, other aspects such as the type of tray sealing or storage conditions are also important regarding shelf life. The consideration of these excluded aspects (indirect environmental impacts of packaging) might lead to different results [38].
In this study, only meat trays already on the market were analysed. In particular, innovative designs might help to decrease the environmental footprint of meat trays. For example, Footprint International LLC offers pulp-based meat trays [39]. However, although pulp-based materials might offer a good environmental performance, it needs to be analysed whether the application of chemicals to achieve water, oil and water vapor barriers such as fluorine containing emulsions leads to environmental hazards.
The scope of this study and therewith the analysed results for various tray solutions refer to European consumption with focus on Germany and Italy as production sites. Depending on the local conditions such as the national electricity mix, the environmental performance of the tray solutions can be different in other countries.
Finally, the results as presented within this study are influenced by the selected background data, which are shown in Table S2 in the SM. The use of other datasets or possible future updates of datasets can lead to different results. For this reason, the results are exclusively valid for the chosen background data and point in time.

4.3. Implications of the Study

In the framework of the European Strategy for Plastics in a Circular Economy [40], the European Joint Research Centre (JRC) explored innovative materials and alternative feedstock for plastics production. The study clearly shows that they are more sustainable options compared to traditional fossil-based feedstock [41]. Besides bioplastics or plastics made from CO2 (CO2-methanol-olefin route), recycled plastics in particular promise a better environmental performance. Nonetheless, case-by-case investigations should be conducted to examine which production, design and EoL strategies can reduce the overall environmental impact.
Furthermore, the JRC study has also identified a series of plastic products that need further scientific investigation from an LCA perspective [41]. According to this study, amongst other plastic products the environmental impact of diverse packaging trays should be comprehensively assessed. We hope the LCA results and its interpretation presented in this paper contribute to the ongoing discussions.
Finally, although CE strategies can improve the environmental performance of products, the improvement potential for short-life products such as food packaging trays is rather limited compared to products with longer lifespan. This is because, the biggest improvements of employing CE strategies are typically realised in the use stage, e.g., by the extension of the use-stage by reuse, refurbish, repair, etc. However, in the case of short-life products, it should be carefully weighed whether environmental benefits through recycling outweigh benefits of low material demands (e.g., as achieved by foamed plastics).
In conclusion, there are several initiatives, actions and strategies within the EU and globally that aim to address the plastic waste problem. Nonetheless, it is unclear whether these strategies will contribute to overall sustainability or present an enhanced industrialised vision for recycling. This LCA study clearly shows that, in the case of meat packaging trays, the net benefits derived primarily from low plastic demand for the tray production outweigh possible benefits from their recycling.

Supplementary Materials

The following are available online at https://www.mdpi.com/2071-1050/11/19/5324/s1, Figure S1: LCA model in the GaBi-software, Figure S2: Contribution analysis of acidification for all investigated tray solutions, Figure S3: Contribution analysis of particulate matter for all investigated tray solutions, Figure S4: Contribution analysis of resource depletion for all investigated tray solutions, Table S1: General assumptions of EoL treatment pathways in different regions for base case scenario (2018), Table S2: Background data taken to model material and energy demands.

Author Contributions

D.M. was mainly responsible for the funding acquisition, project administration, conceptualisation, development of methodology, application of LCA model in software, validation of results, visualisation of results and writing (original draft preparation). M.H. supported the funding acquisition, project administration, conceptualisation, review and editing. V.A. supported literature research, validation and visualisation of results, the writing of the draft, reviewing and editing.

Funding

This research was funded in part by the Fraunhofer-Gesellschaft (project no. 097/441/2018-11), with sponsored research agreement with industry partner silver plastics® GmbH & Co. KG, Germany and Sirap Gema SpA, Italy.

Acknowledgments

The life cycle analysis presented in this paper stems from the research conducted for the project “A comparative life cycle assessment of meat trays made of various packaging materials”. The LCA study was critically reviewed by one external reviewer, namely Niels Jungbluth, CEO of ESU-services GmbH, Switzerland.

Conflicts of Interest

The authors declare no conflict of interest. The funders had no role in the design of the study; analyses, or interpretation of data; in the writing of the manuscript, or in the decision to publish the results. However, primary was provided by the funder and was validated by the authors.

References

  1. Geyer, R.; Jambeck, J.R.; Law, K.L. Production, use, and fate of all plastics ever made. Sci. Adv. 2017, 3, e1700782. [Google Scholar] [CrossRef] [PubMed]
  2. EU. A European Strategy for Plastics in A Circular Economy; EU: Brussels. Available online: https://ec.europa.eu/environment/circular-economy/pdf/plastics-strategy-brochure.pdf (accessed on 25 September 2019).
  3. van Eygen, E.; Laner, D.; Fellner, J. Circular economy of plastic packaging: Current practice and perspectives in Austria. Waste Manag. 2018, 72, 55–64. [Google Scholar] [CrossRef] [PubMed]
  4. Directive (EU) 2018/ of the European Parliament and of the Council of 30 May 2018 /62/EC on Packaging and Packaging Waste. Available online: https://eur-lex.europa.eu/legal-content/EN/TXT/PDF/?uri=CELEX:32018L0852&from=EN (accessed on 25 September 2019).
  5. VerpackG. Law on the Development of Close-To-Home Collection of Recyclable Waste. Berlin, Germany. Available online: https://www.bgbl.de/xaver/bgbl/start.xav?start=//*%5b@attr_id=%27%27%5d#__bgbl__%2F%2F*%5B%40attr_id%3D%27bgbl117s2234.pdf%27%5D__1499860922556 (accessed on 25 September 2019).
  6. EMF. Towards the Circular Economy Vol. 1: Economic and Business Rationale for an Accelerated Transition. 2013. Available online: https://www.ellenmacarthurfoundation.org/assets/downloads/publications/Ellen-MacArthur-Foundation-Towards-the-Circular-Economy-vol.1.pdf (accessed on 25 September 2019).
  7. Ranta, V.; Aarikka-Stenroos, L.; Ritala, P.; Mäkinen, S.J. Exploring Institutional Drivers and Barriers of the Circular Economy: A Cross-Regional Comparison of China, the US, and Europe. Available online: https://reader.elsevier.com/reader/sd/pii/S0921344917302653?token=64681B3F1C62A2BAF4FB1A25C0B1D1A4B46B7C8E916C096E85617590D20140F32CDF5FBC53098EB6399A82BB48775ECE (accessed on 8 September 2019).
  8. Eriksen, M.K.; Damgaard, A.; Boldrin, A.; Astrup, T.F. Quality Assessment and Circularity Potential of Recovery Systems for Household Plastic Waste-Eriksen-2019-Journal of Industrial Ecology-Wiley Online Library//Quality Assessment and Circularity Potential of Recovery Systems for Household Plastic Waste. J. Ind. Ecol. 2019, 23, 156–168. [Google Scholar] [CrossRef]
  9. Zink, T.; Geyer, R. Circular Economy Rebound-Zink-2017-Journal of Industrial Ecology-Wiley Online Library//Circular Economy Rebound. J. Ind. Ecol. 2017, 21, 593–602. [Google Scholar] [CrossRef]
  10. Haupt, M.; Zschokke, M. How can LCA support the circular economy?—63rd discussion forum on life cycle assessment, Zurich, Switzerland, November 30, 2016. Int. J. Life Cycle Assess. 2017, 22, 832–837. [Google Scholar] [CrossRef]
  11. Korhonen, J.; Honkasalo, A.; Seppälä, J. Circular Economy: The Concept and its Limitations. Ecol. Econ. 2018, 143, 37–46. [Google Scholar] [CrossRef]
  12. Dinkel, F.; Kägi, T. Ökobilanz Getränkeverpackung. 2014. Available online: https://carbotech.ch/cms/wp-content/uploads/Carbotech-LCA-Getraenkeverpackung-2014.pdf (accessed on 6 August 2018).
  13. Marsh, K.; Bugusu, B. Food packaging—Roles, materials, and environmental issues. J. Food Sci. 2007, 72, R39–R55. [Google Scholar] [CrossRef] [PubMed]
  14. Whyte, C. Costa Rica Is Banning the Use of Polystyrene Packaging from 2021. Available online: https://www.newscientist.com/article/2210341-costa-rica-is-banning-the-use-of-polystyrene-packaging-from-2021/ (accessed on 8 May 2019).
  15. Rozenstein, O.; Puckrin, E.; Adamowski, J. Development of a new approach based on midwave infrared spectroscopy for post-consumer black plastic waste sorting in the recycling industry. Waste Manag. 2017, 68, 38–44. [Google Scholar] [CrossRef]
  16. Wikström, F.; Williams, H.; Venkatesh, G. The influence of packaging attributes on recycling and food waste behaviour—An environmental comparison of two packaging alternatives. J. Clean. Prod. 2016, 137, 895–902. [Google Scholar] [CrossRef]
  17. Belley, C. Comparative Life Cycle Assessment Report of Food Packaging Products. 2011. Available online: https://www.cascades.com/media/multiuploader_images/6/12/41/LCAFoodPackagingProducts.pdf (accessed on 2 August 2019).
  18. Ingrao, C.; Lo Giudice, A.; Bacenetti, J.; Mousavi Khaneghah, A.; Sant’Ana, A.S.; Rana, R.; Siracusa, V. Foamy polystyrene trays for fresh-meat packaging: Life-Cycle inventory data collection and environmental impact assessment. Food Res. Int. 2015, 76, 418–426. [Google Scholar] [CrossRef]
  19. Ingrao, C.; Gigli, M.; Siracusa, V. An attributional Life Cycle Assessment application experience to highlight environmental hotspots in the production of foamy polylactic acid trays for fresh-food packaging usage. J. Clean. Prod. 2017, 150, 93–103. [Google Scholar] [CrossRef]
  20. Suwanmanee, U.; Varabuntoonvit, V.; Chaiwutthinan, P.; Tajan, M.; Mungcharoen, T.; Leejarkpai, T. Life cycle assessment of single use thermoform boxes made from polystyrene (PS), polylactic acid, (PLA), and PLA/starch: Cradle to consumer gate. Int. J. Life Cycle Assess. 2013, 18, 401–417. [Google Scholar] [CrossRef]
  21. Gallego-Schmid, A.; Mendoza, J.M.F.; Azapagic, A. Environmental impacts of takeaway food containers. J. Clean. Prod. 2019, 211, 417–427. [Google Scholar] [CrossRef]
  22. Gallego-Schmid, A.; Mendoza, J.M.F.; Azapagic, A. Improving the environmental sustainability of reusable food containers in Europe. Sci. Total. Environ. 2018, 628–629, 979–989. [Google Scholar] [CrossRef] [PubMed]
  23. ISO. Environmental Management-Life Cycle Assessment-Requirements and Guidelines (ISO 14044); DIN Deutsches Institut für Normung e.V.: Berlin, Germany, 2006. [Google Scholar]
  24. ISO. Environmental Management-Life Cycle Assessment-Principles and Framework: ISO 14040:2006; Beuth Verlag GmbH: Berlin, Germany, 2009; 13.020.10 (14040). [Google Scholar]
  25. Gontia, P. Life Cycle Assessment of Bio-Based Sodium Poly-Acrylate Production from Pulp Mill Side Streams-Case at A TMP and Sulphite Pulp Mill; Chalmers University of Technology: Gothenburg, Sweden, 2014. [Google Scholar]
  26. Thinkstep, A.G. Gabi ts 9.0: Database for Life Cycle Engineering. 2019. Available online: http://www.gabi-software.com/international/support/gabi/gabi-lcia-documentation/environmental-footprint-efilcd-recommendation/ (accessed on 1 July 2019).
  27. JRC. ILCD Handbook: Recommendations for Life Cycle Impact Assessment in the European Context-Based on Existing Environmental Impact Assessment Models and Factors; JRC: Tokyo, Japan, 2011. [Google Scholar]
  28. Plastics Europe. Plastics-the Facts 2017. 2017. Available online: https://www.plasticseurope.org/application/files/5715/1717/4180/Plastics_the_facts_2017_FINAL_for_website_one_page.pdf (accessed on 25 September 2019).
  29. Bertoluci, G.; Leroy, Y.; Olsson, A. Exploring the environmental impacts of olive packaging solutions for the European food market. J. Clean. Prod. 2014, 64, 234–243. [Google Scholar] [CrossRef]
  30. Conversio. Material Flow Analysis Plastics in Germany 2017. Available online: https://www.bvse.de/images/news/Kunststoff/2018/181011_Kurzfassung_Stoffstrombild_2017.pdf (accessed on 25 September 2019).
  31. Kaiser, K.; Schmid, M.; Schlummer, M. Recycling of Polymer-Based Multilayer Packaging: A Review. Recycling 2018, 3, 1. [Google Scholar] [CrossRef]
  32. Jelse, K. Packaging Product Category Classification: Multiple CPC. Draft Version for Open Consultation. 2018. Available online: https://www.environdec.com/PCR/Detail/?Pcr=13818 (accessed on 2 January 2019).
  33. Maga, D.; Hiebel, M.; Thonemann, N. Life cycle assessment of recycling options for polylactic acid. Resour. Conserv. Recycl. 2019, 149, 86–96. [Google Scholar] [CrossRef]
  34. European Commission. EU Energy, Transport and GHG Emissions-Trends to 2050-Reference Scenario 2013. 2013. Available online: https://ec.europa.eu/transport/sites/transport/files/media/publications/doc/trends-to-2050-update-2013.pdf (accessed on 12 August 2019).
  35. Schlummer, M.; Maeurer, A.; Wagner, S.; Berrang, A.; Fell, T.; Knappich, F. Recycling of flame retarded waste polystyrene foams (EPS and XPS) to PS granules free of hexabromocyclododecane (HBCDD). Adv. Recycl. Waste Manag. 2017, 2, 1–6. [Google Scholar] [CrossRef]
  36. Gutiérrez, C.; Rodríguez, J.F.; Gracia, I.; de Lucas, A.; García, M.T. Reduction of the carbon footprint through polystyrene recycling: Economical evaluation. Process. Saf. Environ. Prot. 2016, 101, 144–151. [Google Scholar] [CrossRef]
  37. Asem-Hiablie, S.; Battagliese, T.; Stackhouse-Lawson, K.R.; Alan Rotz, C. A life cycle assessment of the environmental impacts of a beef system in the USA. Int. J. Life Cycle Assess. 2019, 24, 441–455. [Google Scholar] [CrossRef]
  38. Molina-Besch, K.; Wikström, F.; Williams, H. The environmental impact of packaging in food supply chains—Does life cycle assessment of food provide the full picture? Int. J. Life Cycle Assess. 2019, 24, 37–50. [Google Scholar] [CrossRef]
  39. Chung, Y.D.; Moore, B.M.; Zhang, Y. US 2018/0029767 A1: Methods and Apparatus for Manufacturing Fiber-Based Meat Containers. 2018. Available online: https://patents.google.com/patent/US20180029764A1/en (accessed on 25 September 2019).
  40. European Commission. COM 28 Final: Communication from the Commission to the European Parliament, the Council, the European Economic and Social Committee and the Committee of the Regions. A European Strategy for Plastics in a Circular Economy. 2018. Available online: https://eur-lex.europa.eu/resource.html?uri=cellar:2df5d1d2-fac7-11e7-b8f5-01aa75ed71a1.0001.02/DOC_1&format=PDF (accessed on 14 August 2019).
  41. Nessi, S.; Bulgheroni, C.; Konti, A.; Sinkko, T.; Tonini, D.; Pant, R. Environmental Sustainability Assessment Comparing through the Means of Lifecycle Assessment the Potential Environmental Impacts of the Use of Alternative Feedstock (biomass, recycled plastics, CO2) for Plastic Articles in Comparison to Using Current Feedstock (Oil and Gas). Draft Report for Stakeholder Consultation (Part 2). 2018. Available online: https://eplca.jrc.ec.europa.eu/permalink/PLASTIC_LCI/Plastic_LCA_Report%20II_2018.11.20.pdf (accessed on 8 September 2019).
Figure 1. Illustration of the investigated meat trays (absorption pad is not shown in all cases).
Sustainability 11 05324 g001
Figure 2. Flow diagram of the investigated system “cradle-to-gate with EoL”.
Sustainability 11 05324 g002
Figure 3. Carbon Footprint of investigated trays.
Sustainability 11 05324 g003
Figure 4. LCIA results for all investigated meat tray solutions.
Sustainability 11 05324 g004
Figure 5. Relative contributions of all investigated meat tray solutions (AP, acidification potential; GWI, global warming impact excluding biogenic carbon; EF, freshwater eutrophication potential; EM, marine eutrophication potential; ET, terrestrial eutrophication potential; IR, Ionising radiation potential; LU, Land use; OD, ozone layer depletion potential; PM, particulate matter potential; POF, Photochemical ozone formation potential; RD, water, resource depletion water; RD, fossil, resource depletion, mineral, fossils and renewables).
Sustainability 11 05324 g005
Figure 6. Results for global warming impact considering today’s EoL scenario (base case, Table 2) and the EoL according to the European Plastics Strategy 2030 (Table 3).
Sustainability 11 05324 g006
Table 1. Investigated meat trays (average product weights) per FU.
Product NameMaterial Weight (Without Liner) [in g]LinerMaterial Weight (With Liner 1) [in g], FUTypeFilm Structure
XPS CC6.68no6.68mono-layerfoam
XPS OC9.90no9.90mono-layerfoam
XPS-EVOH7.97yes9.13multilayerfoam
PS-EVOH11.90yes13.35multilayerrigid
APET18.50no18.50mono-layerrigid
rPET18.43no18.43mono-layerrigid
rPET-PE17.65yes19.66multilayerrigid
PP11.90no11.90mono-layerrigid
PLA13.90no13.90mono-layerrigid
1 Liners refer to the multilayered materials (such as EVOH) excluding the primary polymer (such as PS or PET).
Table 2. Shares of materials for different EoL pathways considered in the LCA study for the base case scenario (2018).
EoL PathwayMultilayer [%]Rigid PP [%]Rigid PET [%]Foamed [%]PLA [%]
Share to incineration74.845.182.775.766.8
Share to landfill25.215.317.324.333.2
Share to recycling039.7000
Table 3. EoL scenario for 2030 based on the European strategy for plastics in a circular economy in 2030.
EoL PathwayMultilayer [%]Rigid PP [%]Rigid PET [%]Foamed [%]PLA [%]
Share to incineration35353535100
Share to landfill101010100
Share to recycling555555550
Table 4. Percentage change from switching from the EoL Base Case Scenario (2018) to the European Plastics Strategy Scenario in 2030 (Power mix 2016).
Impact CategoryXPS CCXPS OCXPS-EVOHPS-EVOHAPETrPETrPET-PEPPPLA
Acidification+117%+46%+120%+115%+117%+130%+122%+109%+96%
Climate change, excluding biogenic carbon−17%−18%−17%−14%−13%−22%−18%−6%−6%
Climate change, including biogenic carbon−18%−18%−17%−15%−14%−22%−18%−7%+14%
Eutrophication freshwater−12%−37%−13%−22%−7%−8%−20%+1%−30%
Eutrophication marine+22%+40%+24%+18%+15%+31%+22%+11%−3%
Eutrophication terrestrial+10%+32%+11%+9%+9%+14%+11%+5%−2%
Ionising radiation, human health> > > > > > > +676%−23%
Land use+2%> +3%+2%+2%+2%+2%+1%0%
Ozone depletion0%0%0%0%0%0%0%0%0%
Particulate matter/Respiratory inorganics+23%+60%+26%+20%+24%+45%+31%+12%−5%
Photochemical ozone formation+24%+27%+23%+18%+10%+42%+28%+10%−3%
Resource depletion water+18%+45%+23%+21%+30%+27%+19%+6%−4%
Resource depletion+3%+2%+3%+11%+52%+112%+55%+13%−5%

