1. Introduction
As leaders in education, research, and technology, universities have a key role in the processes of social change, and development and should therefore be crucially involved in global sustainable development [
1,
2]. In fact, sustainability has become a fundamental value in university strategies [
3,
4], which can be linked to their third mission [
5]. As education institutions, they must serve as an example [
6] and promote education for sustainable development, as well as introduce active policies for achieving this goal [
7].
Sustainability assessment has been recognized as a cornerstone to achieving sustainable universities and there have been many contributions aimed at developing models and tools that can be useful for this purpose [
4,
7,
8,
9]. The development of common models can be suitable for comparing sustainability performance of universities in different regions [
10]. One common issue on which the previous literature agrees is the relevance of taking into account three different perspectives within the concept of sustainability: Economic, social, and environmental, with various proposals and indicators for covering these areas.
In 2015, the United Nations General Assembly adopted the 2030 Agenda for Sustainable Development, in order to complement and broaden the scope of the Millennium Development Goals (MDGs). Its 17 Sustainable Development Goals (SDGs) commit the global community to “achieving sustainable development in its three dimensions—economic, social and environmental—in a balanced and integrated manner”. As a consequence, there is a theoretically logical acceptance that the integration of these three dimensions is necessary because they reflect the long-term challenges of ending poverty and hunger, achieving gender equality and the realization of human rights world-wide, and ensuring the lasting protection of the planet and its natural resources. In spite of this, the practical combination of these three dimensions is not so evident and can hide different levels or alignments.
The integration of social, environmental, and economic sustainability into university processes has also been seen as a useful instrument for increasing accountability and improving performance [
11]. Scholars have analyzed sustainability reporting [
3,
6,
10,
12,
13] as a tool for increasing transparency and involving stakeholders in management. Nevertheless, although there are many models to measure sustainability and analyze sustainability reporting, studies of the impact and consequences of sustainability on university performance are still scarce. This contrasts with the abundant literature in the business sector about the effects of sustainability on organizational performance and the achievement of the objectives, which reveals some contradictory results. For example, López et al. [
14] found a short-term negative impact of corporate social responsibility (CSR) practices on business performance, and Choi and Yu [
15] found that the perceptions of CSR practices by employees had a positive impact on their organizational commitment and on organizational performance.
This paper builds on the literature about sustainability assessment aimed at developing a practical proposal for measuring, from an external perspective, the sustainability of Spanish Universities in the three dimensions by constructing an index and analyzing the relationship between the dimensions. The paper then goes a step further by analyzing the implications of sustainability and its three dimensions on university performance. In this respect, recognizing the difficulties of measuring performance in universities, academic rankings were used as a tool to compare productivity and performance [
16]. Academic rankings have been used to compare the quality of universities [
17] and serve for promoting the image of universities. The selection of the universities was based on the availability of common information and criteria for the purposes of comparability.
The results show that sustainability has a positive impact on university performance. These results can be of interest for university managers and stakeholders and can serve to encourage universities to develop sustainable practices. They can also be useful for policy makers and regulators when evaluating the benefits of regulating environmental and social practices in universities.
The paper is structured as follows. The next section presents a synthesis of previous research on sustainability assessment and examines the relevance of performance measurement and the usefulness of rankings.
Section 3 describes the data base and the methodology used.
Section 4 contains the analysis of the results and the discussion. The last section draws some conclusions, highlighting the contributions of the research, the way forward, and limitations.
2. Measuring Sustainability and Performance of Universities: Literature Review
Sustainability has been defined in the literature in many different ways [
18,
19]. Its measurement, therefore, involves some challenges. In terms of sustainable development, sustainability can be understood as the situation in which the needs of the current population are met while preserving the ability of future generations to meet their own needs.
In higher education institutions and, in particular, in universities, the concept has become a cornerstone for management, and in recent years, university agendas have increasingly adopted sustainability as a core objective. This explains the extensive literature related to the assessment and reporting of sustainability in universities [
10,
20]. Some criticisms have recently emerged, arguing that there is more rhetoric than action and that senior managers do not sufficiently support sustainability assessment and reporting practices [
21]. For example, based on a survey of 70 higher education institutions regarding sustainability, Lozano et al. [
7] concluded that efforts and measures towards sustainability were not integrated in university decision-making and strategies.
Assuming that “what gets measured, gets managed” [
22], different models for assessing sustainability have been developed around the world. One of the options more used to assess and report sustainability has been the Global Reporting Initiative Guidelines [
23], adapted for use in universities by Lozano [
24] to develop the Graphical Assessment of Sustainability in Universities (GASU).
Previous literature [
21,
22,
25] summarizes the use of three different approaches: Accounts, narrative, and indicator-based assessments. Accounts assessment tools are based on data that can be aggregated in an overall performance measure, while narrative assessment uses text, graphics, and tabular data to understand the impact of sustainability activities. Indicator-based assessments use indicators to measure a specific aspect of sustainability, but the indicators can be quantitative, quasi-quantitative, or qualitative. All of them have been subject to criticism and limitations, evidencing that this is a complex issue.
Some authors have compared the attributes of different sustainability assessment tools (SAT) and proposals. For example, Shriberg [
26] compared 11 tools, Cole [
27] reviewed 12 tools, Gómez et al. [
28] studied 8 tools, and Alghamdi et al. [
22] analyzed 12 assessment tools of sustainability in universities and their boundaries. Berzosa et al. [
29] applied four of them to a case study, concluding that it can be useful to combine different approaches to reach a greater rating of sustainability.
There are also some papers that compare the dimensions and indicators used in the tools aimed at the identification of the more relevant areas. Larrán et al. [
8] carried out a literature review about sustainability assessments and identified a total of 1124 items for measuring sustainability at universities. These authors grouped the items in seven different categories related to universities: Corporate governance, students, staff, society, environment, companies, and continuous improvement. Taking into account the Spanish context, the authors proposed the use of 268 items to measure sustainability in universities. Findler et al. [
21] compared the indicators used in 19 SATs explicitly designed for application by higher education institutions. Using content analysis, the authors identified 1134 indicators for sustainability. With a different orientation, Hasim et al. [
6] used content analysis of university websites in order to analyze the initiatives carried out by Australian universities, and the results evidence the progress of universities in their commitment towards sustainability. Twenty sustainability themes were detected using web content analysis of the selected university websites and varied across 39 universities.
This evidences that sustainability measurement in universities has some complexities, taking into account that impacts are sometimes difficult to measure and that there is no universally agreed definition of “impact” in the literature or in practice [
21]. Recognizing these difficulties, our objective is not to make a proposal to measure sustainability in a universal way, but rather to design a model that allows its measurement to be operationalized in the context of Spanish universities, in order to be able to make comparisons between them from an external perspective. Because of this, the availability of uniform information is an important limitation.
Most of the tools and research are based on the three dimensions of sustainability based on the triple bottom line developed by Elkington [
30]: Economic, environmental, and social sustainability. The economic dimension refers to the profit and economic resources, which, in the case of universities, could be focused on efficiency and intergenerational equity [
31]. The environmental dimension focuses on natural biological resources and ecosystems, while the social perspective is concerned with people and individuals; that is, the impacts on the social systems within which the organization operates [
32]. These organizational systems can be seen as sub-systems of the global system of sustainability [
19] that are compatible and mutually supportive [
33] and that need to be integrated and conciliated.
To sum up, from an integrational perspective, the three dimensions are integrated in a global concept of sustainability [
34] but the relationship between them is not so evident, and some authors call for the relevance of including the three into a robust framework of sustainable development [
32,
33,
34].
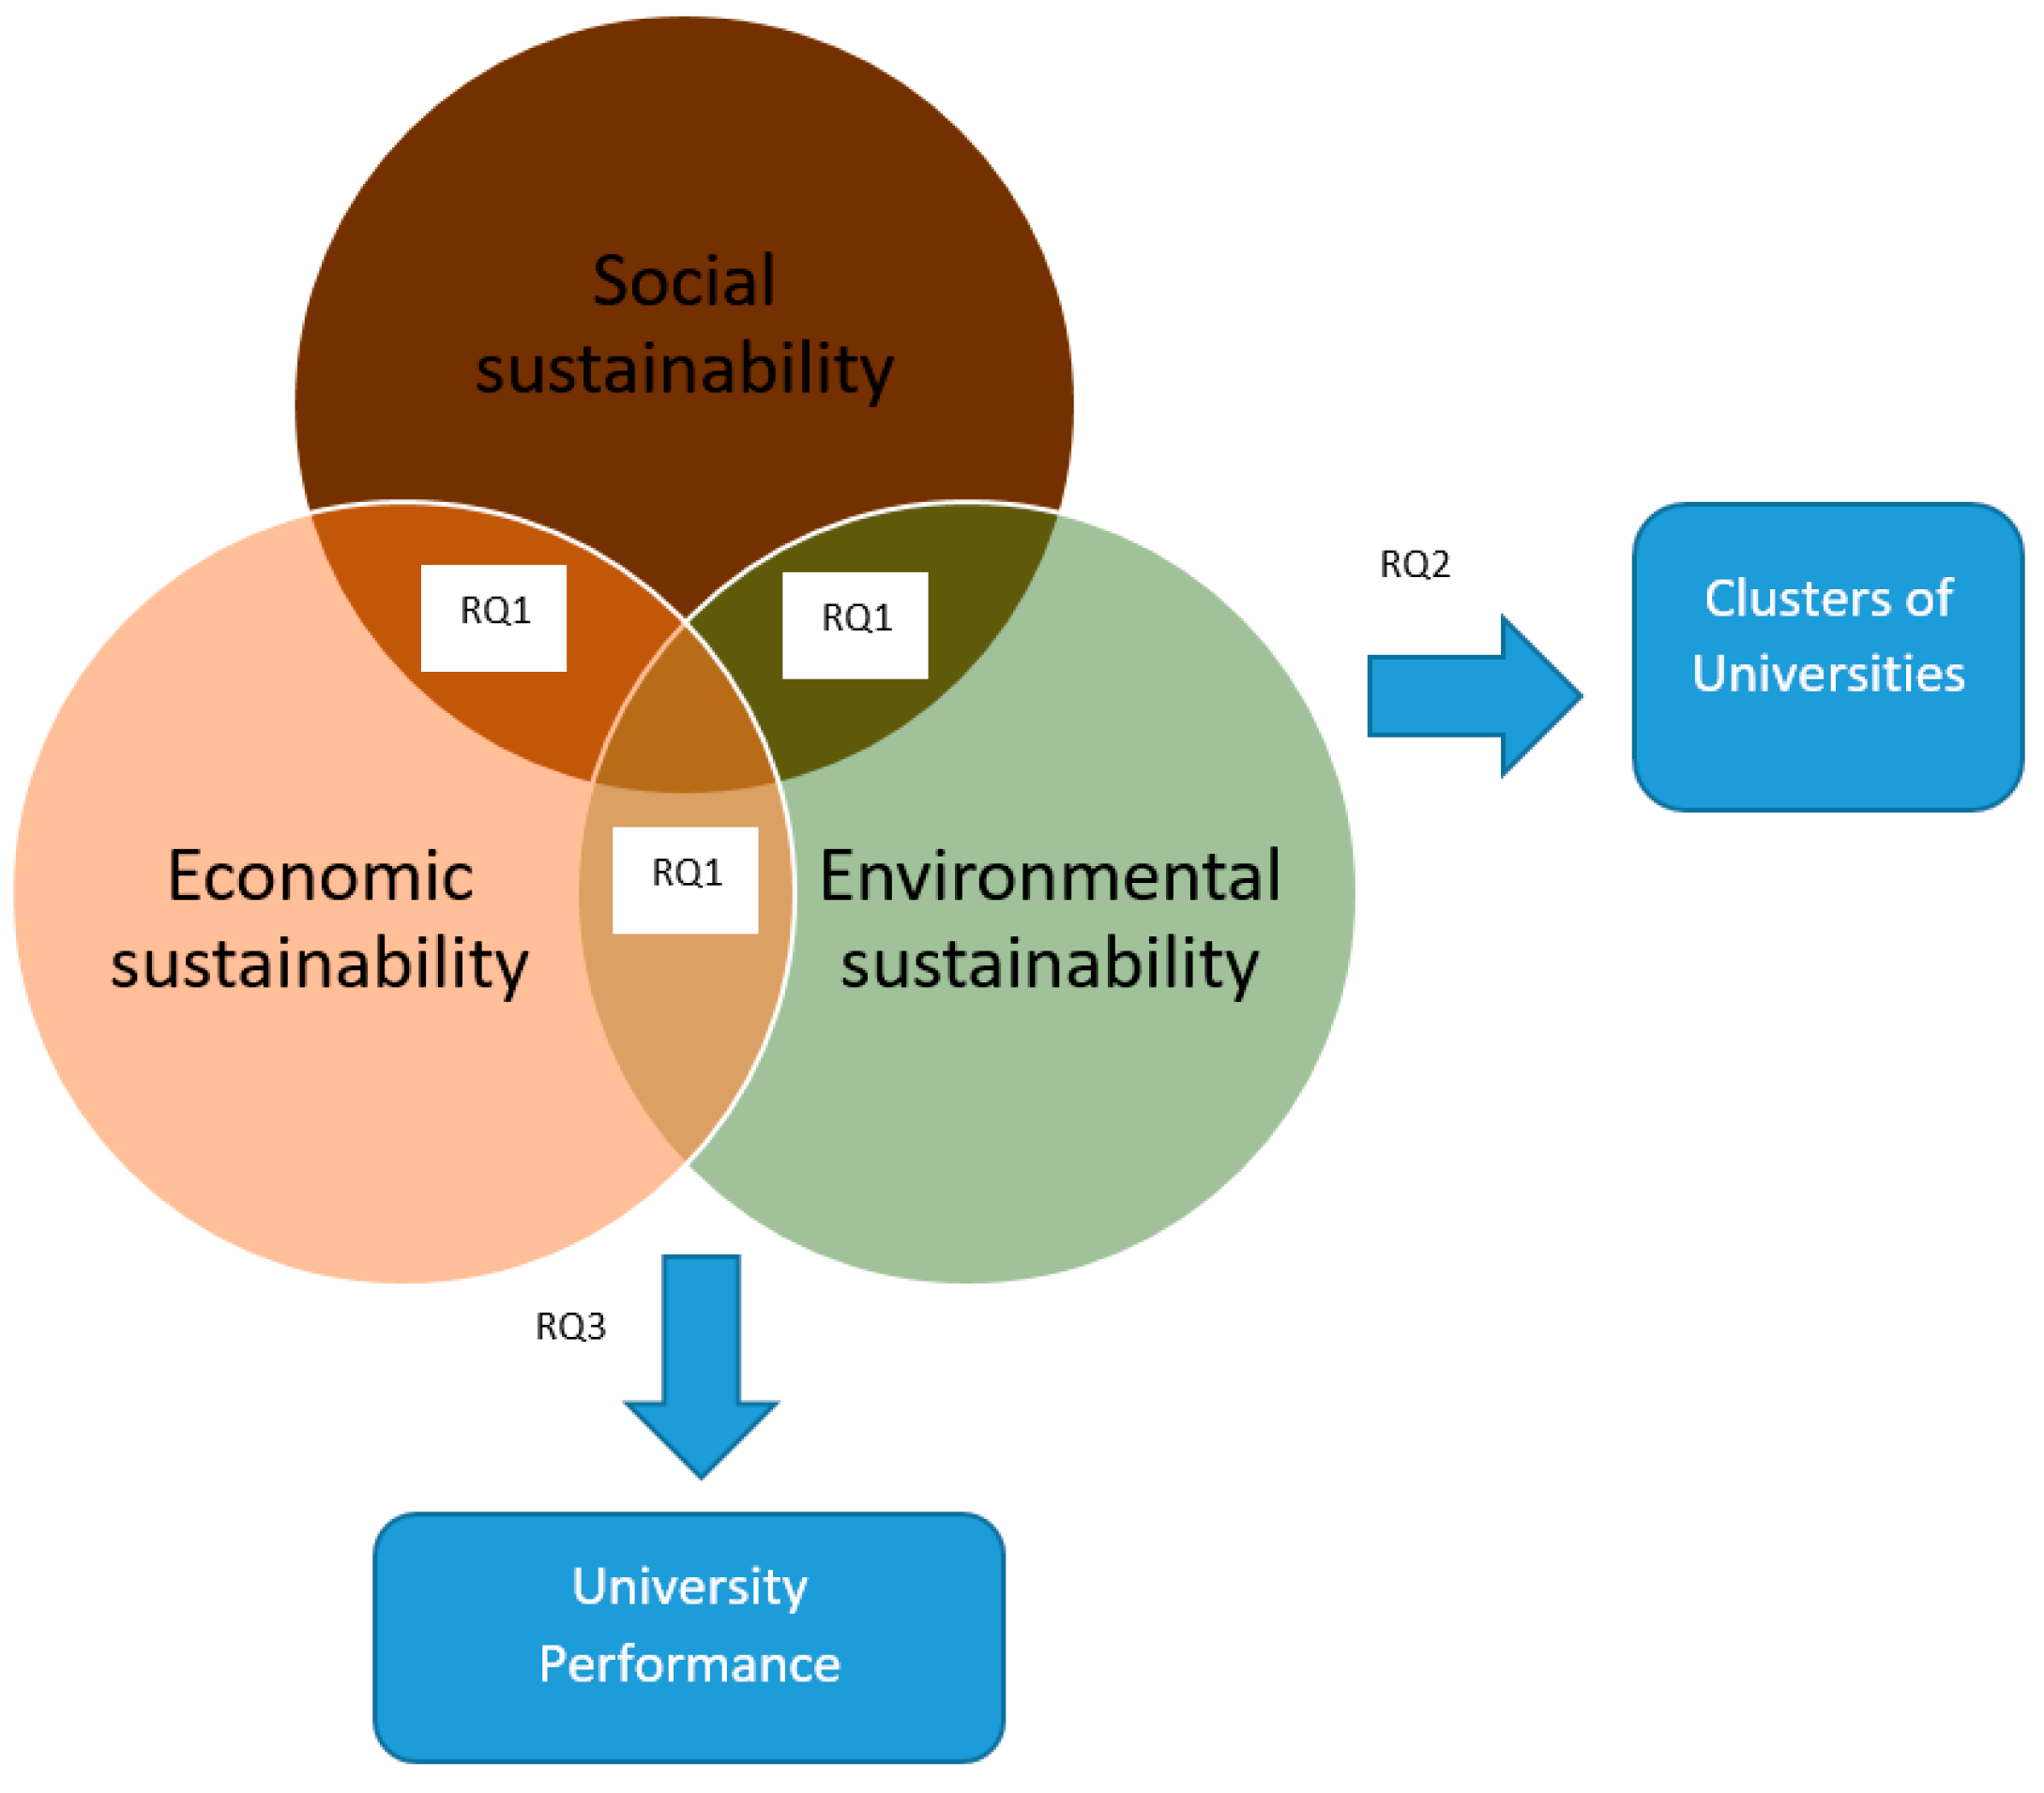
In the case of universities, there is no literature that deals with the relationship between the three dimensions, and for this reason, this paper aims to study whether universities use an integrated model of sustainability that includes the three dimensions at a similar level. Our first research question (RQ) is:
RQ1: What is the relationship between the different dimensions of sustainability?
In order to answer the question, our paper proposes an operative model to measure the three dimensions of sustainability, explained in the next section. The indicators included in these dimensions and explained in section three include the five areas of sustainability identified by Alghamdi et al. [
22]: Aspects of management, academia, environment, engagement, and innovation.
The measurement of the three dimensions with homogeneity principles allows a comparison and classification of the universities in order to find out whether they have a similar behavior. Thus, our second research question is set as follows:
RQ2: Are there common patterns for sustainability in Spanish universities?
In addition, when sustainability practices are embedded into decision making and strategies, some authors have confirmed that they can have positive effects on employees’ motivation and organizational performance [
15]. In the case of universities, the involvement of stakeholders in sustainability can have positive effects, affecting the achievement of the university objectives in terms of research, education, and the transfer of knowledge. In this respect, Lehmann et al. [
35] analyzed, with a case study, the effects of the involvement of a university in regional sustainability initiatives and concluded that it has benefits on the ability to manage internal university processes (by learning from its peers) and its ability to obtain the right graduates and knowledge. The authors maintain that participating in sustainability programs is an opportunity for the university to gain credibility and have positive effects on student and staff willingness to enroll at the university.
However, this has not been investigated in practice and a gap has been identified. After measuring and comparing sustainability indices among universities, this paper tries to assess whether the global sustainability and the three dimensions identified influence the performance of the universities. Our third research question is the following:
RQ3: What is the influence of sustainability on university performance?
The performance of universities is usually based on the achievements of the objectives in research, teaching, and the transfer of knowledge and its measurement is therefore complex [
36]. Consequently, performance measurement requires the use of some metrics to measure research output and teaching performance in terms of numbers of students successfully graduating. However, scientific research is difficult to measure because of the importance of quality [
36]. Academic rankings are used as quality indicators of universities, even though they are criticized because of their excessive focus on research, and some critics have suggested that a more multidimensional approach [
37] is necessary.
In order to assess the impact of sustainability on performance, the paper uses a performance index based on different rankings available, as well as on other information about students’ success. University rankings assess a plethora of parameters in their scoring systems, which can be useful to measure performance.
The rankings used refer to teaching, research, and the impact on the web. The impact on the web has been obtained from Ranking Web or Webometrics prepared by Cybermetrics Lab. According to Cybermetrics Lab [
38], web indicators are considered as proxies of the university’s global performance, taking into account its activities and outputs and their relevance and impact. The index obtained is then related to sustainability.
Figure 1 shows the relationship analyzed in each of the research questions.
3. The Measurement of Sustainability and Performance in Spanish Public Universities: A Proposal from an External Perspective
One of the characteristics of the Spanish university system has been precisely the concern for sustainability and its integration in university policies. In fact, already in 2004, a working group on environmental quality and sustainable development was created at the Conference of Rectors of Spanish Universities (CRUE) to promote sustainability actions in Spanish universities. In this framework, in 2007, a specific group for “University Sustainability Assessment” was created, in charge of designing a tool to assess sustainability. For the moment, the tool developed has focused on the environmental dimension, where universities are doing important efforts [
39]. The tool is based on indicators classified into three fundamental areas: Organization, teaching, and research and administration. The indicators are designed so that the evaluation is carried out from an internal perspective, since it is a questionnaire that the university itself must carry out.
With a similar orientation, Larrán et al. [
8], in accordance with the opinion of senior management members of Andalusian universities, proposed the use of 156 items, selected out of the 268 items initially proposed by the authors, in order to evaluate the sustainability of Spanish universities. The items were classified according to the difficulty to obtain the information for calculating them, in spite of the fact that the items were also designed from an internal perspective, which evidences that the availability of the information is an important limitation to assess sustainability.
Considering that the above tools are very useful but cannot be applied from an external perspective due to the difficulties to access to the information, and that there is not a tool that allows the measurement of sustainability externally, the first step of our research was to design a model to assess the sustainability of Spanish Universities. The sustainability index developed follows the accounts approach [
21,
22,
25], where some indicators were defined in each of the three dimensions. It is the first index developed for Spanish universities with external application that includes an integrated perspective, because of which it can be considered an important contribution, in spite of the limitations due to the restrictions in the availability of the information.
Table 1 summarizes the specific variables and indicators considered in each of the dimensions analyzed, as well as the target or aim for each of them.
In order to assess environmental performance, taking into account that environmental indicators used by universities are not homogeneous, we have selected the six indicators proposed and computed in UIGreenMetric [
40]—probably one of the most widely accepted indices for this purpose worldwide and previously used by Puertas and Martí [
41]. This provides time series of numerical information that allows rankings and subsequent classifications to be compiled. The concept of campus in Spanish universities includes both buildings and infrastructure, as well as the surrounding grounds. The indicators refer to setting and infrastructure, energy and climate change, waste, water, transportation, and education. The main advantage of using these indicators is that they are widely accepted as a main external information source, and that they are properly and externally processed in order to provide a classification or ranking of a number of universities.
Economic indicators are particularly difficult to obtain in Spanish universities. Whereas budget data are published by the universities, budgetary execution data are not so easily and publicly available. With the aim of estimating economic efficiency and sustainability, we use four indicators previously used in the methodological proposal by Blasco et al. [
42,
43] that refer to the global efficiency, the university staff efficiency, the cost per student sustainability, and the sustainability of the annual activity. Two additional indicators of economic/financial dependence suggested by the Ministry of Education have been considered: Dependence from the Autonomous Government and Dependence from the Central Administration. All these indicators have been considered in previous literature as relevant to measure economic dimension [
8].
In the social dimension, an important limitation for defining the indicators is the availability of information. These institutions are seen as influential bodies in civil society that not only generate knowledge and enable employment, but also contribute to creating cohesive and tolerant communities. Accordingly, equal opportunities and access to all levels of education should not be more difficult for people belonging to certain social groups. This is why we have included in the social component one indicator representing labor integration, which has also been included in previous literature as relevant [
8,
24], one indicator dealing with access schemes to university studies (grants), one indicator about the dropout rates and two others measuring gender inequalities, which can be considered an important issue in the social dimension of universities [
44].
Taking into account their definition and purpose, these elementary indicators have been re-scaled according to the optimum value equal to 1, as used previously in gender indices [
44]. For those indicators with a “positive reading” (meaning that higher values indicate better situations and, therefore, the aim should be to maximize), individual indicators have been re-scaled dividing their individual values by their maximum each year. In contrast, for those indicators with a “negative reading” (meaning that higher values indicate worse situations and, therefore, the aim should be to minimize), individual indicators have been re-scaled dividing their minimum each year by each single value of the indicator.
Hence, there are three groups of re-scaled indicators. The IEnvironmental group contains six indicators (from IEnvironmental 1 to IEnvironmental 6), the IEconomic group contains six indicators (from IEconomic 1 to IEconomic 6), and the ISocial group contains five indicators (from ISocial 1 to ISocial 5).
The averaged correlation among re-scaled indicators is 9.27%, with a standard deviation of 9.34%. At least initially, we consider all indicators as valuable since they provide significant new information.
The first methodological step in the analysis is the construction of a global sustainability index made up of three sub-indices representing the three dimensions under consideration: Environmental, economic, and social component.
As there are no clear guidelines about the superiority of any of the dimensions, and given that all indicators convey valuable information, we propose an equally weighted measure for each university and year, as described below. Furthermore, given the absence of a sustainability model in which stakeholders’ participation can define specific objectives and their projection over time, we think that an equally weighted measure is easily understandable, and preferable for long time scales, when data completeness cannot be guaranteed.
with Dimension = Environmental, Economic, or Social and k = 6 for the Environmental and Economic dimensions and k = 5 for the Social dimension. Then, the global sustainability index can be defined as
Finally, in order to measure performance, we also selected the performance indicators contained in
Table 2, which are related with the universities’ role as knowledge and technology generators, as well as providers of viable employment. The main data source was the successive editions of the project carried out by the BBVA Foundation and the Valencian Institute of Economic Research (IVIE) to assess the performance of the Spanish university system [
45,
46,
47]. We selected three individual indicators related to rankings in teaching, research, and innovation and technology. Additionally, we also included one indicator about the research impact achieved by each university relativized according to its production, provided by the CRUE in its annual reports on the most relevant data of the universities [
48]; another indicator about qualified labor integration provided by the Integrated University Information System for Spanish Universities (SIIU) [
49] and the ranking provided by webometrics [
38], that takes into account both the volume of the web contents and their visibility and impact.
Following the same methodology described above, the indicators were re-scaled according to the optimum value equal to 1. The indicators were equally-weighted and the global performance was obtained with the following expression:
After the corresponding literature review, the choice of indicators was based on the potential permanence of information sources so that the proposal of sustainability indices can be calculated in future years. That is, one of the intentions of this choice was to maximize the probability of permanence of the information sources over time.
4. Data and Methodology
The empirical analysis was carried out for the Spanish public universities. The universities and the years under study were selected on the basis of data availability, such that a balanced panel data set can be constructed with homogenous data and taking into account an acceptable range of environmental, economic, and social indicators, as well as performance indicators. Our first limitation is that less than half of the universities participate in UIGreenMetric [
40], one of the data sources used for the environmental indicators. For the three years covering this study, only 20 public universities reported the information required in the UIGreenMetric survey [
40].
The sample comprised 20 Spanish public universities for a three-year period from 2014 to 2016 (the last year for which there are data available). In Spain, there are a total of 50 public universities, therefore the sample covered 40% of the total, which can be considered representative.
As we have indicated, environmental indicators were obtained from UIGreenMetric [
40]. Economic and social data were extracted from university statistics published by the Ministry of Education (SIIU) [
49], the CRUE (Conference of Rectors of the Spanish Universities) [
48], and the universities’ own websites.
Table 3 shows the descriptive statistics of the three dimensions of sustainability for the three years, as well as for the global index and for performance.
In order to analyze the relationship among the three dimensions and answer RQ1, firstly, we used the Pearson correlation coefficients. More specifically, we assessed whether there is a correlation between the three dimensions of sustainability and if those entities with higher environmental score also have higher social and economic scores, which would evidence that universities have an integrated concept of sustainability. Secondly, the relationship between the different dimensions was analyzed with the Granger Causality Test, which allowed the investigation of the causality between two dimensions. The test was repeated for each pair of dimensions.
The second research question was analyzed using Gephi software [
50], which allowed to find similarities among universities in terms of their distance within the same indicator group (I
Environmental, I
Economic or I
Social). Gephi is an open-source software for graph and network analysis whose flexible architecture produces valuable visual results even with complex data. The graph consists of a set of nodes (universities in this case) and a set of pairs of nodes called edges (Euclidean distances among universities in this case). The usefulness of this network analysis derives from the fact that nodes and edges can be ordered and clustered according to specified criteria.
In our case, we built a network of relationships where each node corresponds to a university (j) under study and an edge between two nodes (
jm and
jn) corresponds to the Euclidean distance (D) between them. This procedure may be formally summarized as follows for each dimension (with Dimension = Environmental, Economic, or Social):
Usually, cluster detection requires the partition of a network into communities of densely-connected nodes. The quality of the partitions resulting from these methods is often measured by the so-called modularity of the partition. Modularity is a scalar value between −1 and 1 that measures the density of links inside communities as compared to links between communities. In this paper, we followed the modularity defined by Newman [
51] and Blondel et al. [
52]. The higher the modularity measure computed by the algorithm underlying the Gephi software, the more accurate are the clusters.
The third research question was analyzed using panel data methodologies, given that our data combined cross-section and time-series data. Panel data are better suited than cross-sectional data for studying the dynamics of change and minimizing the effects of aggregation bias. Whereas pooled regression (intercept and slope coefficients are constant across time and universities) may result in heterogeneity bias, fixed effects estimation allows each university to have its own intercept, assuming that that each university has a non-stochastic component. But these unobservable effects may also be stochastic, and are then treated as a component of the random error term which varies among universities (random effects estimation). With a large number of universities and a small number of time-series data (as seems to be our case), estimates can differ significantly. If the cross-sectional groups are a random sample of the population, random effects (RE) estimation is preferable. Nevertheless, the Hausman test enables the appropriate choice between fixed and random effects, under the null hypothesis that the RE estimates are efficient and consistent, and FE estimates are inefficient.
In our analysis, panel data models with random effects were initially estimated and the Hausman test determined those estimates that were valid and those that should be discarded and re-estimated with fixed effects.
In particular, the following initial models with random effects were estimated:
5. Results and Discussion
The average index of global sustainability suggests that universities have not improved significantly during the period under study (
Table 3). It is worth noting as well that the environmental indicator has the highest standard deviations, indicating a wider range of behavior among universities, whereas the economic and social indicators exhibit a more homogeneous behavior. Notwithstanding, it should be considered that the institutions included in the study are those being assessed in UIGreenmetric [
40], a voluntary evaluation submitted by universities, which suggests that these universities presumably are those interested in ongoing improvement processes.
Table 4 shows the Pearson correlation ratio for the three sustainability dimensions, as well as the correlation between them and the global sustainability index.
As can be seen, there is a positive association between the three dimensions of sustainability (RQ1), although only the association between the environmental and economic dimensions is statistically significant, indicating that those entities that implement environmental measures tend to have higher economic sustainability, while there is no significant relationship with the social dimension or between the economic dimension and the social dimension. Furthermore, the Granger causality test with balanced panel data shows the robustness of these results (
Table 5) and suggests that the economic dimension causes the environmental dimension. Thus, the universities that are economically efficient are the ones most likely to be environmentally more sustainable, whereas their social policies do not have much to do with their economic efficiency, although, obviously, they contribute to the overall sustainability of the institution. The fact that improvements in economic sustainability are not linked to improvements in the social dimension should lead universities to reflect seriously on how economic efficiency should move towards social efficiency, taking into account that the social dimension is especially important for universities. This result is consistent with the fact that the social component, although regarded as an important category, is not always integrated into sustainability, as has been previously pointed out in the academic literature [
33].
In sum, both the economic and the social dimensions are independent components or categories of the sustainability index, providing clear value added to the information about the global sustainability of these institutions.
Nevertheless, the correlation coefficients between each dimension and the global index evidence the highest relevance of the environmental dimension in the sustainability index. Therefore, the entities with good environmental indicators also tend to achieve good sustainability indices, taking into account the indicators used in this study. This also indicates that, in practice, the main efforts in sustainability by universities have been focused mainly in the environmental area, as pointed out in the report of the CRUE [
39]. This resembles what has happened in the business sector, where research and practice have also emphasized the environmental dimension [
53].
At this point, the question is whether an environmental sustainability index can be a good indicator of global sustainability in the line proposed by the working group of sustainability of CRUE [
39]. At least the possibility that environmental indices can be useful to measure sustainability should be taken into account. Nevertheless, as previous literature highlights, global sustainability has to consider all dimensions [
33,
53].
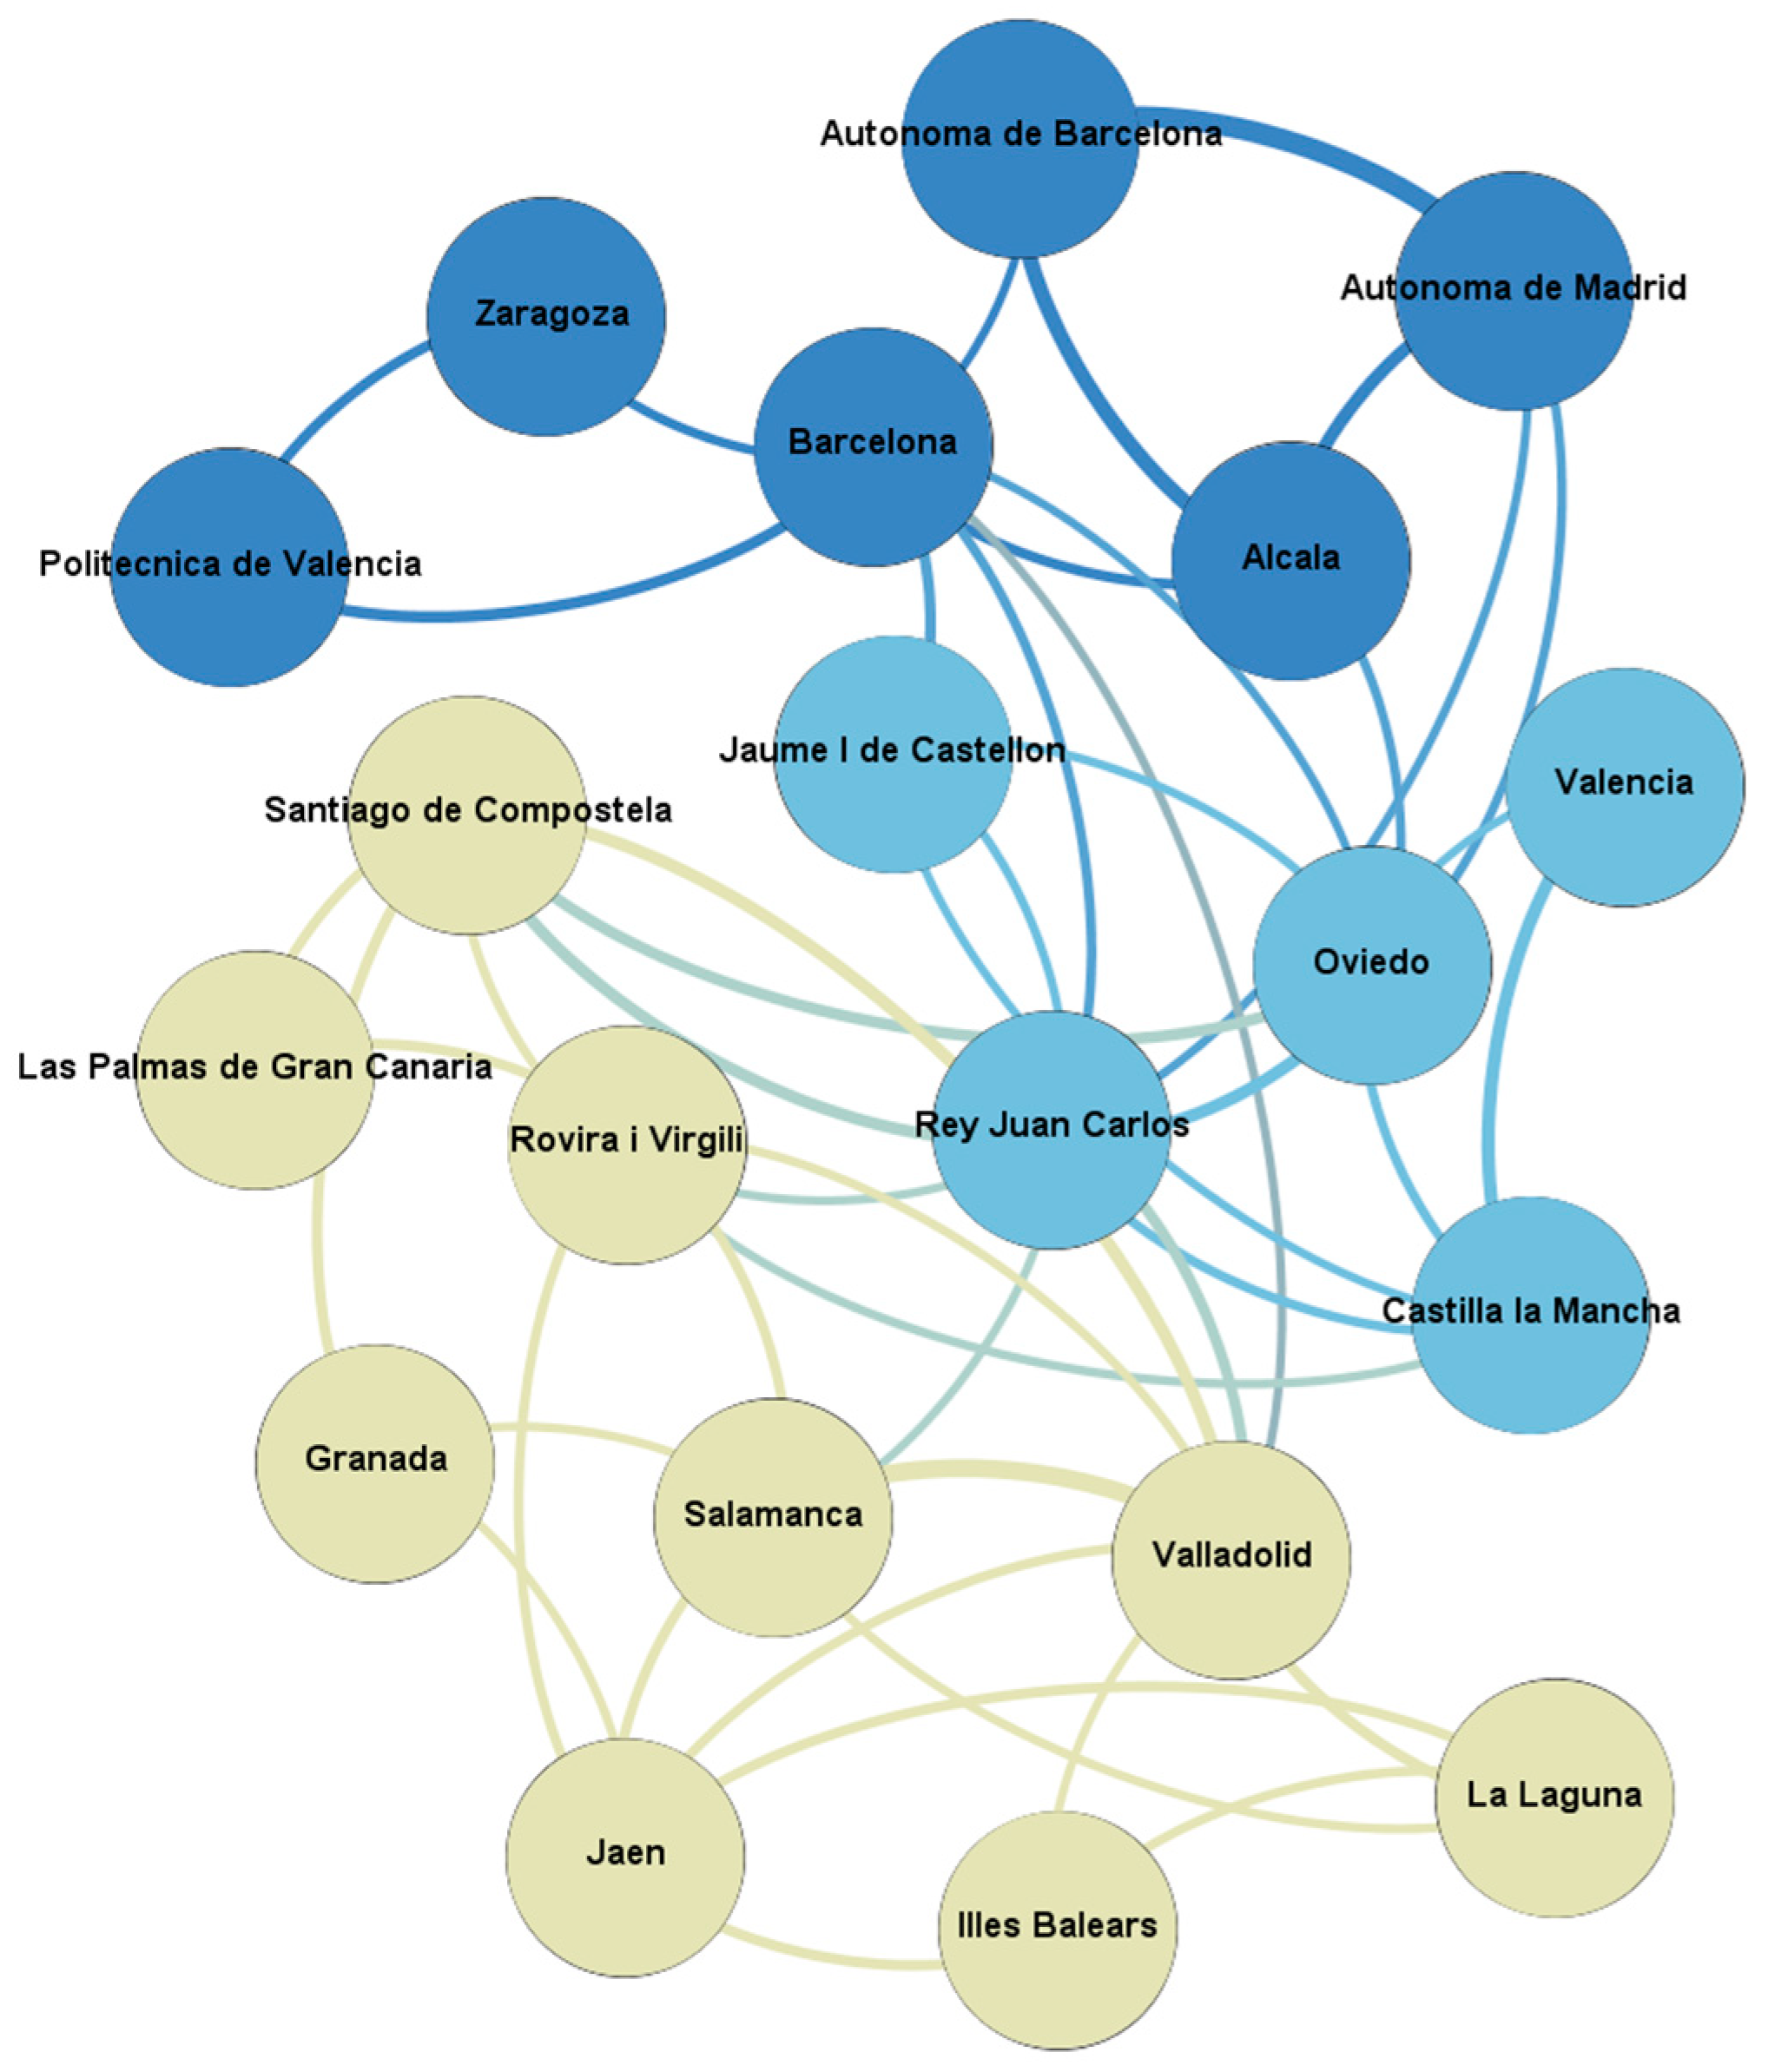
Gephi analysis was used in order to answer RQ2 (are there common patterns for sustainability in Spanish universities?).
Scheme 1,
Scheme 2 and
Scheme 3 show the clusters found with the algorithm proposed by Blondel et al. [
52], which enables Gephi visualization using the Euclidean distances among universities, as previously defined. (As all universities are related to each other, only 25% of the strongest relations (small distances among them) are shown for clarity.)
Scheme 1 shows the clusters among universities according to the I
Environmental group (Euclidean distances in I
Environmental 1, …, I
Environmental 6). It has a modularity of 0.392 and allows the visualization of three clusters. Two of them (dark and light blue, 11 universities) contain the 11 highest scores in the environmental indicator and, consistent with previous results, the 9 universities of highest scores in the global sustainability indicator (9 of the 11 universities included in these groups occupy the 9 highest positions in our global sustainability ranking). The thickness of the links between two nodes indicates proximity. The thicker the link, the greater the similarity between the two institutions. Given that only 25% of the significant relationships are shown, it is easy to observe that the blue communities are closer to each other than to the yellow community. The scheme shows that there are three groups of universities, with similarities between the universities within each group. As for the characteristics of the universities belonging to each group, it can be highlighted that size does not seem to be a relevant feature, as there are big universities and small universities in all groups. Nevertheless, 8 of the 11 universities with higher scores (blue clusters) are from the group of bigger universities (with the exception of the University of Granada), whereas the three smallest universities in our analysis (Jaen, Rovira I Virgili, and Illes Balears) do not score high in this dimension.
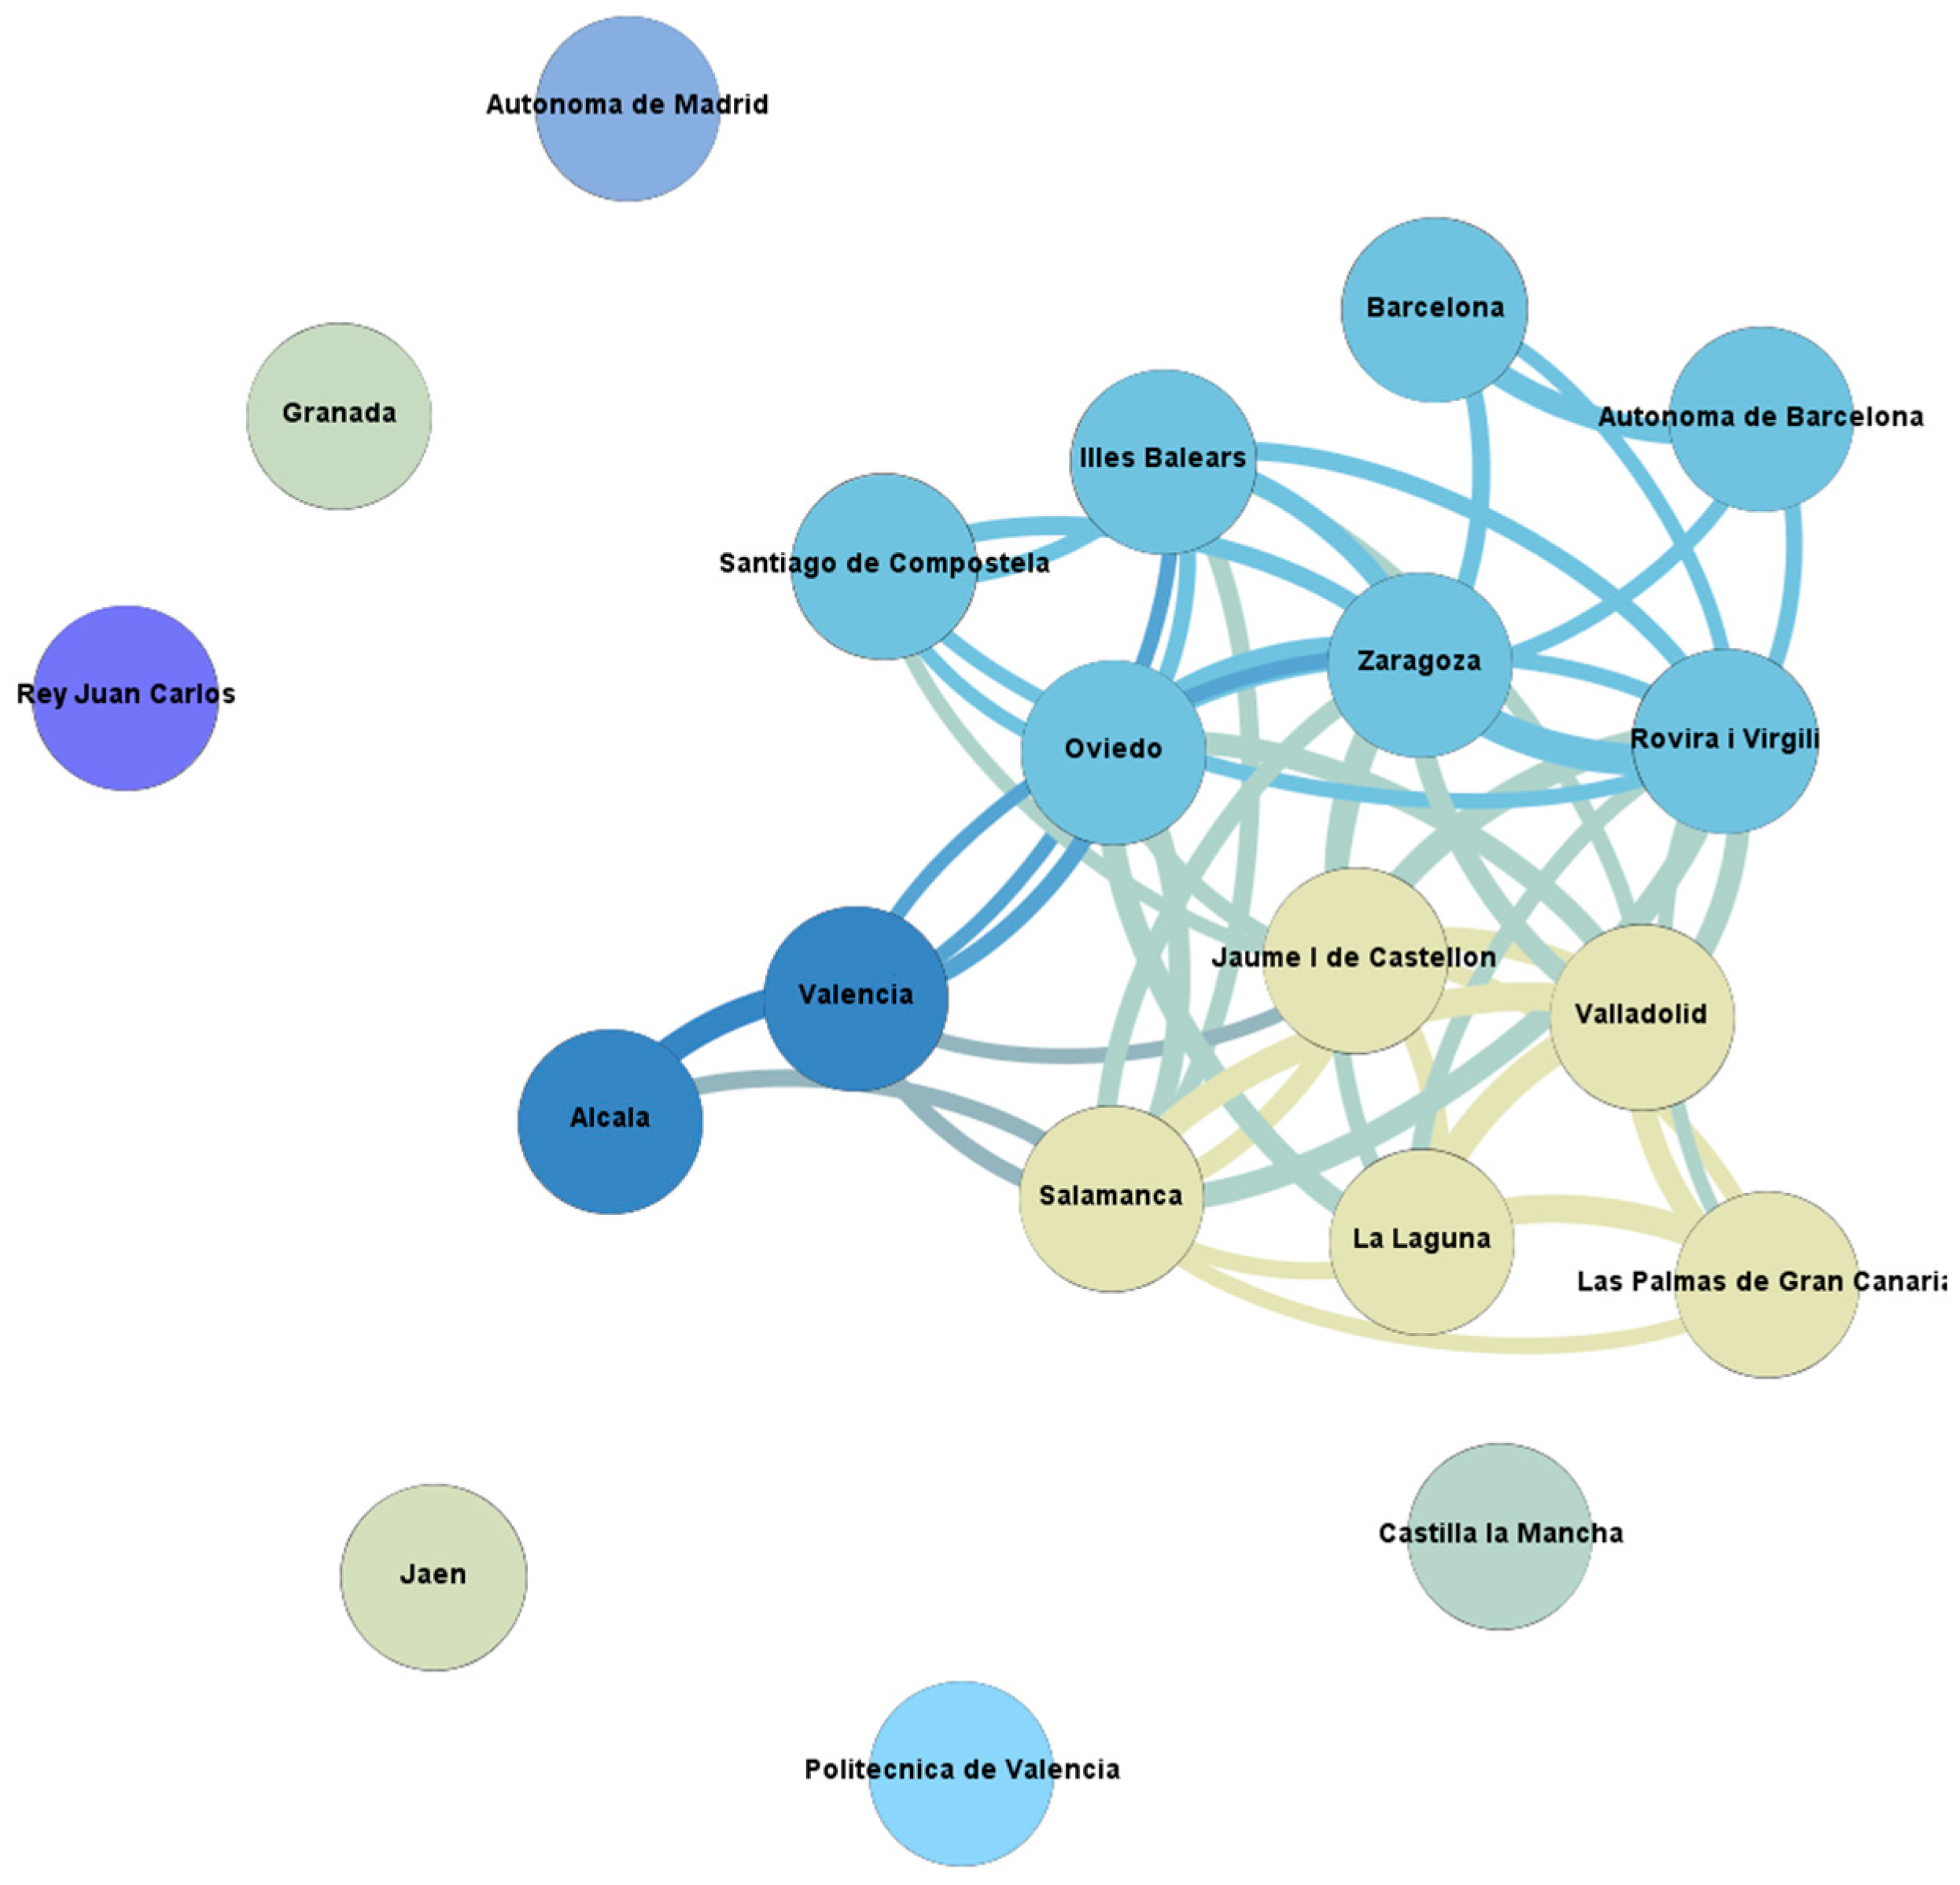
Scheme 2 shows the clusters among universities according to the I
Economic group (Euclidean distances from I
Economic 1 to I
Economic 6). It has a modularity of 0.131 and allows the visualization of 9 communities. Although the standard deviation of the general indicator is not high, the algorithm detects less connected universities, although the rest are closely linked. The bulk of the universities can be visualized in three different communities. A total of 9 out of 12 universities included in the blue clusters are the universities with the highest score of economic efficiency and 8 of the universities included show the 8 highest scores in the global sustainability indicator. In spite of the fact that 6 universities are not strongly connected with the remaining universities, the graph evidences strong connections between the other 14 universities, with some common characteristics in the indicators, which shows similarities among the analyzed universities. Once again, size does not seem to be relevant. The four biggest Spanish universities in our analysis (Barcelona, Granada, Valencia, and Rey Juan Carlos) belong to different clusters, as well as the four smallest universities (Illes Balears, Rovira I Virgili, Jaen, and Jaume I de Castellon). Moreover, one of the closest relationships is that shown by the universities of Alcalá and Valencia, although Valencia belongs to the first quartile by size and Alcalá belongs to the fourth quartile.
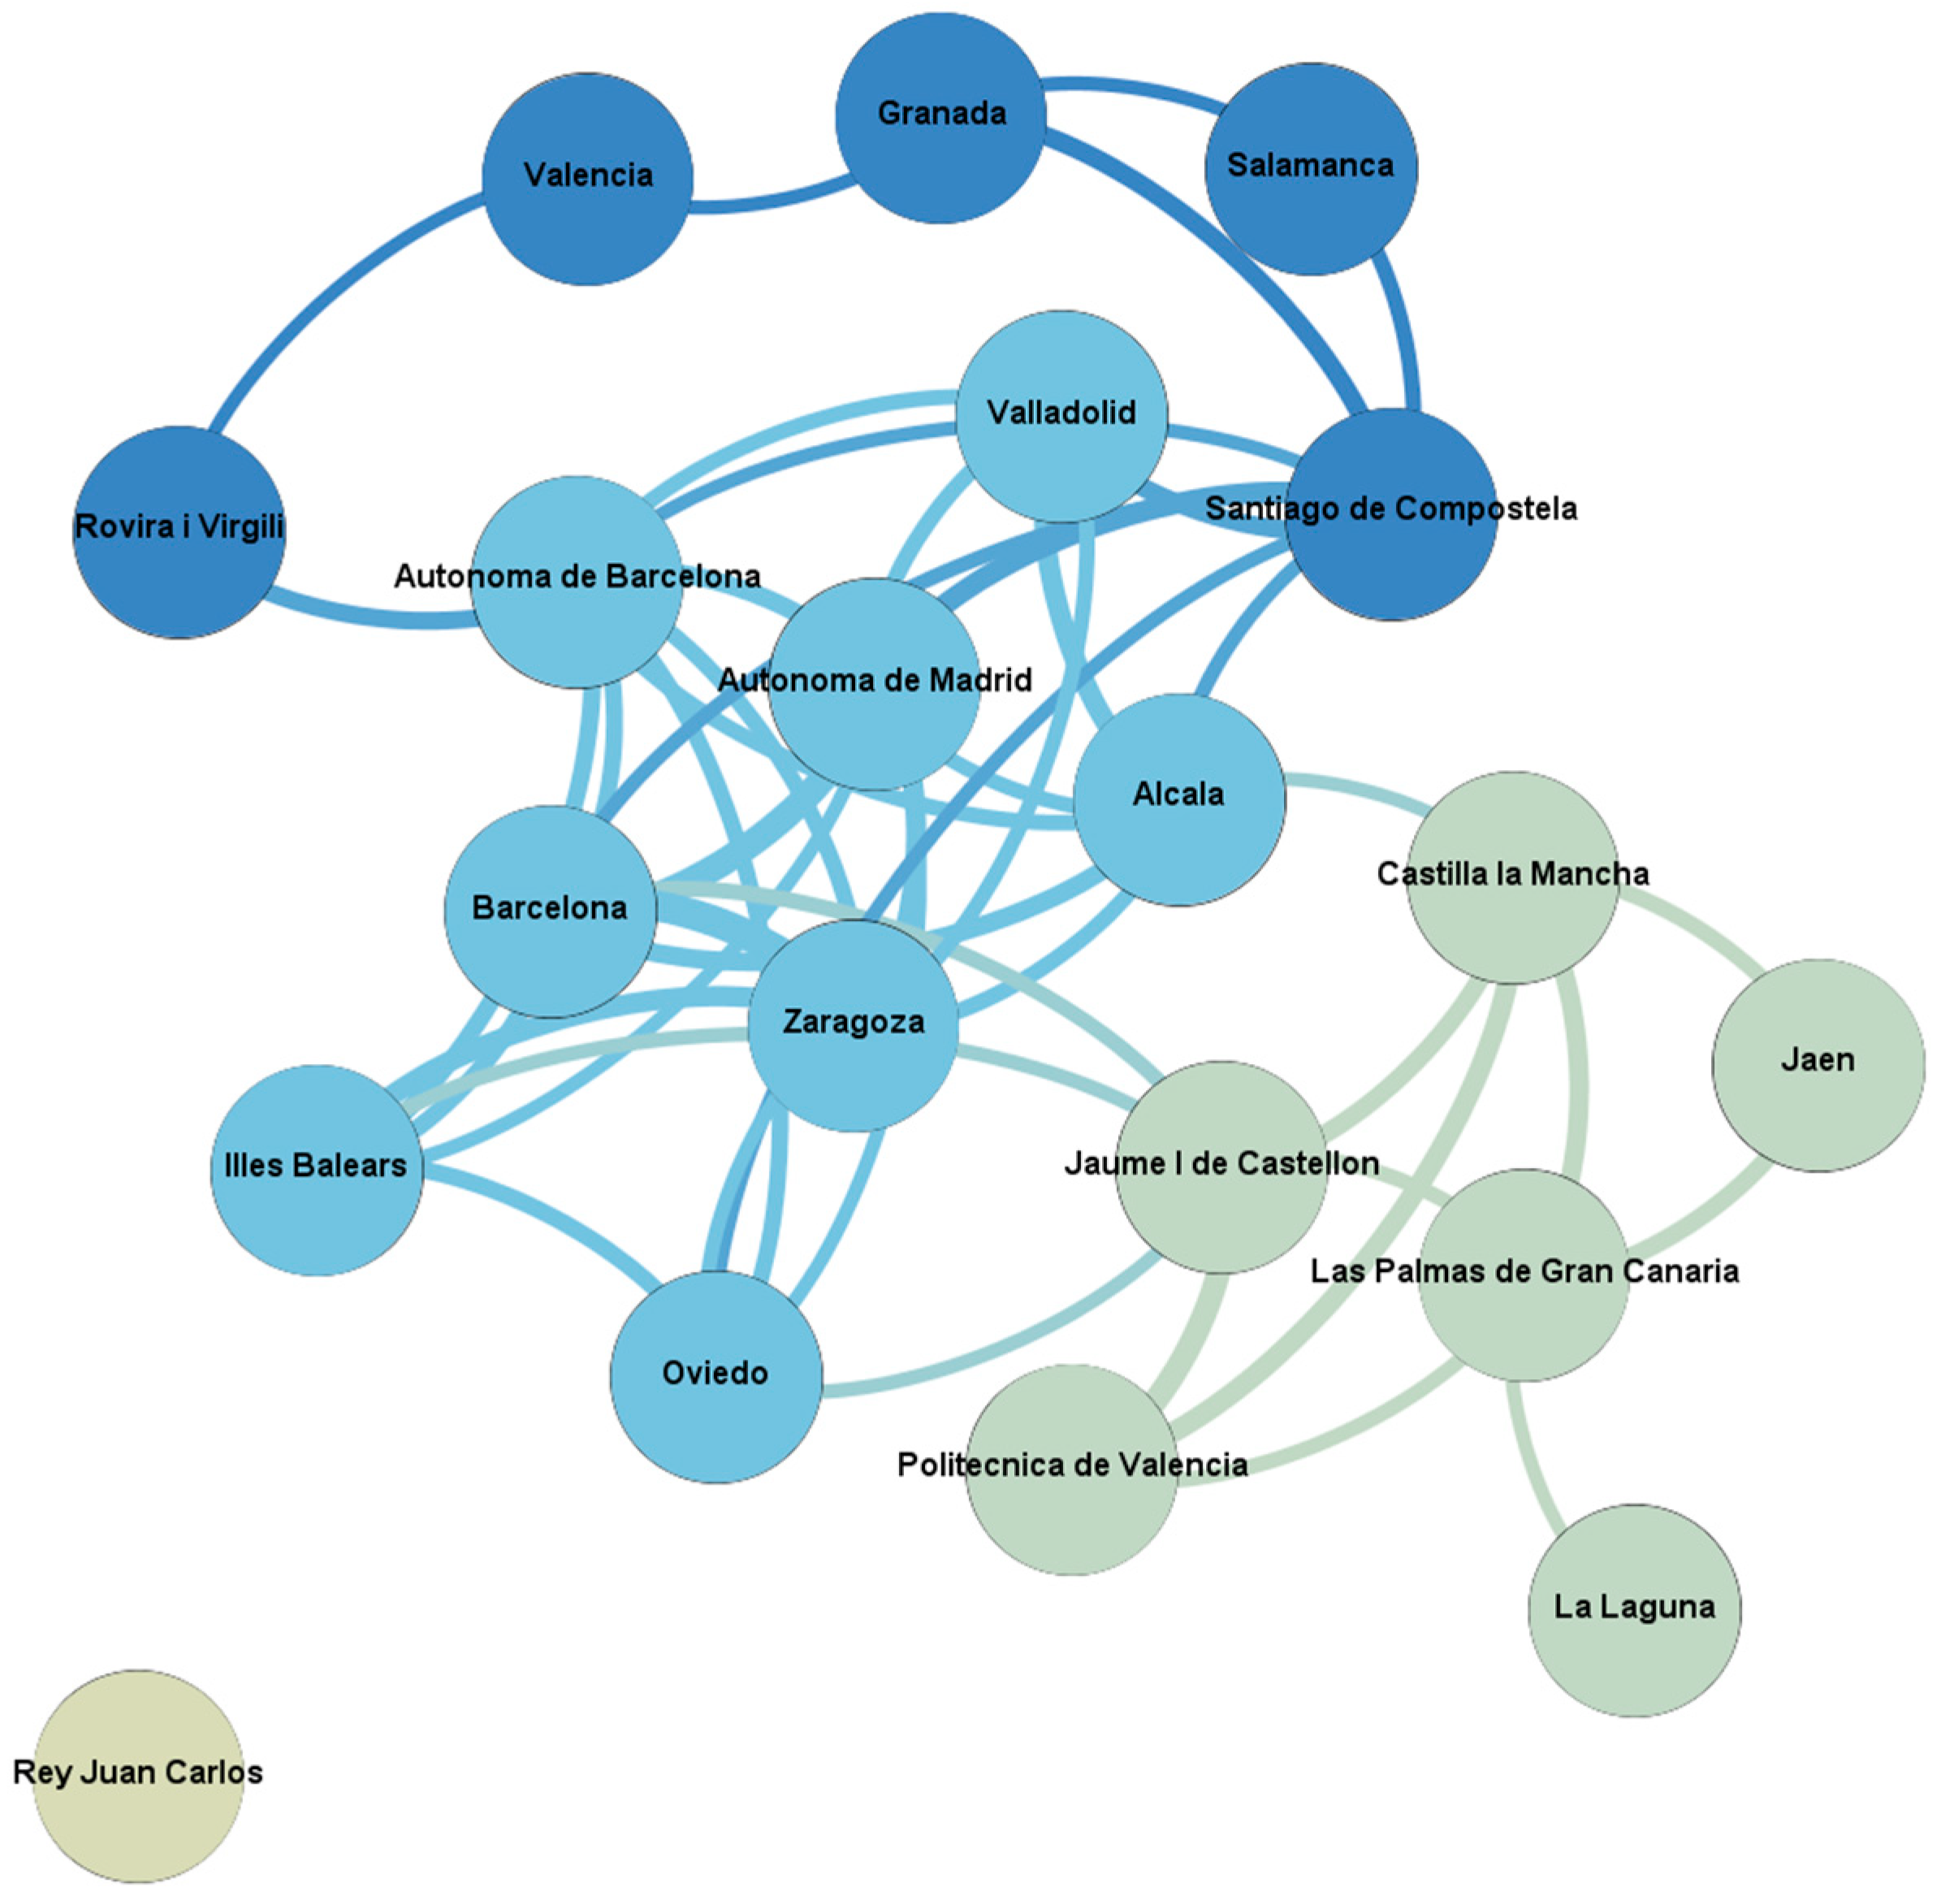
Scheme 3 shows the clusters among universities according to the I
Social group (Euclidean distances in I
Social 1, …, I
Social 5). It has a modularity of 0.344 and allows the visualization of 4 communities (one of them with a single component). In this case, blue communities include 13 universities, all of them with the highest scores in social sustainability with the exception of the University of La Laguna, which is one of the universities with higher levels of social sustainability according to our indicators but is has not been included in the blue clusters. However, only 5 of the 13 universities occupy the 5 highest scores in the global sustainability indicator. This implies that the social dimension, according to our indicators, is the most differential category, given that it allows universities such as La Laguna, Granada, Salamanca, or Rovira I Virgili, which do not score high in other dimensions, to show their contribution to global sustainability, given that these universities, together with Valencia, Autónoma de Barcelona, and Alcalá, are those with the highest scores in the social category, contributing to the integrated meaning of sustainability. As mentioned above, if the social dimension must be taken into account when developing sustainability strategies by universities, also from an external point of view, as in our case, it must be recognized as a value added that does not have to overlap with the levels reached in other areas of sustainability. This confirms the relevance of this dimension and the need to include it to have an integration of all the perspectives [
33].
Again, as with the other dimensions, size is not a key feature. Big universities like Rey Juan Carlos or Politécnica de Valencia, which shows high standards in other dimensions of sustainability, has lower scores in the social category, whereas one of the smaller universities, Rovira i Virgili, shows one of the highest values of the social index and it is closely linked to big universities like Valencia.
In sum, although there are no strict guidelines to describe common patterns for sustainability in Spanish universities, and although the universities that score the highest positions in one category do not necessarily do so in another, there are similarities among universities with respect to their behavior. The proximity between nodes is due to the fact that indicators have similar values, which, a priori, could reflect the existence of similar university policies or practices. However, it is very difficult to identify, with the available information, whether these similarities are intentional or co-incidental. Regardless of their overall position, many possible university pairs are closely linked with respect to the categories of sustainability; that is, many university pairs (19.5% of pairs) stay together in the same cluster in at least two sustainability dimensions out of the three under analysis. For example, take the following pairs: The University of Las Palmas de Gran Canaria and the University of La Laguna, the University of Barcelona and the University Autónoma de Barcelona, the University of Santiago de Compostela and the University Rovira I Virgili, or the University of Zaragoza with either the Universidad de Barcelona or the Autónoma de Barcelona. Although they do not have the same scores in individual categories or in the global sustainability indicator, the members of each pair have a close relationship with regard to the three sustainability dimensions. In general terms, universities such as Illes Balears, Salamanca, Zaragoza, Barcelona, and the Autónoma de Barcelona tend to be closely related to the same neighbors in at least two of the three sustainability dimensions, whereas other universities such as Valencia, Politécnica de Valencia, or Rey Juan Carlos present a more singular behavior.
Although this variety of behaviors makes it difficult to find more accurate patterns, just some similarities between universities, we can conclude that very few Spanish universities tend to occupy either high-level positions or low-level positions in all dimensions of sustainability, as most of them present a wide range of achievements in terms of sustainability.
Table 6 shows the ranking of universities organized by quartiles according to their total score in the global sustainability index (I
Sustainability). It is worth noting that, as mentioned before, size does not seem to be a critical feature in global sustainability either. The biggest universities (Barcelona, Granada, Valencia, Rey Juan Carlos, and Autónoma de Barcelona) belong to the second, fourth, and first quartiles of sustainable universities, respectively, whereas the quartile of smallest universities (Illes Balears, Rovira I Virgili, Jaen, Jaume I, and Alcalá) belong to the fourth, third, second, and first quartiles of global sustainability.
The last question (RQ3: What is the influence of sustainability on university performance?) can be formally solved through the panel data analysis.
Table 7 and
Table 8 offer the results for the estimation of the proposed models. As can be seen, global sustainability positively affects the performance of universities; that is, those universities that have higher sustainability indices also have higher performance indices. (The use of “size” as a control variable does not change the results, and the size variable is not significant at the usual significance levels, either for the global index or for the panel of the three dimensions. This result can be provided upon request.) Sustainability is a tool that enables stakeholder engagement in decision making and this can have a positive effect in the achievement of the objectives, increasing, for example, staff motivation [
15]. The results can encourage universities to engage in sustainability practices, taking into account the positive effect that it can have on achieving the objectives of the university and in the university performance.
In the analysis of the three dimensions of sustainability, the results in
Table 8 show that the economic and the social dimensions are significant and positive, whereas the environmental dimension is not statistically significant in the performance of the universities. This has a practical implication for the economic management of universities, indicating that the universities that want to improve academic performance must also improve economic sustainability. As for the social dimension, the positive impact evidences that universities that have a social commitment achieve a better performance, which is logical if we consider that the social role of universities is closely connected with their objectives in terms of research, teaching, innovation, and transfer of knowledge. To sum up, universities can improve their performance if they improve social sustainability, which is an important stimulus to universities to embark on social projects. These results support the conclusions of Lehmann et al. [
35] about the positive effects of the involvement of a university in regional sustainability initiatives: It allows the university to improve its credibility with a positive impact on students and staff, encouraging them to be involved in the university projects and objectives.
As robust proof of these results, and in order to highlight the relevance of both the economic and social dimensions, we test the influence of the environmental dimension on performance. Given that our first results indicate a strong correlation between the environmental dimension and the global sustainability index,
Table 9 shows the regression estimates of SI
Environmental jt on I
Performance jt with the purpose of checking whether the environmental dimension can be a good proxy for the global index.
The results suggest that although there is a positive relationship between the environmental dimension and the performance indicator, this relationship is only significant at the 10.3% significance level and, therefore, not accepted at the usual significance levels, whereas the results in
Table 7 lead to the conclusion that the economic and the social dimensions significantly and positively affect performance. These estimates support, on the one hand, the relevance of the social dimension and its singularity, providing valuable information to the global concept of sustainability and, on the other hand, the usefulness of the integrated perspective of a global index instead of a single dimension proxy.
Taking into account the relationship between sustainability and performance, universities can be initially classified into four groups based on the numerical calculation of ISustainability and IPerformance:
G1: Universities in high ranges for both general indicators of performance and sustainability. These universities also occupy high positions in each individual category of sustainability. This group includes five institutions (University Autónoma de Barcelona, University of Barcelona, University of Valencia, University Autónoma de Madrid, and University of Alcalá).
G2: Universities in the middle ranges for both general indicators. These universities also occupy middle positions in each individual category of sustainability. They never occupy the lowest positions in the individual categories. This group includes six institutions (University of Granada, University of Oviedo, University of Salamanca, University of Zaragoza, University of Santiago de Compostela, and University Rovira i Virgili).
G3: Universities in the high/middle ranges for both general indicators but occupying low positions in one individual category of sustainability, although they may occupy high positions in other categories. This group includes four institutions (University Rey Juan Carlos, University Jaume I de Castellon, University of La Laguna, and University Politecnica de Valencia).
G4: The rest of the universities occupying middle/low positions for the general indicators of performance and sustainability and with low positions in any of the individual categories of sustainability. They never achieve the highest positions in any of the categories or global indicators compared with their peers under study. This group includes five institutions (University of Las Palmas de Gran Canaria, University of Illes Balears, University of Jaen, University of Valladolid, and University of Castilla La Mancha).
Nevertheless, it is interesting to highlight that our research is based on universities that voluntarily provided the environmental information (for UIGreenMetric assessment) required for the analysis, which is undoubtedly a positive thing, and therefore, they cannot be compared with other universities that did not provide such information.
6. Conclusions
Sustainability has become a fashion in modern economics, and higher education institutions have joined this trend. Almost all of them have signed the Sustainable Development Goals contained in the 2030 Agenda for Sustainable Development, a redefinition and expansion of the Millennium Development Goals (MDGs), which shows that universities are aware of their role needed in order to reach the targets posed, in spite of some critics having emerged from the literature arguing that there is more rhetoric than practice in the sustainability discourse.
Sustainability development has been embedded in university policies and strategies, and efforts are increasing to fight against poverty, achieve gender equality and human rights, as well as to protect the planet and its natural resources, among others. This has been accompanied with an increasing interest in measuring and reporting sustainability in universities, aiming at the development of common models that allow comparisons among entities. However, most of these models have been developed in order to measure sustainability from an internal perspective.
In the case of higher education institutions in general, and universities in particular, the literature contains different proposals for assessing the three dimensions from an integrative perspective, and there is a long list of indicators proposed for this aim [
8], but there are not studies that take stock of the relationship between the three dimensions, perhaps because sometimes it is difficult to differentiate the impact that a particular activity may have. Furthermore, there is a gap about the effect that sustainability efforts may have on the achievements of the objective and performance of the universities.
This paper contributes to the literature about sustainability assessment from an external perspective, with a practical application for Spanish public universities. Furthermore, it evaluates the effect that sustainability practices can have on university performance.
The empirical assessment proposed for the case of Spanish Universities, with a sustainability index that differentiates the three dimensions, is the first step of the analysis and allows to answer our RQ1 (what is the relationship between the different dimensions of sustainability?). The results indicate that there is high correlation between economic and environmental actions, while social issues are less correlated. Therefore, universities with a high score in environmental dimensions also have a high score in the economic dimension, but entities carry out their social aims and objectives independently of the efforts in the other two areas. In addition, our results suggest that the economic dimension causes the environmental dimension and those universities that are economically efficient are more likely to be environmentally more sustainable. However, the social component provides its own valuable information about sustainability, given that no significant correlations were detected and no causality relation was found. That means that some efforts are still necessary to achieve an integrated perspective of sustainability in universities. In fact, our analysis also evidences a high correlation between the environmental index and the global sustainability index, which may explain why the environmental dimension has received preferential attention to date.
The second research question of the paper (RQ2: Are there common patterns for sustainability in Spanish universities?) was answered using Gephi visualization methods. There are not clear common patterns for sustainability in Spanish universities, although there are some similarities among them in some areas, particularly in the economic one. Very few Spanish universities tend to occupy either high-level positions or low-level positions in all dimensions of sustainability. Although most of them present a wide range of achievements in sustainability, some university pairs (19.5% of pairs) stay together in the same cluster in at least two sustainability dimensions out of the three under analysis. In general terms, universities such as Illes Balears, Salamanca, Zaragoza, Barcelona, and the Autónoma de Barcelona tend to be closely related to the same neighbors in at least two of the three sustainability dimensions, whereas other universities, such as Valencia, Politécnica de Valencia or Rey Juan Carlos, present a more singular behavior. Another important result in the search for patterns is that size does not seem to be a key issue. Big and small universities may score high either in individual dimensions or in the global index.
The integration of social, environmental, and economic sustainability into university processes can be considered a useful instrument for increasing accountability and transparency, and can improve credibility and have a positive effect on the engagement of stakeholders, leading to improvements in university performance. That is why the answer to our third research question (RQ3: What is the influence of sustainability on university performance?) is another significant contribution of the paper. Using panel data analysis, we can conclude that global sustainability positively affects the performance of universities; that is, the universities that have higher sustainability indices also have higher performance indices. Particularly, it has been proved that the impacts of both the economic and the social dimensions are significant and positive on performance. Therefore, the universities that have higher economic sustainability are also able to achieve higher levels of performance. As for the social dimension, the positive impact evidences that universities that have a social commitment could also achieve a better performance.
In sum, universities that include sustainability practices in their strategic plans can have positive effects in achieving academic and research performance, as well as in the third mission. These results could be of interest for university managers and stakeholders and should serve to encourage universities to develop sustainable practices. This study clearly has a practical implication for the economic management of universities, indicating that the universities that want to improve academic and research performance must also improve economic sustainability. This could also be useful for policy makers and regulators when evaluating the benefits of regulating environmental and social practices in universities.
This study is not without its limitations, as it is focused on a limited number of universities due to the availability of the data. It could be interesting to increase the sample in order to check the robustness of the results. Furthermore, as the analysis is focused on Spanish Universities, the application of the assessment and the evaluation of the impact in a different context, such as a different country, could offer interesting results about the validity of the results in different frameworks and regulation.


