Article

Does the “Belt and Road Initiative” Promote the Economic Growth of Participating Countries?

1
School of Economics and Management, Chang’an University, Xi’an 710064, China
2
Integrated Transportation Economics and Management Research Center, Chang’an University, Xi’an 710064, China
*
Author to whom correspondence should be addressed.
Sustainability 2019, 11(19), 5240; https://doi.org/10.3390/su11195240
Submission received: 28 July 2019 / Revised: 8 September 2019 / Accepted: 18 September 2019 / Published: 24 September 2019

Abstract

:
With the slowdown of global economic growth, how to stimulate economic growth has become a hot topic in recent years. The “Belt and Road (B&R) Initiative,” as a newly proposed global economic stimulus plan, has attracted widespread attention from scholars. In this study, the research used the propensity score matching difference in difference (PSM-DID) method to evaluate whether the “B&R” Initiative has promoted the economic growth of the countries along the route. Objectively assessing the effect of its implementation is not only important for its completion and improvement in the future but also to verify whether the “B&R” Initiative promotes economic growth in participating countries. A logistic regression is constructed using the statistical data obtained by the World Bank on 110 countries from 2011 to 2016. The results show that the “B&R” Initiative has effectively promoted the rapid growth of the GDP of participating countries but the improvement of per capita GDP growth is not significant. Through the analysis of the selected variables, corresponding policy recommendations are proposed. Moreover, objective proofs are provided to encourage all the countries in the world to participate in the “B&R” Initiative.

1. Introduction

Owing to the slowdown of global economic growth in the early 21st century, countries are more frequently confronted with various challenges and risks. The effect of the financial crisis is continuing. All the above phenomena show that the existing governance system is insufficient to support the normal operation of the world and it is urgent to find new solutions. As a solution to dealing with the global crisis, the Belt and Road (B&R) Initiative proposed by China has been questioned by many countries: Does it truly promote the economic growth of the participating countries? In which areas is the promotion effect particularly obvious and is it worthwhile generalizing it in the future? For which aspects are there shortages that need to be avoided for countries join the initiative in the future? On the occasion of the fifth anniversary of the “B&R” Initiative, the objective evaluation of the implementation of the “B&R” Initiative will improve the “B&R” Initiative and reduce the risks for countries joining after the promotion of the policy.
Until now, a large number of studies have been conducted on the “B&R” Initiative, which can be roughly summarized into three levels: the political level, the regional economic level and the national level. At the political level, some scholars believe that the proposal of the “B&R” Initiative proposes to decrease geopolitical complexities, thereby resolving some of the disputes in participating countries and increasing the overall trade benefits for the participating countries. However, this circumstance will make some countries become aggressive and voice dissatisfaction with the policy effects. It will even lead China to be regarded as an expansionary country, which will further make the implementation of the “B&R” Initiative subject to multiple obstacles [1,2,3,4,5,6,7,8]. At the regional economic level, some scholars have explored the economic impact of the “B&R” Initiative on different industries in participating countries from the perspectives of Europe, the Middle East and East Asia. Most scholars affirm the positive impact of the “B&R” Initiative on the regional economy [9,10,11,12,13,14,15,16]. At the national level, some scholars believe that the “B&R” Initiative can promote the economic development of participating countries and indicate that investment in non-monopoly enterprises accounts for the majority of the investment in non-infrastructure investment [17,18,19,20,21].
Nonetheless, one important detail that has received little attention in the current literature is the specific analysis of the economic effects of the “B&R” Initiative. Even without its implementation, countries who are participating in the “B&R” Initiative will achieve economic growth due to the influence of other factors. To effectively identify the economic effects of the “B&R” Initiative, other factors affecting the economic growth of the participating countries must be considered. Owing to the development of methods that evaluate policy effectiveness, the differences-in-differences (DID) method which is popular in academic communities is used to evaluate the effects of the “B&R” Initiative. One of the prerequisites for meeting the requirements of the DID method is that there is a common trend between the processing group and the control group. The assumption of common trends may not be met because the developments around the world are diverse.
Based on the above analysis, the research attempt to investigate the economic growth of the participating countries of the “B&R” Initiative using the latest propensity score matching DID (PSM-DID) method and panel data from 110 countries around the world.
The objectives of this study are as follows: (1) undertake a holistic study of the “B&R” Initiative at the macro level; (2) Use the PPSM-DID method to test the robustness of the conclusions to ensure that the policy evaluation results of the DID method meet the common trend hypothesis and that the evaluation method is more scientific and rigorous; (3) Identify the factors affecting the economic growth of the participating countries of the “B&R” Initiative and verify the problems that should be paid attention to and solved in the course of further implementation.
Due to the relatively short time frame since the proposal of the “B&R” Initiative, the implementation effects can be estimated as follows: it promotes rapid economic growth or it does not promote rapid economic growth. Figure 1 lists the specific mechanisms of action in both cases.
In economic theory, Infrastructure can reflect the level of productivity as a production factor [22]; The backward infrastructure of developing countries hinders economic development. However, having good infrastructure can promote economic development and regional economic integration in developing countries [23]. Infrastructure improvement plays a positive role in the rapid development of the economy [24]. Countries participating in the “B&R” Initiative will enjoy a series of policy benefits due to the financial input from the Asian Infrastructure Investment Bank and their governments such as large loans for infrastructure. Economic growth can also be promoted by the “B&R” Initiative through a series of preferential policies and measures. Specifically, infrastructure construction can boost domestic demand and stimulate the domestic market by introducing external capital. International trade acts a pivotal part in global economic system, which developing countries can increase production efficiency through trade [25,26]; Moreover, participating countries will enjoy a series of preferential measures such as the preference for reduced in taxes. Based on the current situation, most of the participating countries are resource-exporting countries. Countries participating in the implementation of policies can achieve rapid economic growth by increasing the added value of processed products from resources.
Therefore, the “B&R” Initiative can achieve economic growth through the implementation of policies allowing the industrial structure to be optimized, taxes to be decreased, resource development conditions to be widened and other preferential policies to be developed. Taking global economic development in recent years into account, the “B&R” Initiative has enabled participating countries to achieve above-average economic growth rates and significantly improve their overall capabilities.
However, the above-average economic growth rate is not sufficient to explain the apparent effects of its policies for the following reasons: (1) According to neoclassical growth theory, economies with low initial per capita output levels grow faster over time due to the law of diminishing marginal product [27]. Before the implementation of the “B&R” Initiative, most of the participating countries were developing countries and their economic development was lagging. Since the implementation of the “B&R” Initiative, the level of the economy of the participating countries has improved, which is directly related to the previous level of economic development. It cannot be considered merely as an effect of the “B&R” Initiative. (2) The benefits of policy implementation have a positive effect on economic growth but this promotion effect will continually decrease over time.
While the “B&R” Initiative has led to some economic growth, it is still necessary to prevent the negative effects of its policies. The reasons are as follows: (1) To ensure that the policies are effective for economic growth for a long time, long-term and stable policy safeguards at the national level are required. However, during the process of implementation, a strong legal basis and institutional safeguards were lacking. None of the participating countries was able to formulate laws and regulations at the national level to ensure the smooth implementation of the “B&R” Initiative. From the perspective of policy implementation, the “B&R” Initiative has not been fully understood by everyone [28]. Some projects are questioned, resulting in these projects not being carried out on time. Therefore, the implementation of the policies has not achieved satisfactory results and has little impact on economic development [29]; (2) Due to the abundant energy resources and mineral resources in some participating countries of the “B&R” Initiative, it is easier for these countries to obtain rapid short-term economic growth and more financial revenue through fixed asset investment, infrastructure construction and energy mineral mining [30]. After the implementation of the “B&R” Initiative, these countries have neglected technological innovation and human capital investment due to these short-term growth factors, leading to rent-seeking and corruption [31,32]. As a result, economic growth in these countries is slow and leads to the “resource curse effect” [33,34]; and (3) The economic development of countries participating in the “B&R” Initiative is not only limited by difficult conditions but also by the lack of a flexible environment. Soft constraints such as education resources, scientific and technological innovation, physical problems and ideological ideas can limit the positive effects of capital and other inputs. Addressing the problem of soft environment is one of the prerequisites for the success of the “B&R” Initiative. However, during the actual implementation of the “B&R” Initiative, the governments of various countries pay more attention to capital intervention and infrastructure construction and have obtained short-term capital gains through capital-intensive access to markets. It will lead to the neglect of long-term educational input and soft environment construction, which is not good for economic development.
It has been found that the economic growth effects of the “B&R” Initiative may lead to long-term policy imbalance. In the process of implementing the “B&R” Initiative, a large number of policy preferences have tended to promote the economic growth of the participating countries. In particular, most of the participating countries are developing countries that have advantages in terms of energy and labor. Most of the areas of external investment are confined to infrastructure construction and other industries and there is a high degree of dependence on economic growth in these industries. In this background, developing countries are eager to focus on the short-term growth effects, ignoring the long-term factors of talent and technology and paying too little attention to the construction of a flexible environment. This situation triggers the Dutch disease and the “resource curse effect” [35]. The long-term economic growth factors, such as scientific and technological innovation and investment in personnel training, have been neglected and the long-term economic growth of participating countries is affected. As a result, the effect of the “B&R” Initiative policy on GDP per capita is not significant.
After the introduction addressed in this section, the structure of the paper is given as follows. Section 2 presents the research methodology adopted in this work; Section 3 presents the results of the research and analysis; Section 4 gives a discussion of the findings and draws some conclusions.

2. Methodology

2.1. Method Selection

The “B&R” Initiative could be seen as a quasi-natural policy experiment conducted around the world. After the policy is implemented, there must be a policy effect [36,37]. The DID model is usually used to design experiments to analyze the policy effect. By the end of 2017, the number of countries participating in the “B&R” Initiative had reached 66. These countries are regarded as processing groups, while some of the non-participating countries are selected as the control group in this paper. Based on data from 2011 to 2016, the experiment can be divided into four subsamples and the above four subsamples are distinguished by setting the virtual time variable as dt and the control group variable as du. In the four subsamples, du = 1 indicates that the country participates in the “B&R” Initiative, du = 0 means that the country does not participate in the “B&R” Initiative. dt = 1 stands for the time after the beginning of the “B&R” Initiative, dt = 0 represents the time before the implementation of the “B&R” Initiative. According to the sample definition above, the model of this study is as follows:
Y c t = β 0 + β 1 d u c t + β 2 d t c t + β 3 d u c t d t c t + β 4 χ c t + ε c t
where subscripts c and t represent country c and year t, respectively. χ ct represents the control variables. ε ct is a random disturbance term and the explanatory variable Y measures the economic growth of each country. The specific variables include GDP per capita and the GDP of the country.
The meaning of each parameter in the DID model is shown in Table 1. It can be found from the regression equation (1) that for participating countries (du = 1), the policy effect economic growth changes before and after the “B&R” Initiative are β 0 + β 1 and β 0 + β 1 + β 2 + β 3 , respectively. The economic growth of the participating countries before and after the initiative changes to Δ y = β 2 + β 3 . This change includes the “B&R” Initiative efforts and other economic policy. For countries that do not join the “B&R” Initiative, the economic growth changes before and after the “B&R” Initiative are represented by β 0 and β 0 + β 2 , respectively. Economic change in the non-participating countries is Δ y 1 = β 2 . Therefore, the policy effect of the “B&R” Initiative should be reflected in the difference in economic growth between the participating and the non-participating countries after the implementation of the “B&R” Initiative. The difference in this value is Δ Δ y = β 3 . If the coefficient of Δ Δ y = β 3 is significantly positive, the “B&R” Initiative will promote the economic growth of the participating countries; otherwise, the “B&R” Initiative does not affect the economic growth of the participating countries.
Since the reality cannot satisfy the common trend hypothesis of the DID model, the PSM-DID method was proposed by Heckman et al. [38,39] to correct the DID model results. The core idea of the PSM-DID method is to find the observable variables of the two countries that are as similar as possible between the control group and the processing group. This means that the economic growth trends of the 2 countries are as similar as possible ( χ i = χ j ). Since the participation of countries in the “B&R” Initiative depends on observable variables, country i and country j share the same probability of participating in the “B&R” Initiative. Therefore, they can be compared objectively and fairly. To solve the problems caused by the fact that the processing group and the control group in the DID model do not fully have a common trend before being affected by the “B&R” Initiative, it is necessary to measure the inter-individual distance when matching the individuals in the processing group and the control group. The propensity score matching method is not only a one-dimensional variable but also has a value between [0,1] and has good characteristics in the metric [40].
The steps of the PSM-DID method are as follows: A logit regression is performed on the dependent variables and independent variables to obtain the propensity score; then, calculate the participating countries the Average effect of the Treatment on the Treated (ATT), the ATT consistent estimation equation is:
A T T = 1 N 1 Σ i : i I 1 S P [ ( y 1 t i y o t i ) Σ j : j I 0 S P w ( i , j ) ( y 0 t j y 0 t j ) ]
where S p is the set of common values, I 1 = { i : D i = 1 } is the set of processing groups, I 0 = { i : D i = 0 } is the set of control groups, N 1 is the number of processing groups included in the set I 1 S P and w ( i . j ) is the weight of the pairing with ( i . j ) .

2.2. Data

The “B&R” Initiative was proposed in October 2013, so the policy implementation time was determined to be 2014. Due to the different statistical methods of the parties, the paper uses the data provided by the World Bank database and the United Nations Educational, Scientific and Cultural Organization (UNESCO). The data of 110 countries (Appendix A) in the world in 2011 to 2016 as a sample to evaluate the effectiveness of the “B&R” Initiative.
To measure national economic development, most studies use GDP and per capita GDP as explanatory variables and the explanatory variables are the implementation effects of the “B&R” Initiative, which is a set represented by the dummy variable Y. In study, the countries participating in the “B&R” Initiative are assigned a value of 1; the non-participating countries assigned a value of 0. In addition, a number of other variables are incorporated to control for the impact of the “B&R” Initiative. According to macroeconomic theory, encouraging investment, promoting education and allowing free trade affect economic growth. Therefore, this study selected the following 6 variables from 5 aspects: (1) Economic policy influences the change of import and export [41,42,43]. (2) An increase in employment can boost economic growth [44]. (3) Industrialization and the service sector shows the economic development level of the country where it is located. (4) The improvement of education level will improve the quality of production factors [45,46]. (5) Foreign direct investment raises household savings rates [47]. The detailed calculation method used for all variables is shown in Table 2:

3. Empirical Analysis

3.1. The Results of the Model Analysis

First, the DID method is used to analyze the impact of the “B&R” Initiative through an analysis of the economic growth. The regression results are shown in Table 3.
In Table 3, columns (1) and (2) are the results when other control variables are not added. Columns (3) and (4) are the results when other control variables are added. The calculation results indicate that the influence of the “B&R” Initiative on the GDP and GDP per capita of the countries participating in the “B&R” Initiative is not significant without adding other variables. After adding the control variables, the regression results indicate that the “B&R” Initiative has no significant role in promoting GDP and GDP per capita. When GDP is used as the explanatory variable, all the control variables are significant. When GDP per capita is used as the explanatory variable, all the other control variables are significant except the education level. From the perspective of national development, the “B&R” Initiative has promoted the demand for trade, significantly increased import and export volume and significantly improved the employment population ratio and the industrialization process. The optimization of the tertiary industry structure significantly promotes economic growth and the government’s nonfinancial investment in the country has increased by the GDP. These results come into being when the explanatory variable, the number of educated people, increases significantly but when GDP per capita is the explanatory variable, the number of educated people does not change significantly.
The essential premise of the DID method is that the processing group and the control group must conform to a common assumption of the common trend. That is, before the “B&R” Initiative was proposed, the economic growth trend of the countries in the world had no obvious difference but because the level of economic development of different countries is different, this assumption is not completely satisfied. A common trend assumes that the deviation estimated by the simple method will lead to the deviation of the estimate and the effect of the “B&R” Initiative cannot be evaluated scientifically and rigorously.
To avoid the deviation of the DID trend estimation caused by the common trend assumption of the processing group and control group, the PSM-DID method is further used to evaluate the effect of the “B&R” Initiative. The construction of the “B&R” Initiative relies on an open agreement that is shared and co-constructed. The probability that each individual country in the world will participate in the “B&R” Initiative is the same. Additionally, by using a propensity matching score, countries with the same economic development trend can be identified. Only countries with the same economic development trend can be compared so that the policy effect can be evaluated objectively, impartially and scientifically.
The regression results presented in Table 4 indicate that the regression results obtained using the PSM-DID radius matching method are different from those in Table 3. Before the control variable is added, when GDP is used as the explanatory variable, the interaction term is significant at the 10% interval; however, when GDP per capita is used as the explanatory variable, the interaction term is not significant. The result indicates that the implementation of the “B&R” Initiative has a positive effect on the GDP of participating countries and has no significant effect on per capita GDP. When the control variables are added, when the explanatory variable is the GDP, the interaction item is significant at the 5% interval. When the explanatory variable is GDP per capita, the interaction item is not significant. After adding control variables, the significance is more obvious. This result indicates that the selected control variables are effective for the “one-way initiative” policy and further prove the relevance of the variables used in the previous selection.
The regression results show that among the selected variables, except import and export volume and education level, are negatively correlated but the other variables are positively correlated. The results indicate that the “B&R” Initiative has accelerated the economic growth of countries that have participated in the “B&R” Initiative. The regression results for the control variables show that the implementation of the “B&R” Initiative has prompted the countries participating in the “B&R” Initiative to significantly increase their nonfinancial investment and foreign direct investment in their countries and promote participation in the national industrialization process and the development of the tertiary industry. The reduction in the level of education leads to a temporary level of human capital, which reduces the impact on economic growth. The reduction in trade volume has a negative effect on economic growth. The regression signs of the “B&R” Initiative through these economic variables show that, in light of the actual situation, the current cooperation direction of the “B&R” Initiative is mostly infrastructure and in the control scalar, the relevant variables are significant. Support is closely related, however, in recent years, the trend of anti-globalization has become increasingly apparent; global trade has been dramatically affected by it and the issue of educational resources has become more apparent. Therefore, the regression results are also in line with the actual situation.
According to the results of Table 5, when taking into account the lagging effect of the policy effect of the “B&R” Initiative, this initiative has obviously promoted the GDP growth of the countries that participate in the “B&R” Initiative and the promotion effect on per capita GDP is still not significant. The lagging effect of the initiative on national economic growth is significant but the lagging effect on the growth of per capita GDP in the participating countries is not significant. This result means that only by refining the “B&R” Initiative and correcting the existing loopholes in time will it be possible for the “B&R” Initiative to promote the economic growth of the participating countries in a comprehensive way.
The “B&R” Initiative is a major measure that can help all countries achieve the coordinated development of regional economies, society and national economies. It is taking a long time for it to implement and its impact is more long-term. With the gradual implementation of the “B&R” Initiative, relevant supporting policies have been gradually improved and the “B&R” Initiative has participated in the policy of the state. The ability to recognize and practice will also gradually strengthen. Therefore, the “B&R” Initiative will gradually promote the economic growth of the countries that participate in the “B&R” Initiative. In Table 5, the lag effect of the “B&R” Initiative is tested.
To overcome the systematic discrepancy in the economic growth of the countries that participate in the “B&R” Initiative and that of non-participating countries, to ensure the effectiveness of the PSM-DID method, this study further tests the robustness of the “B&R” Initiative promote the national economic growth of countries participating in the “B&R” Initiative. The estimated results are shown in Table 6.
According to Table 6, the regression results show that using the PSM-DID method that includes nearest neighbor matching for countries participating in the “B&R” Initiative, the GDP has a significant effect on per capita GDP, with no significant role in promoting, which verifies the above analysis results.

3.2. Analysis of Influencing Factors

From the analysis results of the previous article, it can be concluded that the “B&R” Initiative has promoted the rapid growth of the GDP of the countries participating in the “B&R” Initiative but has not significantly promoted per capita GDP in those countries. The test results of the previous article indicate that the “B&R” Initiative has promoted the rapid growth of the GDP in countries participating in the “B&R” Initiative and did not significantly promote the per capita GDP in those countries. What factors have led to the policy effect of the “B&R” Initiative? Have the countries got the results they deserve? To answer these questions, the research investigated the “B&R” Initiative and sought to identify growth drivers and the role of various economic initiatives.
In Table 7, the interaction term represents the net effect of the “B&R” Initiative on various economic factors. According to the results of the previous regression, except for the fact that trade import and export volume and education level have no significant effect on economic growth, the other economic factors have promoted economic growth. However, according to the regression results presented in Table 7, the “B&R” Initiative positively affects trade import and export and the effect on the other types of economic factors is either not visible or has an extrusion effect.
The above analysis shows that the “B&R” Initiative promotes growth “in the GDP of participating countries due to various economic factors but the lack of an effective system to ensure the full effect of the policy, even in the current circumstances of the use of particular kinds of various economic factors, has produced significant crowding out effects, which has caused the “B&R” Initiative to promote significant GDP growth in participating countries without a substantial increase in per capita GDP.
Due to the relatively short implementation time of the “B&R” Initiative, the implementation is still insufficient. Most of the countries participating in the “B&R” Initiative are developing countries; the global economy is currently in a downward trend, so many countries aim to increase their GDP. At present, most of the projects implemented by the “B&R” Initiative involve infrastructure construction. Most of the funds are invested in infrastructure and the construction of a large number of infrastructures can quickly promote the rapid growth of the GDP of the participating countries in a short period. However, the implementation of the “B&R” Initiative began relatively recently and the data collection deadline used in this study of 2016; it usually takes a long time to complete infrastructure construction and the promotion of growth in per capita GDP is lagging. This study analyzes the “B&R” Initiative, which has a significant role in promoting the GDP of the participating countries and has a significant effect on per capita GDP.
Second, because of the abnormal operation of the current world trade system, the volume of trade among countries has been disturbed by many factors. At present, the protectionist forces of various countries are gradually rising, raising the tariff rates of imported goods to promote the economic recovery of their own countries, which directly affects the volume of trade among countries. The prohibition of some technology exports and the prohibition of investment in other countries by some industries have led to the development of the “B&R” Initiative, which has not achieved the expected role in promoting the import and export volume of foreign goods, foreign direct investment and the growth in government nonfinancial investment.
Finally, due to the development of globalization promoted by the “B&R” Initiative, at the industry level, the implementation of the initiative will reduce the market access mechanism and the negative impact of the contraction of industries lacking comparative advantage in the original countries will be comparatively advantageous. The expansion of the industry is hedged; at the enterprise level, the entry and exit process of enterprises have increased due to the development of globalization, concentrating resources in high-productivity enterprises and making the transformation of industrialization and industrial structure ineffective. The development of globalization has led to an increase in labor and the mobility of the education and it has hindered the improvement of the labor market and education systems in various countries, causing welfare losses for some people, making the growth of labor and education not significant. On the other hand, the results show that there is no obvious increase in per capita GDP.

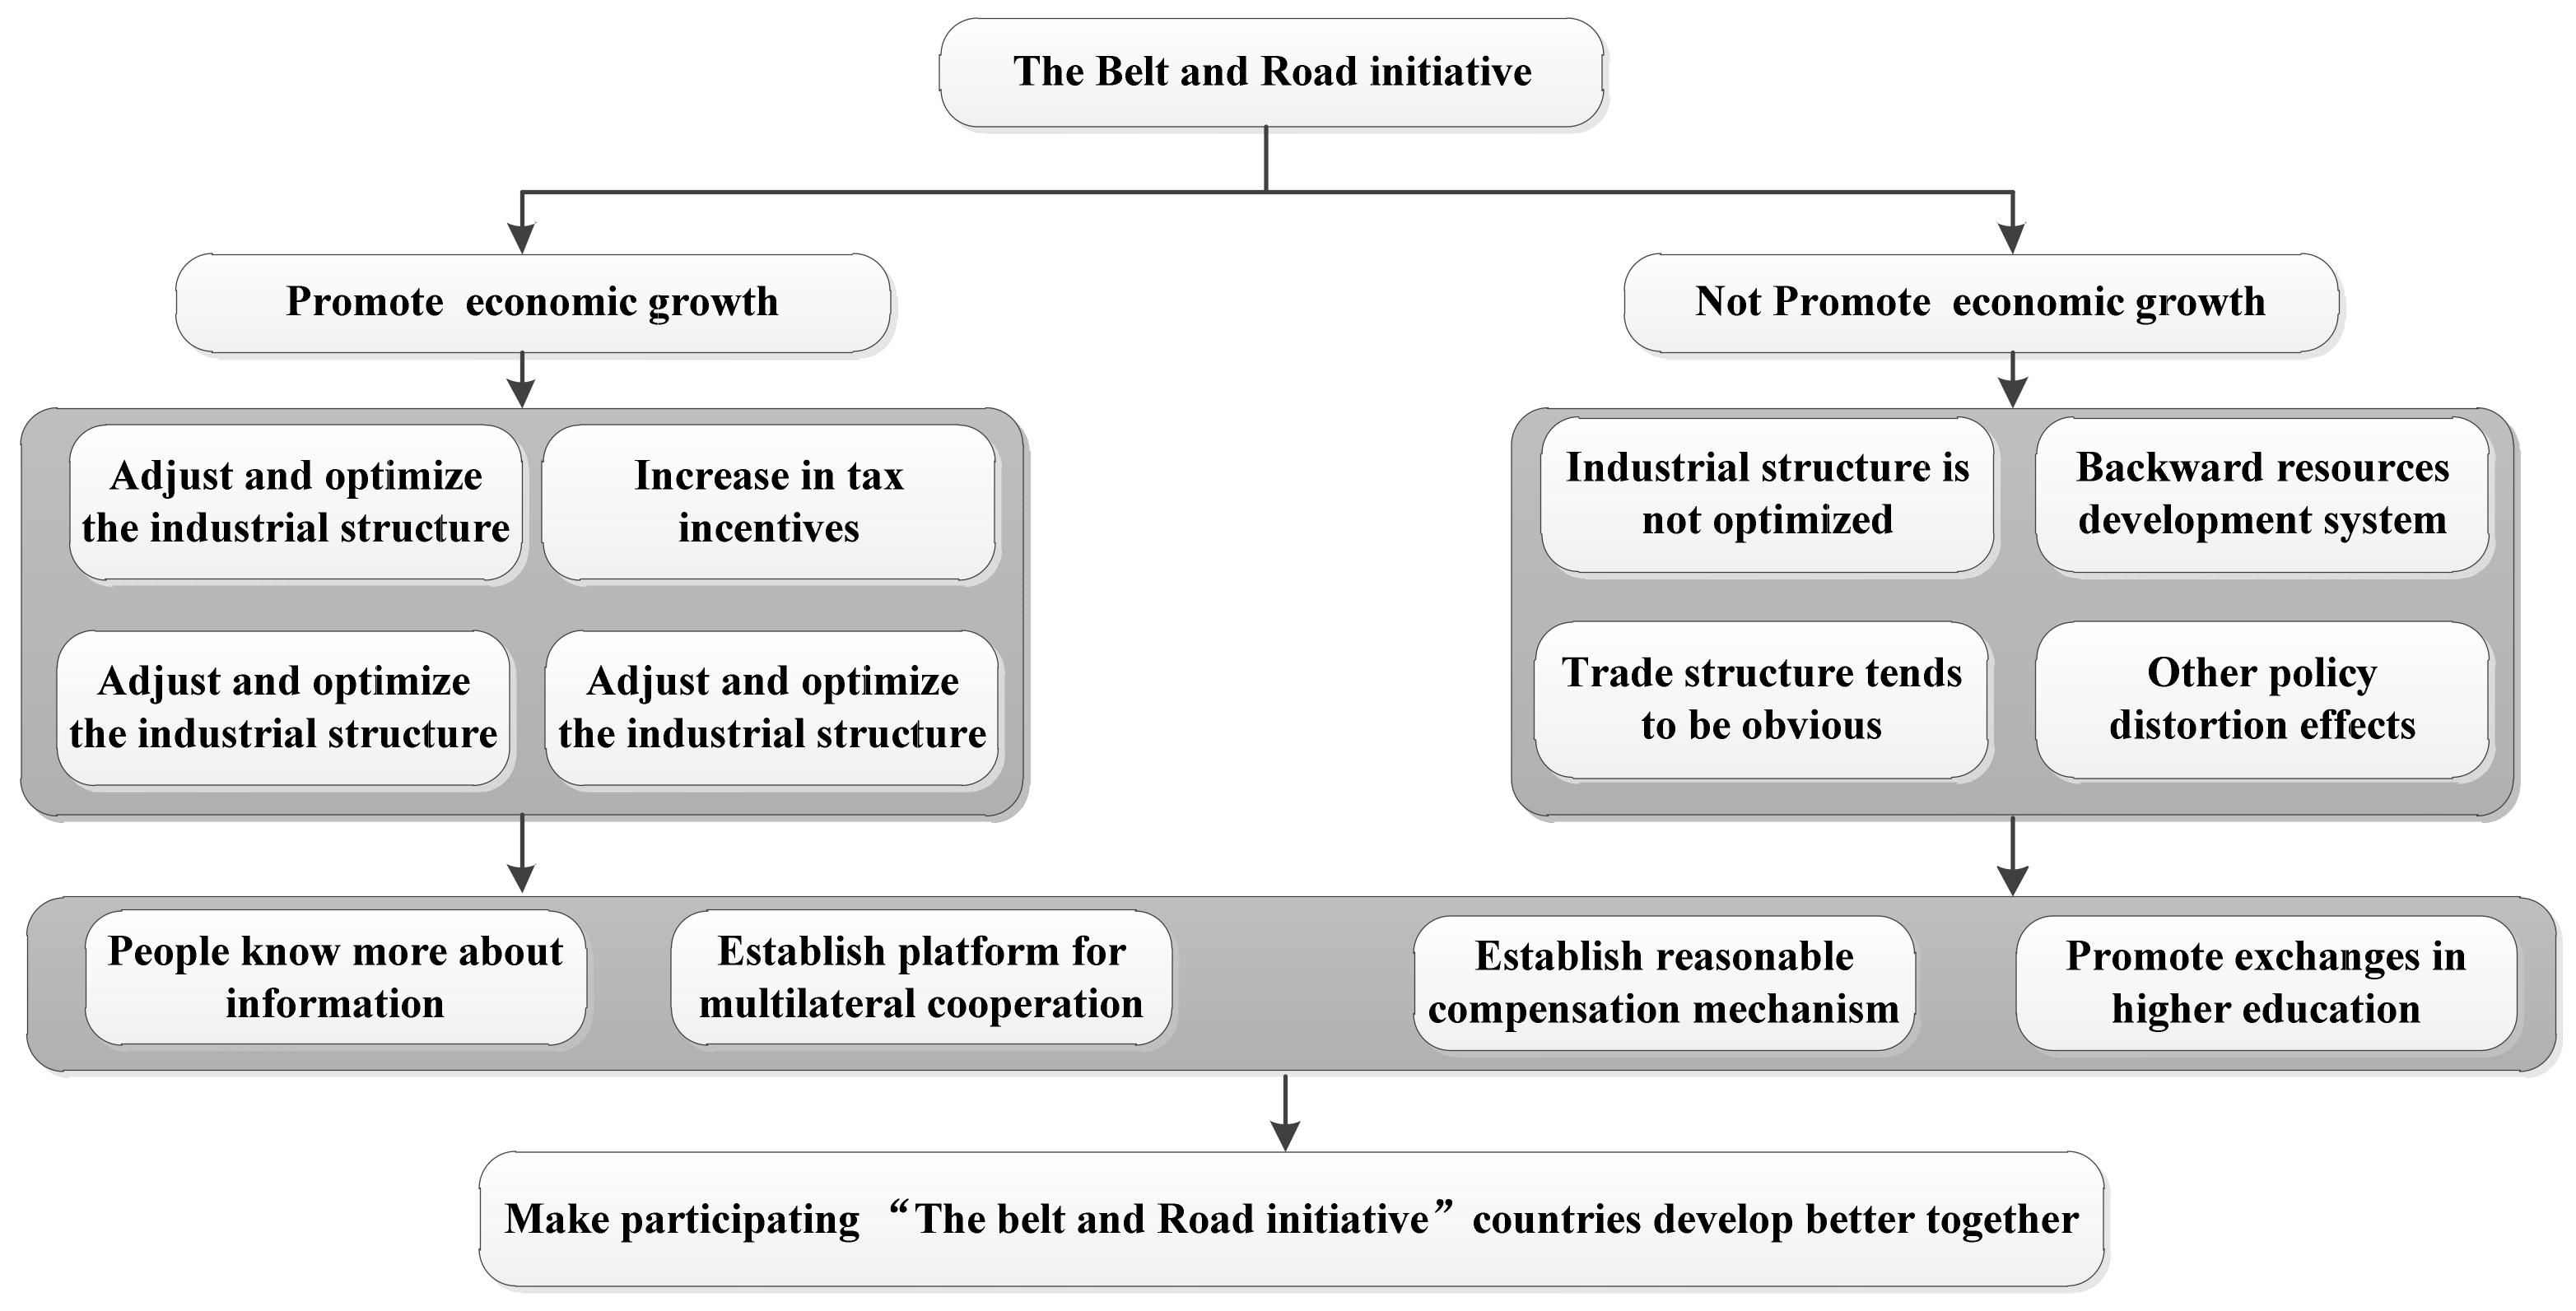
3.3. Policy Suggestions

According to the analysis results of this study, for the “B&R” Initiative, it is still necessary to focus on solving the crowding out effect, giving full play to policy dividends and promoting the rapid economic development of countries participating in the “B&R” Initiative and attracting more countries to join. In cooperation with other countries involved in the “B&R” Initiative, all sides have been able to achieve rapid growth and shared prosperity.
Although the “B&R” Initiative has promoted the rapid growth of participating countries’ GDP, in many respects, the countries and the people are in a situation where information is not entirely symmetrical. Therefore, the “B&R” Initiative is a good macro policy implementation environment and the policy effect is fully exerted through the establishment of a good policy environment among the countries. Due to the differences in laws and regulations of countries, the implementation of the “B&R” Initiative lacks the protection and recognition of laws in various countries, which leads to the implementation of policies. Therefore, each country needs to provide similar support at the macro policy level so that the implementation of the “B&R” Initiative will be more thorough. Of course, the implementation of macroeconomic policies is inseparable from the corresponding support systems, so each country needs to cooperate at all levels.
According to the previous analysis, it is found that the “B&R” Initiative hurts trade growth. If the problem needs to solve, countries need to establish an excellent platform for multilateral cooperation with good communication and reduce the trade frictions among countries through the good cooperative relationships established by the multilateral cooperation platform.
It is important to avoid the “curse to the latecomer” as much as possible, Since most of the countries participating in the “B&R” Initiative are developing countries, they continue to learn advanced technologies and the management models used in developed countries in the process of development, thus promoting their own development but long-term imitation will cause them to lack technical ability. In the short term, developing countries will achieve extensive economic development but there are many hidden dangers in long-term development and if they are not corrected in time, it will fail.
As the “B&R” Initiative has an inhibitory effect on the growth of educational resources, resulting in an increase in the level of human capital and insufficient talent for industrial restructuring, it is difficult to effectively promote rapid economic growth. Therefore, it is necessary to build a new soft environment and a model of economic growth suitable for each country. In the initial stages of the “B&R” Initiative, the infrastructure of each country was built. In other words, this was not a concern but it was necessary to establish a soft environment such as natural ecology and legal system.
As the implementation of the “B&R” Initiative promotes the process of globalization, some industries and enterprises are bankrupt and lose out and the damaged industries and enterprises are compensated to a certain extent through the establishment of reasonable compensation mechanisms. The initiative enhances their competitiveness and helps countries to achieve common development.

4. Conclusions

In recent years, the global economy has been growing slowly. Countries around the world are looking for reasonable measures to stimulate their economies. As a major regional development policy involving the whole world, the “B&R” Initiative is favored by many countries and its influence affects the willingness of non-participating countries. Due to its popularity around the world, the “B&R” Initiative should be evaluated to improve the current deficiencies and promote economic growth quickly.
In this study, the method of PSM-DID is used to evaluate “B&R” Initiative. First, the “B&R” Initiative is initially evaluated using the DID method but the results are not accurate enough because of too many interference factors. In order to solve this problem, the latest PSM-DID model is considered. Specifically, Propensity Score Matching is used to find countries with the same economic growth trend and then the DID model is repeated again. Second, considering the lag of policy effect of the “B&R” Initiative, a hysteresis test and robustness tests are carried out in this study. The results reveal that the “B&R” Initiative project has effectively promoted the rapid growth of the GDP of the participating countries but the improvement of per capita GDP growth is not significant. Finally, the selected variables are tested in this study. It is found that the selected variables are not changed significantly, the evaluation of “B&R” Initiative is not only the analysis of the early effects of “B&R” but also the deficiencies in the later development.
This study mainly discusses the impact of the “B&R” Initiative on participating countries from an economic perspective. However, analysis can only be performed with selected variables, which has certain limitations. It is worth noting that the effect of the policy is also affected by political aspects. From the current perspective, political factors cannot be quantified, resulting in analysis results being affected to some extent. Since the “B&R” Initiative has been implemented recently, its final effect is not significant, which has an individual impact on the analysis of the calculation results. As for future research, it will be interesting to develop more data and indicators to evaluate the policy effects of the “B&R” Initiative.

Author Contributions

Conceptualization, Q.S., Methodology and writing original draft preparation, X.Z., Formal analysis, X.X., Project administration, Q.Y., Review and editing, S.W.

Funding

This research was funded by the China Central University’s Basic Research Special Fund Project (310823170109;300102238401;300102238605;300102238655); the National Natural Science Foundation of China (No. 71701022); the Natural Science Basic Research Plan in Shanxi Province of China (No. 2018JQ7002); the Social Science Research Plan in Shanxi Province (No. 2018KRM133); and the Social Science Research Plan in Xian (No. 19Z73).

Conflicts of Interest

The authors declare no conflict of interest.

Appendix A

110 countries include: Albania, Afghanistan, the United Arab Emirates, Oman, Azerbaijan, Egypt, Australia, Pakistan, Bahrain, Belarus, Bhutan, Bulgaria, Bosnia and Herzegovina, Poland, Russia, the Philippines, Montenegro, Georgia, Kazakhstan, Kyrgyzstan, Cambodia, the Czech republic, Qatar, Kuwait, Croatia, Latvia, Laos, Lebanon, Lithuania, Macedonia, Romania, Maldives, Malaysia, Mongolia, Nepal, Bangladesh, Burma, Moldova, Serbia, Slovakia, Slovenia, Saudi Arabia, Sri Lanka, Tajikistan, Brunei, Thailand, Turkey, Turkmenistan, Ukraine, Uzbekistan, Greece, Hungary, America, Singapore, New Zealand, Yemen, Iraq, Iran, Israel, India, Indonesia, Jordan, Vietnam, China, Argentina, Ethiopia, Ireland, Papua New Guinea, Angola, Austria, Brazil, Belgium, Villa, Iceland, Bolivia, Denmark, Germany, Dominica, Fiji, France, Finland, the Congo (gold), Colombia, Costa Rica, South Korea, the Netherlands, Canada, Cameroon, Ghana, the United States, Peru, Morocco, Mexico, South Africa, Nigeria, Norway, Portugal, Japan, Sweden, Senegal, San Marino, Venezuela, Ukraine, Spain, Italy, the United Kingdom and Chile

References

  1. Liu, W. Scientific understanding of the B&R Initiative of China and related research themes. Prog. Geogr. 2015, 5, 538–544. [Google Scholar]
  2. Wang, Y. Offensive for defensive: The B&R initiative and China’s new grand strategy. Pac. Rev. 2016, 29, 455–463. [Google Scholar]
  3. Flint, J.F.B.C. The Geopolitics of China s Maritime Silk Road Initiative. Geopolitics 2017, 22, 223–245. [Google Scholar]
  4. Kong, L. The B&R Initiative and China’s Foreign Policy Toward Its Territorial and Boundary Disputes. China Q. Int. Strateg. Stud. 2015, 2, 325–345. [Google Scholar]
  5. Overholt, W. One Belt One Road One Pivot Global Asia Corrected. Glob. Asia 2015, 10, 1–8. [Google Scholar]
  6. Kaczmarski, M. Two ways of influence-building: The Eurasian economic union and the one belt, one road initiative. Eur. Asia Stud. 2017, 69, 1027–1046. [Google Scholar] [CrossRef]
  7. Ferdinand, P. Westward ho—The China dream and ‘one belt, one road’: Chinese foreign policy under Xi Jinping. Int. Aff. 2016, 92, 941–957. [Google Scholar] [CrossRef]
  8. Yan, G.J.A.M. China’s New Silk Road: Where Does It Lead. Asian Perspect. 2016, 40, 105–130. [Google Scholar]
  9. Liu, H.; Yeerken, W.; Wang, C. Impacts of the B&R Initiative on the spatial pattern of territory development in China. Prog. Geogr. 2015, 34, 545–553. [Google Scholar]
  10. García-Herrero, A.; Xu, J. China’s B&R initiative: Can Europe expect trade gains? China World Econ. 2017, 25, 84–99. [Google Scholar]
  11. Kamel, M.S. China’s B&R Initiative: Implications for the Middle East. Camb. Rev. Int. Aff. 2018, 31, 76–95. [Google Scholar]
  12. Chan, S. The B&R Initiative: Implications for China and East Asian Economies. Cph. J. Asian Stud. 2017, 35, 52–78. [Google Scholar]
  13. Duan, F.; Ji, Q.; Liu, B.; Fan, Y. Energy investment risk assessment for nations along China’s Belt & Road Initiative. J. Clean. Prod. 2018, 170, 535–547. [Google Scholar]
  14. Mou, N.; Liu, C.; Zhang, L.; Fu, X.; Xie, Y.; Li, Y.; Peng, P. Spatial Pattern and Regional Relevance Analysis of the Maritime Silk Road Shipping Network. Sustainability 2018, 4, 977. [Google Scholar] [CrossRef]
  15. Huang, J.; Liu, J. International production capacity cooperation of metal industry. China Popul. Resour. Environ. 2017, 27, 1–7. [Google Scholar]
  16. Du, J.; Zhang, Y. Does One Belt One Road initiative promote Chinese overseas direct. China Econ. Rev. 2018, 47, 189–205. [Google Scholar] [CrossRef]
  17. Chohan, U.W. What Is One Belt One Road? A Surplus Recycling Mechanism Approach. Available online: https://ssrn.com/abstract=2997650 (accessed on 13 June 2017).
  18. Shrestha, M.B. Cooperation on finance between China and Nepal: B&R initiatives and investment opportunities in Nepal. J. Financ. Data Sci. 2017, 3, 31–37. [Google Scholar]
  19. Rolland, N. China’s New Silk Road, The National Bureau of Asian Research NBR Commentary. 12 February 2015. Available online: https://www.nbr.org/publication/chinas-new-silk-road/ (accessed on 10 September 2019).
  20. Cai, P. Understanding China’s B&R Initiative; Think-Asia: Beijing, China, 2017. [Google Scholar]
  21. Tielin, G.; Sanggyun, N.; Xiaohan, D.; Yongli, Z. Study of the competitiveness of Quanzhou Port on the Belt and Road in China based on a fuzzy-AHP and ELECTRE III model. Sustainability 2018, 10, 1253. [Google Scholar] [CrossRef]
  22. Mankiw, N.G. Principles of Economics 7th; South-Western College Pub Chula Vista: Santa Monica, CA, USA, 2014. [Google Scholar]
  23. Kristian, B. International integration and regional inequalities: How important in notional infrastructure. Manch. Sch. 2011, 79, 952–971. [Google Scholar]
  24. Kneller, R.; Pisu, M. Industrial linkages and export spillovers from FDI. World Econ. 2007, 30, 105–134. [Google Scholar] [CrossRef]
  25. Grossman, G.M.; Helpman, E. Innovation and Growth in the World Economy; MIT Press: Cambridge, MA, USA, 1991. [Google Scholar]
  26. Foster, N.; Greenaway, D. Import, Export, Knowledge Spillovers and Growth. Econ. Lett. 2011, 32, 1147–1175. [Google Scholar]
  27. Sala-i-Martin, X. Cross-sectional Regressions and the Empirics of Economic Growth. Eur. Econ. Rev. 1994, 38, 739–747. [Google Scholar] [CrossRef]
  28. Chari, V.V.; Kehoe, P.J.; Prescott, E.C. Time Consistency and Policy; Staff Report 115; Federal Reserve Bank of Minneapolis: Minneapolis, MN, USA, 1988. [Google Scholar]
  29. Mitchell, M.F.; Moro, A. Persistent Distortionary Policies with Asymmetric Information. Am. Econ. Rev. 2006, 96, 387–393. [Google Scholar] [CrossRef] [Green Version]
  30. Hornbeck, D.D.R. Railroads and American Economic Growth: A “Market Access” Approach. Q. J. Econ. 2016, 131, 799–858. [Google Scholar]
  31. Lehne, J.; Shapiro, J.N.; Eynde, O.V. Building connections: Political corruption and road construction in India. J. Dev. Econ. 2018, 131, 62–78. [Google Scholar] [CrossRef] [Green Version]
  32. Knutsen, C.H.; Kotsadam, A.; Olsen, E.H.; Wig, T. Mining and local corruption in Africa. Am. J. Political Sci. 2017, 2, 320–334. [Google Scholar] [CrossRef]
  33. Warner, J.D.S.A. Sources of slow growth in African economies. J. Afr. Econ. 1997, 6, 335–376. [Google Scholar]
  34. Sachs, J.D.; Warner, A.; Aslund, A.; Fischer, S. Economic reform and the process of global integration. Brook. Pap. Econ. Act. 1995, 1, 1–118. [Google Scholar] [CrossRef]
  35. Bahar, D.; Santos, M.A. One more resource curse: Dutch disease and export concentration. J. Dev. Econ. 2018, 132, 102–114. [Google Scholar] [CrossRef] [Green Version]
  36. Ashenfelter, O.C.; Card, D. Using the Longitudinal Structure of Earnings to Estimate the Effect of Training Programs. Rev. Econ. Stat. 1984, 67, 648–660. [Google Scholar] [CrossRef]
  37. Poterba, J.G.J. Tax Incentives and the Decision to Purchase Health Insurance: Evidence from the Self-Employed. Q. J. Econ. 1994, 109, 701–733. [Google Scholar]
  38. Heckman, J.J.; Ichimura, H.; Todd, P.E. Matching as an econometric evaluation estimator: Evidence from evaluating a job training programme. Rev. Econ. Stud. 1997, 64, 605–654. [Google Scholar] [CrossRef]
  39. Heckman, J.J.; Ichimura, H.; Todd, P. Matching as an Economic Evaluation Estimator. Rev. Econ. Stud. 1998, 65, 261–294. [Google Scholar] [CrossRef]
  40. Rosenbaum, P.R.; Rubin, D.B. The central role of the propensity score in observational studies for causal effects. Biometrika 1983, 70, 41–55. [Google Scholar] [CrossRef]
  41. Goldstein, M.; Khan, M.S. Income and price effects in foreign trade. In Handbook of International Economics; Jones, R.W., Kenen, P.B., Eds.; Elsevier Science Publications: New York, NY, USA, 1985; Volume 2, pp. 1041–1105. [Google Scholar]
  42. Moreno, L. The determinants of Spanish industrial export to the European Union. Appl. Econ. 1997, 29, 723–732. [Google Scholar] [CrossRef]
  43. Fung, V.K. Jobs, global trade and the perils of protectionism: The imperative of restoring confidence. In The Collapse of Global Trade, Murky Protectionism, and the Crisis: Recommendations for the G20; Baldwin, R., Evenett, S., Eds.; Centre for Economic Policy Research (CEPR): London, UK, 2009; Volume 25, pp. 25–29. [Google Scholar]
  44. Bloom, D.; Canning, D.; Sevilla, J. The Demographic Dividend: A New Perspective on the Economic Consequences of Population Change; RAND: Santa Monica, CA, USA, 2003. [Google Scholar]
  45. Lucas, R.E. On the Mechanics of Economic Development. J. Monet. Econ. 1988, 22, 3–42. [Google Scholar] [CrossRef]
  46. Ram, R. Government size and Economic Growth: A New Framework and Some Evidence from Cross-section and time-series data. Am. Econ. Rev. 1986, 76, 191–203. [Google Scholar]
  47. Acemoglu, D.; García-Jimeno, C.; Robinson, J.A. State Capacity and Economic Development: A Network Approach. Am. Econ. Rev. 2015, 1, 2364–2409. [Google Scholar] [CrossRef]
Figure 1. The Belt and Road (B&R) initiative policy effect.
Sustainability 11 05240 g001
Table 1. The meaning of each parameter used in the differences in differences (DID) model.
EconomicBefore the “Belt and Road Initiative” (dt = 0)After the “Belt and Road Initiative” (dt = 1)Difference
Participating countries (treatment, du = 1)β1β0 + β1 + β2 + β3Δy = β2 + β3
Non-participating countries (control, du = 0) β0 + β2Δy = β2
DID ΔΔy = β3
Table 2. Main variables and their calculation methods.
Variable NameVariable MeaningComputing Method
LnGDPnumerical value of GDPLogarithm for GDP
LnperGDPnumerical value of per capita GDPnumerical value of per capita GDP
The B&Rin or not in B&RDummy variable (0.1)
IeImport and exportAmont of import and exports
Work-peopleWorking peopleLabor/total population
IndrusryIndustrializationIndustrial, etc., (% of GDP)
EDUEducationPrimary school enrollment rate
FDIForeign direct investmentNet inflows of foreign direct investment
TertiaryThe service sectorService, etc., (% of GDP)
OFDIGovernment nonfinancial investmentInvestment in nonfinancial assets
Table 3. ”B&R” on participating countries economic growth in the DID method.
Explanatory VariablelnGDPlnperGDPGDPLnperGDP
(1)(2)(3)(4)
dt−0.0110−0.03630.0156−0.0845
(−0.05)(−0.22)(0.09)(−0.91)
du−1.042 ***−0.578 ***−0.942 ***−0.215 *
(−4.91)(−3.88)(−5.64)(−2.43)
did0.01340.00399−0.236−0.138
(0.04)(0.02)(−1.04)(−1.14)
le 6.60 × 10⁻¹³ ***2.69 × 10⁻¹³ ***
(5.75)(4.44)
workpeople 5.43 × 10⁻⁹ ***2.60 × 10⁻⁹ ***
(5.93)(−5.36)
industry 0.0850 ***0.106 ***
(9.23)(21.84)
EDU 0.0259 ***0.00298
(3.64)(0.79)
FDI 3.37 × 10−12 *2.19 × 10−12 **
(2.34)(2.87)
Tertiary 0.0585 ***0.110 ***
(6.89)(24.42)
OFDI −0.105 ***−0.0407 ***
(−5.56)(−4.06)
_cons26.11 ***9.442 ***17.41 ***−0.804
(158.78)(81.75)(14.42)(−1.26)
N658658478478
Notes: Standard errors appear in parentheses, * indicates p < 0.05, ** indicates p < 0.01 and *** indicates p < 0.001.
Table 4. ”B&R” on participating countries economic growth in the propensity score matching-difference in difference (PSM-DID) method.
Explanatory Variables(1)(2)(3)(4)
InGDPInperGDPInGDPInperGDP
dt−0.208−0.0762−0.207−0.0369
(0.194)(0.199)(0.139)(0.102)
du−0.203−0.462 ***0.329 ***0.245 ***
(0.172)(0.177)(0.128)(0.0946)
did0.409 *0.02770.353 **0.0987
(0.245)(0.252)(0.178)(−1.14)
le −0 ***−0 ***
(0)(0)
Work_people 2.19 × 10⁻⁸ ***3.06 × 10⁻⁸ ***
2.62 × 10−91.93 × 10−9
industry 0.160 ***0.207 ***
(0.0142)(0.104)
EDU −0.0196 **−0.0185 ***
(0.00793)(0.00584)
FDI 0 **0 ***
(0)(0)
Tertiary 0.192 ***0.244 ***
(0.0133)(0.00978)
OFDI 0.109 ***0.166 ***
(0.0253)(0.0186)
_cons25.83 ***9.691 ***9.944 ***−11.49 ***
(0.136)(0.140)(1.431)(1.054)
N292292292292
Notes: Standard errors appear in parentheses, * indicates p < 0.05, ** indicates p < 0.01 and *** indicates p < 0.001.
Table 5. Hysteresis effect test on “B&R.”.
Explanatory Variables(1)(1)(2)(2)
InGDPInperGDPInGDPInperGDP
dt−0.208−0.0762−0.214−0.0495
(0.193)(0.199)(0.140)(0.105)
du−0.203−0.462 ***0.334 **0.249 **
(0.171)(0.177)(0.130)(0.0973)
dt1_du0.1390.1800.411 *0.264
(0.285)(0.294)(0.228)(0.171)
dt2_du0.565 *0.4800.2980.126
(0.294)(0.303)(0.214)(0.160)
dt3_du0.542 *0.1970.350 *−0.0521
(0.285)(0.294)(0.207)(0.156)
Observations292292292292
R-squared0.0220.0340.4980.738
Notes: Standard errors appear in parentheses, * indicates p < 0.05, ** indicates p < 0.01 and *** indicates p < 0.001.
Table 6. Test on “B&R.”.
Explanatory Variables(1)(1)(2)(2)
InGDPInperGDPInGDPInperGDP
dt−0.348−0.0317−0.328 *0.0762
(0.215)(0.214)(0.174)(0.139)
du−0.163−0.394 **0.318 **0.267 **
(0.190)(0.188)(0.158)(0.127)
did0.564 **0.1750.510 **0.0104
(0.270)(0.268)(0.219)(0.1175)
Ie −0 ***−0 ***
(0)(0)
work_people 1.93 × 10⁻⁸ ***3.04 × 10⁻⁸ ***
3.32 × 10−92.65 × 10−9
industry 0.163 ***0.236 ***
(0.0192)(0.0153)
EDU −0.0169 **−0.00628 ***
(0.00944)(0.00754)
FDI 0 **0 ***
(0)(0)
tertiary 0.195 ***0.266 ***
(0.0180)(0.009143)
OFDI 0.137 ***0.187 ***
(0.02322)(0.0258)
_consant25.90 ***9.696 ***9.436 ***−114.98 ***
(0.152)(0.150)(1.963)(1.547)
Observations305305305305
R-squade0.0170.0230.3810.600
Notes: Standard errors appear in parentheses, * indicates p < 0.05, ** indicates p < 0.01 and *** indicates p < 0.001.
Table 7. Mechanism Test of “B&R” variables.
Explanatory VariablesIeWork_PeopleIndustryEDUFDIFertiaryOFDI
dt−2.61 × 1092,731,347.9−1.1460.3893.16 × 1091.065−0.516
(−0.03)−0.24(−0.82)−0.36 −0.7(−1.28)
du−1.58707 × 10119,051,4484.197 ***−2.068 *−0.7−5.456 ***0.263
(−2.17)−0.87−3.36(−2.07)−3.41 × 10⁹(−3.91)−0.72
did2.51622 × 10114,293,2580.0114−0.0874(−0.83)0.4780.925
−2.44−0.29−0.01(−0.06)−4.89 × 10⁹−0.24−1.78
_cons3.77018 × 1011 ***17,160,481.0 *28.52 ***103.6 ***(−0.85)62.15 ***2.409 ***
−6.66−2.1−29.39−134.271.39946 × 1010 ***−57.67−8.64
N616598579616−4.38616458
Notes: Standard errors appear in parentheses, * indicates p < 0.05, ** indicates p < 0.01 and *** indicates p < 0.001.

