Health and Heating in the City of Temuco (Chile). Monetary Savings of Replacing Biomass with PV System in the Residential Sector


Abstract
1. Introduction
2. Materials and Methods
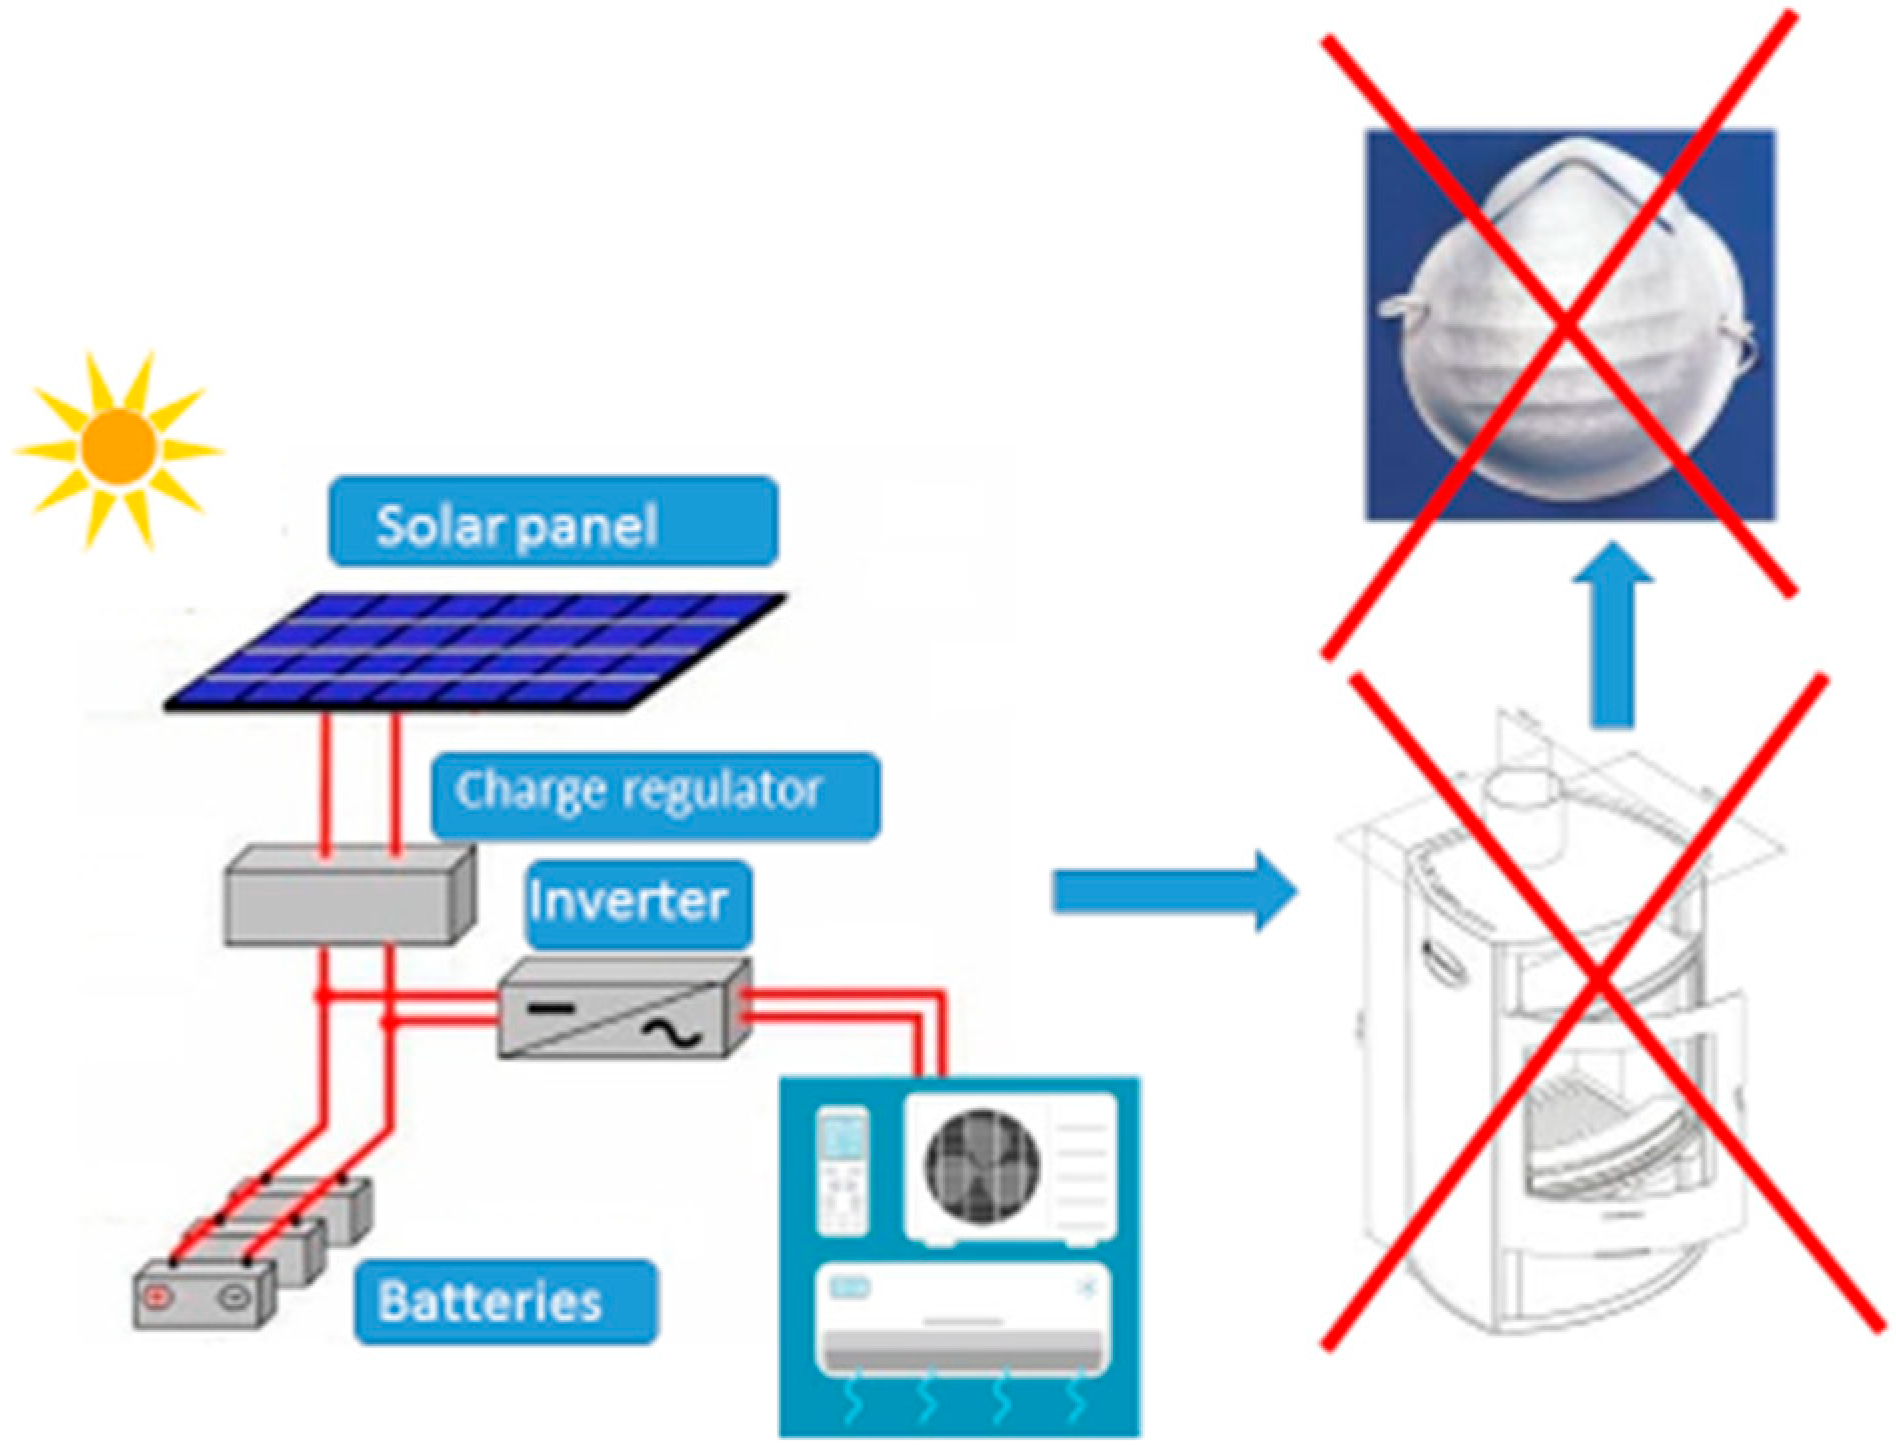
2.1. PV + Storage System Characteristics
2.2. Monetary Valuation of Health Damage
2.3. Monetary Valuation of Emissions Avoided
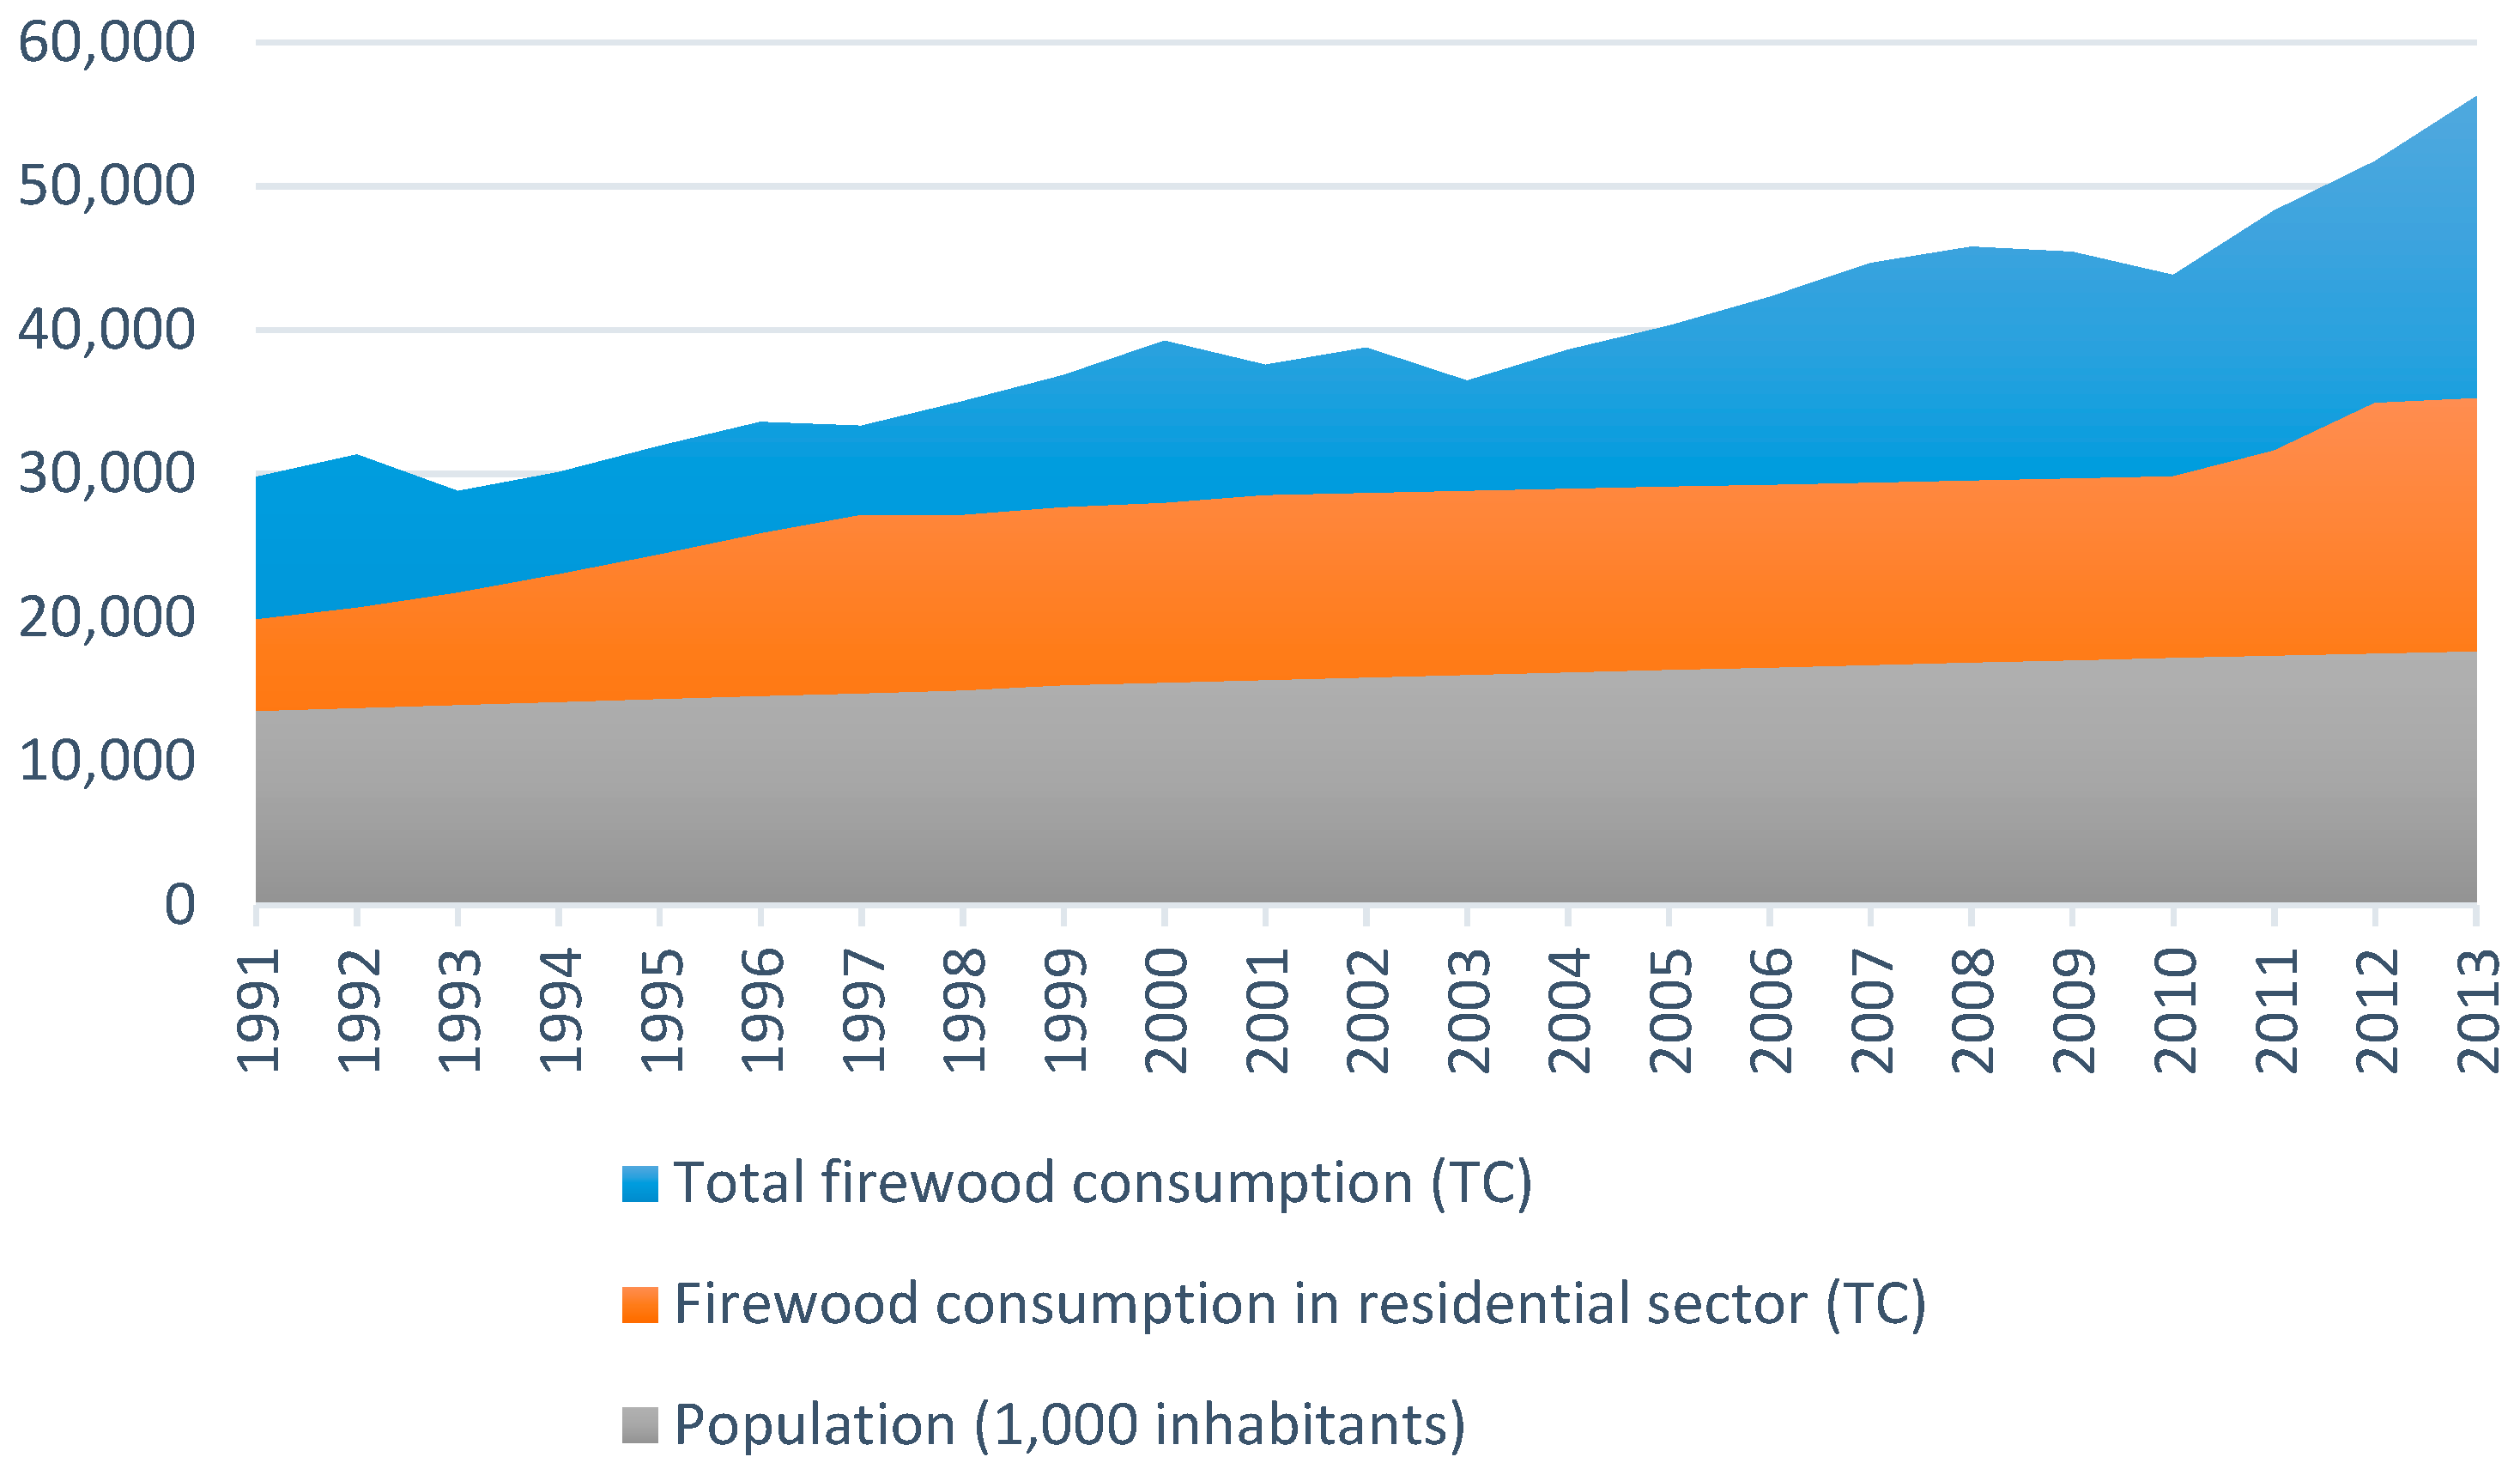
2.4. Data
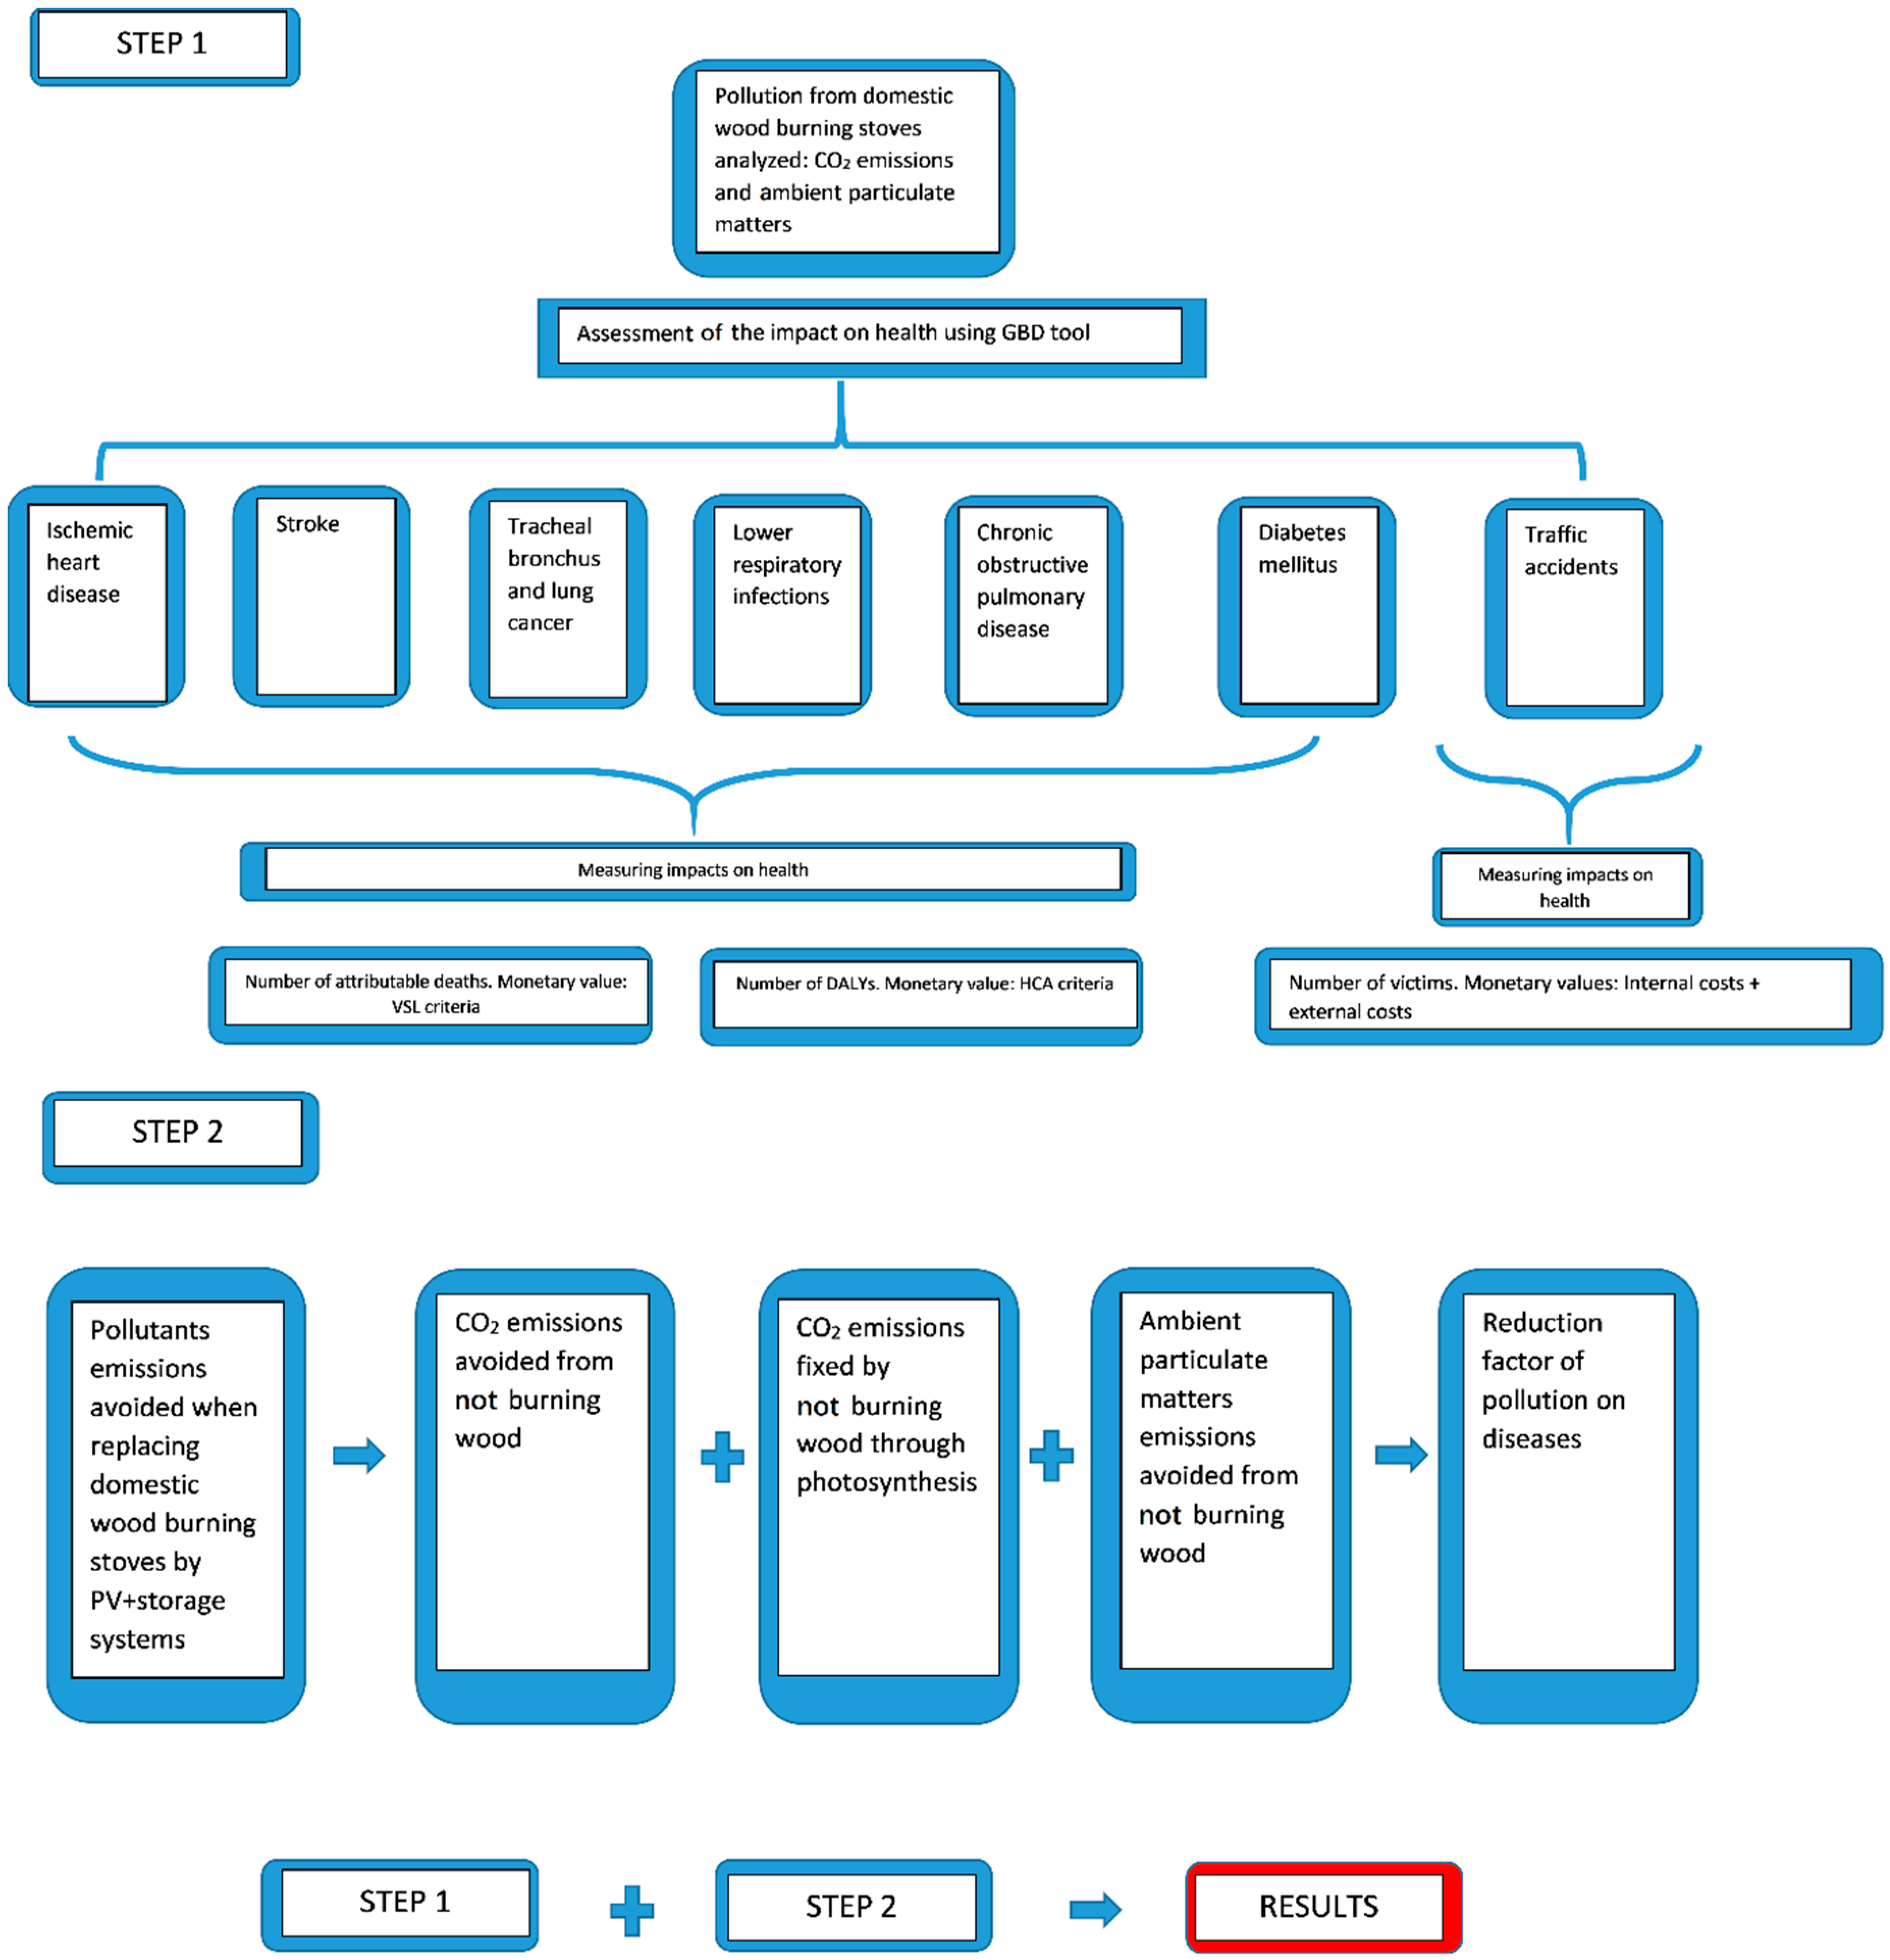
3. Results
3.1. Impacts on Health
3.2. Monetary Savings from Emissions Avoided
4. Conclusions
Author Contributions
Funding
Acknowledgments
Conflicts of Interest
Appendix A

| 00:00 to 23:00 | 0:00 | 1:00 | 2:00 | 3:00 | 4:00 | 5:00 | 6:00 | 7:00 | 8:00 | 9:00 | 10:00 | 11:00 | 12:00 | 13:00 | 14:00 | 15:00 | 16:00 | 17:00 | 18:00 | 19:00 | 20:00 | 21:00 | 22:00 | 23:00 | |
| January | 282.4 | 0.0 | 0.0 | 0.0 | 0.0 | 0.0 | 0.0 | 10.4 | 52.2 | 205.3 | 400.1 | 601.1 | 755.8 | 845.2 | 895.5 | 863.5 | 768.1 | 637.7 | 446.4 | 237.2 | 49.5 | 9.3 | 0.0 | 0.0 | 0.0 |
| February | 269.2 | 0.0 | 0.0 | 0.0 | 0.0 | 0.0 | 0.0 | 0.0 | 31.1 | 167.5 | 341.7 | 550.3 | 686.0 | 825.0 | 879.5 | 860.4 | 771.5 | 630.6 | 446.7 | 228.0 | 43.2 | 0.0 | 0.0 | 0.0 | 0.0 |
| March | 235.5 | 0.0 | 0.0 | 0.0 | 0.0 | 0.0 | 0.0 | 0.0 | 7.8 | 201.8 | 301.8 | 477.5 | 612.1 | 728.4 | 785.0 | 759.3 | 664.1 | 557.6 | 367.3 | 180.9 | 8.0 | 0.0 | 0.0 | 0.0 | 0.0 |
| April | 172.5 | 0.0 | 0.0 | 0.0 | 0.0 | 0.0 | 0.0 | 0.0 | 0.0 | 145.2 | 200.4 | 343.4 | 465.8 | 573.4 | 603.0 | 595.0 | 516.3 | 409.6 | 252.8 | 35.4 | 0.0 | 0.0 | 0.0 | 0.0 | 0.0 |
| May | 131.6 | 0.0 | 0.0 | 0.0 | 0.0 | 0.0 | 0.0 | 0.0 | 0.0 | 36.1 | 278.8 | 255.8 | 342.2 | 439.8 | 473.0 | 440.2 | 368.1 | 383.0 | 141.9 | 0.0 | 0.0 | 0.0 | 0.0 | 0.0 | 0.0 |
| June | 106.0 | 0.0 | 0.0 | 0.0 | 0.0 | 0.0 | 0.0 | 0.0 | 0.0 | 0.0 | 241.9 | 202.9 | 275.6 | 339.5 | 383.6 | 356.5 | 296.8 | 423.2 | 23.1 | 0.0 | 0.0 | 0.0 | 0.0 | 0.0 | 0.0 |
| July | 114.5 | 0.0 | 0.0 | 0.0 | 0.0 | 0.0 | 0.0 | 0.0 | 0.0 | 0.1 | 252.6 | 209.6 | 298.4 | 368.5 | 393.8 | 387.7 | 324.9 | 367.5 | 146.1 | 0.0 | 0.0 | 0.0 | 0.0 | 0.0 | 0.0 |
| August | 141.1 | 0.0 | 0.0 | 0.0 | 0.0 | 0.0 | 0.0 | 0.0 | 0.0 | 78.7 | 253.9 | 286.5 | 372.6 | 461.1 | 489.0 | 454.7 | 387.0 | 364.7 | 229.2 | 7.9 | 0.0 | 0.0 | 0.0 | 0.0 | 0.0 |
| September | 197.0 | 0.0 | 0.0 | 0.0 | 0.0 | 0.0 | 0.0 | 0.0 | 17.0 | 222.8 | 339.2 | 426.9 | 560.9 | 616.5 | 640.0 | 613.3 | 530.6 | 420.3 | 247.1 | 94.3 | 0.0 | 0.0 | 0.0 | 0.0 | 0.0 |
| October | 212.4 | 0.0 | 0.0 | 0.0 | 0.0 | 0.0 | 0.0 | 2.4 | 79.6 | 200.9 | 367.1 | 509.5 | 604.8 | 674.4 | 695.4 | 617.4 | 516.9 | 421.4 | 269.9 | 129.6 | 7.3 | 0.0 | 0.0 | 0.0 | 0.0 |
| November | 237.2 | 0.0 | 0.0 | 0.0 | 0.0 | 0.0 | 0.0 | 23.3 | 96.1 | 247.4 | 419.7 | 541.9 | 627.3 | 728.7 | 745.8 | 696.9 | 605.4 | 475.6 | 316.9 | 135.0 | 31.5 | 0.0 | 0.0 | 0.0 | 0.0 |
| December | 258.1 | 0.0 | 0.0 | 0.0 | 0.0 | 0.0 | 0.0 | 27.6 | 89.3 | 236.1 | 404.4 | 563.1 | 686.8 | 784.3 | 792.2 | 767.2 | 675.4 | 553.5 | 375.6 | 188.0 | 45.2 | 6.1 | 0.0 | 0.0 | 0.0 |
| 00:00 to 23:00 | 0:00 | 1:00 | 2:00 | 3:00 | 4:00 | 5:00 | 6:00 | 7:00 | 8:00 | 9:00 | 10:00 | 11:00 | 12:00 | 13:00 | 14:00 | 15:00 | 16:00 | 17:00 | 18:00 | 19:00 | 20:00 | 21:00 | 22:00 | 23:00 | |
| January to December | 0.5209 | 1 | 1 | 1 | 1 | 1 | 1 | 0.7595 | 0.4952 | 0.2067 | 0 | 0 | 0 | 0 | 0 | 0 | 0 | 0 | 0.1538 | 0.4006 | 0.5994 | 0.8861 | 1 | 1 | 1 |
| January | 0.3965 | 1 | 1 | 1 | 1 | 1 | 1 | 0.3300 | 0 | 0 | 0 | 0 | 0 | 0 | 0 | 0 | 0 | 0 | 0 | 0 | 0 | 0.1861 | 1 | 1 | 1 |
| February | 0.4583 | 1 | 1 | 1 | 1 | 1 | 1 | 1 | 0 | 0 | 0 | 0 | 0 | 0 | 0 | 0 | 0 | 0 | 0 | 0 | 0 | 1 | 1 | 1 | 1 |
| March | 0.5068 | 1 | 1 | 1 | 1 | 1 | 1 | 1 | 0.4615 | 0 | 0 | 0 | 0 | 0 | 0 | 0 | 0 | 0 | 0 | 0 | 0.7022 | 1 | 1 | 1 | 1 |
| April | 0.5715 | 1 | 1 | 1 | 1 | 1 | 1 | 1 | 1 | 0 | 0 | 0 | 0 | 0 | 0 | 0 | 0 | 0 | 0 | 0.7179 | 1 | 1 | 1 | 1 | 1 |
| May | 0.6169 | 1 | 1 | 1 | 1 | 1 | 1 | 1 | 1 | 0.3945 | 0 | 0 | 0 | 0 | 0 | 0 | 0 | 0 | 0.4119 | 1 | 1 | 1 | 1 | 1 | 1 |
| June | 0.6666 | 1 | 1 | 1 | 1 | 1 | 1 | 1 | 1 | 1 | 0 | 0 | 0 | 0 | 0 | 0 | 0 | 0 | 1 | 1 | 1 | 1 | 1 | 1 | 1 |
| July | 0.6430 | 1 | 1 | 1 | 1 | 1 | 1 | 1 | 1 | 1 | 0 | 0 | 0 | 0 | 0 | 0 | 0 | 0 | 0.4342 | 1 | 1 | 1 | 1 | 1 | 1 |
| August | 0.5869 | 1 | 1 | 1 | 1 | 1 | 1 | 1 | 1 | 0.0868 | 0 | 0 | 0 | 0 | 0 | 0 | 0 | 0 | 0 | 1 | 1 | 1 | 1 | 1 | 1 |
| September | 0.5238 | 1 | 1 | 1 | 1 | 1 | 1 | 1 | 0.4820 | 0 | 0 | 0 | 0 | 0 | 0 | 0 | 0 | 0 | 0 | 0.0897 | 1 | 1 | 1 | 1 | 1 |
| October | 0.4698 | 1 | 1 | 1 | 1 | 1 | 1 | 0.7841 | 0 | 0 | 0 | 0 | 0 | 0 | 0 | 0 | 0 | 0 | 0 | 0 | 0.4913 | 1 | 1 | 1 | 1 |
| November | 0.4166 | 1 | 1 | 1 | 1 | 1 | 1 | 0 | 0 | 0 | 0 | 0 | 0 | 0 | 0 | 0 | 0 | 0 | 0 | 0 | 0 | 1 | 1 | 1 | 1 |
| December | 0.3936 | 1 | 1 | 1 | 1 | 1 | 1 | 0 | 0 | 0 | 0 | 0 | 0 | 0 | 0 | 0 | 0 | 0 | 0 | 0 | 0 | 0.4472 | 1 | 1 | 1 |
| 00:00 to 23:00 | 0:00 | 1:00 | 2:00 | 3:00 | 4:00 | 5:00 | 6:00 | 7:00 | 8:00 | 9:00 | 10:00 | 11:00 | 12:00 | 13:00 | 14:00 | 15:00 | 16:00 | 17:00 | 18:00 | 19:00 | 20:00 | 21:00 | 22:00 | 23:00 | |
| January to December | 0.1844 | 0 | 0 | 0 | 0 | 0 | 0 | 0.0044 | 0.1395 | 0.2176 | 0.3631 | 0.5399 | 0.5390 | 0.5158 | 0.4924 | 0.4824 | 0.4657 | 0.3059 | 0.2331 | 0.1271 | 0.0008 | 0.0002 | 0 | 0 | 0 |
| January | 0.1372 | 0 | 0 | 0 | 0 | 0 | 0 | 0.0099 | 0.3027 | 0.4640 | 0.3399 | 0.2804 | 0.2679 | 0.2977 | 0.2704 | 0.2605 | 0.2332 | 0.2009 | 0.1786 | 0.1861 | 0 | 0 | 0 | 0 | 0 |
| February | 0.1397 | 0 | 0 | 0 | 0 | 0 | 0 | 0 | 0.0163 | 0.4347 | 0.4510 | 0.3451 | 0.3478 | 0.3070 | 0.2934 | 0.2744 | 0.2445 | 0.2255 | 0.1929 | 0.2201 | 0 | 0 | 0 | 0 | 0 |
| March | 0.1460 | 0 | 0 | 0 | 0 | 0 | 0 | 0 | 0 | 0.0074 | 0.5037 | 0.4491 | 0.4416 | 0.4094 | 0.7469 | 0.3523 | 0.3523 | 0.2804 | 0.2655 | 0.0694 | 0 | 0 | 0 | 0 | 0 |
| April | 0.1923 | 0 | 0 | 0 | 0 | 0 | 0 | 0 | 0 | 0.0076 | 0.6692 | 0.6205 | 0.5923 | 0.5256 | 0.5102 | 0.4666 | 0.4512 | 0.3974 | 0.2923 | 0.0820 | 0 | 0 | 0 | 0 | 0 |
| May | 0.1706 | 0 | 0 | 0 | 0 | 0 | 0 | 0 | 0 | 0 | 0.1612 | 0.6823 | 0.6873 | 0.6129 | 0.5756 | 0.5806 | 0.5682 | 0.2183 | 0.0099 | 0 | 0 | 0 | 0 | 0 | 0 |
| June | 0.1708 | 0 | 0 | 0 | 0 | 0 | 0 | 0 | 0 | 0 | 0.0025 | 0.6948 | 0.7256 | 0.7076 | 0.6615 | 0.6641 | 0.643 | 0 | 0 | 0 | 0 | 0 | 0 | 0 | 0 |
| July | 0.1817 | 0 | 0 | 0 | 0 | 0 | 0 | 0 | 0 | 0 | 0.0074 | 0.7096 | 0.7146 | 0.6923 | 0.6749 | 0.6451 | 0.6426 | 0.2655 | 0.0099 | 0 | 0 | 0 | 0 | 0 | 0 |
| August | 0.2086 | 0 | 0 | 0 | 0 | 0 | 0 | 0 | 0 | 0 | 0.3325 | 0.6625 | 0.6774 | 0.6277 | 0.6129 | 0.6228 | 0.6178 | 0.4392 | 0.2928 | 0.1215 | 0 | 0 | 0 | 0 | 0 |
| September | 0.1902 | 0 | 0 | 0 | 0 | 0 | 0 | 0 | 0.0025 | 0.0256 | 0.4179 | 0.5564 | 0.5153 | 0.5461 | 0.5230 | 0.5 | 0.4794 | 0.4487 | 0.4461 | 0.1051 | 0 | 0 | 0 | 0 | 0 |
| October | 0.2356 | 0 | 0 | 0 | 0 | 0 | 0 | 0.0173 | 0.2134 | 0.6005 | 0.5533 | 0.5310 | 0.5434 | 0.5558 | 0.5310 | 0.5533 | 0.5558 | 0.4888 | 0.4466 | 0.0645 | 0 | 0 | 0 | 0 | 0 |
| November | 0.2394 | 0 | 0 | 0 | 0 | 0 | 0 | 0.0205 | 0.5794 | 0.5461 | 0.4666 | 0.5153 | 0.5282 | 0.5 | 0.4769 | 0.4820 | 0.4461 | 0.4076 | 0.3820 | 0.3948 | 0 | 0 | 0 | 0 | 0 |
| December | 0.2012 | 0 | 0 | 0 | 0 | 0 | 0 | 0.0050 | 0.560 | 0.5251 | 0.4522 | 0.4321 | 0.4271 | 0.4070 | 0.4045 | 0.3869 | 0.3542 | 0.2989 | 0.2814 | 0.2814 | 0.0100 | 0.0025 | 0 | 0 | 0 |
| Total Deaths (%) | Range (%) | Risk Factor Attribution | Range (%) | Weighted Monetary Value of Deaths (USD 2013) | ||
|---|---|---|---|---|---|---|
| Ischemic heart disease | 11.88 | 11.49–12.33 | Ambient particulate matter pollution | 12.48 | 8.35–15.38 | 2,584,879 |
| Household air pollution from fossil fuels | 1.46 | 0.7–2.77 | 175,253 | |||
| Stroke | 8.43 | 8.09–8.82 | Ambient particulate matter pollution | 7.88 | 4.86–10.41 | 1,158,145 |
| Household air pollution from fossil fuels | 0.86 | 0.39–1.66 | 147,896 | |||
| Tracheobronchial and lung cancers | 3.57 | 3.44–3.72 | Ambient particulate matter pollution | 13.56 | 6.3–20.99 | 1,704,004 |
| Household air pollution from fossil fuels | 1.54 | 0.69–2.94 | 112,155 | |||
| Lower respiratory infections | 3.66 | 3.49–3.84 | Ambient particulate matter pollution | 19.5 | 8.4–28.64 | 2,512,224 |
| Household air pollution from fossil fuels | 2.24 | 1.04–4.09 | 167,247 | |||
| Chronic obstructive pulmonary disease | 3.9 | 3.58–4.33 | Ambient particulate matter pollution | 20.37 | 9.55–30.46 | 2,796,394 |
| Household air pollution from fossil fuels | 2.35 | 0.93–4.68 | 186,966 | |||
| Diabetes mellitus | 2.63 | 2.52–2.75 | Ambient particulate matter pollution | 22.2 | 11.3–27.89 | 2,055,187 |
| Household air pollution from fossil fuels | 2.61 | 1.16–5.22 | 140,032 | |||
| Total | 13,740,383 |
| Total Deaths (%) | Range (%) | Risk Factor Attribution | Range (%) | Weighted Monetary Value of Deaths (USD 2013) | ||
|---|---|---|---|---|---|---|
| Ischemic heart disease | 10 | 9.62–10.53 | Ambient particulate matter pollution | 9.44 | 5.79–11.98 | 3,322,880 |
| Household air pollution from fossil fuels | 1.91 | 1–3.3 | 389,640 | |||
| Stroke | 10.11 | 9.68–10.64 | Ambient particulate matter pollution | 6.54 | 3.79–8.77 | 2,327,403 |
| Household air pollution from fossil fuels | 1.32 | 0.67–2.31 | 272,242 | |||
| Tracheobronchial and lung cancers | 2.83 | 2.71–2.95 | Ambient particulate matter pollution | 13.05 | 5.9–20.32 | 1,299,989 |
| Household air pollution from fossil fuels | 2.58 | 1.23–4.63 | 148,949 | |||
| Lower respiratory infections | 4.32 | 4.12–4.53 | Ambient particulate matter pollution | 18.77 | 8.28–27.83 | 2,854,241 |
| Household air pollution from fossil fuels | 3.68 | 1.84–6.37 | 324,311 | |||
| Chronic obstructive pulmonary disease | 3.74 | 3.41–4.52 | Ambient particulate matter pollution | 19.27 | 8.63–28.8 | 2,536,857 |
| Household air pollution from fossil fuels | 3.85 | 1.73–6.94 | 293,740 | |||
| Diabetes mellitus | 3.08 | 2.94–3.22 | Ambient particulate matter pollution | 21.39 | 10.96–27.56 | 2,319,018 |
| Household air pollution from fossil fuels | 4.35 | 2.04–7.91 | 273,319 | |||
| Total | 16,362,589 |
| Total DALYs (%) | Range (%) | Risk Factor Attribution | Range (%) | Weighted Monetary Value of Total DALYs (USD 2013) | ||
|---|---|---|---|---|---|---|
| Ischemic heart disease | 5.99 | 5.35–6.68 | Ambient particulate matter pollution | 14.16 | 9.32–17.63 | 3,346,837 |
| Household air pollution from fossil fuels | 1.65 | 0.79–3.12 | 226,018 | |||
| Stroke | 4.23 | 3.82–4.61 | Ambient particulate matter pollution | 8.8 | 5.52–11.61 | 1,468,817 |
| Household air pollution from fossil fuels | 1.03 | 0.5–1.97 | 99,634 | |||
| Tracheobronchial and lung cancers | 1.81 | 1.61–2.02 | Ambient particulate matter pollution | 13.54 | 6.28–20.96 | 967,034 |
| Household air pollution from fossil fuels | 1.54 | 0.68–2.93 | 63,743 | |||
| Lower respiratory infections | 1.55 | 1.36–1.75 | Ambient particulate matter pollution | 19.45 | 8.39–28.58 | 1,189,586 |
| Household air pollution from fossil fuels | 2.34 | 1.1–4.24 | 82,943 | |||
| Chronic obstructive pulmonary disease | 1.92 | 1.68–2.19 | Ambient particulate matter pollution | 20.07 | 9.41–29.96 | 1,520,523 |
| Household air pollution from fossil fuels | 2.31 | 0.92–4.62 | 101,425 | |||
| Diabetes mellitus | 3.4 | 2.99–3.86 | Ambient particulate matter pollution | 22.57 | 11.5–28.33 | 3,027,994 |
| Household air pollution from fossil fuels | 2.65 | 1.17–5.31 | 206,043 | |||
| Total | 12,300,597 |
| Total DALYs (%) | Range (%) | Risk Factor Attribution | Range (%) | Weighted Monetary Value of Total DALYs (USD 2013) | ||
|---|---|---|---|---|---|---|
| Ischemic heart disease | 3.38 | 2.94–3.86 | Ambient particulate matter pollution | 11.25 | 7.02–14.22 | 1,030,613 |
| Household air pollution from fossil fuels | 2.28 | 1.17–3.99 | 121,050 | |||
| Stroke | 4.4 | 3.89–4.92 | Ambient particulate matter pollution | 7.58 | 4.49–10.15 | 903,958 |
| Household air pollution from fossil fuels | 1.53 | 0.78–2.66 | 105,745 | |||
| Tracheobronchial and lung cancers | 1.36 | 1.16–1.58 | Ambient particulate matter pollution | 13.03 | 5.88–20.28 | 480,297 |
| Household air pollution from fossil fuels | 2.57 | 1.23–4.61 | 54,902 | |||
| Lower respiratory infections | 1.28 | 1.1–1.5 | Ambient particulate matter pollution | 18.81 | 8.29–27.87 | 652,567 |
| Household air pollution from fossil fuels | 3.6 | 1.8–6.19 | 72,381 | |||
| Chronic obstructive pulmonary disease | 2.2 | 1.85–2.61 | Ambient particulate matter pollution | 18.91 | 8.46–28.31 | 1,127,563 |
| Household air pollution from fossil fuels | 3.78 | 1.7–6.82 | 130,626 | |||
| Diabetes mellitus | 3.65 | 3.25–4.08 | Ambient particulate matter pollution | 21.29 | 10.92–27.38 | 2,106,178 |
| Household air pollution from fossil fuels | 4.33 | 2.03–7.87 | 248,253 | |||
| Total | 7,034,132 |
| Number | Weighted Costs USD 2013 | ||
|---|---|---|---|
| Internal costs | External costs | ||
| Fatalities | 33 | 8,112,823 | 48,845 |
| Serious injuries | 515 | 49,669,305 | 1,299,140 |
| Minor injuries | 2180 | 14,609,047 | 3,007,639 |
| Total | 2728 | 72,391,175 | 4,355,623 |
| Surface m2 | Number | Firewood Requirements per day (Kgs) | Total CO2 Emissions from Combustion HDD ≤ 15 °C | Total CO2 Emissions from Combustion HDD ≤ 18 °C | Total Unfixed CO2 Emissions HDD ≤ 15 °C | Total Unfixed CO2 Emissions HDD ≤ 18 °C | Total Particulate Matters Emissions from Combustion HDD ≤ 15 °C | Total Particulate Matters Emissions from Combustion HDD ≤ 18 °C | |
|---|---|---|---|---|---|---|---|---|---|
| HDD ≤ 15 °C | HDD ≤ 18 °C | ||||||||
| 1–35 | 5719 | 6.28 | 4.72 | 592,695,370 | 927,393,932 | 16,848,892 | 26,363,561 | 50,041,670 | 78,300,495 |
| 36–50 | 6656 | 6.61 | 4.72 | 689,811,912 | 1,136,160,796 | 19,609,680 | 32,298,297 | 58,241,285 | 95,926,822 |
| 51–70 | 12,388 | 8.97 | 5.98 | 1,626,125,618 | 2,869,633,443 | 46,226,809 | 81,576,721 | 137,294,882 | 242,285,085 |
| 71–100 | 2576 | 14.10 | 8.81 | 498,395,110 | 938,155,502 | 14,168,165 | 26,669,486 | 42,079,835 | 79,209,101 |
| 101–140 | 1461 | 19.27 | 11.33 | 363,433,336 | 726,866,671 | 10,331,529 | 20,663,057 | 30,684,921 | 61,369,843 |
| >140 | 866 | 23.23 | 12.91 | 245,395,840 | 519,661,779 | 6,976,009 | 14,772,724 | 20,718,936 | 43,875,394 |
References
- Kausel, T.; Vegara, C. El Uso de la Leña Como Combustible en la IX Región. Aspectos Económicos. In Leña: Una Fuente Energética Renovable para Chile; Hernández, A., Lobos, M., Eds.; MIRA Ediciones: Valdivia, Chile, 2003; pp. 30–39. [Google Scholar]
- Ministerio del Medio Ambiente. Plan de Descontaminación Atmosférica por mp2,5, para las Comunas de Temuco y Padre Las Casas Actualización del Plan de Descontaminación por mp10, para las Mismas Comunas; Ministerio del Medio Ambiente: Santiago, Chile, 2015; ISBN 0807695106.
- Comisión Nacional de Energía. Balance Nacional de Energía 2013; Comisión Nacional de Energía: Santiago, Chile, 2014. [Google Scholar]
- Cansino, J.M.; Moreno, R. Does forest matter regarding Chilean CO2 international abatement commitments? A multilevel decomposition approach. Carbon Manag. 2017, 9, 9–24. [Google Scholar] [CrossRef]
- Smith, K.R. Health impacts of household fuelwood use in developing countries. Unasylva 2006, 57, 41–44. [Google Scholar]
- Wielgosiński, G.; Łechtańska, P.; Namiecińska, O. Emission of some pollutants from biomass combustion in comparison to hard coal combustion. J. Energy Inst. 2017, 90, 787–796. [Google Scholar] [CrossRef]
- Williams, A.; Jones, J.M.; Ma, L.; Pourkashanian, M. Pollutants from the combustion of solid biomass fuels. Prog. Energy Combust. Sci. 2012, 38, 113–137. [Google Scholar] [CrossRef]
- Kim, K.H.; Kabir, E.; Kabir, S. A review on the human health impact of airborne particulate matter. Environ. Int. 2015, 74, 136–143. [Google Scholar] [CrossRef]
- Pablo-Romero, M.d.P.; Román, R.; Limón, J.M.G.; Praena-Crespo, M. Effects of fine particles on children’s hospital admissions for respiratory health in Seville, Spain. J. Air Waste Manag. Assoc. 2015, 65, 436–444. [Google Scholar] [CrossRef]
- Román-Collado, R.; Jiménez de Reyna, J. The economic benefits of fulfilling the World Health Organization’s limits for particulates: A case study in Algeciras Bay (Spain). J. Air Waste Manag. Assoc. 2019, 69, 438–449. [Google Scholar] [CrossRef]
- Ministerio del Medio Ambiente. Planes de Descontaminacion Atmosférica. Estrategia 2014–2018. Available online: https://mma.gob.cl/wp-content/uploads/2014/08/articles-56174_Plan_LosLagos.pdf (accessed on 18 September 2019).
- Ministerio de vivienda y Urbanismo. Resolución 793 Exenta. 2015. Available online: https://www.leychile.cl/Navegar?idNorma=1076626 (accessed on 18 September 2019).
- Ministerio de Medio Ambiente. Programa de Recambio de Calefactores. Available online: https://calefactores.mma.gob.cl/region/11 (accessed on 18 September 2019).
- Armijo, G.; Whitman, C.; Roubelat, L. Reacondicionamiento térmico en Temuco-Padre las Casas, Chile: Una ciudad declarada saturada por contaminacion aérea. In Proceedings of the XII ENCAC-VIII ELACAC, Brasilia, Brazil, 25–27 September 2013. [Google Scholar]
- Arcos-Vargas, A.; Cansino, J.M.; Román-Collado, R. Economic and environmental analysis of a residential PV system: A profitable contribution to the Paris agreement. Renew. Sustain. Energy Rev. 2018, 94, 1024–1035. [Google Scholar] [CrossRef]
- Institute for Health Metrics and Evaluation GBD Compare Data Visualization. Available online: http://www.healthdata.org/ (accessed on 18 September 2019).
- COSMOPLAS Standard PV + storage system costs. Available online: https://www.cosmoplas.cl/energias-renovables/ (accessed on 15 February 2019).
- Kosmadakis, I.E.; Elmasides, C.; Eleftheriou, D.; Tsagarakis, K.P. A techno-economic analysis of a pv-battery system in Greece. Energies 2019, 12, 1357. [Google Scholar] [CrossRef]
- Murray, C.J.L.; Lopez, A.D.; Jamison, D.T. The global burden of disease in 1990: Summary results, sensitivity analysis and future directions. Bull. World Health Organ. 1994. [Google Scholar]
- Murray, C.; Lopez, A. Global Health Statistics: A Compendium of Incidence, Prevalence, and Mortality Estimates for Over 200 Conditions; Harvard School of Public Health: Boston, MA, USA, 1996. [Google Scholar]
- Murray, C.J.; Lopez, A.D. A comprehensive assessment of mortality and disability from disease, injures and risk factors in 1990 and projected to 2020. In The Global Burden of Disease; Harvard School of Public Health: Boston, MA, USA, 1996. [Google Scholar]
- Murray, C.J.L.; Lopez, A.D. Regional-patterns of disability-free life expectancy and disability-adjusted life expectancy: Global Burden of Disease Study. Lancet 1997, 72, 495–509. [Google Scholar] [CrossRef]
- Murray, C.J.L.; Acharya, A.K. Understanding DALYs. J. Health. Econ. 1997, 16, 703–730. [Google Scholar] [CrossRef]
- Oostvogels, A.J.J.M.; De Wit, G.A.; Jahn, B.; Cassini, A.; Colzani, E.; De Waure, C.; Kretzschmar, M.E.E.; Siebert, U.; Mühlberger, N.; Mangen, M.J.J. Use of DALYs in economic analyses on interventions for infectious diseases: A systematic review. Epidemiol. Infect. 2015, 143, 1791–1802. [Google Scholar] [CrossRef] [PubMed]
- Murray, C.J.L. Quantifying the burden of disease: The technical basis for disability-adjusted life years. Bull. World Health Organ. 1994, 72, 429–445. [Google Scholar] [PubMed]
- Kirigia, J.M.; Mwabu, G.M. The Monetary Value of Disability-Adjusted-Life-Years Lost in the East African Community in 2015. Mod. Econ. 2018, 09, 1360–1377. [Google Scholar] [CrossRef][Green Version]
- WHO. World Health Statistics 2017: Monitoring Health for The Sustainable Development Goals; WHO: Geneva, Switzerland, 2017; ISBN 978-92-4-156548-6. [Google Scholar]
- Hall, J.V.; Brajer, V.; Lurmann, F.W. The Health and Related Economic Benefits of Attaining Healthful Air in the San Joaquin Valley. Available online: http://www.scientificintegrityinstitute.org/Hall032906.pdf (accessed on 18 September 2019).
- Dalal, K.; Svanström, L. Economic Burden of Disability Adjusted Life Years (DALYs) of Injuries. Health 2015, 07, 487–494. [Google Scholar] [CrossRef]
- Romero, N. Consumo de Energía a Nivel Residencial en Chile y Análisis de Eficiencia Energética en Calefacción. Bachelor’s Thesis, Universidad de Chile, Santiago, Chile, 2011. [Google Scholar]
- Burschel, H.; Hernández, A.; Lobos, M. Leña: Una fuente energética renovable para Chile; Editorial: Santiago, Chile, 2003. [Google Scholar]
- Rizzi, L.I. Diseño de Instrumentos Económicos para la Internalización de Externalidades de Accidentes de Tránsito. Cuad. Econ. 2005, 42, 126. [Google Scholar] [CrossRef]
- Reyes, A. Medición de la externalidad negativa de accidentes de tránsito asociados al consumo de alcohol. Bachelor’s Thesis, Universidad de Chile, Santiago, Chile, 2016. [Google Scholar]
- SICAM. Actualización del Inventario de Emisiones Atmosféricas de las Comunas de Temuco y Padre Las Casas, Año Base 2013; SICAM: Temuco, Chile, 2014. [Google Scholar]
- Ministerio de Energía. Medición del Consumo Nacional de Leña y Otros Combustibles Sólidos Derivados de la Madera; Ministerio de Energía: Santiago, Chile, 2015.
- Espina, A. Densidad básica de la madera de Eucalyptus globulus en dos sitios en Chile. Bachelor’s Thesis, Universidad Austral de Chile, Valdivia, Chile, 2006. [Google Scholar]
- Ministerio de Energía. Infografía de la Leña; Ministerio de Energía: Santiago, Chile, 2018.
- Masera Cerutti, O.; Coralli, F.; García Bustamante, C. La Bioenergía en México: Situación Actual y Perspectivas. Red Mex. Energ. 2011, 22, 118–125. [Google Scholar]
- Ministerio del Medio Ambiente. Inventario Nacional de Gases de Efecto Invernadero de Chile; Ministerio del Medio Ambiente: Santiago, Chile, 2017.
- Corporación Nacional Forestal. Caracterización de Centros de Acopio Rurales y Periurbanos de Leña en las Regiones de O’Higgins, Maule, Bío-Bío, La Araucanía, Los Ríos, Los Lagos y Aysen; Corporación Nacional Forestal: Santiago, Chile, 2015. [Google Scholar]
- Raugei, M.; Frankl, P. Life cycle impacts and costs of photovoltaic systems: Current state of the art and future outlooks. Energy 2009, 34, 392–399. [Google Scholar] [CrossRef]
- De Wild-Scholten, M.J. Energy payback time and carbon footprint of commercial photovoltaic systems. Sol. Energy Mater. Sol. Cells 2013, 119, 296–305. [Google Scholar] [CrossRef]
- Frischknecht, R.; Itten, R.; Sinha, P.; de Wild-Scholten, M.; Zhang, J.; Fthenakis, V.; Kim, H.C.; Raugei, M.; Stucki, M. Life Cycle Inventories and Life Cycle Assessments of Photovoltaic Systems; PVPS Task 12, Report T12-04:2015; IEA: Paris, France, 2015. [Google Scholar]
- Institute for Health Metrics and Evaluation. Global Burden of Disease Study 2017 (GBD 2017) Population Estimates 1950–2017. Available online: http://ghdx.healthdata.org/record/ihme-data/gbd-2017-population-estimates-1950-2017 (accessed on 20 September 2019).
- Institute for Health Metrics and Evaluation. Global Burden of Disease Study 2017 (GBD 2017) Fertility Estimates 1950–2017. Available online: http://ghdx.healthdata.org/record/ihme-data/gbd-2017-fertility-estimates-1950-2017 (accessed on 20 September 2019).
- GBD. Population and Fertility Collaborators. Population and fertility by age and sex for 195 countries and territories, 1950–2017: A systematic analysis for the Global Burden of Disease Study 2017. Lancet 2019, 392, 1995–2051. [Google Scholar]
- Instituto Nacional de Estadísticas. Informe Anual Carabineros 2013; Instituto Nacional de Estadísticas: Santiago, Chile, 2013; ISBN 9789563231489. [Google Scholar]
- WHO Regional Office for Europe; OECD. Economic Cost of the Health Impact of Air Pollution in Europe: Clean Air, Health and Wealth; WHO: Geneva, Switzerland, 2015. [Google Scholar]
- International Monetary Fund. World Economic Outlook Database. April 2018. Report for Selected Countries and Subjects. Available online: http://www.imf.org/external/pubs/ft/weo/2018/01/weodata/weorept.aspx?sy=1995&ey=2023&ssm=1&scsm=1&ssd=1&sort=country&ds=.&br=1&pr1.x=85&pr1.y=12&c=199%2C534%2C111&s=NGDP_R%2CNGDP_RPCH%2CNGDP%2CNGDPD%2CPPPGDP%2CNGDP_D%2CNGDPRPC%2CNGDPRPPPPC%2CNGDPPC%2CNGDP (accessed on 18 September 2019).
- World Bank. World Development Indicators Database. Available online: https://databank.worldbank.org/source/world-development-indicators (accessed on 18 September 2019).
- Observatorio Urbano. PE Viviendas Unidades y Superficie Según Año y Comuna 2002 a November 2018; Ministerio de Vivienda y Urbanismo: Santiago, Chile, 2018.
- Reportes de Datos Climaticos de Chile. Meteored. Available online: https://www.meteored.cl/tiempo-en_Temuco-America+Sur-Chile-Araucania-SCTC-sactual-18267.html (accessed on 18 September 2019).
- Gazmuri, P.; Muñoz, J.C.; Rizzi, L.I.; Fresard, F.; Cumsille, S. Reducción de la mortalidad por accidentes del tránsito en Chile: 10 medidas prioritarias. In Camino al Bicentenario Doce Propuestas para Chile; Pontificia Universidad Catolica de Chile: Santiago, Chile, 2006; pp. 357–386. ISBN 9781604138795. [Google Scholar]
- Nugent, D.; Sovacool, B.K. Assessing the lifecycle greenhouse gas emissions from solar PV and wind energy: A critical meta-survey. Energy Policy 2014, 65, 229–244. [Google Scholar] [CrossRef]
- Ministerio de Energía. Explorador Solar DGF-Min. Energía: Base de Datos Sobre Radiación Solar en Chile; Ministerio de Energía: Santiago, Chile, 2019.
- Gomez-Lobo, A.; Lima, J.L.; Hill, C.; Meneses, M. Diagnóstico del Mercado de la Leña en Chile; Informe Final; Comisión Nacional de Energía: Santiago, Chile, 2006. [Google Scholar]
- BizEE Software Limited. Custom Degree Day Data. Available online: https://www.degreedays.net/ (accessed on 18 September 2019).


| Characteristics | Unit Cost (USD 2013) | Number of Units Required | Total Item Cost (USD 2013) | |
|---|---|---|---|---|
| Solar panel | polycrystalline 330 W 24 V, 1956 mm × 992 mm, cell efficiency 17.01%, 20 kg in weight | 343.4 | 10 | 3434.3 |
| Inverter charger + regulator | 58 kg | 2222.2 | ||
| Batteries | ROLLS 12 V lead acid 360 Ah: 60 kg in weight | 888.8 | 8 | 7111.1 |
| Structure | 303.0 | |||
| Cables for photovoltaic systems and accessories | 1 distributor and panel junction box | 707.0 | ||
| Annual Operation and Maintenance (O&M) cost | 3726 | |||
| Total Cost | 14,150.3 |
| HDD ≤ 15 °C | HDD ≤ 18 °C | |||
|---|---|---|---|---|
| CO2 | Ambient Particulate | CO2 | Ambient Particulate | |
| Emission reduction rate without PV + storage systems LCA | 40.49 | 40.31 | 47.63 | 47.42 |
| Emission reduction rate with PV + storage systems LCA | 38.46 | 40.31 | 45.25 | 47.42 |
| Males | Females | ||||
|---|---|---|---|---|---|
| HDD ≤ 15 °C | HDD ≤ 18 °C | HDD ≤ 15 °C | HDD ≤ 18 °C | ||
| Ischemic heart disease | Ambient particulate matter pollution | 1,041,965 | 1,773,615 | 1,339,453 | 2,279,994 |
| Household air pollution from fossil fuels | 70,960 | 120,635 | 157,765 | 268,207 | |
| Stroke | Ambient particulate matter pollution | 466,848 | 794,661 | 938,176 | 1,596,947 |
| Household air pollution from fossil fuels | 59,883 | 101,804 | 110,231 | 187,397 | |
| Tracheobronchial and lung cancer | Ambient particulate matter pollution | 686,884 | 1,169,202 | 524,025 | 891,987 |
| Household air pollution from fossil fuels | 45,412 | 77,202 | 60,309 | 102,528 | |
| Lower respiratory infections | Ambient particulate matter pollution | 1,012,678 | 1,723,762 | 1,150,545 | 1,958,438 |
| Household air pollution from fossil fuels | 67,718 | 115,124 | 131,314 | 223,238 | |
| Chronic obstructive pulmonary disease | Ambient particulate matter pollution | 1,127,226 | 1,918,745 | 1,022,607 | 1,740,664 |
| Household air pollution from fossil fuels | 75,703 | 128,697 | 118,935 | 202,195 | |
| Diabetes mellitus | Ambient particulate matter pollution | 828,446 | 1,410,167 | 934,796 | 1,591,194 |
| Household air pollution from fossil fuels | 56,699 | 96,390 | 110,667 | 188,138 | |
| TOTAL | 5,540,421 | 9,430,005 | 6,598,824 | 11,230,928 | |
| Males | Females | ||||
|---|---|---|---|---|---|
| HDD ≤ 15 °C | HDD ≤ 18 °C | HDD ≤ 15 °C | HDD ≤ 18 °C | ||
| Ischemic heart disease | Ambient particulate matter pollution | 1,349,110 | 2,296,432 | 415,440 | 707,155 |
| Household air pollution from fossil fuels | 91,515 | 155,579 | 49,013 | 83,324 | |
| Stroke | Ambient particulate matter pollution | 592,080 | 1,007,828 | 364,386 | 620,251 |
| Household air pollution from fossil fuels | 40,342 | 68,583 | 42,816 | 72,789 | |
| Tracheobronchial and lung cancer | Ambient particulate matter pollution | 389,811 | 663,530 | 193,608 | 329,556 |
| Household air pollution from fossil fuels | 25,809 | 43,877 | 22,230 | 37,791 | |
| Lower respiratory infections | Ambient particulate matter pollution | 479,522 | 816,234 | 263,050 | 447,759 |
| Household air pollution from fossil fuels | 33,584 | 57,093 | 29,307 | 49,823 | |
| Chronic obstructive pulmonary disease | Ambient particulate matter pollution | 612,923 | 1,043,307 | 454,521 | 773,677 |
| Household air pollution from fossil fuels | 41,067 | 69,816 | 52,890 | 89,916 | |
| Diabetes mellitus | Ambient particulate matter pollution | 1,220,584 | 2,077,658 | 849,000 | 1,445,154 |
| Household air pollution from fossil fuels | 83,427 | 141,829 | 100,518 | 170,884 | |
| TOTAL | 4,959,774 | 8,441,767 | 2,836,778 | 4,828,080 | |
| HDD ≤ 15 °C | HDD ≤ 18 °C | ||||||
|---|---|---|---|---|---|---|---|
| VSL | HCA | VSL | HCA | ||||
| Males | Females | Males | Females | Males | Females | Males | Females |
| 5,442,841 | 6,420,134 | 4,877,914 | 2,759,836 | 9,378,902 | 11,137,349 | 8,398,896 | 4,787,785 |
| HDD ≤ 15 °C | HDD ≤ 18 °C | |||
|---|---|---|---|---|
| Internal Costs | External Costs | Internal Costs | External Costs | |
| Fatalities | 3,270,279 | 19,689 | 3,847,101 | 23,162 |
| Serious injuries | 20,021,697 | 523,683 | 23,553,184 | 616,052 |
| Minor injuries | 5,888,907 | 1,212,379 | 6,927,610 | 1,426,222 |
| Total | 29,180,883 | 1,755,752 | 34,327,895 | 2,065,437 |
© 2019 by the authors. Licensee MDPI, Basel, Switzerland. This article is an open access article distributed under the terms and conditions of the Creative Commons Attribution (CC BY) license (http://creativecommons.org/licenses/by/4.0/).
Share and Cite
Cansino, J.M.; Moreno, R.; Quintana, D.; Roman-Collado, R. Health and Heating in the City of Temuco (Chile). Monetary Savings of Replacing Biomass with PV System in the Residential Sector. Sustainability 2019, 11, 5205. https://doi.org/10.3390/su11195205
Cansino JM, Moreno R, Quintana D, Roman-Collado R. Health and Heating in the City of Temuco (Chile). Monetary Savings of Replacing Biomass with PV System in the Residential Sector. Sustainability. 2019; 11(19):5205. https://doi.org/10.3390/su11195205
Chicago/Turabian StyleCansino, José M., Roberto Moreno, Daniela Quintana, and Rocio Roman-Collado. 2019. "Health and Heating in the City of Temuco (Chile). Monetary Savings of Replacing Biomass with PV System in the Residential Sector" Sustainability 11, no. 19: 5205. https://doi.org/10.3390/su11195205
APA StyleCansino, J. M., Moreno, R., Quintana, D., & Roman-Collado, R. (2019). Health and Heating in the City of Temuco (Chile). Monetary Savings of Replacing Biomass with PV System in the Residential Sector. Sustainability, 11(19), 5205. https://doi.org/10.3390/su11195205