Article

Environmental Management Accounting and Performance Efficiency in the Vietnamese Construction Material Industry—A Managerial Implication for Sustainable Development

1
Department of Accounting, Thuyloi University, 175, Tay Son, Dong Da, Hanoi 100000, Vietnam
2
Department of Auditing, Hanoi University of Resources and Environment, Hanoi 100000, Vietnam
3
Department of Accounting, University of Economics – Technology for Industries, Hanoi 100000, Vietnam
*
Author to whom correspondence should be addressed.
Sustainability 2019, 11(19), 5152; https://doi.org/10.3390/su11195152
Submission received: 19 August 2019 / Revised: 15 September 2019 / Accepted: 18 September 2019 / Published: 20 September 2019
(This article belongs to the Section Economic and Business Aspects of Sustainability)

Abstract

:
This study was conducted to investigate factors impacting the application of environmental management accounting (EMA) and the relationship between EMA application and performance efficiency including financial and environmental sectors. The scope of research was to investigate construction material manufacturing enterprises in Vietnam with medium and large scales, which is considered one of the industries causing significant negative impacts on the environment. The questionnaires were sent to chief management accountants of 600 construction material enterprises in Vietnam from 2018 to 2019. This process obtained 418 valid votes. Using SPSS 22.0 software to process data, the research results indicate that there are six factors that positively influence the application of EMA practices, including government enforcement, stakeholder interest, positive environmental strategies, community expectations, professional education network, and financial condition, of which, government enforcement has the most significant and positive relationship with the adoption of EMA. On the other hand, it appears that the application of EMA positively impacts financial efficiency and environmental efficiency. As found by many previous studies, environmental efficiency also strongly positively impacts financial efficiency. Thus, innovative solutions to reduce environmental pollution can promote enterprises’ profitability.

1. Introduction

Issues relating to the balance between economic growth and sustainable development have been focused on in international forums. In 1972, The United Nations Conference on Environment took place in Stockholm, Sweden. This forum indicated global environmental concerns [1]. This conference was a driving force for governments of developing countries, including Vietnam, to issue regulations on pollution control. In addition, in 1992, the Summit on Earth in Rio de Janeiro also pushed organizations to raise their awareness to achieve sustainable business operations and minimize environmental impacts. An organization’s competitiveness is directly and/or indirectly influenced by the growing environmental concerns of stakeholders such as governments, investors, customers, and communities [2]. Although the environment is becoming an increasing issue in many countries [3], traditional management accounting practice has many cognitive limitations related to environmental performance [4,5,6,7]. A traditional accounting system does not provide a specific view of environmental impacts and its related costs but focuses instead on financial performance [3,8]. Nowadays, the important role of environmental management accounting (EMA) in environmental management has become more obvious. This change reflects major changes in the past two decades [5,6,9]. In fact, EMA practices have attracted more significant attention in the management of environmental activities. Even though EMA is spreading throughout the world and has recently been widely adopted at a growing level in some Asian countries [5,10], EMA is not popular in Southeast Asia [11]. Vietnam is no exception. EMA is considered a new field in both management research and practice in this country [12].
In general, prior empirical studies on the relationship among influential factors and EMA applications have considered one or two of four theories, but do not address all four theories including institutional, contingency, legitimacy, and stakeholder theory, except for Chang [13], who pointed out that the three biggest barriers to the application of EMA at RMIT University in Australia were financial constraints, government pressure, and environmental uncertainty. Jalaludin et al. [14] concurred that there have not been many discussions about the theoretical basis for EMA practices. From the perspective of institutional theory, Jalaludin et al. [14] and Jamil et al. [15] investigated the quantitative relationship between coercive pressure, normative pressure, imitation pressure, and the adoption of EMA in manufacturing enterprises in Malaysia. While the results of [15] indicated that there was only a positive relationship between coercive pressure and the application of EMA, Jalaludin et al. [14] demonstrated that government pressure and normative pressure significantly affect the application of EMA. Qian and Burritt [16] also considered the possibility of developing EMA under four institutional factors, including regulatory pressure, environmental changes, professional relationships, and imitation pressure. Their research results suggested that professional relationships were the most important factor, followed by imitation pressure, and environmental changes. Government pressure is an indirect factor but is not strong enough to support the development of EMA because the government only promotes a voluntary, rather than obligatory, program.
Based on uncertainty theory, Qian and Burritt [17] conducted in-depth interviews with 12 environmental managers representing 12 local government agencies of New South Wales, Australia. The findings indicate that two uncertain factors consisting of environmental uncertainty and environmental strategy positively influence EMA practices that are able to ensure efficient waste management activities. These results are in line with the survey results of [18]. In addition, Kumpulainen and Pohjola [19] argued that the positive impacts of environmental uncertainty, financial conditions, and education and professional development on the implement of EMA belong to four sectors: transport, telecommunications services, IT, and retail. Further, from in-depth interviews with seven managers of three paper manufacturing enterprises in Thailand, Setthasakko [20] discovered barriers affecting the adoption of EMA practices, including the skill and knowledge of the accounting division and environmental strategies.
As part of legal theory and stakeholder theory, Bansal and Roth [21] interviewed 53 companies in the UK and Japan about their motivations for applying EMA to achieve sustainable development goals. The results show that companies are driven by an impetus to focus on the most influential stakeholders. They debated that integrating an EMA system into one’s practices could be a way of legitimizing a company’s internal operations if the pressure from its stakeholders is strong enough. In particular, customer pressure is a strong factor in complying with environmental activities and reporting environmental information in seven environmentally sensitive businesses in the fields of services, building, manufacturing, and afforestation [22].
In general, many studies exist on the factors impacting the application of EMA. However, the research methodology used in previous studies was mainly qualitative. The previous literature has supplied opinions, conclusions, and solutions based on qualitative results obtained through in-depth interviews and case studies. Quantitative research methods occur sparingly, especially in emerging economies. This view is supported by [14], who argued that there were limitations in knowledge and understanding of the application of EMA practices in developing countries. Although some studies of EMA practices have used quantitative methods (such as [14,15]), the sample sizes are small, which can limit the research results. On the other hand, there is no research on EMA in the field of construction materials, a dirty industry that leads to significant environmental problems. Therefore, the context of this study is one of its novelties.
Many empirical studies have investigated the effect of corporate environmental performance on financial performance with confusing results [23,24,25]. Earnhart and Lizal [23], Iwata and Okada [24], and Ong et al. [25], Al-Tuwaijri et al. [26], and Konar and Cohen [27] reported a partially or completely positive relationship. For example, according to [24], while the effect of waste emissions on financial performance is generally positive, waste emissions have a negative impact in dirty industries. Moreover, greenhouse gas reduction improves the return on equity (ROE) relating to long-term financial efficiency, while it does not significantly affect return on sales (ROS) reflecting its short-term financial performance. Based on an empirical analysis by Czech firms, the results strongly indicate that better environmental performance improves profitability by driving down costs more than revenue [23]. In other words, by reducing air pollutant emissions through a prevention strategy, companies are able to effectively minimize their overall costs by avoiding regulatory sanctions and lowering emission charge payments [25,26]. Similarly, poor environmental performance has a significant negative effect on the intangible asset value of publicly traded firms [27]. In addition, Filbeck and Gorman [28], Qian [29], Rassier and Earnhart [30], Sarkis and Cordeiro [31], and Wagner et al. [32] advocated a negative relationship. As per the debate found in [27], firms certainly spend much money when applying for environmental permits, installing mandatory technologies, and reporting their environmental impacts. The results of [29] indicated that carbon performance significantly negatively impacts financial outcomes in publicly listed companies, suggesting worse carbon performers tend to enjoy higher financial performance, while no significant correlation was found between the two efficiencies in private companies. Although many studies estimated the relationship between environmental and financial performance, previous empirical literature observed only mature market economies [23]. Additionally, the relationship between the application of EMA and firm performance represents a new issue in the literature. To the authors’ best knowledge, no previous study has discussed this statistical link between these two elements. Unlike many previous studies, we investigated the impact of the implement of EMA practices on firm outcomes, as well as the influence of environmental outcomes on financial outcomes in the transition economies of Vietnam.
Construction material manufacturing enterprises in Vietnam contribute 7.5% of the GDP and 9% of the total employment every year [33]. Nevertheless, the Vietnamese construction material industry is one of the largest sectors consuming raw materials, using energy, and generating emission. Wastes that arise from all phases of business activities in this industry create serious consequences for the environment. As a result, enhancing economic performance in parallel with minimizing environmental impact must be given priority. To combat these issues, the Vietnamese government has issued regulations on sustainable development planning for the construction material manufacturing industry from 2020 to 2030. In addition, some environmental management initiatives and programs from manufacturers have been introduced to address environmental problems but the tracking, calculation, and reporting of environmental information have not been investigated [34]. This gap has led to the need to study the EMA in this industry. This study combines many of the best features of the previous research to address three objectives. The first objective is to identify factors influencing the application of EMA. The second objective addresses relationships between EMA application and firm efficiency, while the third objective explores the impact of environmental efficiency on financial efficiency in Vietnamese construction material manufacturers. Findings from this study are valuable to expand appropriate strategies to help Vietnamese construction material manufacturers achieve sustainable development. This study can also significantly contribute to further research that relates to the adoption of EMA in developing countries like Vietnam, where few studies of EMA have been carried out.
This article is divided into the following sections. After Section 1 (the introduction), Section 2 deals with the grounded theories of EMA application and builds research hypotheses. Section 3 presents the research methodology and the development of the research model. Section 4 explores the results and analysis through an experimental survey. The end of the article presents a discussion and conclusion and suggests a foundation for carrying out new studies in the future.

2. Research Literature and Hypotheses Development

2.1. Environmental Management Accounting (EMA)

Management accounting has been developed over the years to focus on resource management and waste minimization to increase value. The development of management accounting has led to newly developed views and techniques, including EMA [35]. EMA was formed and developed by and with strong support from organizations, researchers, and authorities. In 1992, the United States Environmental Protection Agency (USEPA) initiated a voluntary program for EMA development conducted by Environmental Management Accouting Research and Information Center (EMARIC). This program aims to build a unified framework for identifying and defining environmental costs, establishing principles, and integrating environmental information in the decision-making process [36].
In the late 1990s, another project on EMA was developed by the European Commission on Climate Change (ECCC). This project, named Ecological Management Accounting (ECOMAC), was a significant environmental management tool. This project was carried out between 1996 and 1998 in 84 organizations of four European countries, including Germany, the Netherlands, Italy, and England. The aim of the project was to identify potential environmental issues. As a result, it was concluded that regulations relating to publishing environmental reports can promote the implementation of EMA. After the ECOMAC project, the ECFCC continued studying EMA through the European Environmental Management Accounting Network (EMAN) Europe in 1998. This network includes researchers, consultants, and businessmen interested in EMA practices. This network was later developed in Asia in 2000, in the United States in 2002, and in Africa in 2005 [36]. Since 2000, EMA has become more popular in research and practice. EMA has been viewed as an extension of management accounting in solving environmental problems [37]. Management accountants are trained to improve the quality of environment-related information and apply it in decision-making for investment appraisal, capital budgets, and strategic management because management accountants play an important role in verifying the honesty and reliability of information from tracking, collecting, and disclosing information to more strategic roles in policy and planning [2,3,6,13].
Many definitions of EMA have appeared in documents and show the difference in the scope or boundaries of applications [5,13,38]. Generally, EMA emphasizes main contents, such as EMA being a part of management accounting and providing environmental information for internal management. EMA, which is the intersection between environmental accounting and management accounting [39], not only includes monetary information but also physical information [5,39,40]. Although the main purpose of EMA practices is to provide environmental information for business strategies (Table 1), information collected from EMA may also be used for other purposes, such as external reporting [35].

2.2. Research Theories Applied in EMA

This study established hypotheses about factors affecting the application of EMA based on four theories including contingency theory, institutional theory, stakeholder theory, and legitimacy theory. Contingency theory alludes to the organizational structure, while the three remaining theories relate to the relationship between organizations and society. These theories directly or indirectly affect each other and should be considered holistically instead of separately. All three theories are considered system-oriented theories. They focus on one’s role in providing information about the relationship between organizations and governments, individuals, and other related groups. Stakeholder theory sees an organization’s stakeholders as an individual. Legitimacy theory is considered a comprehensive perspective while institutional theory is recognized as an accepted social rule and/or institutional practice that is indirectly affected by the organization’s stakeholders. Stakeholder theory and legitimacy theory explain why managers chose a detailed strategy, such as disclosing voluntary environmental information, while institutional theory examines larger issues, to explain why an organization accepts a detailed strategy in practice. In addition, stakeholder and legitimacy theory explain how an organization tries to gain legitimacy among a stakeholder group, while institutional theory specifically explores what organizations do to implement such regulations [41].

2.2.1. Contingency Theory

Contingency theory was clearly explained in 1960 by pioneering researchers such as Burns and Stalker, Hage, and Lawrence and Lorsch [13]. This theory shows that an organizational structure depends on the uncertainty of the environment. Contingency theory studies organizational behavior and explains how uncertainty factors, such as technology, culture, and the environment, affect the organizational structure [42]. Moreover, Qian and Burritt [17] recognized that to achieve objectives, an organization must meet its functional requirements and remain consistent with its organizational structure and management process. The functional characteristics of an organization, such as its strategy, technology, scale and resources, are called “uncertainties”.
Contingency theory was applied to management accounting in early 1970 [13]. According to Islam and Hu [42] and Covaleski, Dirsmith, and Samuel [43], one of the first studies on management accounting based on uncertainty theory was done by Hofstede, who found that economic, technical, and social factors significantly influence the management accounting system. In addition, Muslichah [44] argued that designing effective management accounting depends on specific elements, such as the environment, organizational characteristics, and the views of management decisions. A positive relationship between an organization’s strategy and the design of an accounting system was also discovered. According to Islam and Hu [42], studies by Fisher, Hartmann, and Chenhall also investigated the influence of external factors, such as environmental uncertainty, as a major explanatory variable to determine whether accounting data can accurately assess organizational efficiency. Bouma and Van de Veen [45] demonstrated that contingency theory has useful potential in explaining environmental accounting, especially in EMA practices.
• Positive environmental strategy
The uncertain relationship between the environment and a business strategy can influence the design of a management accounting system [46]. Changes in environmental strategies will create changes in management accounting systems to provide more accurate environmental information. Environmental strategy is a part of overall actions needed to manage the interactions between the economy and the environment [47]. The selected environmental strategy often identifies the setting for environmental governance, including EMA [17]. Qian and Burritt [17] proposed that contingency theory is connected with environmental accounting, environmental strategy, and uncertainty. Environmental accounting is designed to support and facilitate environmental strategies. The more positive the environmental strategy, the higher the development of environmental accounting and the wider the scope of environmental accounting information. When environmental issues become more flexible and uncertain (for instance, the changing demand for green products and markets), organizations will surely use environmental accounting tools to deal with changes.
Guo [48] specified that companies with different environmental strategies require different management information systems to improve organizational effectiveness. Accounting information systems, which play an important role in an organization’s activities, impact their success by shaping the strategies. According to Chang [13], an environmental strategy can be divided into two aspects: negative and positive. Organizations invest in waste treatment technology as a solution to deal with environmental regulations or reduce pressures from stakeholders which can be classified as negative environmental strategies. On the contrary, organizations voluntarily choose clean technology to redesign their production processes, with the intent to reduce the environmental impacts or prepare for future compliance (called positive environmental strategies). Once an organization chooses an active and positive environmental strategy, it is certain that the organization will change its management accounting system and adopt better practices. Conversely, organizations pursuing passive environmental strategies may continue to depend on their current system. In other words, a management accounting system is less likely to be improved and changed [12]. Therefore, if an organization integrates the environment into its business strategy and determines positive environmental programs, their management accounting system will be better able to collect, calculate, and provide useful information, including environmental information. The first hypothesis is developed thus:
Hypothesis 1 (H1).
A positive environmental strategy has a positive relationship with EMA application.
• Environmental uncertainty
As the organization’s environmental factors become more unpredictable, decision makers have a tendency to handle more relevant information to address uncertainty issues [46]. If the environment becomes an uncertain resource, EMA plays a very important role in providing environmental information. Chang [13] agreed that it is necessary to re-establish traditional management accounting systems to meet environmental changes. When an organization is greatly influenced by environmental uncertainty, it can innovate its accounting system aimed to minimize environmental impacts and better manage its operations. This organization can better determine what type of accounting innovation is required or what environmental information should be provided. The high degree of uncertainty in the environment will require organizations to respond quickly to unpredictable changes. Therefore, organizations need to be provided additional with information by EMA practices to reduce their uncertainty and make decisions. Lewis and Harvey [49] gave scales to measure environmental uncertainty, including Changes in government environmental policy; Changes in environmental resources used by organizations; Changes in green products, markets, and consumption; Green competition; Changes in cleaner production technologies; and Changes in stakeholders’ actions on the organization’s environment issues. The second proposal is:
Hypothesis 2 (H2).
Environmental uncertainty has a positive relationship with EMA application.
• Financial condition
It is discussed that the financial condition will put pressure on managers to increase profits and, therefore, discourage them from focusing on improving, as well as measuring, non-financial activities, such as environmental activities [50]. When organizations have good financial conditions, they can focus their budgets on environmental management activities and easily access capital for sustainable development purposes. This is supported by some studies [13,51], especially when the decision to measure environmental information also depends on the financial condition of an organization. Although EMA plays an important role in improving an organization’s efficiency, both financially and environmentally, it will be less emphasized in organizations facing negative financial conditions. Environmental performance is an area of interest in this study, as financial consideration is a potential factor impacting the application of EMA [13]. A positive financial condition shows that the more financial performance is enhanced, the more an EMA system is emphasized. This theory provides a follow-up proposal:
Hypothesis 3 (H3).
Financial condition has a positive relationship with EMA application.

2.2.2. Institutional Theory

Unlike the contingency theory, which is based on the technical environment, institutional theory is based on the impacts of the institutional environment on organizations, in which the institutional environment is characterized by the construction of requirements that organizations and individuals must comply with to receive support and obtain legitimacy [13]. Social rules and norms have a strong influence on the behaviors and decisions of social actors. Through institutionalization, activities that preserve social rules and norms will be accepted as appropriate. The organization is a subject in society and remains an element of the social structure [52]. Social rules and norms affect an organization and will also affect the people in that organization, the benefits that the organization creates, and how that organization adapts to the environment. DiMaggio and Powell [52] demonstrated that an organization’s governance decisions are significantly influenced by three mechanisms: coercion, norm, and imitation. In particular, the coercive mechanism reflects mandatory laws, regulations, and sanctions; the normative mechanism refers to social values and beliefs shared among organizations; and the imitative mechanism indicates that when a social behavior or relationship is accepted and absorbed in a field, other members tend to behave in an acceptable way [6].
According to [14], many previous studies, such as Siegel et al., Hussain and Hoque, Hussain and Gunasekaran, Arnaboldi and Lapsley, and Sila, have shown the relationship between institutional theory and management accounting practices. Nevertheless, since the mid-1990s, institutional theory has been applied for EMA practices. Indeed, only a few empirical studies are available on how exploiting changes in the institutional environment affects how to measure environmental information in organizations [45,53]. Chang [13] also discussed how the institutional context of increasing environmental awareness has affected EMA application. If there is strong expectation in the institutional context of an organization that EMA needs to be implemented, then the organization must make suitable activities conforming to the wishes of society. Qian and Burritt [16] developed an EMA implementation in relation to institutional pillars, such as government enforcement, professional education and development, imitation pressure, and network of professional associations.
• Government enforcement
Government enforcement reflects legal regulations that provide organizations with powers and rules when interpreting information [52]. Compliance with government rules and standards will help organizations survive and thrive. On the contrary, failing to comply will lead to a loss of income, reputation, or even the loss of a company’s business activity license [6]. Government enforcement can make organizations change their behavior [54,55]. Hoffman [56] shows that government agencies are the most visible objects affecting environmental performance in organizations. ISO14001 certification is more popular in Europe than America mainly because of the many incentives offered by governments in Europe. Similarly, due to motivation from the Japanese government, environmental accounting has been applied to an increasing number of Japanese companies. It seems that organizations operate in line with the government’s mechanism to survive and develop, as shown in [54], or to achieve the legitimacy explained by [57].
In addition, according to [6], Porter acknowledged that strict environmental regulations lead to an innovative approach to promote the enterprise’s competitiveness. Jennings and Zandbergen [58] used institutional theory to explain the concepts and definitions of ecological sustainability in organizations and propose that coercive pressure is the main factor in implementing sustainable goals. Many studies have demonstrated that government enforcement has a strong influence on the application of environmental management systems [59] and EMA practices [12,14,15,37]. This may also explain why the government promotes the voluntary introduction of EMA as a tool that creates potential benefits for organizations [6]. EMA is primarily a voluntary part of management and is only applied when managers suggest that the benefits of EMA are greater than its costs. Most countries still do not have mandatory EMA requirements, while changes and developments of regulations can impact the development of EMA, and, in fact, EMA is under government control.
Hypothesis 4 (H4).
Government enforcement has a positive relationship with EMA application.
• Professional education and development
Specialization involves the general struggle of members in a profession to determine their working conditions and methods aimed at establishing awareness and legalization [52]. The result of specialization is that trained professionals create the power to influence and legalize habits and activities in their organizations. Specialization is very important in the development of EMA. Regime and normative rules of professional behavior can be transmitted through two channels. One channel is education and the other is professional development.
Parker [60] argued that environmental managers have more authority than accountants in managing environmental information, as well as environmental regulatory and control systems. In contrast, Bartolomeo et al. [40] discussed that environmental experts are not common enough to be considered in financial accounting information when making environmental decisions. Environmental experts do not fully realize the benefits that accounting information and techniques can provide for decision making. This may limit their attitude towards finance performance and the role of accounting information in environmental management. For example, Le [37] conducted an interview of five environmental managers and surveyed 71 environmental managers in Vietnamese brick manufacturing enterprises. He found that many managers lacked the necessary knowledge about the potential benefits in environmental improvement. Schaltegger et al. [6] studied three local governments in the UK and revealed that although the environmental data collection system was developed by environmental engineers, the environmental information obtained from the accounting system was not sufficient.
Therefore, in order to implement EMA, the management accounting department must have a thorough and comprehensive understanding of EMA. Otherwise, the collection of information would be problematic and could not be used effectively, even if it were collected [34]. The professional education and development mechanism not only provides opportunities for interaction among members of the management accounting department but also facilitates the exchange of knowledge with other departments and increases our understanding of the importance of sustainable development. Therefore, the next hypothesis is:
Hypothesis 5 (H5).
Professional education and development have a positive relationship with EMA application.
• Mimic pressure
Schaltegger et al. [6] showed that when social behaviors or relationships are accepted and absorbed in a field, members tend to behave in a way that is acceptable or noticeable by other members. This mechanism is called imitation process. This process emphasizes the effects caused by behavioral networks and social relations [52]. The result of this discussion are the interaction models between organizations defined by the sharing system. When there are enough actors in the field where the organizations work together, specific actions are institutionalized, and then other actors must choose imitation as a safe and effective strategy [52] or gain competitive advantage [41].
The values and rules that are disseminated and institutionalized in an organization can have direct effects on environmental performance in member organizations. As concepts and approaches for sustainable development and environmental protection, such as cleaner production processes, have emerged and been developed in recent years, organizations have become more likely to be informed and receive the dissemination of these concepts and approaches. If a member recognizes that other members in their area have implemented sustainable innovation, that member will be subjected to cognitive pressure, thereby making imitation a safe option [6]. Once an organization is able to mimic the behaviors of other organizations that are closely related or increasingly attached to them [43,52], an organization tends to work with or is tracked by organizations that have similar sizes, types, industries, or geographic locations. Jennings and Zandbergen [58] argued that if values or standards, such as green market development and waste recycling, are recognized, the organization will act to imitate other organizations instead of doubting their values and standards. Similarly, if the institutionalized EMA concepts and methods are widely considered in a particular area, organizations are more likely to imitate the concepts and methods of other organizations. The development of EMA can thus be encouraged by environmental imitation [6]. As a result, the next hypothesis is proposed:
Hypothesis 6 (H6).
Mimicking pressure has a positive relationship with EMA application.
• Professional association network
A professional association network promulgates standards and rules of organizational and professional behaviors [52]. Within a network, standards and rules can be formed, developed, and changed [6]. The development of a professional association for EMA could represent the development of EMA in the organization. If organizations participate in the associated network, organizations will access to concepts and theoretical frameworks for EMA practices which will facilitate discussions and negotiations, information about learning mechanisms and development issues, and the appearance of behavioral changes. Members from different industries in the network can convey the messages to pursue eco-efficiency. When new ideas and norms for EMA are initiated by experts, the old institutional rules are lost, instead of introducing changes and innovations that can be tested and spread throughout the professional community.
Several environmental professional associations have been developed, such as Global Report Innitiative (GRI), International Organization for Standardization (ISO), and Organisation for Economic Co-operation and Development (OECD). There are also several professional accounting agencies conducting research on EMA including International Federation of Accountants (IFAC) [3] and United Nations Division for Sustainable Development (UNDSD) [8]. Moreover, more for-profit and non-profit organizations are voluntarily implementing guidelines to report their sustainability information. EMA initiatives in organizations have also been applied via the documents found in [3,7,8,61]. EMA programs of professional associations and accounting agencies have caused institutional pressures that provide environmental reports or applied EMA practices to organizations.
Hypothesis 7 (H7).
The professional association network has a positive relationship with EMA application.

2.2.3. Legitimacy Theory

Legitimacy theory assumes that there is a relationship between an organization and the society in which that organization operates. An organization is not an isolated unit but exists in relationship with society [41] because organizations consume resources from society and provide their products and services to that society [35]. Pfeffer and Salancik [62] explained that organizations try to achieve acceptable behavioral standards in the social system. In this way, organizations will have a social contract or an operating license to meet social expectations [63].
Legitimacy theory also shows that once managers think that providing specific information is crucial for an organization’s survival, they will pursue strategies to provide continuous information aimed at achieving or maintaining legitimacy. Most studies have focused on the role of legitimacy theory in voluntary environmental reporting. According to Hoffman [56], a community can see changes in an organization’s environmental performance. The reason for an organization to incorporate environmental concerns into its accounting practice may include legitimacy factors. In other words, responsibility in revealing environmental information to community can be important for changing the accounting system. Florida and Davison [64] investigated why organizations choose to adopt the environmental management system. They discover a positive correlation between environmental management and community. Delmas and Toffel [54] concurred that decisions to select environmental management measures are affected by improving or maintaining relations with the community. Prakash [65] pointed out that a voluntary environmental strategy involves a wider review of the community. In addition, environmental strategies can be accepted by an organization in an effort to address community expectations. When a community expects organizations to take actions toward environmental responsibility, organizations will meet their expectations and develop legally internal operations. The application of EMA will also be renewed because it plays an important role in providing explanations and gaining legitimacy [13]. Therefore, legitimacy theory may impact EMA practices. Thus, the eighth hypothesis is developed:
Hypothesis 8 (H8).
Community expectations have a positive relationship with EMA application.

2.2.4. Stakeholder Theory

Stakeholder theory has been widely applied since Freeman’s book named Strategic Management: a Stakeholder Approach was published in 1984. Freeman [66] offered a persuasive view that attending to the management system according to the interests of stakeholders is crucial for an organization’s sustainable success. Organizations meet the needs of stakeholder groups with strong authority or influence to control their resources and will tend to ignore the concerns of groups with low authority or influence [67,68,69]. Prakash [65] pointed out that the stakeholders should be classified according to power, and this classification is necessary to better explain what managers should focus on. Stakeholders can thus create organizational changes to meet their expectations [66].
Deegan [70] discussed clearly that two aspects of stakeholder theory consist of managerial and ethical aspects. In particular, the managerial aspect emphasizes managers’ efforts to meet the interests of stakeholders who have strong authority (i.e., control of the organization’s important resources), while the ethical aspect balances the stakeholders’ interests because all stakeholders have been given similar rights [41]. This implies that the disclosure of information may affect organizational survival and success (the management aspect) or that disclosure might be necessary (the ethical aspect). If the stakeholder has a strong influence on the environmental impacts caused by the organization, then the organization can become aware of the need to improve their information system, including accounting for reducing stakeholders’ concerns [68]. Stakeholder theory recognizes the complex and flexible relationships between organizations and stakeholders, including accountability and environmental management practices [54,59].
Schaltegger and Burritt [2] stated that when the internal accounting system in an organization affects the interests of external stakeholders, for example by ignoring the environmental impacts in the organization’s operations, they pay attention to improving and even changing its internal operations. Stakeholder theory can be adopted to promote EMA practices. Organizations apply EMA because it is a way to legitimize their activities. EMA practices appear to manage environmental impacts in order to respond to the pressure of stakeholders with strong influence. Therefore, stakeholder theory is also one of the most popular theories by environmental accounting researchers to explain why organizations publish voluntary environmental information [70].
Hypothesis 9 (H9).
Stakeholder interests have a positive relationship with EMA application.

2.3. An Organization’s Environmental and Financial Efficiency

EMA benefits are undeniable. Firstly, EMA overcomes the disadvantages of traditional management accounting systems, by providing more accurate cost allocation and product pricing [2,8,71]. In addition, EMA helps organizations to reduce negative environmental impacts and save costs [19,72,73]. Many studies [2,61,74] have further proven that EMA is an essential tool for integrating environmental issues into project appraisal. The insight application of EMA can also facilitate full environmental information and create a clearer picture of environmental activities, thereby providing useful information for managers in making decisions and engaging in strategic planning [2,8,10,13,61,75]. Finally, EMA practices improve an organization’s image, improve relationships with the community and stakeholders, comply with environmental laws, and manage environmental risks [6,10]. Thus, EMA application has positive impacts on financial and environmental performance [29]. However, it is noted that previous empirical studies related to financial efficiency and environmental performance do not explain the relationship between EMA application and performance efficiency. Previous studies explored the link between environmental performance and financial performance [23,24,25,26,27,28,29,30,31,32]. Therefore, studying EMA application effects on performance efficiency, including both the environmental and financial sectors, is a gap in previous studies. Financial efficiency and environmental performance are measured in many ways [26]. For financial efficiency [26,29], return on assets (ROA) is used as an important scale. According to [19], ROA is considered a suitable scale that reflects financial efficiency and has been used in many previous studies, such as those by Russo and Fouts, King and Lenox, and Nakao et al. ROA is a common measure and a representative indicator of financial efficiency [69]. Alternatively, Wagner [76] used two criteria of ROE and ROS to measure financial activities in the paper manufacturing industry in Europe. Iwata and Okada [24] measured financial outcomes via ROA and ROS to examine how environmental activities affect financial performance [24]. Meanwhile, Konar and Cohen [27] and Hart and Ahuja [77] used three scales, including ROS, ROA, and ROE, to evaluate financial performance of the 500 largest market capitalization companies listed on the two largest stock exchanges in America including NYSE and NASDAQ. Three scales were also applied by [24] to Japanese manufacturing enterprises. Thus, this study uses all scales to measure financial performance.
With respect to environmental efficiency, this study inherits scales found in [23,24,25,26,29]. These studies used three scales, including the amount of waste generated, environmentally friendly products, and image and reputation, in which “the amount of wastes generated” is the most commonly used scale. Al-Tuwaijri et al. [26] pointed out that this scale relates to the first three principles of environmental performance issued by Coalition for Environmentally Responsible Economies (CERES): minimizing environmental impacts, using efficient resources, and reducing waste. The study in [23] agreed that the amount of waste is an indicator of environmental performance that is in line with previous studies, such as Konar and Cohen, Konar and Cohen, Earnhart and Lizal, Khanna and Damon, Khanna et al., and Arora and Cason. Three hypotheses are developed:
Hypothesis 10 (H10).
EMA application has a positive relationship with financial efficiency.
Hypothesis 11 (H11).
EMA application has a positive relationship with environmental efficiency.
Hypothesis 12 (H12).
Environmental efficiency has a positive relationship with financial efficiency.

3. Research Methodology

3.1. Sampling

According to [33], in Vietnam, construction investment accounts for about 70% of social investment, of which construction materials reach 30%–50% of the total construction investment. Therefore, the development of the building material industry not only helps the construction industry and real estate industry develop sustainably but also contributes significantly to economic and social development in Vietnam. In 2017, the total revenue of construction materials reached nearly VND 400,000 billion (nearly USD 17 billion), accounting for 7.5% of the GDP. Vietnam’s construction materials products were exported to 120 countries with a turnover of over USD 1670 million in 2017, accounting for 20%–50% of the total output. The goal of the Vietnamese construction material industry is to reach an export turnover of USD 2 billion by 2020. The ratios of each main material in the total design capacity are: cement: 20%–30%, paving materials: 25%–30%, flat glass: 20%–30%, sanitary porcelain: 30%–40%, lime: 30%–50%, and steel: 20%–25%. By 2030, the construction material industry must advance its production technology, achieve high levels of automation, reduce its raw material and energy consumption, minimize its environmental pollution, and reduce its CO2 emissions. Building materials are one of the industries that consume the most resources and energy and present the highest risk of environmental pollution.
Although many construction material enterprises in Vietnam have started reporting environmental information in their annual reports or providing separate environmental reports, such as environmental impact reports and environmental monitoring reports, a few enterprises use environmental information for internal management purposes. There is also little research on EMA to explain why EMA is adopted or not adopted. Due to this paucity of information, there is little understanding of EMA, and the factors affecting EMA application have not been discovered for this industry. The present study selected the construction material industry because it has significantly negative impacts on the environment, such as consuming a huge amount of resources, turning cultivated land into ponds and lakes, causing erosions, and seriously affecting ecosystems and landscapes. Every year, the construction material industry generates emissions, dust, and toxic waste, affecting the environment and increasing greenhouse gas emissions, environmental treatment costs, and pollution management and prevention costs. Therefore, it is necessary to control and manage the environment in construction material enterprises. The scope of research is the construction material industry in Vietnam at both medium and large scales, because large and medium-sized enterprises are able to apply EMA, while small-scale enterprises without much understanding of EMA do not fully adopt EMA.
This study conducted surveys of chief management accountants in construction material enterprises, as these subjects have the most knowledge about EMA practices, the factors affecting EMA application, and the relationship between EMA and performance efficiency. The questionnaires were sent online or directly to the chief management accountants of 600 construction material enterprises in Vietnam during the period from June 2018 to January 2019. First, the authors sent the questionnaire directly to the chief management accountants of 50 enterprises which enabled us to collect initial information and find out whether the respondents really understood the issues. After directly discussing the contents of the questionnaire, the authors found that the respondents comprehended the information. During the survey, the authors often called to remind them and explain and exchange questions, as required. The survey results obtained 435 responses from which 17 invalid responses were removed, and 418 valid responses were retained which met the required sample size to reach 95% confidence in the statistical results.

3.2. Questionnaire Design

Questionnaires were used as the instrument for data collection. There were four sections on the questionnaires that were developed based on the study’s objectives. The first section aimed to describe the characteristics of respondents, such as gender, educational level, and work experience. The second section raised questions about the application of EMA practices, and the third part dealt with the factors influencing EMA application. The final part offered questions about financial and environmental efficiency of the enterprise. The research model was developed by the authors to explore the three objectives (see Figure 1).
All scales of influencing factors, EMA application, and performance efficiency were measured, on a Likert scale from 1 to 5. For influencing factors, a five-point Likert scale with 1 = no application and 5 = full application was used, while a five-point Likert scale where 1 = no implementation and 5 = full implementation was used for the EMA variable. For firm efficiency, respondents were asked to evaluate financial and environmental efficiency relative to the main competitors over the last three years. The efficiency indicators were measured using a five-point Likert scale (ranging from 1 = “much worse than competitors” to 5 “much better than competitors”). There were 36 scales for influencing factors, 10 scales for EMA application, 3 scales for financial efficiency, and 3 scales for environmental efficiency. Scales of the factors, EMA application, and performance efficiency were inherited from previous studies, except for the three scales of influencing factors, where ‘Professional association network’ was exchanged with research experts which were developed by the authors (in Appendix A).

3.3. Data Analysis

Valid questionnaires were encoded, declared, and entered into SPSS software, version 22.0. From the software, the data continued to be processed via reliability testing, descriptive statistics, factor analysis, and regression analysis. Testing scale reliability was assessed by testing the consistency of the entire scale with Cronbach’s alpha and corrected item-total correlation as the most widely used measures. The generally agreed upon lower limit for Cronbach’s alpha is 0.60 and for corrected item-total correlation is 0.30 in exploratory research. A descriptive statistical technique was used to analyze the frequency and percentage of the background of target respondents and describe basic characteristics of scales with mean and standard deviation. Moreover, the skewness value was used to examine the balance of the distribution. If the skewness coefficients of observed variables range from −1 to 1, the observed variables will reach the normal distribution [78].
The influence of the factors on the adoption of EMA and the effect of the adoption of EMA on firm performance were also analyzed in this study with exploratory factor analysis (EFA) and multiple regression analysis. According to [78], to conduct an exploratory factor analysis as well as multiple regression analysis, the number of samples must be at least five times higher than the number of scales. In this study, there were 52 scales and the samples were equal to 418 (eight times higher than the number of scales). Thus, exploratory factor analysis method was used completely. The steps taken in the EFA method were:
Step 1: Kaiser−Meyer−Olkin (KMO) test was used to measure sampling adequacy for each variable in the model while Bartlett’s test was used to test if variances were equal for all samples. Factor analysis is appropriate when the KMO value ranges from 0.5 to 1. The significant value of Bartlett’s test of less than 0.05 demonstrates that the variables are correlated with each other.
Step 2: An extracted variance table was built to determine the number of factors extracted and the percentage as an explanation of the factors. The standard for extracted variance was greater than 50%.
Step 3: A rotated component matrix table showed how many scales were considered for each factor. The table contains the factor loadings for each variable on each factor. Factor loadings indicate the degree of correspondence between the variable and the factor, with higher loadings making the variable representative of the factor. Factor loadings greater than 0.50 were considered significant.
For the multiple regression analysis, three steps were performed, as follows:
Step 1: A correlation matrix between dependent variables and independent variables was created. The greater the correlation coefficient, the more closely the variables have a relationship. If the significance value of the test was less than 0.05, these variables could be used in a multiple regression model.
Step 2: The adjusted square R coefficient and ANOVA analysis were used to assess the suitability of the regression model. The larger the adjusted square R coefficient, the higher the relevance of the model. If the significance value of the F test in the ANOVA analysis is less than 0.05, it can be concluded that the model is suitable.
Step 3: The regression coefficients of the independent variables included in the model were determined. This study used a stepwise method to select the most appropriate model. If the significance values of the regression coefficient test are less than 0.05, the independent variables are related to the dependent variable. In addition, among independent variables there is no multicollinearity, according to [78], when the variance inflation factor (VIF) values ​​in the coefficients table are less than 10. The Durbin−Watson test was conducted to measure autocorrelation in the residuals from the regression analysis. Values of the Durbin−Watson test of less than 1 show that there is a positive autocorrelation, while values between 1 and 3 indicate no autocorrelation, and test statistic values in the range of 3−4 indicate negative autocorrelation.

4. Research Results

4.1. Profile of Sample

Figure 2 shows general information for the respondents. Among the 418 respondents, the number of females (71.1%) was much higher than the number of males (28.9%), which agrees with the professional characteristics of accounting in Vietnam. For the education level, university degrees had the highest rate with 65.6%, followed by post-graduate (27.5%) and college (6.9%). Chief management accountants had a high level of education, ensuring the reliability and quality of survey responses. For years of experience, the number of respondents who have acted as chief management accountants from 5 to less than 10 years was the highest (30.4%), followed by 10 to less than 15 years (23.7%), 15 to less than 20 years (17.7%), more than 20 years (16.7%), and 1 to less than 5 years (11.5%). Ultimately, the respondents with extensive experience in the field of accounting clearly understood how environmental information is calculated, aggregated, and reported and whether or not environmental information is primarily considered in business decisions.

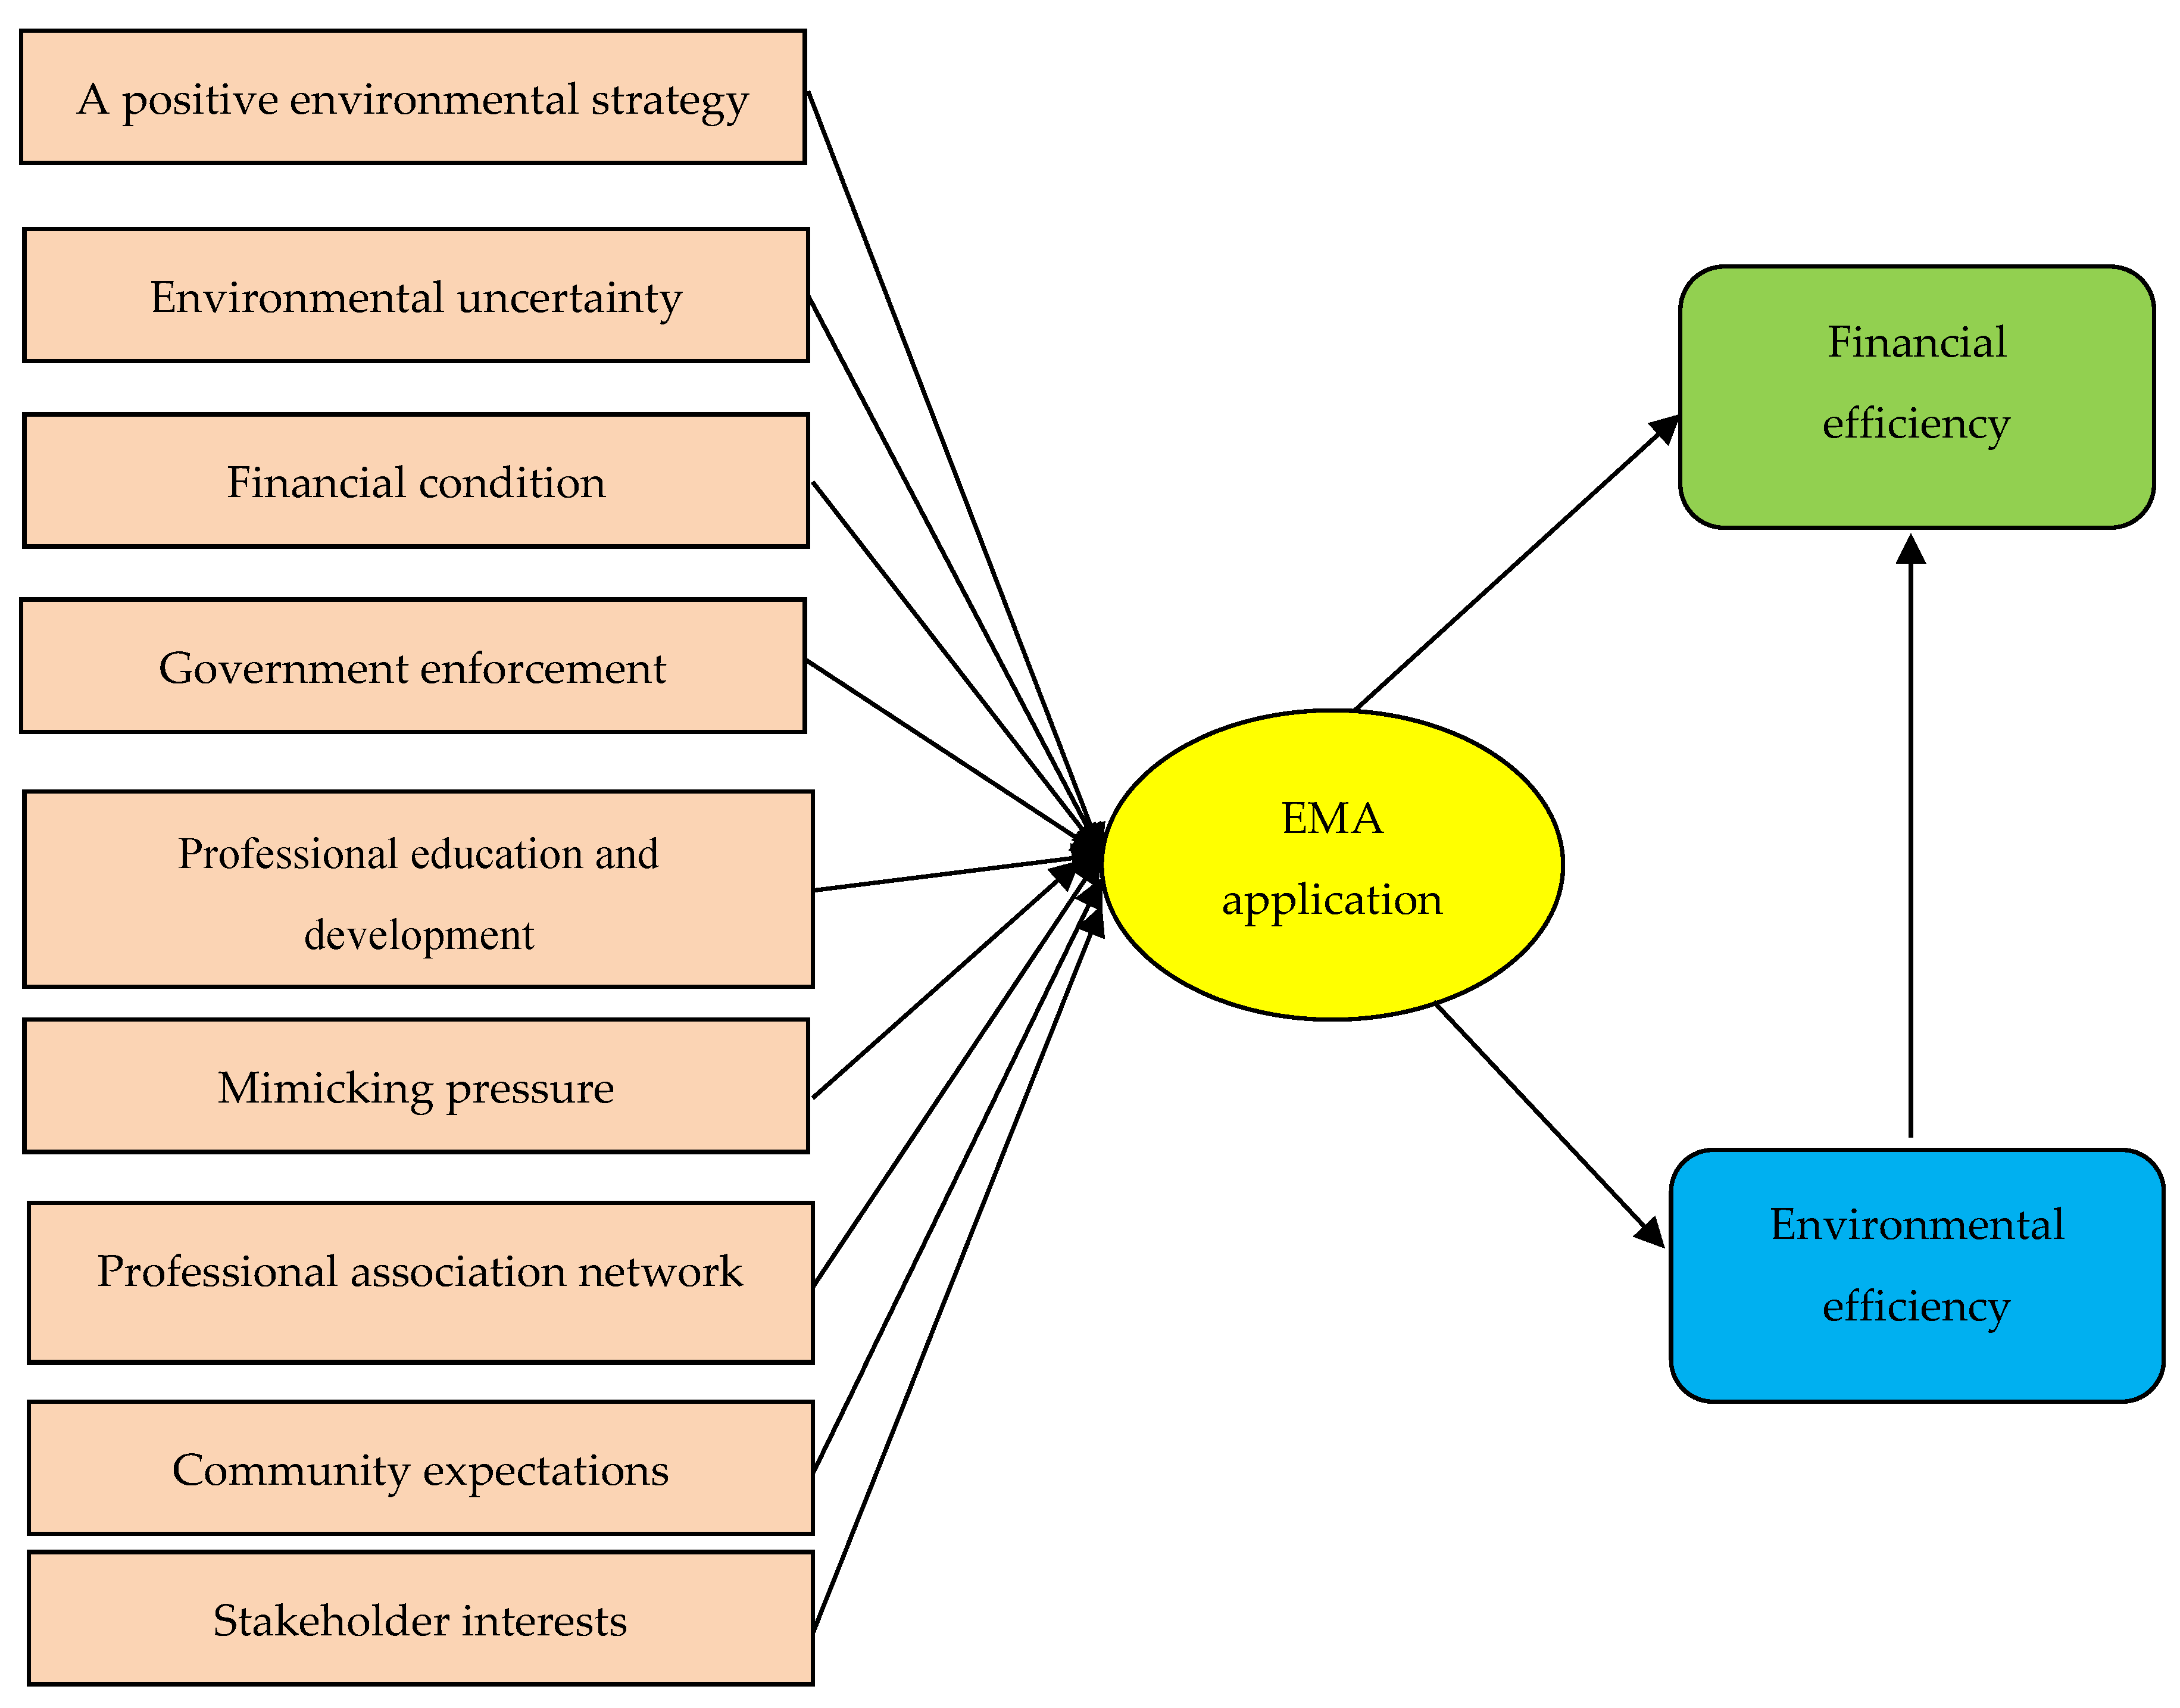
4.2. Factors Influencing EMA Application

This study tested the reliability of all scales for factors affecting EMA application. Shown in Appendix B, the corrected item-total correlation of the scales was greater than 0.5 (ranging from 0.511 to 0.850) and the Cronbach’s alpha if item deleted coefficient was greater than 0.7 (between 0.726 and 0.915) which indicates that all scales were acceptable with good reliability. In other words, in reliable tests using 10 scales to analyze EMA application, similar results were consistently shown (see Appendix B). Corrected item-total correlation values of the variables were between 0.620 and 0.832, Cronbach’s alpha if item deleted values ranged from 0.903 to 0.915. The skewness values of all items in [−1; 1] show that the observed variables follow standard distribution.
Table 2 shows that the KMO value was 0.907 [0.5;1] and the significance value of Bartlett’s test was less than 0.05 (Sig. = 0.000). Therefore, factor analysis was suitable.
Table 3 shows the number of factors extracted and an explanation of the factors. The initial eigenvalue was greater than 1 among the eight factors that were extracted. The cumulative percentage value (75.664%) was higher than the recommended critical value of 50%. The results indicate that the first eight factors explain 75.664% of the total variance in the observed variables.
A rotated component matrix was used to determine the number of observed variables in each factor. There were two scales, EDD4 and COE1, that had a factor loading of less than 0.5 and were removed from this model (in Appendix C). Rerunning the model, the final results in Table 4 show the eight factors extracted.
Additionally, the findings in Appendix D point out that all factors had a positive correlation with the application of EMA, among which four factors including government enforcement, positive environmental strategy, stakeholder interests, and community expectations, had a strong correlation with the application of EMA (i.e., correlation values greater than 0.5). The significance value of the test was less than 0.05 (Sig. = 0.000), indicating that these variables could be used in the regression model.
A stepwise method was carried out in regression analysis. Results from SPSS 22.0 software show that there were six models. All models had a high adjusted R2 coefficient and a Sig. value in the F-test that was less than 0.05 (Sig. = 0.000) (Table 5). Therefore, it can be concluded that six models were suitable. This study selected the sixth model with the best results. This model had an adjusted R2 value of 0.839 which means that 83.9% of the variation of EMA application is explained by six factors. Moreover, the value of d in the Durbin−Watson test was equal to 1.439 within a range from 1 to 3, showing that there is no similarity between the remainder in the regression model.
Table 6 shows the results of the significance tests of the R2 coefficient for the whole data used to evaluate the suitability of the model. The results show that the Sig. value was 0.000 (<0.05), meaning that R2 on the whole was significantly different from zero. Hence, the regression model was suitable.
The results in Table 7 show that there were six factors that had a positive relationship with EMA application, including government enforcement, stakeholder interests, positive environmental strategy, community expectations, professional education and association network, and financial condition. Consequently, the research findings support H1, H3, H4, H5, H7, H8, H9. In particular, government enforcement had the strongest impact on the adoption of EMA, with a standardized beta coefficient equal to 0.592, followed by positive environmental strategy (beta = 0.168), stakeholder interests (0.153), and community expectations (0.114). Professional education and association network and financial condition are the weakest factors, with standardized coefficients of 0.076 and 0.047, respectively.
The significance values of the regression test were less than 0.05. Thus, these coefficients are significantly different from zero. In other words, the independent variables in the model had a relationship with dependent variable. The regression model was also significant. The VIF values in the coefficients table were smaller than 2, finding that there was no multicollinearity between the independent variables.

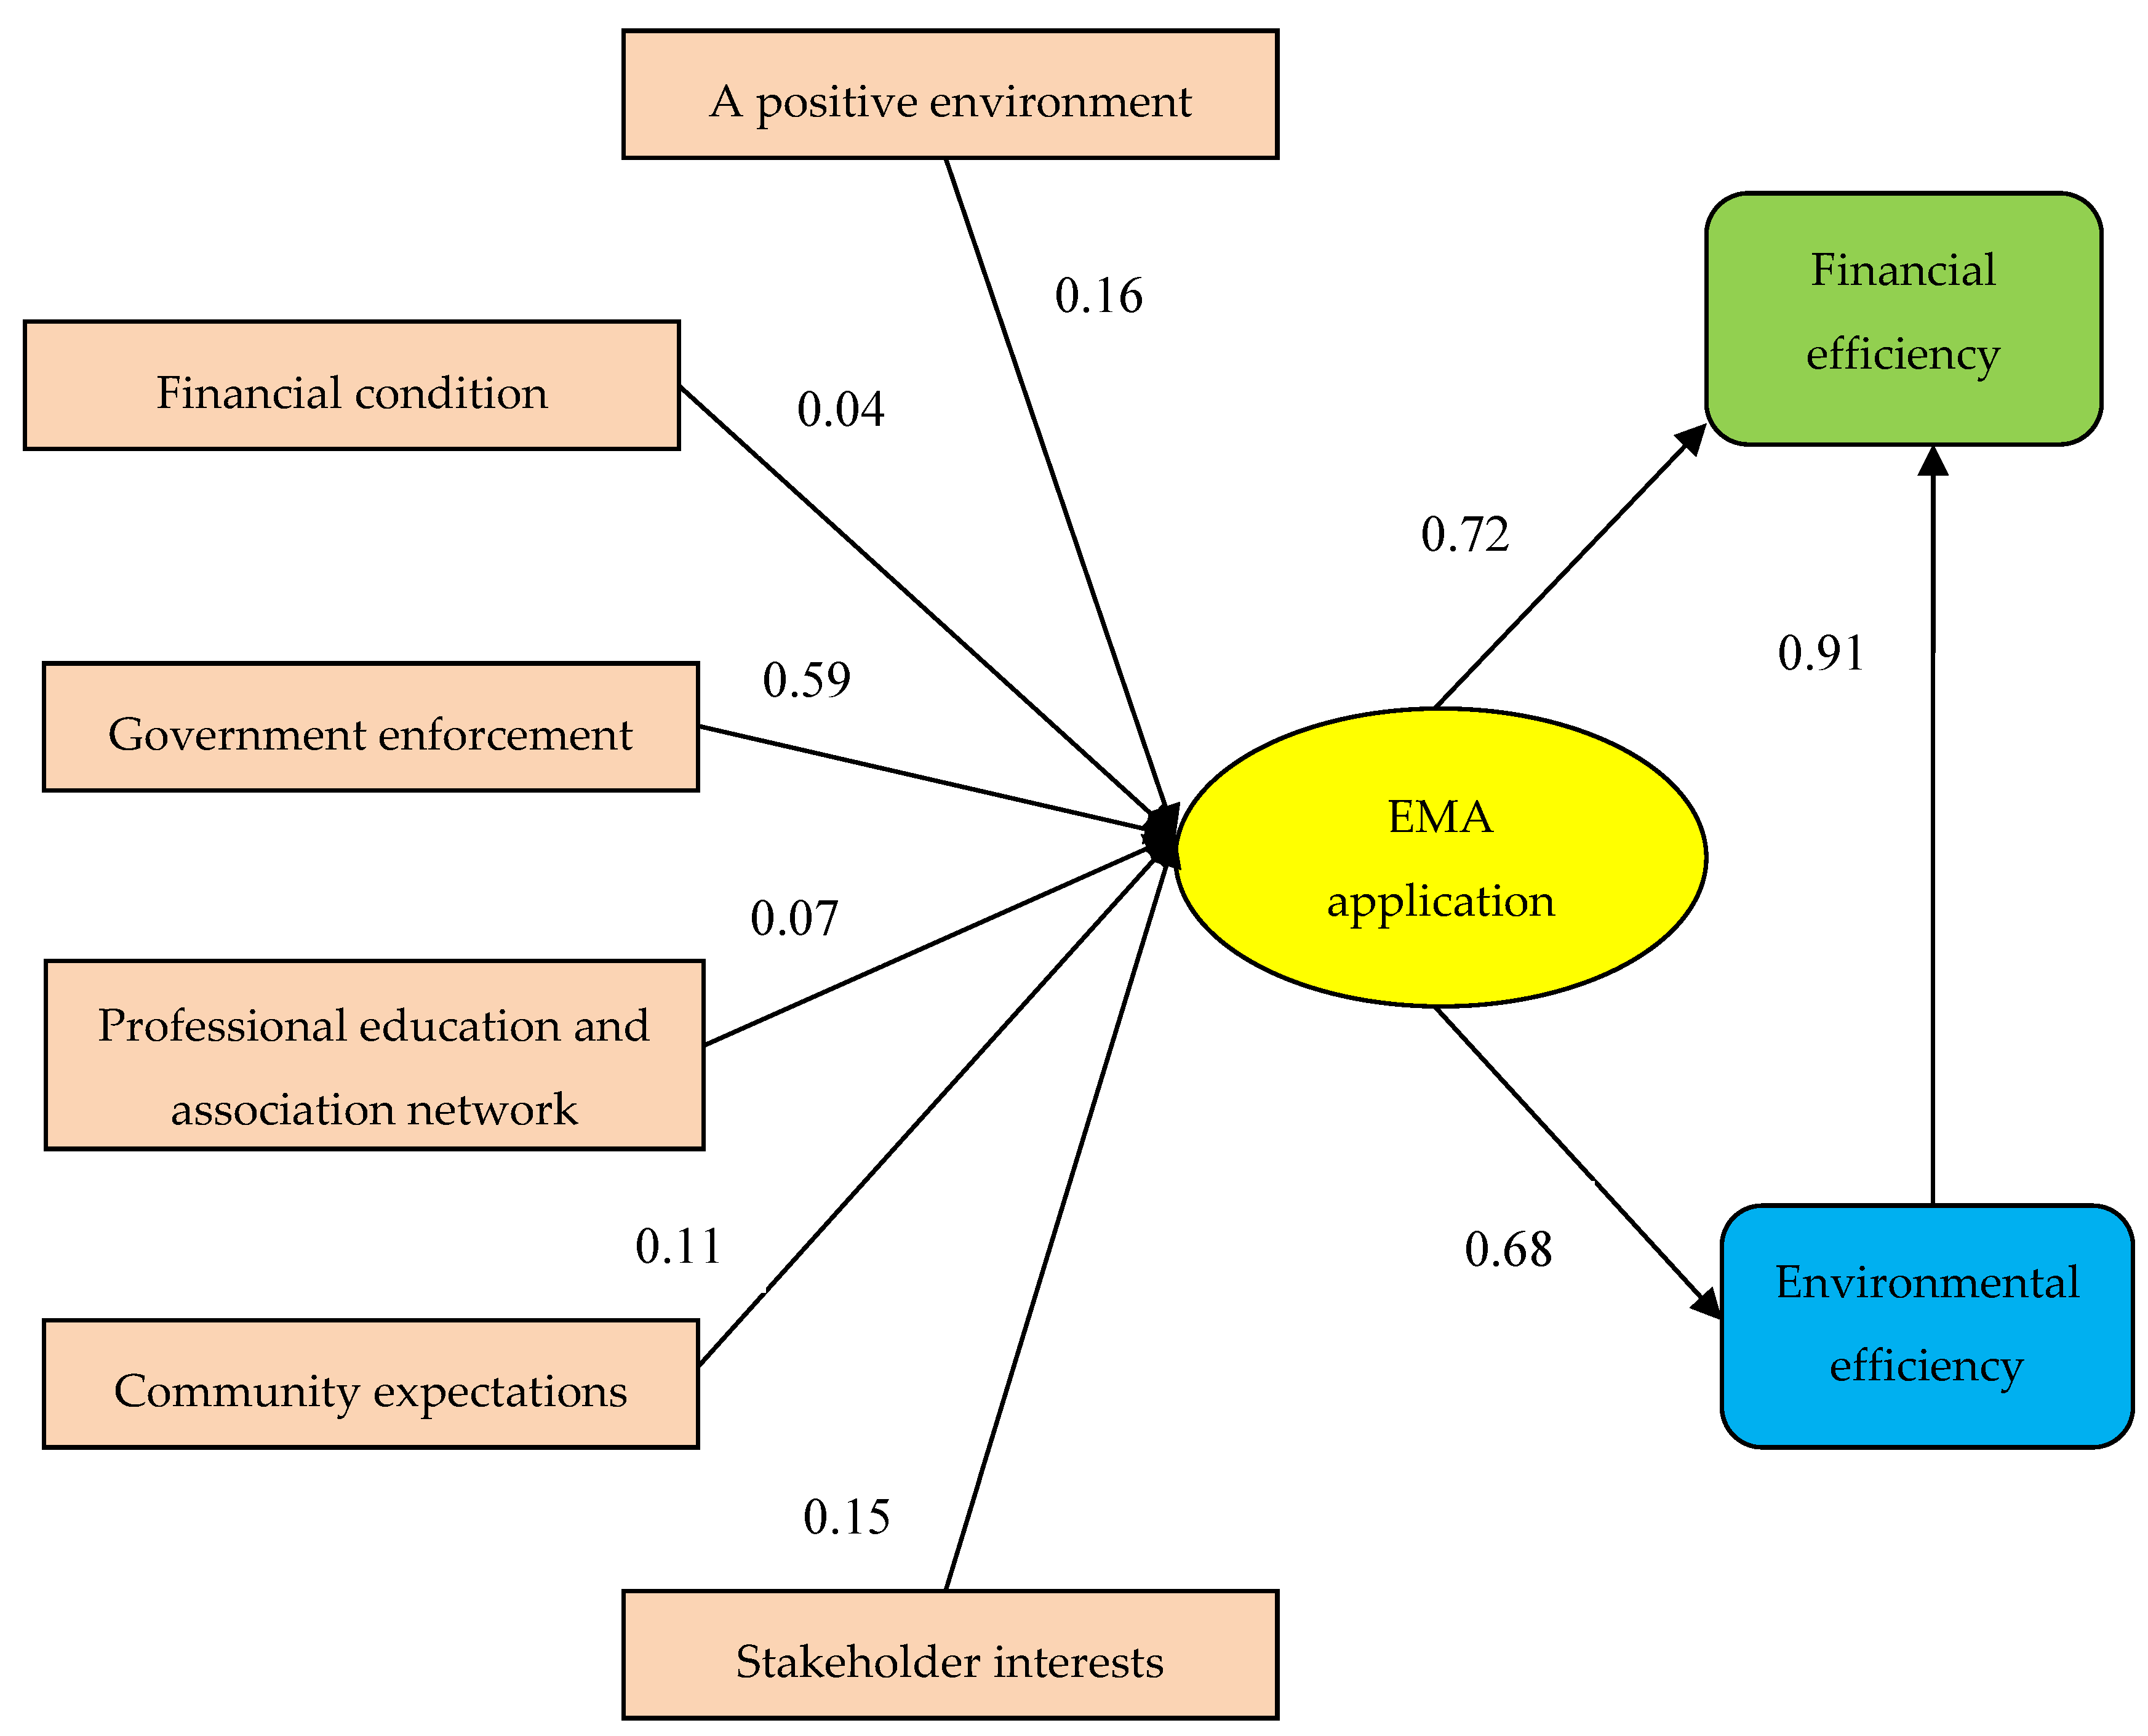
4.3. The Relationship between EMA Application and Performance Efficiency

First, the study examines the reliability about all scales about economic and environment efficiency. The results in Appendix B show that the Cronbach’s alpha if item deleted coefficients were greater than 0.8 (from 0.845 to 0.901) and the corrected item-total correlation coefficients of each variable were greater than 0.7 (from 0.787 to 0.861). Thus, these scales ensure high reliability.
According to Table 8, the correlation coefficients between EMA application, financial efficiency, and environmental efficiency were high (with a Pearson correlation greater than 0.6). As a result, these variables had positive and closely correlated relationships. The values of Sig. around 0.000 demonstrate that there are correlations between the application of EMA and financial and environmental efficiency.
Moreover, after conducting a regression analysis for the three hypotheses H10, H11, and H12, the results in Table 9 indicate that the adjusted R2 was 0.518, 0.474, and 0.838, respectively. The changes in independent variables explain 51.8%, 47.4%, and 83.8% of the changes in dependent variables, respectively. In models 1 and 2, the D values of the Durbin−Watson test were less than 1; hence, there was a positive correlation between the remainder, while the D value in model 3 was 1.476 [1;3] which shows no similarity with the remainder. On the other hand, in Table 9, Sig. values of the ANOVA test of the three models were 0.000 (less than 5%), showing that R2 was different from zero and the models were very significant, which supports H10, H11, and H12.
Table 9 also shows the values ​​of the coefficients in the three regression models. Specifically, in the first model, EMA application had a standardized beta coefficient of 0.720, reflecting that when EMA application increases by one unit, performance efficiency increases by 0.720 units. When the Sig. value is 0.000 (<0.05), the regression model is significant. Further, the results with a 95% confidence interval in column B show that, with 95% confidence, when the adoption of EMA increases by one unit, the performance efficiency will increase from 1.129 to 1.360 units. The results in the next two models are explained similarly. The positive impact of EMA application on environmental efficiency was 0.689, while the positive effect of environmental efficiency on economic efficiency was 0.916.
Figure 3 shows the influence level of six factors on EMA application, as well as the impact of EMA application on outcomes in the Vietnamese construction material manufacturing industry.

5. Discussion

EMA plays a very important role in sustainable development. Therefore, studying EMA in the construction material industry in Vietnam, which has significant negative impacts on the environment, is an urgent requirement. This study has solved the following research objectives: finding factors that influence the application of EMA; determining the relationship between the application of EMA and enterprises’ performance, including financial and environmental aspects; and identifying the effects of environmental outcomes on financial outcomes. The research results indicate that six factors have positive relationships with EMA application, including government enforcement, stakeholder interests, a positive environmental strategy, community expectations, professional education and association network, and the financial condition, which confirms hypotheses H1, H3, H4, H5, H8, and H9. Government enforcement is the most influential factor and the same results were shown in many studies [6,13,14,15,37]. According to Jamil et al. [15], the government has the highest influence, as it forces organizations to comply with its regulations. On the other hand, the significantly positive impacts of stakeholder interests and community expectations on the adoption of EMA are in line with other studies [22,72]. Godschalk [72] argued that organizations must publish their activities to ensure that society continues monitoring them. An organization can enhance its legitimacy if it addresses and reports environmental issues that affect the interests of its stakeholders. The relationship with stakeholders, including the community, investors, banks, and customers, can be enhanced by improving environmental performance. Once EMA practices are applied, many benefits can be achieved, such as using effective materials, reducing environmental pollution, pricing products correctly, enhancing one’s image with stakeholders, and improving the competitive advantage. Khalid et al. [22] found that the application of EMA is influenced by customers, who are the strongest stakeholder because they are significantly interested in the environmental permits, strict environmental controls, and safe production processes of an organization’s activities.
There is a positive relationship between positive environmental strategies and the adoption of EMA practices; this relationship is favored by [17]. They proposed that positive environmental strategies for waste management would lead to the collection and use of environmental accounting information to meet established strategic goals. An environmental strategy, which is an uncertain element, helps enterprises to identify and improve environmental accounting systems to maintain effective waste management. Moreover, the findings of this research also indicate that professional education and association networks positively affect the application of EMA. Qian and Burritt [16] affirmed that a relationship based on communication and professional development is the first and most important step for the development of EMA. Without the necessary knowledge of employees, the potential of EMA practices will not be recognized. Setthasakko [20] discovered that one of the barriers to the promotion of EMA practices is the limited skill and knowledge of environmental issues in accounting department. Therefore, to integrate environmental activities into current accounting systems, businesses need to establish learning mechanisms by training accountants, setting up functional teams, and rethinking goals of sustainable development in their closed connection with accounting associations and industry associations. The financial condition has a positive relationship with EMA application and has also been supported by [13]. According to [53], limited financial conditions create difficulties in collecting and allocating environmental information. The remaining factors, such as environmental uncertainty and mimicking pressure do not affect EMA application. The results are the same as those from the studies by [24,42,53] but in conflict with the studies of [13,16]. Jalaludin et al. [14] and Jamil et al. [15] showed that mimicking pressure did not contribute significantly to the application of EMA, while Chang [13] suggested that a high level of environmental uncertainty would be required to create pressure leading to responses by universities to establish systems that can minimize environmental impacts and account for environmental information. According to Qian and Burritt [16], the more noticeable the application of accounting and environmental management rules by the focal companies in a particular sector, the greater the ability to engage in similar practices and rules. In addition, change in the environment is also a variable that positively affects the adoption of EMA through a gradual and long-term process. Qian and Burritt [17] showed that environmental uncertainty, such as changes in the recycling market and the reduction of landfill space, provide incentives for waste managers to integrate environmental accounting information into their planning and decision making.
Moreover, there is also a positive relationship between the application of EMA and performance efficiency, consisting of financial and environmental sectors. This finding fills the gap of previous literature, as there are very few studies on the statistical relationship between EMA practices and firm performance (both financial and environmental). On the other hand, the results show that environmental efficiency significantly and positively impacts financial efficiency in the Vietnamese construction material industry. As a result, through the application of EMA, construction material enterprises that focus on environmentally efficient solutions also increase their financial efficiency appreciably. For instance, if a company violates an environmental regulation or causes an environmental accident, the company not only has to pay fines and penalties, but also may suffer from a loss of reputation and image. In contrast, a company that actively addresses environmental issues might gain a positive reputation among stakeholders and succeed in reducing production costs in the long term. The argument is in the line with previous studies [23,24,25,26].

6. Conclusions

The findings from the research results are motivators that will help the Vietnamese construction material production industry promote the application of EMA to achieve sustainable development through suggestions, such as increasing government enforcement, improving professional education and the association network with regards to EMA practices for managers and staff, establishing a positive environmental strategy, and achieving a positive financial condition as well as increasing the community’s expectations and stakeholder’s interests as follows:
First, government coercion plays a large role in supporting the director of the board, environmental managers, and chief accountants in overcoming barriers related to values ​​and professional practices. Although the Vietnamese government has made great efforts in enacting regulations on environmental management to cope with increasing environmental pollution and the scarcity of resources, the government has not enacted policies to improve accountability related to environmental information. As a result, little attention has been paid to EMA practices in this country. This lack of information can reduce the motivation for collecting, identifying, and evaluating environmental information related to decisions of waste management and pollution prevention. In an effort to promote EMA practices, the government needs to develop specific standards, guidelines, and regulations on EMA that help businesses adjust or change their current accounting system to address environmental issues.
Second, Vietnamese construction material enterprises are strongly affected by traditional accounting rules and regulations. Because of limited knowledge and skills in environmental accounting, they are not knowledgeable enough to realize that measuring and assessing environmental information is an essential part of their activities. As a result, environmental issues are not integrated into current accounting practices, and managers do not have the opportunities to use environmental information for appropriate decision making. Therefore, in order to encourage EMA practices, enterprises provide learning mechanisms, including improving their knowledge and skills in managing environmental activities and determining how to identify and measure related environmental information. This mechanism will not only help the environmental information to become clearer in the accounting system but also enhance the position and role of the accounting department. Additionally, this mechanism could be better promoted through professional associations. The network of professional associations on EMA allows all participants to receive the EMA framework and realize the usefulness of EMA practices. Members, such as managers or business consultants, exchange expertise, gain experience, and seek opportunities for sustainable development, including environmental performance management. It is concluded that the greater the EMA association network is, the greater the opportunity for members to improve their knowledge of EMA and the higher the effort to integrate aspects of EMA into the businesses.
Third, a positive environmental strategy can enable managers to deeply consider what should be done to minimize the environmental impact and increase financial benefits, such as complying with environmental regulations, establishing voluntary environmental initiatives, and promoting environmental programs aimed at prioritizing cleaner production. A proactive environmental strategy can also help businesses to become more active in the application of ECMA practices. Because of these strategic goals, environmental information (consisting of environmental costs and environmental benefits) is available. This information can motivate businesses to develop solutions for effective environmental management and ensure sustainable operations.
Fourth, building and developing the EMA system requires a great deal of money. It seems that EMA practices should be applied to large-scale enterprises that have better financial conditions. Perhaps, in the short term, enterprises spend more of their budget on implementing EMA practices, which will then be offset by the potential benefits of EMA, and in the long term, they will receive positive impacts because of their improved reputation.
Finally, the findings show that the community and stakeholders, such as investors and customers, have a positive influence on the adoption of EMA. Community can have a powerful impact on enterprises that have negative impacts on the environment, which will reduce the image and reputation of enterprises. Investors may withdraw capital when enterprises’ operations do not meet their expectations on environmental issues. Customers are increasingly inclined to consume green products and place their trust in environmentally responsible businesses. However, in the Vietnamese construction material industry, the EMA application level is low due to the absence of pressure from the community, investors, and customers. These enterprises are less likely to integrate environmental information into their existing accounting systems for the purpose of environmental control and management in order to legalize their internal operations and increase their image and reputation in the eyes of stakeholders. Therefore, once stakeholders are more aware of the environmental impacts, have increased concerns about environmental improvement, and expect improved environmental activities, enterprises will have to develop initiatives to minimize environmental impacts through the identification, measurement, and provision of environmental information. As a result, businesses will attract customers and investors and increase their competitive advantage.
On the other hand, our finding is that the application of EMA practices that improve environmental performance goes hand in hand with enhancing the profitability of enterprises promoted by the enterprises, government, community, and stakeholders. The enterprises should maximize their financial performance and, at the same time, disclose their environmental report and fulfill their social responsibilities under a certain level of EMA application. We believe our results are an important first step in understanding why enterprises invest in the adoption of EMA.
In addition, the significantly positive relationship between environmental efficiency and financial efficiency shows that innovative solutions for the reduction of environmental pollution can promote enterprises’ profitability. In general, efforts in minimizing negative environmental impacts by an enterprise will appreciably increase its profitability. Our finding that better environmental performance and better financial profitability go hand in hand is also consistent with the view that financial performance and environmental performance are both related to the quality of management. Excellent managers interested in their firm’s long-term targets, accept their firm’s social responsibility, and adopt proactive strategies to control environmental pollution. It is suggested that managers should change their outlook of their firm’s environmental performance, from complying with government-mandated environmental regulations to focusing on opportunities for cleaner production. This study’s results show that good environmental efficiency is associated with good financial outcome, which is good news for those questioning the correlation between environmental sustainability and production efficiency.

7. Further Research

Further research will focus on dealing with questions, such as the following: Are the factors affecting the application of EMA in the construction material industry similar to those of other industries in Vietnam? How can Vietnamese organizations integrate the EMA system into other environmental management tools, such as cleaner production, environmental management systems, risk management, and environmental audit for sustainable development? Moreover, further research should investigate the adoption of EMA practices in green supply chain management in the construction material industry.

Author Contributions

Conceptualization, T.T.L., T.M.A.N., and T.T.H.P.; Data curation, T.T.L. and T.M.A.N.; Formal analysis, T.T.L., and T.M.A.N.; Investigation, T.T.L., T.M.A.N., and T.T.H.P.; Methodology, T.T.L., and T.T.H.P.; Project administration, T.T.L.; Resources, T.T.L.; Software, T.T.L.; Supervision, T.T.L.; Writing—original draft, T.T.L.; Writing – review & editing, T.T.L.

Funding

This research received no external funding.

Acknowledgments

The authors would like to thank the anonymous reviewers and editors for their thoughtful comments and suggestions.

Conflicts of Interest

The authors declare no conflict of interest.

Appendix A

Table A1. Scales of the influential factors for EMA application, financial efficiency, and environmental efficiency.
ItemDescriptionSources
Positive environmental Strategy (PES)
PES1Make plans to develop effective environmental management[19,29]
PES2Establish strategies for sustainable development
PES3Attain the goal of environmental impact reduction
PES4Achieve leadership in sustainable environmental management
Environmental Uncertainty (ENU)
ENU1Change environmental regulations[34,53]
ENU2The scarcity of resources
ENU3Change green competition
ENU4Change environmental technology
ENU5Changes in the stakeholders’ behavior toward the environment
Financial Condition (FIC)
FIC1Enterprise with high financial efficiency has good environmental management[53]
FIC2Enterprise spends much money on environmental management activities
FIC3Enterprise easily accesses capital for environmental management activities
Government Enforcement (GOE)
GOE1Regulations on waste management and efficient use of materials[16,42,79]
GOE2Tighten environmental licensing
GOE3Require government environmental reporting
GOE4Regulations on environmental fines
GOE5Environmental standards for products and processes
Professional education and development (EDD)
EDD1The managers are trained about environmental management[24,29,42]
EDD2Staff are trained about environmental management
EDD3Departments in enterprise exchange environmental information together
EDD4Using large funds to train and develop environmental management
Mimic Pressure (MIP)
MIP1Enterprises in the same industry have good environmental management activities[16,19,24,42,79]
MIP2Competitors have good environmental management activities
MIP3Enterprises in other industries have good environmental management activities
Profession association network (PANE)
PAN1As leader of associationsAuthors
PAN2Bring many contributions to associations
PAN3Interacts well with members of associations
Community’s expectations (COEX)
COE1Community is interested in improving the organization’s environment[16,19,79]
COE2Community expects to improve waste management
COE3Community cares about budget for environmental management activities
COE4Community attends to environmental report from the enterprise
COE5Increase community’s awareness of environmental impacts
Stakeholder’s interests (STI)
STI1Customers[24,42,66,80]
STI2Investors and banks
STI3Environmental organizations
STI4Other stakeholders
Environmental Management Accounting Application (EMAA)
EMA1Using monetary information[15,17,19,24,42,48,56,71,81,82,83]
EMA2Using physical information
EMA3Trace environmental information by detailed accounts
EMA4Determine environmental costs by modern method
EMA5Estimating environmental costs
EMA6Estimating environmental cost report
EMA7Developing environmental performance indicators
EMA8Use software to track environmental information
EMA9Integrate environmental information into short-term decisions
EMA10Integrating environmental information into long-term decisions
Financial Efficiency
FIE1ROA[3,12,26,57,62,69,84]
FIE2ROS
FIE3ROE
Environmental Efficiency
ENE1Reduce amount of waste generated[3,12,26,44,62,84,85]
ENE2Environmentally friendly products
ENE3Improve enterprise’s image and reputation

Appendix B

Table A2. Testing of Reliability and Descriptive Statistics.
ItemsCronbach’s AlphaCorrected Item-Total CorrelationCronbach’s Alpha if Item DeletedMeanStd. DeviationSkewness
Positive environmental strategy (PES)
PES10.9030.8250.8603.380.943−0.210
PES20.7700.8803.520.8630.019
PES30.8020.8693.440.930−0.204
PES40.7400.8903.670.854−0.384
Environmental Uncertainty (ENU)
ENU10.9230.8500.8963.381.047−0.273
ENU20.6770.9133.590.863−0.549
ENU30.8460.8973.461.059−0.307
ENU40.8360.8983.491.032−0.270
ENU50.8000.9063.740.947−0.253
Financial Condition (FIC)
FIC10.8550.6700.8413.450.716−0.490
FIC20.6730.7533.270.928−0.568
FIC30.6710.7573.320.933−0.501
Government enforcement (GOE)
GOE10.8900.7010.8753.780.7060.505
GOE20.7670.8583.290.8770.254
GOE30.7250.8693.210.9230.360
GOE40.7500.8633.250.9290.340
GOE50.7420.8653.940.7820.506
Professional education and development (EDD)
EDD10.8310.5110.8253.450.783−0.134
EDD20.6690.7302.890.983−0.113
EDD30.7130.7403.170.924−0.339
EDD40.6460.7263.191.005−0.268
Mimicking pressure (MIPR)
MIP10.8010.6240.7813.820.717−0.502
MIP20.6200.7583.640.765−0.322
MIP30.6290.7473.790.746−0.203
Professional association network (PAN)
PAN10.8970.8270.8343.020.874−0.249
PAN20.8110.8483.190.8670.014
PAN30.7900.8832.841.1090.014
Community’s expectations (COE)
COE10.8470.6230.8274.030.722−0.050
COE20.7640.7894.000.598−0.001
COE30.7400.7793.960.6390.035
COE40.5510.8423.740.6340.272
COE50.5750.8373.980.6660.019
Stakeholder’s interests (STI)
STI10.8680.6000.7583.800.799−0.200
STI20.5570.8553.620.802−0.060
STI30.6730.8103.480.901−0.440
STI40.7220.7893.460.927−0.322
Environmental Management Accounting Application (EMA)
EMA10.9190.7270.9092.560.935−0.049
EMA20.6200.9152.060.8340.331
EMA30.6200.9151.860.7810.586
EMA40.3830.9061.640.6490.563
EMA50.8320.9032.220.8860.309
EMA60.7170.9112.080.8870.478
EMA70.7270.9102.070.7520.195
EMA80.8320.9032.230.9020.388
EMA90.6950.9082.310.8900.164
EMA100.7830.9062.150.9490.427
Financial Efficiency (FIE)
FIE10.9310.8610.8973.011.2170.149
FIE20.8550.9013.131.2030.032
FIE30.8570.9003.151.1610.068
Environmental Efficiency (ENE)0
ENE10.9110.8430.8563.371.0450.175
ENE20.8170.8453.490.982−0.044
ENE30.7870.8893.041.259−0.052

Appendix C

Table A3. Exploratory Factor Analysis.
Component
12345678
PAN10.898
EDD30.883
PAN30.876
EDD20.847
PAN20.843
EDD10.819
EDD4
ENU5 0.844
ENU3 0.821
ENU1 0.816
ENU4 0.807
ENU2 0.795
GOP5 0.752
GOP3 0.726
GOP4 0.724
GOP2 0.699
GOP1 0.666
PES1 0.793
PES4 0.776
PES2 0.755
PES3 0.747
COE2 0.864
COE3 0.845
COE4 0.626
COE5 0.605
COE1
FIC2 0.887
FIC3 0.867
FIC1 0.747
STI3 0.777
STI4 0.753
STI1 0.626
STI2 0.515
MIP3 0.756
MIP1 0.698
MIP2 0.691

Appendix D

Table A4. Correlation between influent factors and EMA application.
Correlations
EMAPESENUFICGOEPEAMIPCOESTI
EMAPearson Correlation10.642 **0.494 **0.367 **0.871 **0.465 **0.495 **0.614 **0.623 **
Sig. (2-tailed) 0.0000.0000.0000.0000.0000.0000.0000.000
PESPearson Correlation 10.481 **0.448 **0.565 **0.247 **0.476 **0.422 **0.338 **
Sig. (2-tailed) 0.0000.0000.0000.0000.0000.0000.000
ENUPearson Correlation 10.180 **0.523 **0.191 **0.426 **0.421 **0.376 **
Sig. (2-tailed) 0.0000.0000.0000.0000.0000.000
FICPearson Correlation 10.304 **0.0660.400 **0.220 **0.227 **
Sig. (2-tailed) 0.0000.0000.0000.0000.000
GOEPearson Correlation 10.381 **0.465 **0.550 **0.513 **
Sig. (2-tailed) 0.0000.0000.0000.000
PEAPearson Correlation 10.244 **0.257 **0.583 **
Sig. (2-tailed) 0.0000.0000.000
MIPPearson Correlation 10.489 **0.423 **
Sig. (2-tailed) 0.0000.000
COEPearson Correlation 10.482 **
Sig. (2-tailed) 0.000
STIPearson Correlation 1
Sig. (2-tailed)
** Correlation is significant at the 0.01 level (2-tailed).

References

  1. Bennett, M.; Bouma, J.; Wolter, T. Environmental Management Accounting: Informational and Institutional Developments; Eco-Efficiency in Industry and Science 3; Springer: Dordrecht, The Netherlands, 2002. [Google Scholar] [CrossRef]
  2. Schaltegger, S.; Burritt, R. Contemporary Environmental Accounting: Issues, Concepts and Practice; Greenleaf: Austin, TX, USA, 2000. [Google Scholar] [CrossRef]
  3. IFAC. International Guidance Document: Environmental Management Accounting; International Federation of Accountants: New York, NY, USA, 2005. [Google Scholar]
  4. Epstein, M. Measuring Corporate Environmental Performance: Best Practices for Costing and Managing an Effective Environmental Strategy; Irwin Professional Publishing: Chicago, IL, USA, 1996. [Google Scholar] [CrossRef]
  5. Rikhardsson, P.; Bennett, M.; Bouma, J.; Schaltegger, S. Implementing Environmental Management Accounting: Status and Challenges; Springer: Dordrecht, The Netherlands, 2005; Volume 18. [Google Scholar] [CrossRef]
  6. Schaltegger, S.; Bennett, M.; Burritt, R.; Jasch, C. Environmental Management Accounting for Cleaner Production; Springer: Dordrecht, The Netherlands, 2008. [Google Scholar]
  7. UNDSD. Environmental Management Accounting: Procedures and Principles; United Nations Division for Sustainable Development: New York, NY, USA, 2001. [Google Scholar]
  8. USEPA. Improving Government Role in the Promotion of Environmental Managerial Accounting; United State Environmental Protection Agency: Washington, DC, USA, 2000.
  9. Ahmad, A. Environmental accounting & reporting practices: Significance and issues: A case from Bangladesh companies. Glob. J. Manag. Bus. Res. 2012, 12, 119–127. [Google Scholar]
  10. Bennett, M.; Jame, P. The Green Bottom Line: Environmental Accounting for Management: Current Practice and Future Trends; Greenleaf Publishing Limited: Austin, TX, USA, 2000. [Google Scholar] [CrossRef]
  11. Herzig, C. Environmental Management Accounting: Case Studies of South East Companies. Account. Forum 2012, 36, 310–312. [Google Scholar] [CrossRef]
  12. Le, T.T.; Nguyen, H. Factors affecting to ECMA application in Vietnamese brick manufacturing enterprises. Res. J. Financ. Account. 2018, 9, 136–145. [Google Scholar]
  13. Chang, H.H. Environmental Management Accounting Within Universities: Current State and Future Potential. Ph.D. Thesis, RMIT University, Melbourne, V, Australia, November 2007. [Google Scholar]
  14. Jalaludin, D.; Sulaiman, M.; Ahmad, N.N.N. Understanding Environmental Management Accounting (EMA) Adoption: A New Institutional Sociology Perspective. Soc. Responsib. J. 2011, 7, 540–557. [Google Scholar] [CrossRef]
  15. Jamil, C.Z.M.; Mohamed, R.; Muhammad, F.; Ali, A. Environmental Management Accounting Practices in Small Medium Manufacturing Firms. Procedia Soc. Behav. Sci. 2015, 172, 619–626. [Google Scholar] [CrossRef] [Green Version]
  16. Qian, W.; Burritt, R. The development of environmental management accounting: An institutional view. In Environmental Management Accounting for Cleaner Production; Schaltegger, S., Bennett, M., Burritt, R., Jasch, C., Eds.; Springer: Dordrecht, The Netherlands, 2008; Volume 24, pp. 233–247. [Google Scholar]
  17. Qian, W.; Burritt, R. Contingency perspectives on environmental accounting: An exploratory study of local government. Account. Account. Perform. J. 2009, 15, 39–70. [Google Scholar]
  18. Kokubu, K.; Nashioka, E. Environmental Management Accounting Practices in Japan. In Implementing Environmental Management Accounting: Status and Challenges; Rikhardsson, P., Bennett, M., Bouma, J., Schaltegger, S., Eds.; Springer: Dordrecht, The Netherlands, 2005; Volume 18, pp. 321–341. [Google Scholar] [CrossRef]
  19. Kumpulainen, A. Environmental Business Accounting in Four Finnish Case Companies: Follow up Study between 1996 and 2005. Master’s Thesis, Helsinki University of Technology, Espoo, Finland, 2005. [Google Scholar]
  20. Setthasakko, W. Barriers to the development of environmental management accounting: An exploratory study of pulp and paper companies in Thailand. EuroMed J. Bus. 2010, 5, 315–331. [Google Scholar] [CrossRef]
  21. Bansal, P.; Roth, K. Why Companies Go Green: A Model of Ecological Responsiveness. Acad. Manag. J. 2000, 43, 717–736. [Google Scholar] [CrossRef]
  22. Khalid, F.M.; Lord, B.R.; Dixon, D.K. Environmental Management Accounting Implementation in Environmentally Sensitive Industries in Malaysia. In Proceedings of the 6th NZ Management Accounting Conference, Palmerston North, New Zealand, 22–23 November 2012. [Google Scholar]
  23. Earnhart, D.; Lizal, L. The Effect of Corporate Environmental Performance on Financial Outcomes—Profits, Revenues and Costs: Evidence from the Czech Transition Economy; DRUID: Frederiksberg, Denmark, 2010; Volume 46, pp. 1–44. [Google Scholar]
  24. Iwata, H.; Okada, K. How does environmental performance affect FINANCIAL performance? Evidence from Japanese manufacturing firms. Ecol. Econ. 2011, 70, 1691–1700. [Google Scholar] [CrossRef]
  25. Ong, T.; Teh, B.; Ang, Y. The impact of Environmental Improvements on the Financial Performance of Leading Companies Listed in Bursa Malaysia. Int. J. Tradeecon. Financ. 2014, 5, 386–391. [Google Scholar] [CrossRef]
  26. Al-Tuwaijri, S.; Christensen, T.; Hughes, K. The relations among environmental disclosure, environmental performance, and economic performance: A simultaneous equations approach. Account.Org. Soc. 2014, 29, 447–471. [Google Scholar] [CrossRef]
  27. Konar, S.; Cohen, M.A. Does the market value environmental performance? Rev. Econ. Stat. 2001, 83, 281–289. [Google Scholar] [CrossRef]
  28. Filbeck, G.; Gorman, R. The relationship between the environmental and financial performance of public utilities. Environ. Res. Econ. 2004, 29, 137–154. [Google Scholar] [CrossRef]
  29. Qian, W. Revisiting the link between environmental performance and financial performance: Who cares about private companies? In Proceedings of the 11th ACSEAR Conference, Wollongong, Australia, 2–4 December 2012. [Google Scholar]
  30. Rassier, D.G.; Earnhart, D. Does the Porter hypothesis explain expected future financial performance? the effect of clean water regulation on chemical manufacturing firms. Environ. Resour. Econ. 2010, 45, 353–377. [Google Scholar] [CrossRef]
  31. Sarkis, J.; Cordeiro, J.J. An empirical evaluation of environmental efficiencies and firm performance: Pollution prevention versus end-of-pipe practice. Eur. J. Oper. Res. 2001, 135, 102–113. [Google Scholar] [CrossRef]
  32. Wagner, M.; Nguyen, V.P.; Azomahou, T.; Wehrmeyer, W. The relationship between the environmental and economic performance of firms: An empirical analysis of the European paper industry. Corp. Soc. Responsib. Environ. Manag. 2002, 9, 133–146. [Google Scholar] [CrossRef]
  33. Vietnam Institute for Building Materials. Overview of Construction Materials Industry in Vietnam; Vietnam Institute for Building Materials: Hanoi, Vietnam, 2018. [Google Scholar]
  34. Le, T.T.; Nguyen, T.M.A. Practice environmental cost management accounting: The case of Vietnamese brick production companies. Manag. Sci. Lett. 2018, 9, 105–120. [Google Scholar] [CrossRef]
  35. Niap, D.T.F. Environmental Management Accounting for an Australian Cogeneration Company. Master’s Thesis, RMIT University, Melbourne, Australia, 2006. [Google Scholar]
  36. Betianu, L.; Briciu, S. The impact of the economic crisis on environmental costs. Analele Stiintifice ale Universitatii. Alexandru Ioan Cuza” din Iasi-Stiinte Economice 2010, 2010SE, 3–14. [Google Scholar]
  37. Le, T.T. Applying environmental cost management accounting in brick production companies–Evidence from Vietnam. Res. J. Financ. Account. 2018, 9, 17–26. [Google Scholar]
  38. Deegan, C. Environmental Management Accounting: An Introduction and Case Studies for Australia; Institute of Chartered Accountants in Australia: Melbourne, Australia, 2003. [Google Scholar]
  39. Bennett, M.; Rikhardsson, P.; Schaltegger, S. Eco-efficiency in industry and science 12. In Environmental Management Accounting: Purpose and Progress; Springer: Berlin, Germany, 2003. [Google Scholar] [CrossRef]
  40. Bartolomeo, M.; Bennett, M.D.; Bouma, J.J.; Heydkamp, P.; James, P.; de Walle, F.B.; Wolters, T.J. Eco-Efficiency in Industry and Science 3. In Eco—Management Accounting; Springer: Amsterdam, The Netherlands, 1999. [Google Scholar] [CrossRef]
  41. Fernando, S.; Lawrence, S. A theoretical framework for CSR practices: Integrating legitimacy theory, stakeholder theory and institutional theory. J. Theor. Account. Res. 2014, 10, 149–179. [Google Scholar]
  42. Islam, J.; Hu, H. A review of literature on contingency theory in managerial accounting. Afr. J. Bus. Manag. 2012, 6, 5159–5161. [Google Scholar] [CrossRef]
  43. Covaleski, M.; Dirsmith, M.; Samuel, S. Managerial accounting research: The contributions of organizational and sociological theory. J. Manag. Account. Res. 1996, 8, 1–35. [Google Scholar]
  44. Muslichah, M. The Effect of Contingency Variables on Management Accounting System Characteristics and Managerial Performance. Int. J. Account. Bus. Soc. 2004, 12, 47–70. [Google Scholar]
  45. Bouma, J.J.; Van der Veen, M. Wanted: A Theory for Environmental Management Accounting. In Environmental Management Accounting: Informational and Institutional Development; Bennett, M., Bouma, J., Wolter, T., Eds.; Springer: Dordrecht, The Netherlands, 2002; Volume 9, pp. 279–290. [Google Scholar]
  46. Gordon, L.A.; Narayanan, V.K. Management Accounting Systems, Perceived Environmental Uncertainty and Organizational Structure: An Empirical Investigation. Account. Org. Soc. 1984, 9, 33–47. [Google Scholar] [CrossRef]
  47. Sharma, S. Managerial interpretations and organizational context and predictors of corporate choice of environmental strategy. Acad. Manag. J. 2000, 43, 681–697. [Google Scholar] [CrossRef]
  48. Guo, X. Failure of an Environmental Strategy: Lessons from an Explosion at Petrochina and Subsequent Water Pollution. In Environmental Management Accounting for Cleaner Production; Schaltegger, S., Bennett, M., Burritt, R., Jasch, C., Eds.; Springer: Dordrecht, The Netherlands, 2008; Volume 24, pp. 423–441. [Google Scholar] [CrossRef]
  49. Lewis, G.J.; Harvey, B. Perceived Environmental Uncertainty: The Extension of Miller’s Scale to the Natural Environment. J. Manag. Stud. 2001, 38, 201–233. [Google Scholar] [CrossRef]
  50. Hussain, M.M.; Gunasekaran, A. An Institutional Perspective of Non-Financial Management Accounting Measures: A Review of the Financial Service Industry. Manag. Audit. J. 2002, 17, 518–536. [Google Scholar] [CrossRef]
  51. Osborn, D. Process and Content: Visualizing the Policy Challenges of Environmental Management Accounting in PM. In Implementing Environmental Management Accounting: Status and Challenges; Rikhardsson, P.M., Bennett, M., Bouma, J.J., Schaltegger, S., Eds.; Springer: Dordrecht, The Netherlands, 2005; Volume 18, pp. 81–104. [Google Scholar] [CrossRef]
  52. DiMaggio, P.J.; Powell, W.W. The iron cage revisited: Institutional isomorphism and collective efficient in organizational fields. Am. Sociol. Rev. 1983, 48, 147–160. [Google Scholar] [CrossRef]
  53. Burritt, R. Environmental Management Accounting: Roadblocks on the Way to the Green and Pleasant Land. Bus. Strat. Environ. 2004, 13, 13–32. [Google Scholar] [CrossRef]
  54. Delmas, M.; Toffel, M. Stakeholders and environmental management practices: An institutional framework. Bus. Strat. Environ. 2004, 13, 209–222. [Google Scholar] [CrossRef]
  55. Granlund, M.; Lukka, K. It’s a Small World of Management Accounting Practices. J. Manag. Account. Res. 1998, 10, 153–179. [Google Scholar]
  56. Hoffman, A. Linking Organizational and FieldLevel Analyses. Org. Environ. J. 2001, 14, 133–156. [Google Scholar] [CrossRef]
  57. Scott, W.R.; Meyer, J.W. Institutional Environments and Organizations: Structural Complexity and Individualism; SAGE Publications: Thousand Oaks, CA, USA, 1994. [Google Scholar]
  58. Jennings, P.; Zandbergen, P. Ecologically Sustainable Organizations: An Institutional Approach. Acad. Manag. Rev. 1995, 20, 1015–1052. [Google Scholar] [CrossRef]
  59. Wong, L.T.; Fryxell, G.E. Stakeholder influences on environmental management practices: A study of fleet operations in Hong Kong (SAR), China. Transp. J. 2004, 43, 22–35. [Google Scholar]
  60. Parker, L.D. Green Strategy Costing: Early Days. Australian Account. Rev. 2000, 10, 46–55. [Google Scholar] [CrossRef]
  61. UNIDO. Introducing Environmental Management Accounting (EMA) At Enterprise Level Methodology and Case Studies from Central and Eastern Europe; United Nations Industrial Development Organization: Vienna, Austria, 2003. [Google Scholar]
  62. Pfeffer, J.; Salacik, G. The External Control of Organizations: A Resource Dependent Perspective; Harper and Row: New York, NY, USA, 1978. [Google Scholar]
  63. Shocker, A.D.; Sethi, S.P. An approach to incorporating societal preferences in developing corporate action strategies. Calif. Manag. Rev. 1973, 15, 97–105. [Google Scholar] [CrossRef]
  64. Florida, R.; Davison, D. Gaining from green management: Environmental management Systems inside and outsite the factory. Calif. Manag. Rev. 2001, 43, 64–84. [Google Scholar] [CrossRef]
  65. Prakash, A. Why Do Firms Adopt ‘Beyond—Compliance’ Environmental Policies? Bus. Strat. Environ. J. 2001, 10, 286–299. [Google Scholar] [CrossRef]
  66. Freeman, R. Strategic Management: A Stakeholder Approach; Pitman Publishing: Lanham, MD, USA, 1984. [Google Scholar]
  67. Belal, A.; Owen, D. The views of corporate managers on the current state of, and future prospects for, social reporting in Bangladesh: An engagement-based study. Account. Audit. Account. J. 2007, 20, 472–494. [Google Scholar] [CrossRef]
  68. Deegan, C.; Blomquist, C. Stakeholder influence on corporate reporting: An exploration of the interaction between WWF-Australia and the Australian minerals industry. Account. Org. Soc. 2006, 31, 343–372. [Google Scholar] [CrossRef]
  69. Ten, E. Applying stakeholder theory to analyze corporate environmental performance: Evidence from Australian listed companies. Asian Rev. Account. 2005, 15, 164–184. [Google Scholar] [CrossRef]
  70. Deegan, C. The Legitimising Effect of Social and Environmental Disclosures - A Theoretical Foundation. Account. Audit. Account. J. 2002, 15, 282–311. [Google Scholar] [CrossRef]
  71. Kitzman, K.A. Evironmental Cost Accounting for Improved Environmental Decision Making. Pollut. Eng. J. 2001, 33, 20–23. [Google Scholar]
  72. Godschalk, S.K.B. Does Corporate Environmental Accounting Make Business Sense? In Environmental Management Accounting for Cleaner Production; Schaltegger, S., Bennett, M., Burritt, R., Jasch, C., Eds.; Springer: Dordrecht, The Netherlands, 2008; Volume 24, pp. 249–265. [Google Scholar]
  73. Schaltegger, S.; Herzig, C.; Kleiber, O.; Muller, J. Sustainability management in business enterprises—Concepts and instruments for sustainable organization development, 2nd ed.; Federal Ministry for the Environment, Nature Conservation and Nuclear Safety: Berlin, Germany, 2002. [Google Scholar]
  74. Schaltegger, S.; Bennett, M.; Burritt, R.; Jasch, C. An empirical examination of the role of environmental accounting information in environmental investment decision making. In Environmental Management Accounting for Cleaner Production; Schaltegger, S.; Bennett, M.; Burritt, R.; Jasch, C. Springer: Dordrecht, The Netherlands, 2008; Volume 24, pp. 457–475. [Google Scholar]
  75. Onishi, Y.; Kokubu, K.; Nakajama, M. Implementing Material Flow Cost Accounting in a Pharmaceutical Company. In Environmental Management Accounting For Cleaner Production; Schaltegger, S., Bennett, M., Burrit, R., Jasch, C., Eds.; Springer: Dordrecht, The Netherlands, 2008; Volume 24, pp. 395–409. [Google Scholar]
  76. Wagner, M. Environmental performance and the quality of corporate environmental reports: The role of environmental management accounting. In Implementing Environmental Management Accounting: Status and Challenges; Rikhardsson, P., Bennett, M., Bouma, J., Schaltegger, S., Eds.; Springer: Dordrecht, The Netherlands, 2005; Volume 18, pp. 105–122. [Google Scholar] [CrossRef]
  77. Hart, S.L.; Ahuja, G. Does it pay to be green? an empirical examination of the relationship between emission reduction and firm performance. Bus. Strat. Environ. 1996, 5, 30–37. [Google Scholar] [CrossRef]
  78. Hair, J.F.; Black, W.C.; Babin, B.J.; Anderson, R.E. Multivariate Data Analysis, 7th ed.; Prentice Hall International, Inc.: Upper Saddle River, NJ, USA, 2009; p. 7. [Google Scholar]
  79. Qian, W.; Burritt, R.; Monroe, G. Environmental management accounting in local government: A case of waste management. Account. Audit. Account. J. 2011, 24, 93–128. [Google Scholar] [CrossRef]
  80. Abreu, M.C.S.; Castro, F.C.; Lazoro, J.C. Stakeholder influence on environmental proactivity of Brazilian companies. J. Account. Organ. 2013, 17, 20–32. [Google Scholar] [CrossRef]
  81. Hyršlová, J.; Hájek, M. Environmental management accounting in the framework of EMAS II in the Czech republic. In Implementing Environmental Management Accounting: Status and Challenges; Rikhardsson, P., Bennett, M., Bouma, J., Schaltegger, S., Eds.; Springer: Dordrecht, The Netherlands, 2005; Volume 18, pp. 279–295. [Google Scholar] [CrossRef]
  82. Jinadu, O.; Agbeyangi, B.A.; Mamidu, I.A. Impact of Environmental Management Accounting on Current Practices and Future Sustainability in South-West Nigerian Polytechnics. Int. J. Econ. Commerce Manag. 2015, 3, 586–603. [Google Scholar]
  83. Ramli, A.; Ismail, M.S. Environmental management accounting practices: A Survey of ISO 14001 certified Malaysian organizations. J. Energy Technol. Policy 2013, 3, 415–432. [Google Scholar]
  84. Le, T.T. Performance measures and metrics in a supply chain environment. Uncertain Supply Chain Manag. 2019, 8. [Google Scholar] [CrossRef]
  85. Doorasamy, M. Using Environmental Management Accounting to Investigate Benefits of Cleaner Production at a Paper Manufacturing Company in Kwadakuza, Kwazulu Natal: A Case Study. Ph.D. Thesis, Durban University of Technology, Durban, South Africa, 2014. [Google Scholar]
Figure 1. Research model.
Sustainability 11 05152 g001
Figure 2. The characteristics of respondents.
Sustainability 11 05152 g002
Figure 3. Summary of research results.
Sustainability 11 05152 g003
Table 1. The relationship between environmental management accounting (EMA) practices and decision making.
Collecting information Sustainability 11 05152 i001EMA practices Sustainability 11 05152 i002Decision making
- Environmental audit
- Environmental impact assessment
- Environmental risk appraisal
- Product cycle analysis
- Calculate environmental issues (cost, revenue, asset, debt)
- Analyze environmental efficiency
- Green market development
- Activity based management
- Synchronous quality management
- Pollution prevention
- Product management
- Environmental report
Source: From authors.
Table 2. Kaiser−Meyer−Olkin (KMO) and Bartlett’s tests.
Kaiser−Meyer−OlkinMeasure of Sampling Adequacy0.907
Bartlett’s Test of SphericityApproximate Chi-Square12335.894
df630
Sig.0.000
Table 3. Total variance explained.
Total% of VarianceCumulative %Total% of VarianceCumulative %Total% of VarianceCumulative %
112.43234.53334.53312.43234.53334.5335.41815.05015.050
24.70313.06347.5974.70313.06347.5974.17911.60726.657
32.6207.27754.8742.6207.27754.8743.65010.13836.795
42.0355.65260.5262.0355.65260.5263.5089.74646.540
51.7644.89965.4261.7644.89965.4263.3089.18955.729
61.3553.76369.1891.3553.76369.1892.6447.34463.073
71.2483.46872.6571.2483.46872.6572.4696.85869.931
81.0833.00775.6641.0833.00775.6642.0645.73375.664
90.7492.08077.744
100.6731.86979.613
110.6501.80481.417
120.5491.52682.943
…..
Table 4. Rotated component matrix.
Component
12345678
PAN10.899
EDD30.884
PAN30.874
EDD20.848
PAN20.843
EDD10.819
ENU5 0.846
ENU3 0.822
ENU1 0.815
ENU4 0.806
ENU2 0.797
GOE5 0.761
GOE3 0.724
GOE4 0.724
GOE2 0.703
GOE1 0.684
PES1 0.796
PES4 0.780
PES2 0.755
PES3 0.750
COE2 0.864
COE3 0.838
COE4 0.637
COE5 0.601
FIC2 0.888
FIC3 0.869
FIC1 0.749
STI3 0.780
STI4 0.758
STI1 0.632
STI2 0.524
MIP3 0.760
MIP1 0.706
MIP2 0.692
All abbreviations are defined in Appendix A.
Table 5. Model summary.
ModelRR SquareAdjusted R SquareStd. Error of the EstimateChange StatisticsDurbin−Watson
R Square ChangeF Changedf1df2Sig. F Change
10.871 a0.7590.7590.318160.7591310.92514160.000
20.895 b0.8010.8000.289210.04288.45814150.000
30.911 c0.8300.8280.268140.02868.79514140.000
40.915 d0.8370.8350.262790.00718.02014130.000
50.916 e0.8400.8380.260580.0038.04614120.005
60.917 f0.8420.8390.259460.0024.55414110.0331.439
a Dependent Variable: GOE; b Dependent Variable: GOE, STI; c Dependent Variable: GOE, STI, POE; d Dependent Variable: GOE, STI, POE, COE; e Dependent Variable: GOE, STI, POE, COE, PEA; f Dependent Variable: GOE, STI, POE, COE, PEA, FIC.
Table 6. ANOVA test.
ModelSum of SquaresdfMean SquareFSig.
6Regression147.143624.524364.2930.000 f
Residual27.6684110.067
Total174.811417
f Predictors: (Constant), GOE, STI, POE, COE, PEA, FIC.
Table 7. Regression analysis of environmental management accounting (EMA) application.
ModelUnstandardized CoefficientsStandardized CoefficientstSig.95.0% Confidence Interval for BCollinearity Statistics
BStd. ErrorBetaLower BoundUpper BoundToleranceVIF
6Constant−0.9600.113 −8.4700.000−1.183−0.737
GOE0.5300.0250.59221.4090.0000.4820.5791.9841.984
STI0.1390.0250.1535.5530.0000.0900.1891.9691.969
POE0.1380.0210.1686.5350.0000.0960.1791.7191.719
COE0.1430.0310.1144.5810.0000.0820.2051.6041.604
PEA0.0640.0210.0763.0960.0020.0230.1041.5761.576
FIC0.0400.0190.0472.1340.0330.0030.0781.2831.283
All abbreviations are defined in Appendix A.
Table 8. The correlations between EMA application and financial and environmental efficiency.
EMAFIEENE
EMA
(EMA application)
Pearson Correlation10.720 **0.689 **
Sig. (2-tailed) 0.0000.000
FIE
(Financial efficiency)
Pearson Correlation0.720 **10.916 **
Sig. (2-tailed)0.000 0.000
ENE
(Environmental efficiency)
Pearson Correlation0.689 **0.916 **1
Sig. (2-tailed)0.0000.000
** Correlation is significant at the 0.01 level (2-tailed).
Table 9. Regression model of EMA and financial and environmental efficiency.
ModelUnstandardized CoefficientsStandardized CoefficientstSig.95.0% Confidence Interval for B
BStd. ErrorBetaLower BoundUpper Bound
1
(Effect ofEMA to FIE)
Constant0.4520.131 3.4640.0010.1960.709
EMA1.2450.0590.72021.1810.0001.1291.360
Adjust R2 = 0.518
Durbin−Watson = 0.872
Sig. in ANOVA test = 0.000
2
(Effect of
EMA to ENE)
Constant1.0020.124 8.0920.0000.7581.245
EMA1.0800.0560.68919.3960.0000.9711.190
Adjust R2 = 0.474
Durbin−Watson = 0.735
Sig. in ANOVA test = 0.000
3
(Effect of
ENE to FIE)
Constant−0.2310.075 −3.0790.002−0.378−0.083
ENE1.0090.0220.91646.4910.0000.9671.052
Adjust R2 = 0.838
Durbin−Watson = 1.476
Sig. in ANOVA test = 0.000

