Article

A Model-Based Estimation of Resource Use Efficiencies in Maize Production in Nigeria

Institute of Crop Science and Resource Conservation, University of Bonn, Katzenburgweg 5, D-53115 Bonn, Germany
*
Author to whom correspondence should be addressed.
Sustainability 2019, 11(18), 5114; https://doi.org/10.3390/su11185114
Submission received: 12 July 2019 / Revised: 31 August 2019 / Accepted: 17 September 2019 / Published: 18 September 2019
(This article belongs to the Section Sustainable Agriculture)

Abstract

:
Food security is an increasingly serious problem worldwide, and especially in sub-Saharan Africa. As land and resources are limited and environmental problems caused by agriculture are worsening, more efficient ways to use the resources available must be found. The objective of this study was to display the spatial variability in crop yield and resource use efficiencies across Nigeria and to give recommendations for improvement. Based on simulations from the crop model LINTUL5 we analyzed the influence of fertilizer application on the parameters Water Use Efficiency (WUE), Fertilizer Use Efficiency (FUE), and Radiation Use Efficiency (RUE) in maize. High spatial variability was observed, especially between the north and the south of the country. The highest potential for yield improvement was found in the south. While WUE and RUE increased with higher rates of fertilizer application, FUE decreased with higher rates. In order to improve these resource use efficiencies, we suggest optimizing management strategies, demand-oriented fertilizer application, and breeding for efficient traits.

1. Introduction

Maize is an important staple crop in many regions of the world, especially in sub-Saharan Africa [1,2]. In Nigeria, the diet depends on maize as their number one cereal crop [3]. The average inhabitant consumes 60 grams of maize a day [1]. Nigeria is a country in Western Africa with a population of more than 195 million people [4]. Although agriculture is still responsible for 40% of the gross domestic product and two-thirds of the labor force are currently occupied by agriculture, the country’s food production does not meet the demand [3]. One reason for this is the country’s continually growing population [5]. Therefore, meeting the increasing food demand calls for interventions that could lead to increased crop productivity.
One of the key associations with increased productivity in agriculture has always been the use of chemical fertilizer [6]. However, the use of fertilizer in Africa is generally low compared to other developing regions, the average being 5.3 kg ha−1 in 2011 [6,7]. This might be because of high fertilizer prices concerning crop prices, not enough financial resources of the farmers, or lack of knowledge of where to buy and how to use fertilizer [6]. Recently, there have been small increases in the amount of production, but only by the expansion of the production area [6]. In the past, there have been many programs trying to raise the amount of fertilizer used, but most of them failed in the long term, being too expensive or not sustainable enough [6]. However, compared to other African countries, Nigeria has relatively correct circumstances for producing nitrogen fertilizer. They have natural gas sources, and the demand for fertilizer in the country is high enough to make production profitable [6]. So, chances are good to increase production with fertilizer.
The average maize yield in Nigeria is 1.59 t ha−1 [8], but the spatial variability between the states is high [9]. Possible reasons for these low yields might be a lack of nutrients in the soils, poor soil structure, or insufficient water supply [2]. Interaction among these limiting resources strongly influences the efficiency with which the resources are used, crop productivity, and the sustainability of crop production systems [10]. As resource use efficiency plays an essential role in agriculture, understanding the spatial distribution of resource use and resource use efficiencies of the current production systems could help to identify possibilities of producing more with the available resources and help to address the existing spatial variability in crop yield across the states. Furthermore, information about resource use efficiencies paves the way towards the adoption of integrated farming systems, which could be a potential approach to boost farm income and sustainable crop production in Nigeria.
Inefficiencies in resource use can have a significant impact on the output. Especially for countries where soils are poor in nutrient content, it is crucial to optimize their use efficiencies [11,12]. The efficient management of fertilizer is particularly crucial due to the negative impacts of excessive nitrogen use on the environment. The excessive application of ammonium can create imbalances with other cationic nutrients such as calcium, phosphorus, and magnesium. The abundance of ammonium also reduces the soil pH, which at a certain level can cause the release of toxic elements such as aluminum. Thus, in such cases nitrate fertilizers instead of ammonium or urea fertilizers are preferable. However, nitrate nitrogen is very mobile in the soil and highly susceptible to leaching after heavy rains or after irrigation. The leached nitrate may reach groundwater aquifers, contaminating drinking water. In the future, with increasing fertilizer-N application rates, the possibility of nitrate pollution of groundwater in developing countries will be strongly linked with fertilizer-N efficiency. A limited number of investigations suggest that in the humid tropics of Africa, the potential exists for nitrate pollution of groundwater, especially if fertilizer-N is inefficiently managed [13].
As with water, nutrient availability and radiation are often limiting factors to crop growth. The impacts of specific factors on crop growth and crop productivity have been studied for a long time, and therefore are generally well known [10]. However, research gaps still exist in understanding the interactions between the factors affecting their use efficiencies and their variability in space and time, especially at large scale (from state to national scale). To our knowledge, no such studies at a national scale pertaining to Nigeria have been reported in the literature to date. Therefore, this study aims to display the yield and existing variability in resource use efficiencies at a national scale and arrive at model-based estimations of yield increase using different amounts of fertilizer. Regarding the indicators for quantifying resource use efficiencies, we concentrated on the Agronomic Fertilizer Use Efficiency (FUE), Water Use Efficiency (WUE), and Radiation Use Efficiency (RUE).
Nutrient availability in the soil is often a factor limiting plant growth. So, NPK fertilizers have proven to be an effective way of meeting the demands of the crop and thereby enhancing plant growth and yield. However, the costs for fertilizers are high, and are often even the highest input cost in farming [14]. More challenges associated with nitrogen are its leaching into the soil and the release of N-containing gases into the atmosphere. Both phenomena are very bad for the environment. Therefore, improving the plants’ Nitrogen Use Efficiency (NUE) is of high importance. NUE is defined as “the total biomass or grain yield produced per one unit of applied fertilizer N” [2,14,15]. Generally, two factors account for NUE: the plant’s N uptake and its utilization efficiencies.
The second parameter taken into consideration was Water Use Efficiency (WUE). Sometimes the term Water Use Efficiency is referred to as the ratio of yield per unit of evapotranspiration [15,16]. In our case, however, we use this term to describe the rate of yield produced per unit of precipitation. At present, 80% of the world’s available water resources are spent on agriculture [17]. However, as a consequence of the growing population, other sectors will demand more water in the future [15]. Therefore, agriculture must produce more food with less water. This means that plants have to become more efficient in using the water given [18].
The third parameter, Radiation Use Efficiency (RUE), is usually referred to as the “ratio of the amount of dry matter produced per one unit of intercepted photosynthetically active radiation” [5,19].
All these parameters were analyzed with the help of a crop growth model called LINTUL5. In this model, weather, soil, and management information are taken into consideration. This enables the model to estimate influences on and limitations to yield and biomass. We also analyzed their effects on Resource Use Efficiencies.

2. Materials and Methods

2.1. Model Description

LINTUL5is a bio-physical model that simulates plant growth, biomass, and yield as a function of climate, soil properties, and crop management using experimentally derived algorithms. LINTUL5 has been widely used in various studies at field, country, and continental scales [20,21,22,23,24,25,26,27]. The applied version of LINTUL5 [28] simulates potential crop growth (limited by solar radiation only). The phenology is simulated by the accumulation of thermal time above a defined base temperature. Total crop growth, root–shoot partitioning, and leaf area expansion are further influenced by water stress and nutrient stress. To simulate a continuous cropping system, the model was embedded into a general modelling framework, SIMPLACE (Scientific Impact Assessment and Modelling Platform for Advanced Crop and Ecosystem Management) [26]. The SIMPLACE<LINTUL5-SLIM-SoilCN> solution to the modelling platform was used in this study. SLIM is a conceptual soil water balance model subdividing the soil into a variable number of layers, substituting the two-layer approach in LINTUL5 [29]. To estimate nitrogen uptake by crop, turnover, leaching of soil mineral nitrogen (nitrate N and ammonium N) in layered soils, the sub-model “SlimNitrogen” derived from the SLIM model [29] and the sub-model “SoilCN” were used. SlimNitrogen calculates the daily changes of three pools of soil mineral N in each soil layer (for details refer to [30]).
Water stress occurs when the available soil water is between a defined critical point and the wilting point or higher than the field capacity (i.e., water-logging). The critical point is a crop-specific value which is calculated according to [31] and depends on crop development, soil water tension, and potential transpiration. Nitrogen stress occurs when crop available nitrogen in the rooted soil profile is lower than crop nitrogen demand. Water, nutrients (NPK), temperature, and radiation stresses restrict the daily accumulation of biomass, root growth, and yield. Stress indices are calculated daily for water and nutrient limitations and range from 0.0 to 1.0. The estimation of the daily increase in crop biomass, considers, on a given day, the maximum stress index among water, nitrogen, phosphorus, and potassium stress.

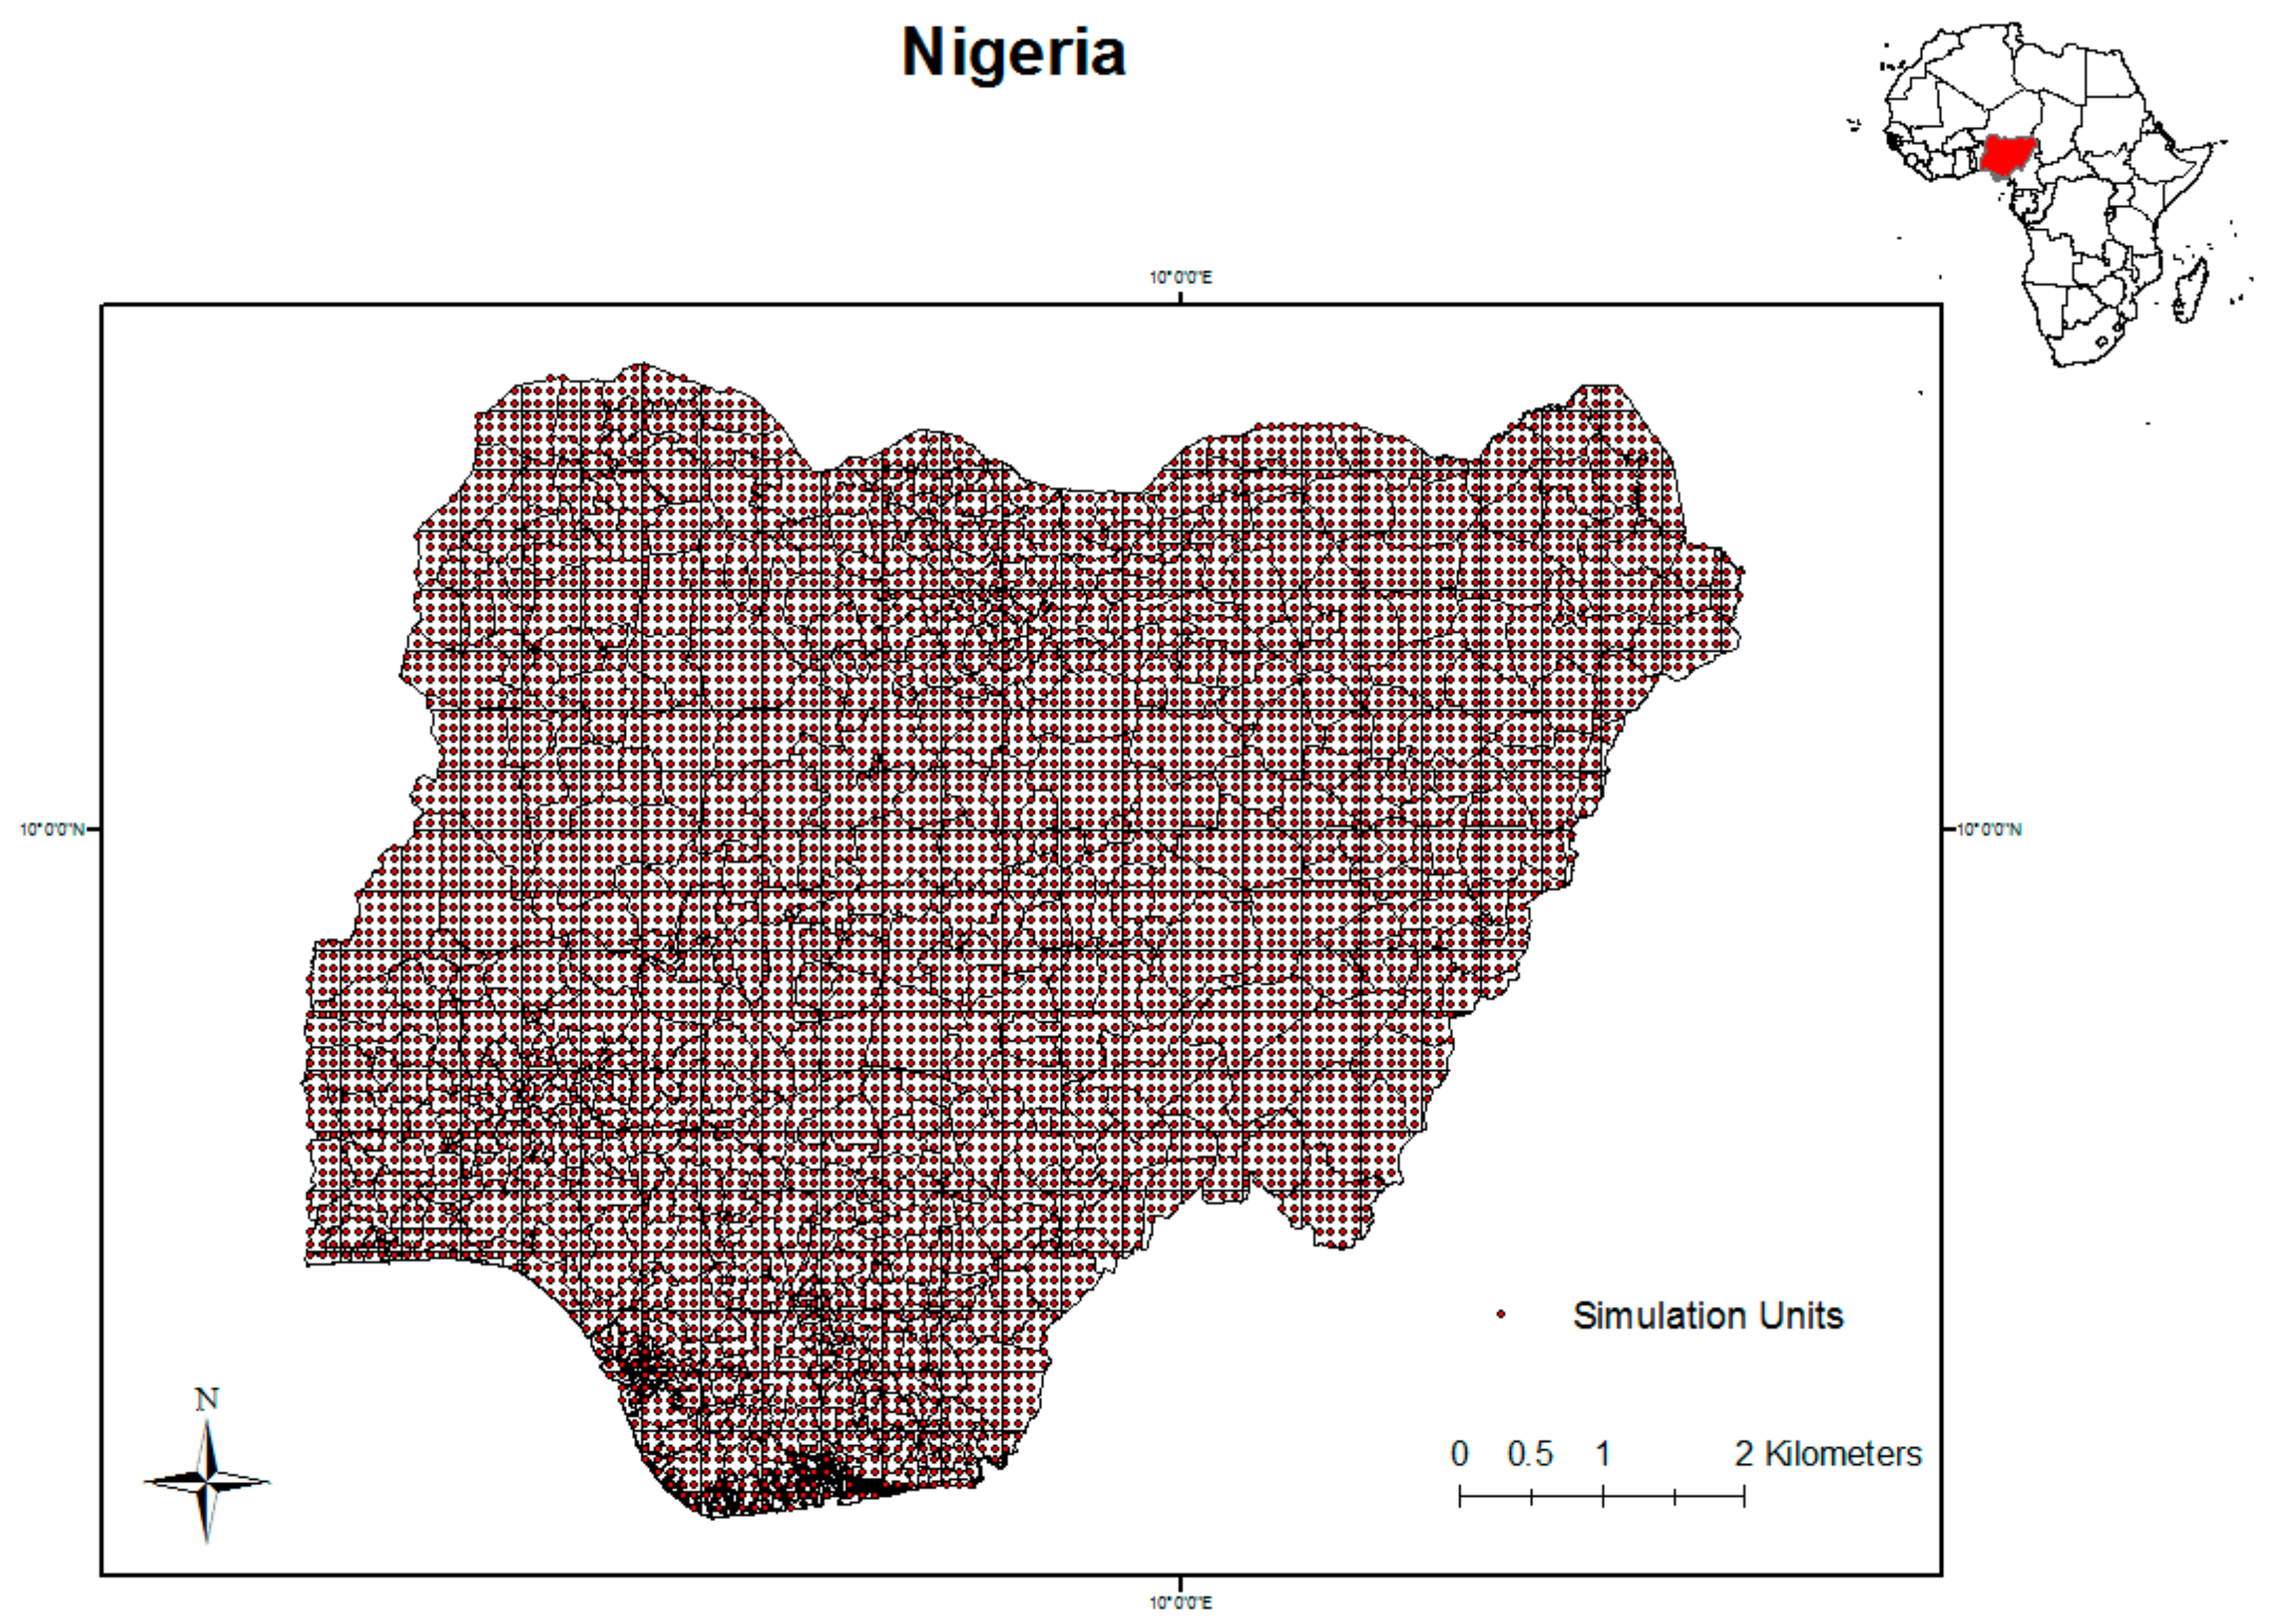
2.2. Climate and Soil Data

The climate data at the national scale were made available from the National Aeronautics and Space Administration (NASA), Goddard Institute of Space Studies (https://data.giss.nasa.gov/impacts/agmipcf/agmerra/), and AgMERRA [32], and consisted of daily time series over the 1980–2010 period with global coverage of the climate variables required for agricultural models (i.e., minimum and maximum temperature, solar radiation, precipitation, and wind speed). These datasets were produced by combining state-of-the-art reanalyses (NASA’s Modern-Era Retrospective analysis for Research and Applications (MERRA) [33] and NCEP’s Climate Forecast System Reanalysis (CFSR) [34] with observational datasets from in situ observational networks and satellites. The dataset is stored at 0.25° c 0.25° horizontal resolution (~25 km2). Values for relevant soil parameters for each soil layer down to maximum soil depth (sand, silt, clay, gravel content, cation exchange capacity, pH, organic carbon, and bulk density) were extracted from the soil property maps of Africa at 1 km × 1 km resolution (http://www.isric.org/data/soil-property-maps-africa-1-km). Other parameters such as soil water at field capacity, wilting point and saturation point, and van Genuchten parameters were computed [35]. Simulations over all of Nigeria were run at 1 km × 1 km resolution and outputs were aggregated at the state level to compare them with statistics (Figure 1).

2.3. Dataset for Model Calibration

Maize yields (ton/ha) and fertilizer application (nitrogen, phosphorus and potassium) rates over 15 years (1996–2010) were collected from the IITA, Nigeria and University of Ibadan, Nigeria. These values were used for the model calibration at the state level. The NPK application rates in three states (i.e., Edo, Kwara, and Ogun) were 6, 9, and 3.15 kg/ha, respectively, and were used in model calibration.
The default maize (Zea mays L.) crop parameter dataset for LINTUL5 was used, and some parameters which were similar or identical to the maize crop parameters in the WOFOST model [36,37] were adjusted. This parameter set was used as a starting point to establish a new parameter set for the maize long cycle variety “Obatanpa”. For the crop parameters, a plausible range over which they vary was obtained from the literature [20,21,37,38]. By systematically sampling a value from the range of each parameter, a set containing all the parameters of the model was obtained and evaluated by comparing the simulated grain yield and the phenology to the corresponding observations. The systematic sampling and evaluation were performed for the entire parameter space of all variables, and the parameter set with the smallest mean residual error was chosen (Table 1).
As a measure of accuracy to compare statistical data and simulated values, the following objective functions were used [39]:
  • The mean relative error (MR) as:
    M R = 1 n i = 1 n ( y i x i ) x i
  • The mean residual error (ME) as:
    M E = 1 n i = 1 n y i x i
    where n is the sample number, x is the observed value, and y is the simulated value. An ME value of 0 indicates no systematic bias between simulated and measured values. The mean relative error (MR) shows the mean magnitude of the error related to the observed value. Small values indicate little difference between simulated and measured values.

3. Results

3.1. Model Calibration and Evaluation

The observed and simulated maize grain yield agreed well in Ogun state where MR = 2.2% and ME = 0.03 ton/ha. Whereas, in Edo and Kwara, the model underestimated the maize grain yield by −11.6% and −13.8%, respectively. The ME was also underestimated by 0.21 ton/ha and 0.19 ton/ha respectively compared to the observed grain yield values (Figure 2).
When applied to the 25 States in Nigeria, average simulated yields of the states were in the range of observed yields averaged over 15 years with a root mean square error (RMSE) of 0.4 ton/ha. The discrepancy observed in the simulated yield could have resulted due to soil parameters used from the ISRIC-WISE database, which refer to soil samples that are representative of large areas. Available soil data do not likely represent long-term cultivated, nutrient-depleted soils.

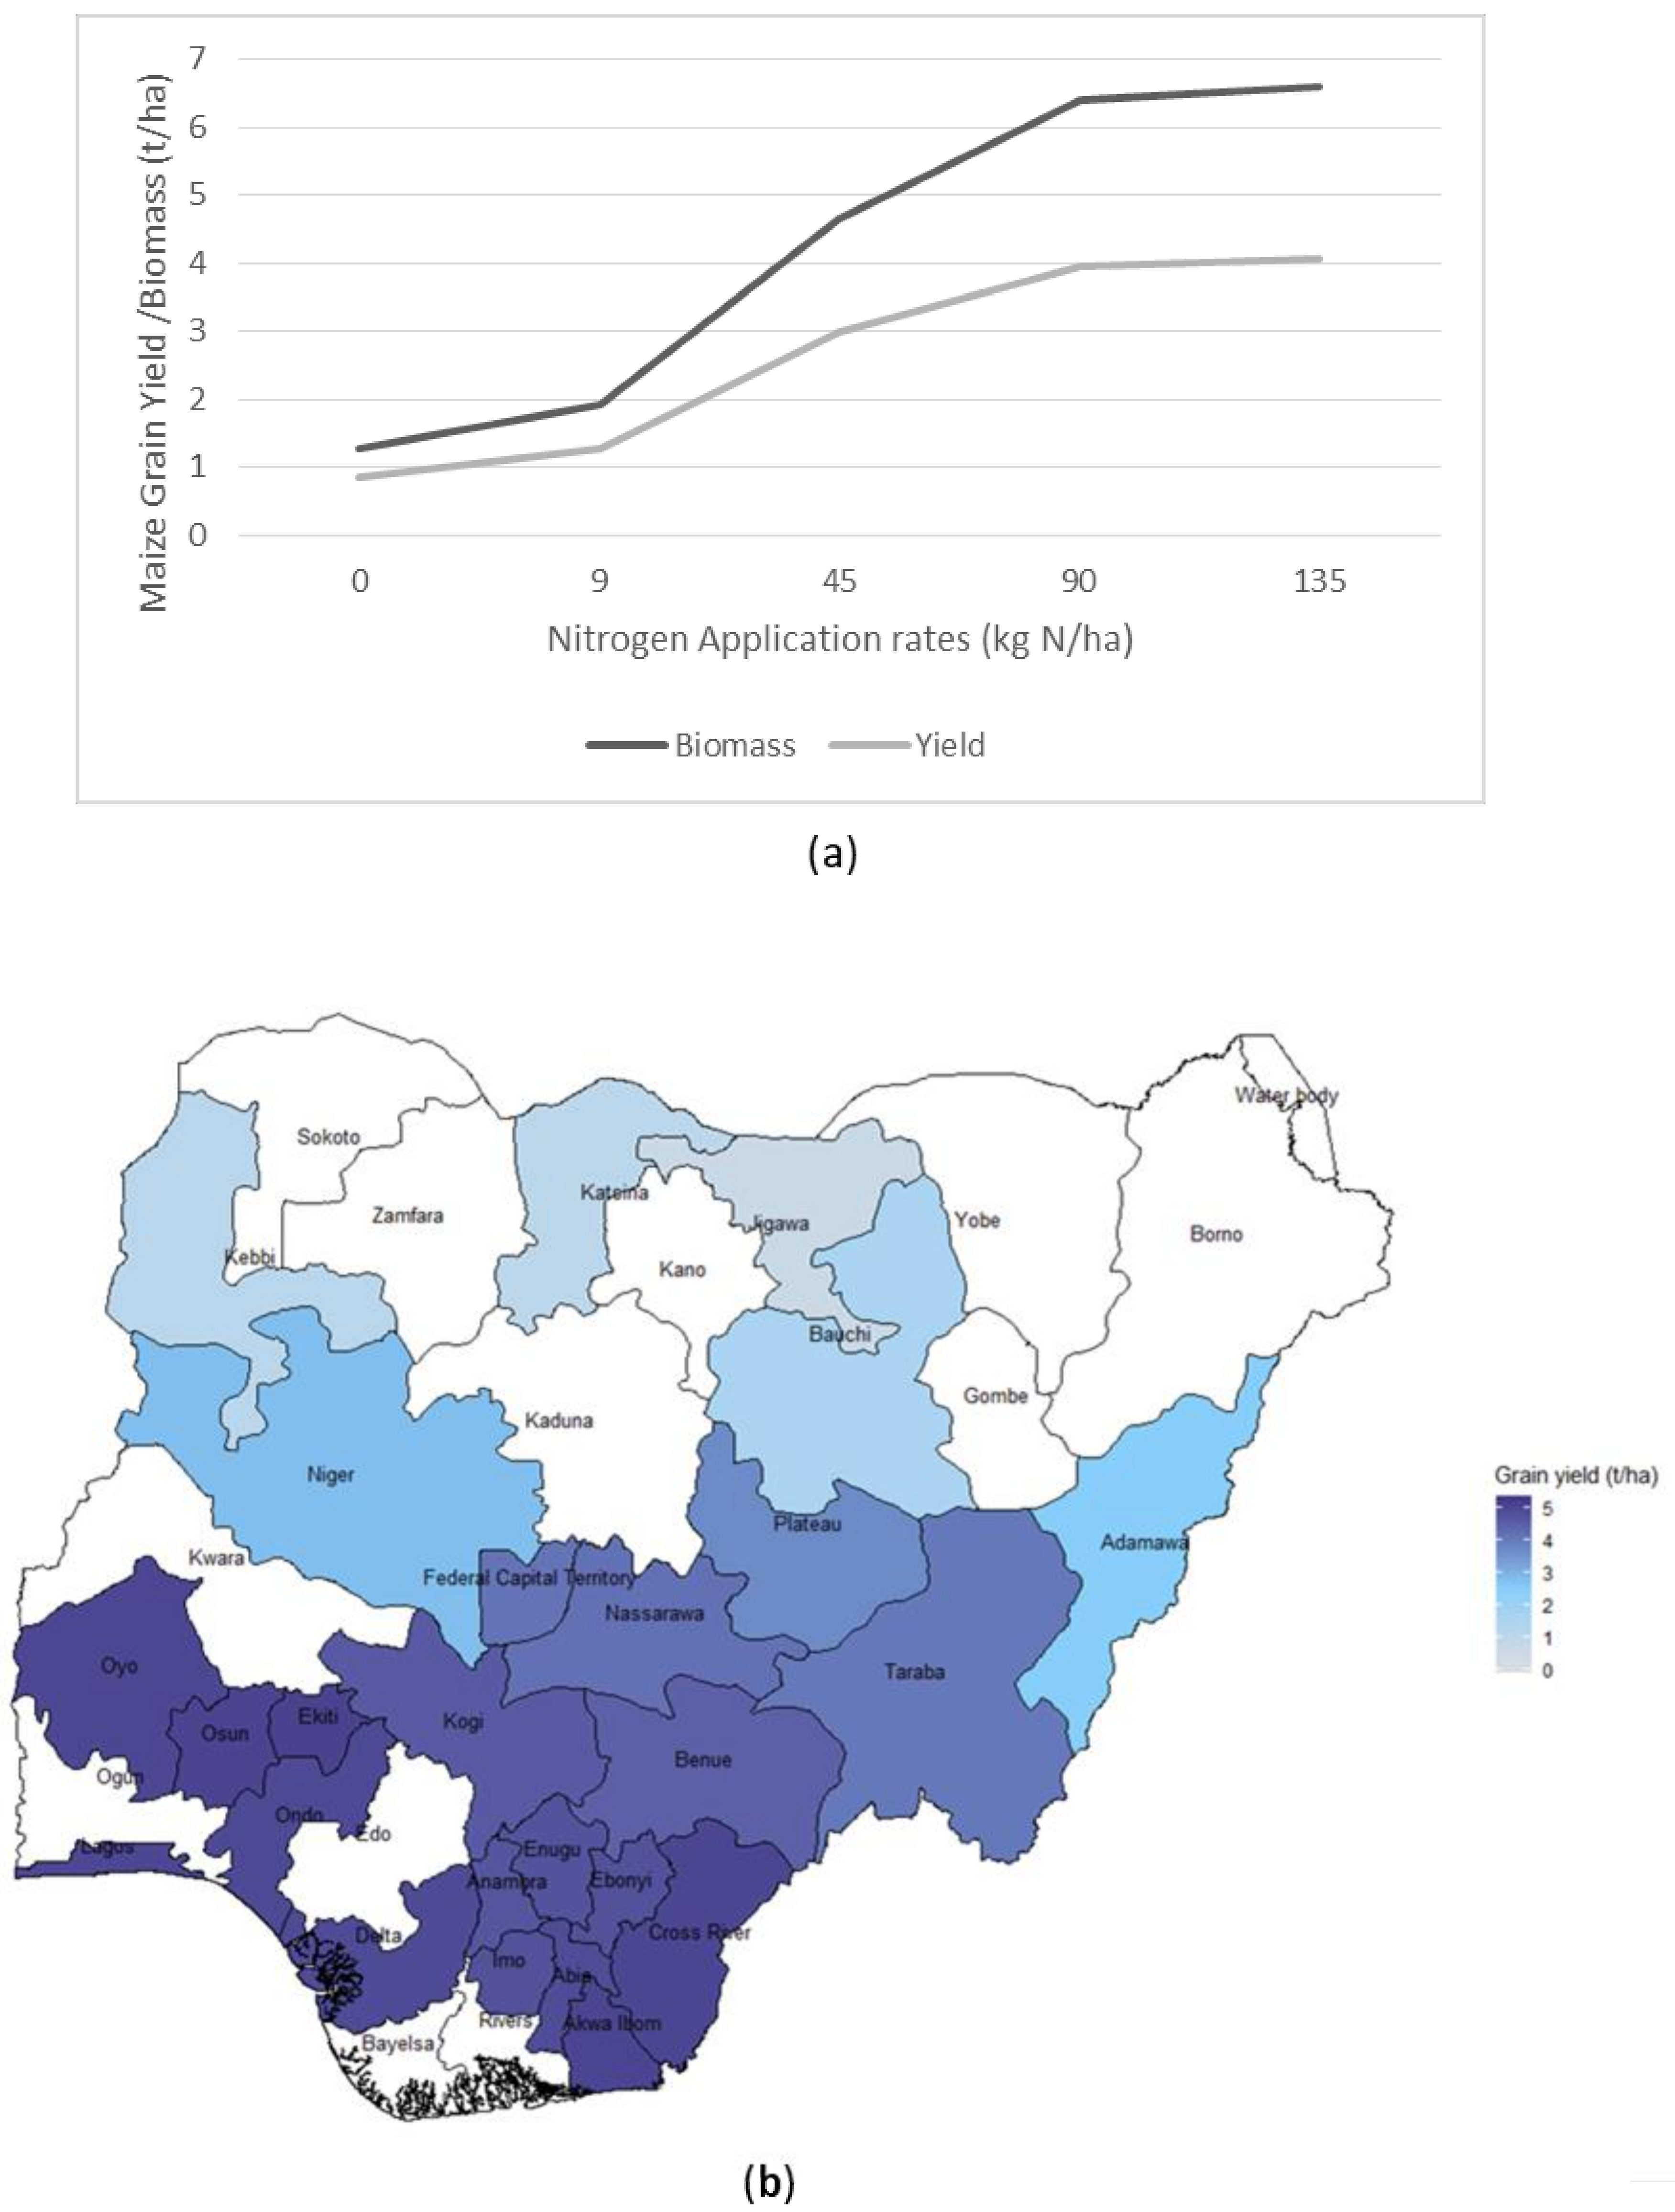
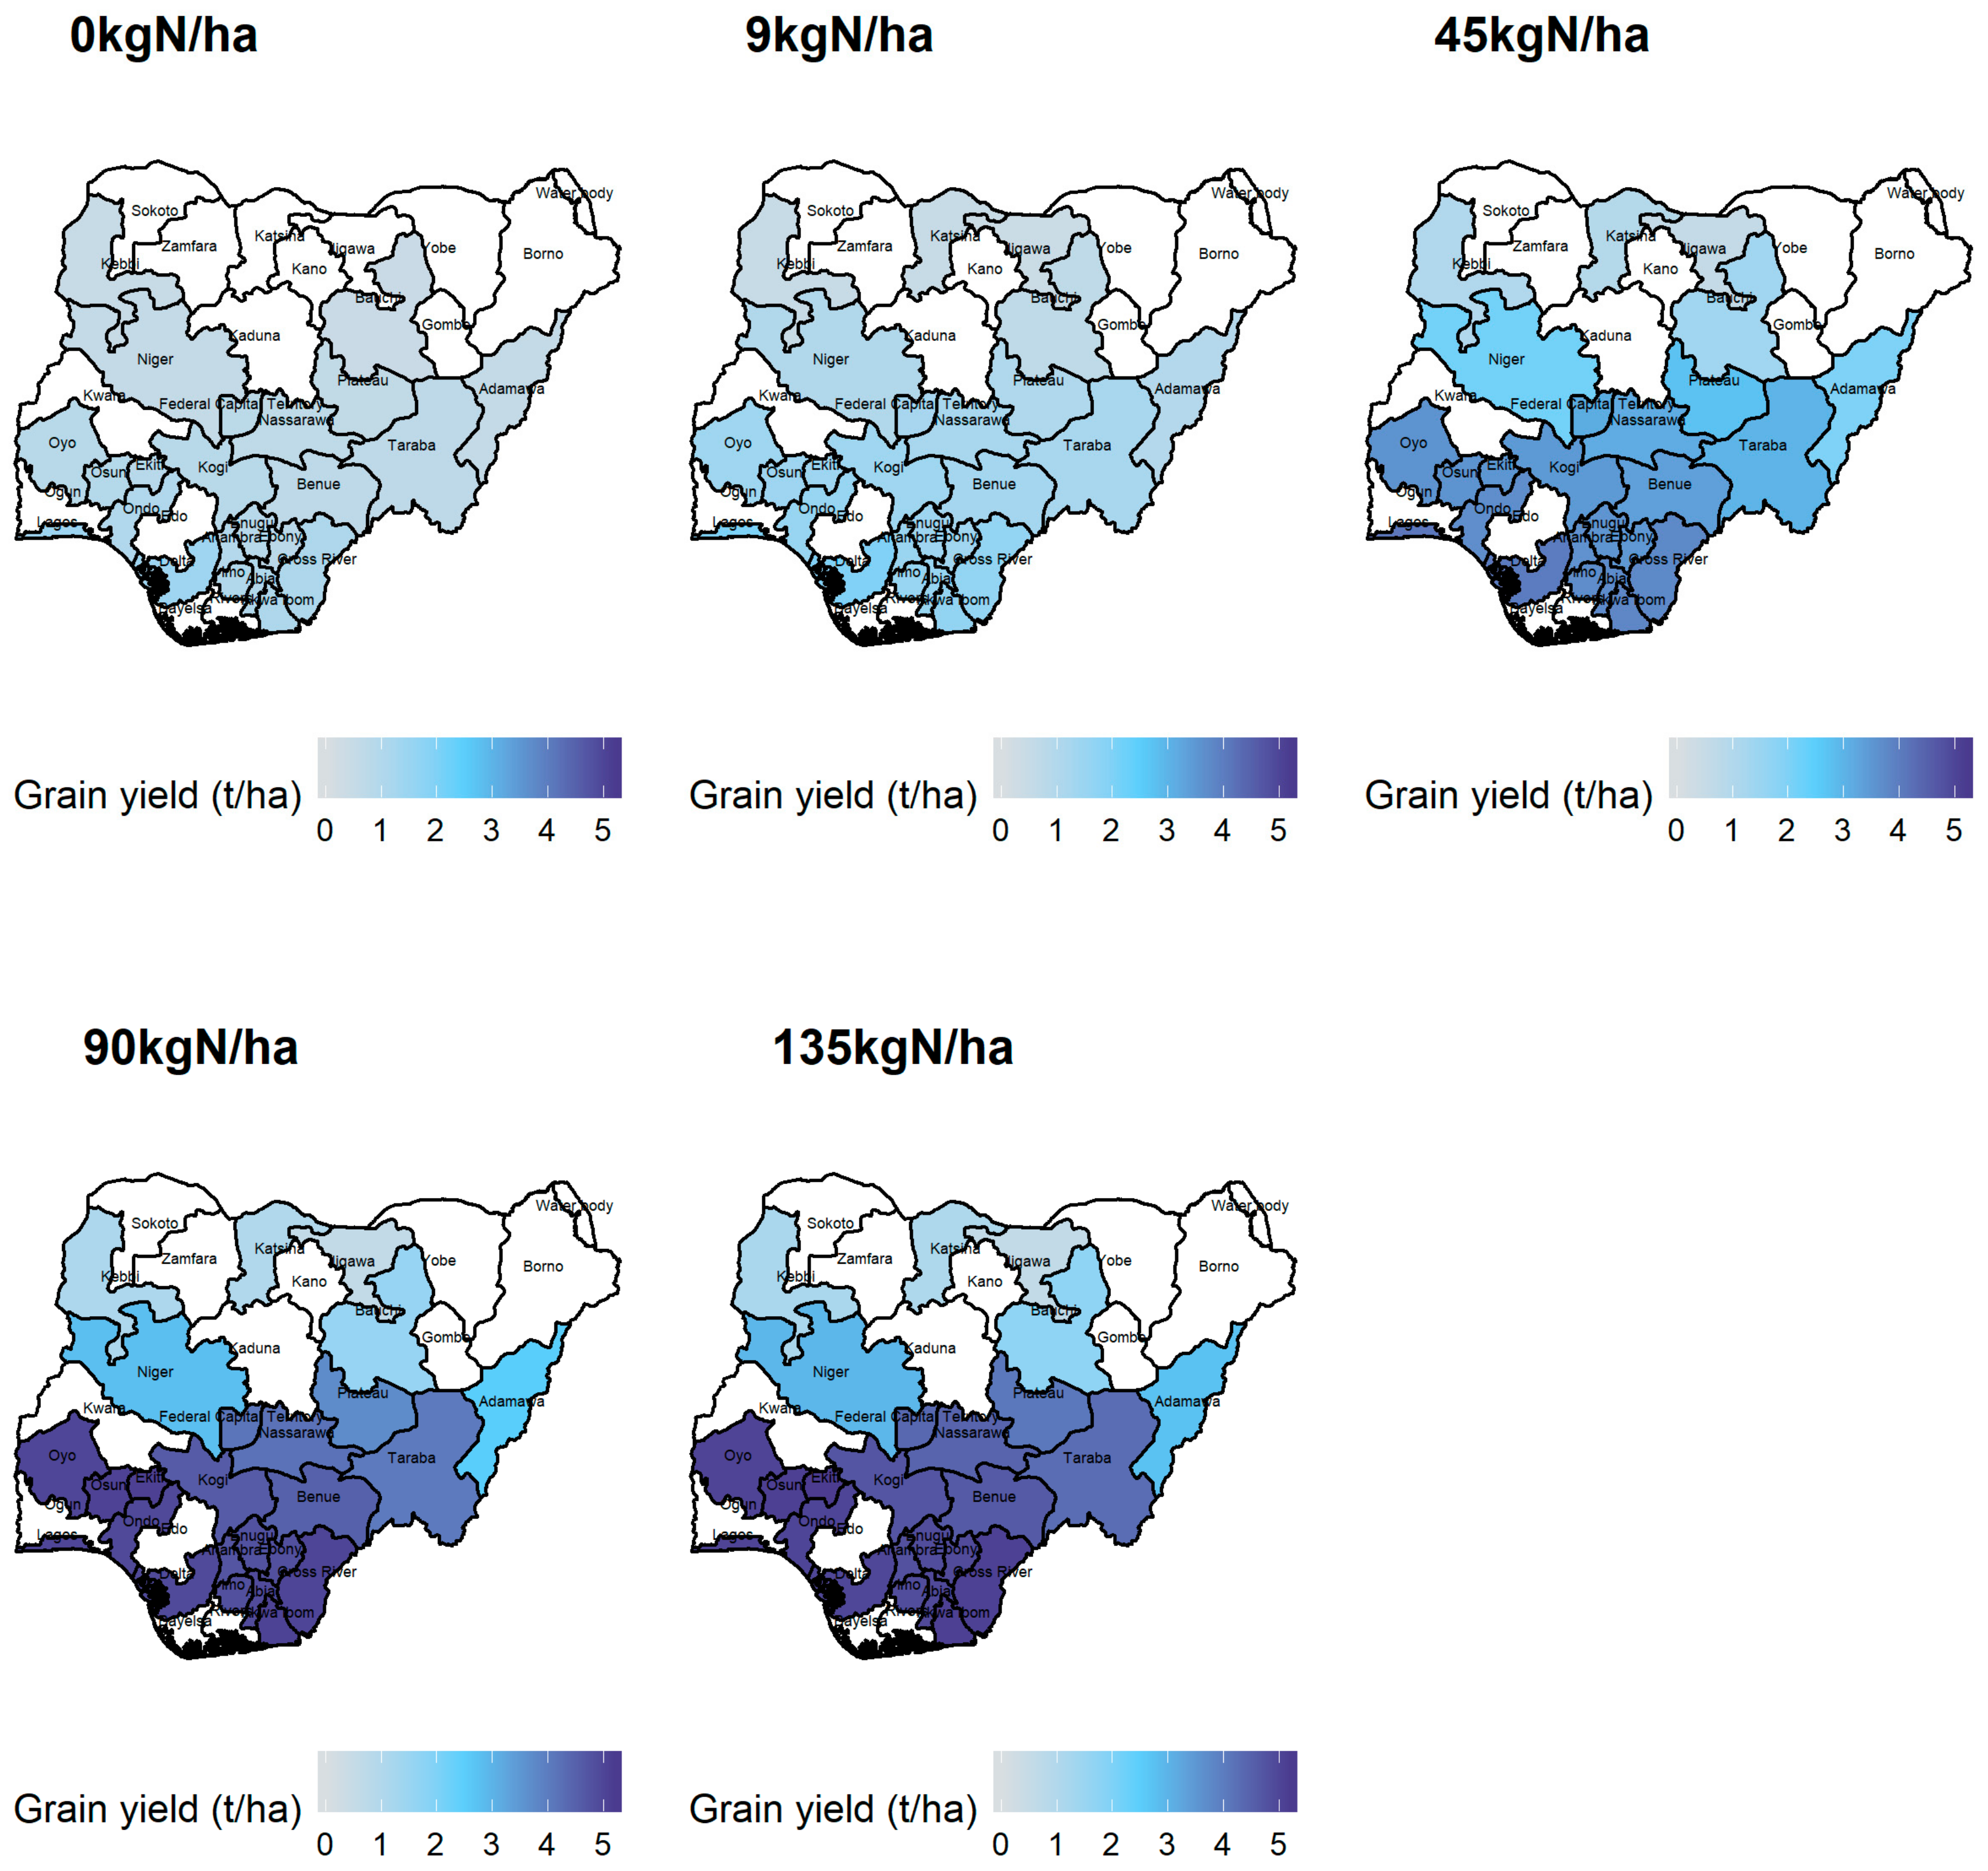
3.2. Simulated Yields and Biomass at Different Rates of Fertilizer Application

The effect of fertilizer application rates on the simulated maize yields and biomass were observed (Figure 3a). The simulated yields and biomass under different scenarios are also presented in maps describing the achieved simulated output level foreach state of Nigeria, which can be seen in Figure A1 in Appendix A.
The differences between the simulated yields in the different states under the application of 90 kg of nitrogen per hectare can be observed in Figure 3b. In this scenario, the state Ekiti reached 5.1 ton/ha and Osun 5.06 ton/ha. Generally, the south of Nigeria reached the highest levels of simulated yields and simulated biomass.
Under the scenario of 0, 9, and 45 kgN/ha, the states with greater simulated yields were Lagos, Delta, and Akwa Ibom, whereas the states of Ekiti, Osun, and Akwa Ibon were the highest under the scenarios of 90 and 135 kgN/ha.
The lowest simulated yield was found in the states of Jigawa, Kebbi, and Katsina for all the scenarios studied. According to the scenario of 90 kgN/ha, Katsina had a simulated yield of 1 ton/ha and Jigawa 0.58 ton/ha. The same trend was observed in the simulated biomass calculation.
The statistical analysis showed a significant (p < 0.01) and negative correlation of yields and simulated biomass with the amount of radiation received during the maize growing period and the average temperature during the growing season in all the cases studied. On the contrary, there was a significant positive correlation (p < 0.05) with precipitation during the growing season.

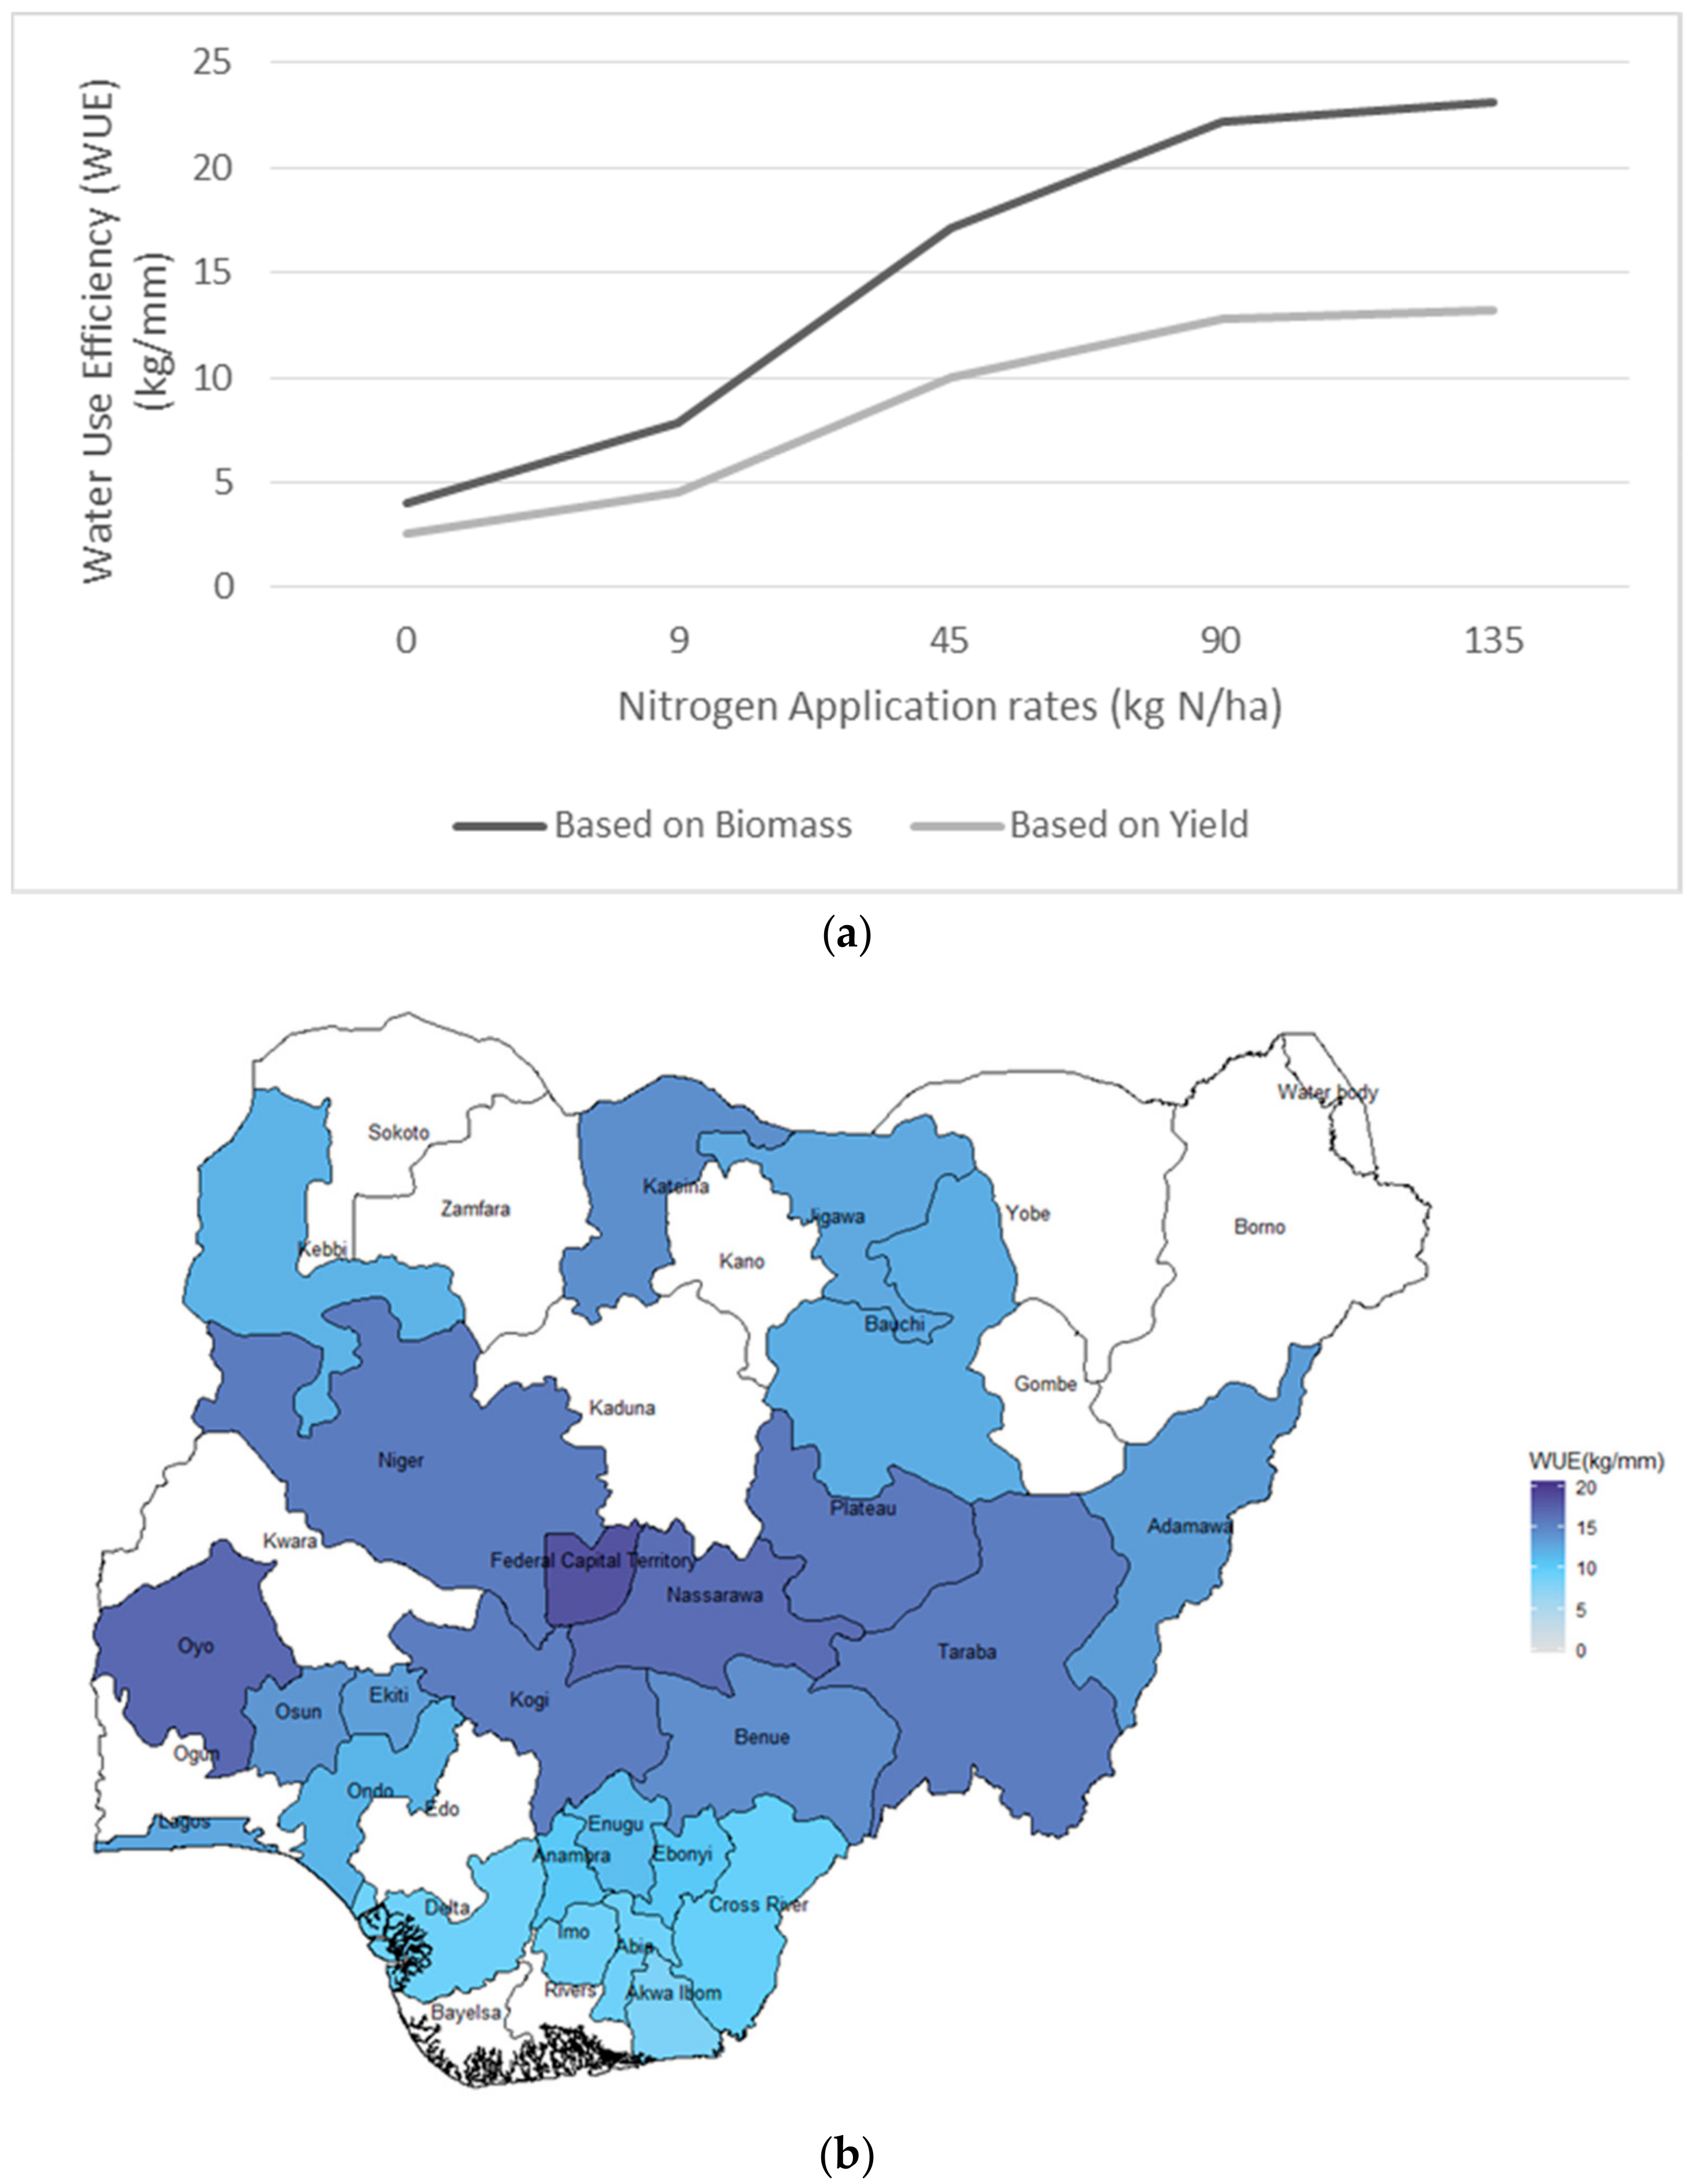
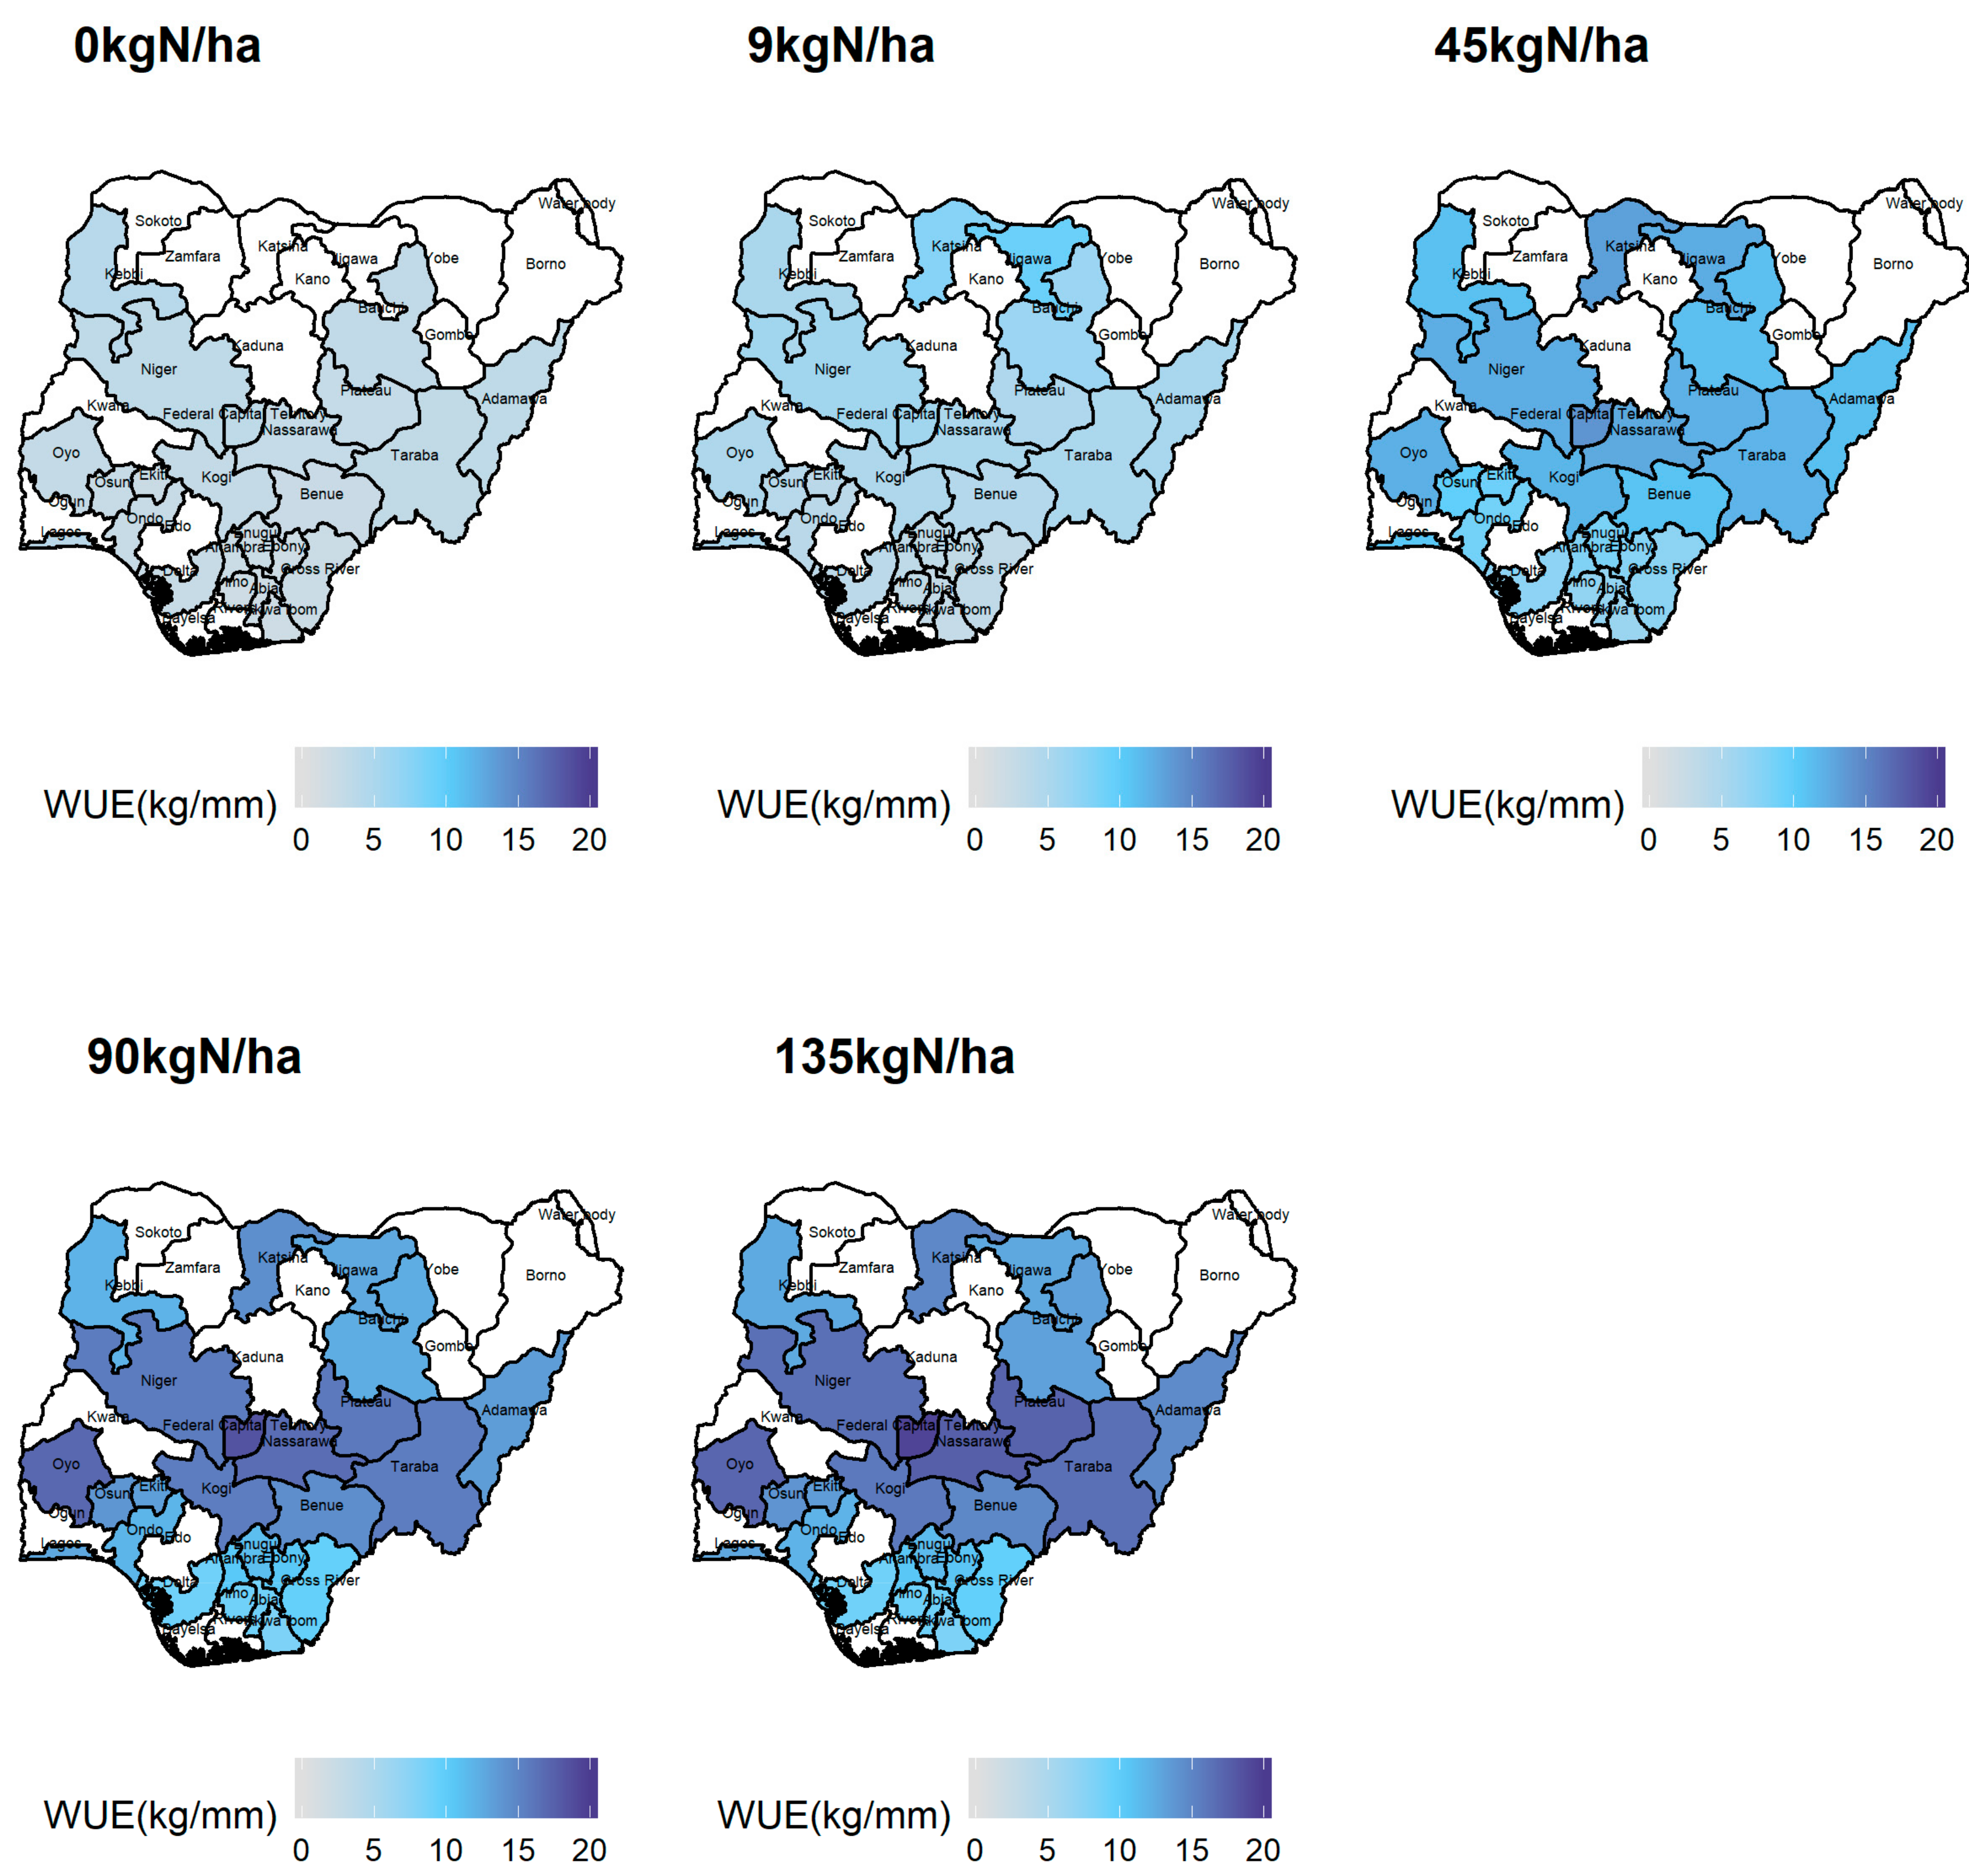
3.3. Simulated Water Use Efficiency under Different Rates of Fertilizer Application

Figure 4a shows the Water Use Efficiency (WUE) in the maize yields and the biomass in all the fertilizer scenarios. The same trend was observed in WUEs based on both maize yield and biomass: when the amount of fertilizer increased, the WUE increased as well until the threshold of 90 kgN/ha after which a plateau was reached.
Differences between the states were found in the simulated WUE. The highest WUE was reached in Jigawa under the scenario of 9 kgN/ha and Federal Capital Territory under the scenarios of 45, 90, and 135 kgN/ha, while the lowest values were achieved in Akwa Ibom in all scenarios. Figure 4b shows the obtained levels of WUE based on yields across Nigeria under the rate of 90 kg of nitrogen fertilizer per hectare, where the highest simulated WUE was 18.35 kg/mm in Federal Capital Territory and 16.90 kg/mm in Oyo, while the lowest was 8.16 kg/mm in Akwa Ibom. All maps of simulated WUE can be found in Appendix A (Figure A2).
A positive and significant (p < 0.01) correlation between the simulated WUE with the radiation and average temperature in maize growth period was found in the scenarios of 0 and 9 kgN/ha; this correlation became negative but also statistically significant (p < 0.01) in the scenarios of 45, 90, and 135 kgN/ha. Whereas, the simulated WUE and the precipitation during the maize growth period were negatively correlated (p < 0.01).

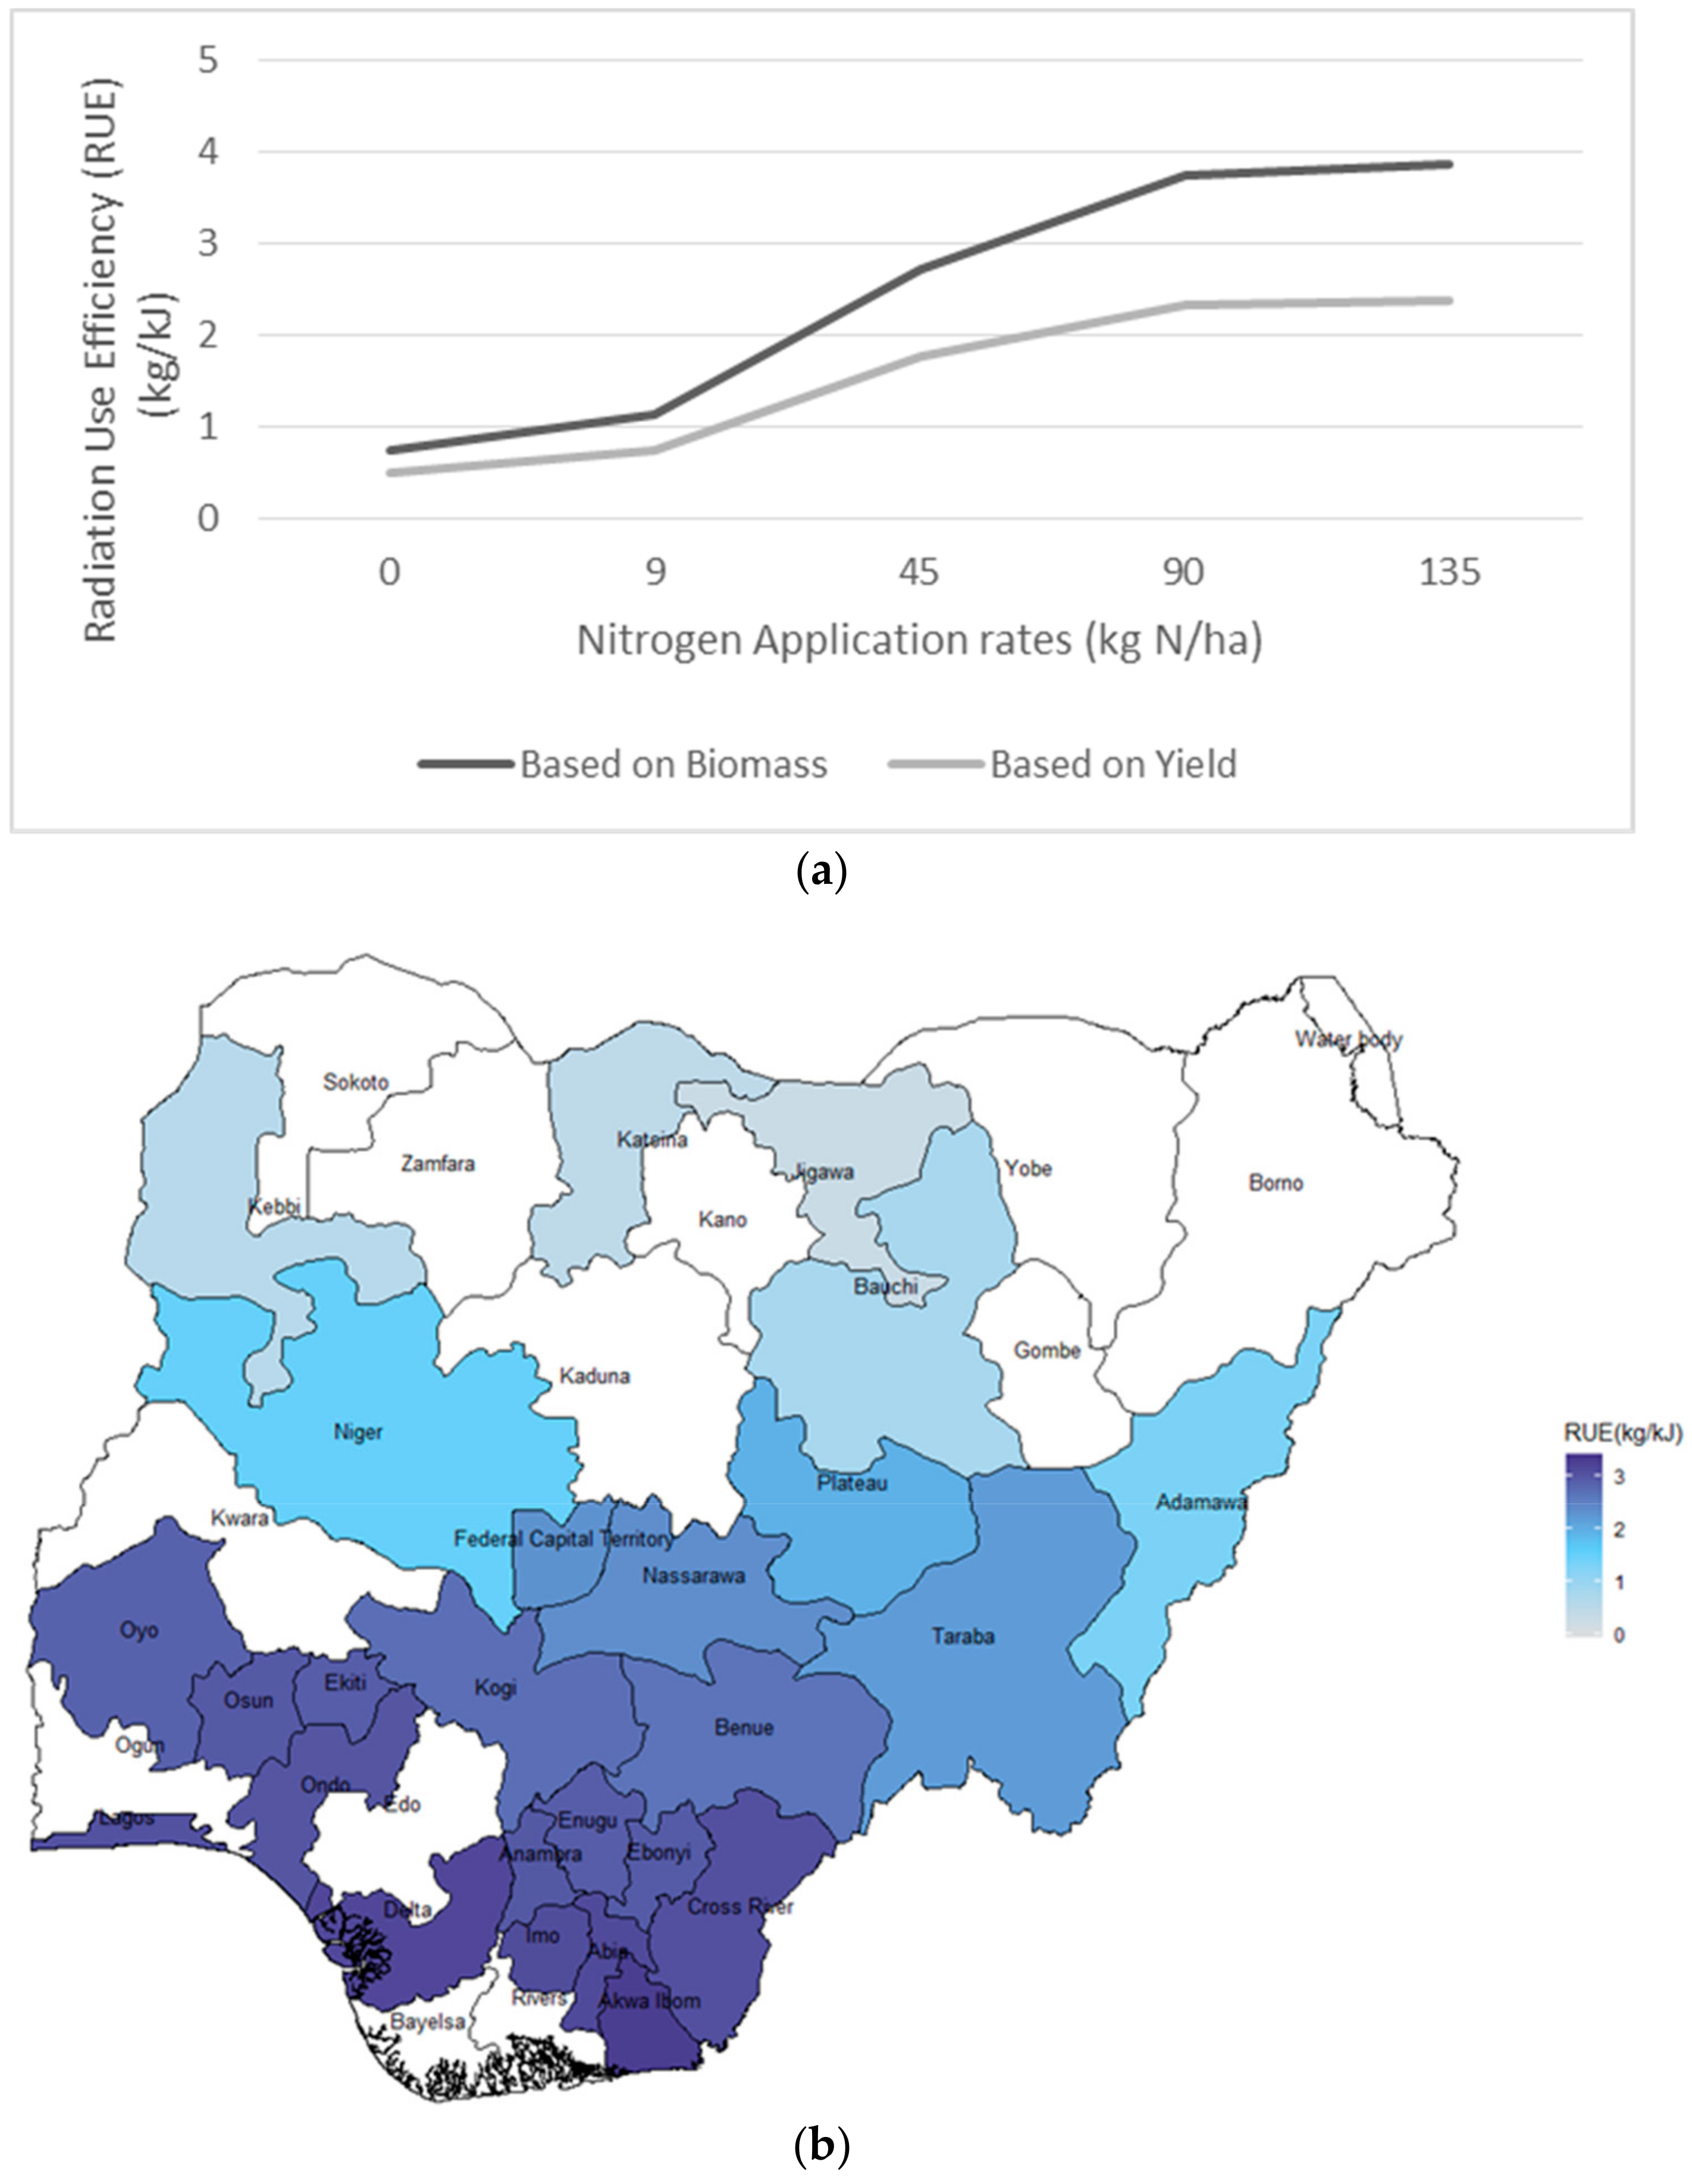
3.4. Simulated Radiation Use Efficiency RUE under Different Rates of Fertilizer Application

The graph of simulated Radiation Use Efficiency (RUE) based on yields and biomass across the different scenarios are shown in Figure 5a, which had a similar trend to Water Use Efficiency.
Figure 5b shows the differences in simulated RUE among the states of Nigeria under the fertilizer application of 90 kgN/ha (the maps of the other scenarios are shown in Figure A3 in Appendix A). In this case, Akawa Ibom presented the highest rate (3.26 kg/kJ) and Jigawa the lowest (0.27 kg/kJ). Delta was the state with the highest simulated RUE in the fertilizer scenarios of 0, 9, and 45 kgN/ha, and Akawa Ibom was for the scenarios of 90 and 135 kgN/ha. The lowest value of RUE was estimated in Jigawa.
According to the statistical analysis, there was a significant negative (p < 0.01) correlation between the simulated RUE with the radiation and average temperature during the maize growth period in the fertilizer scenarios of 9, 45, 90, and 135 kgN/ha. Additionally, a significant positive relationship (p < 0.01) was found between simulated RUE and precipitation during the maize growth period in all the fertilizer scenarios tested.

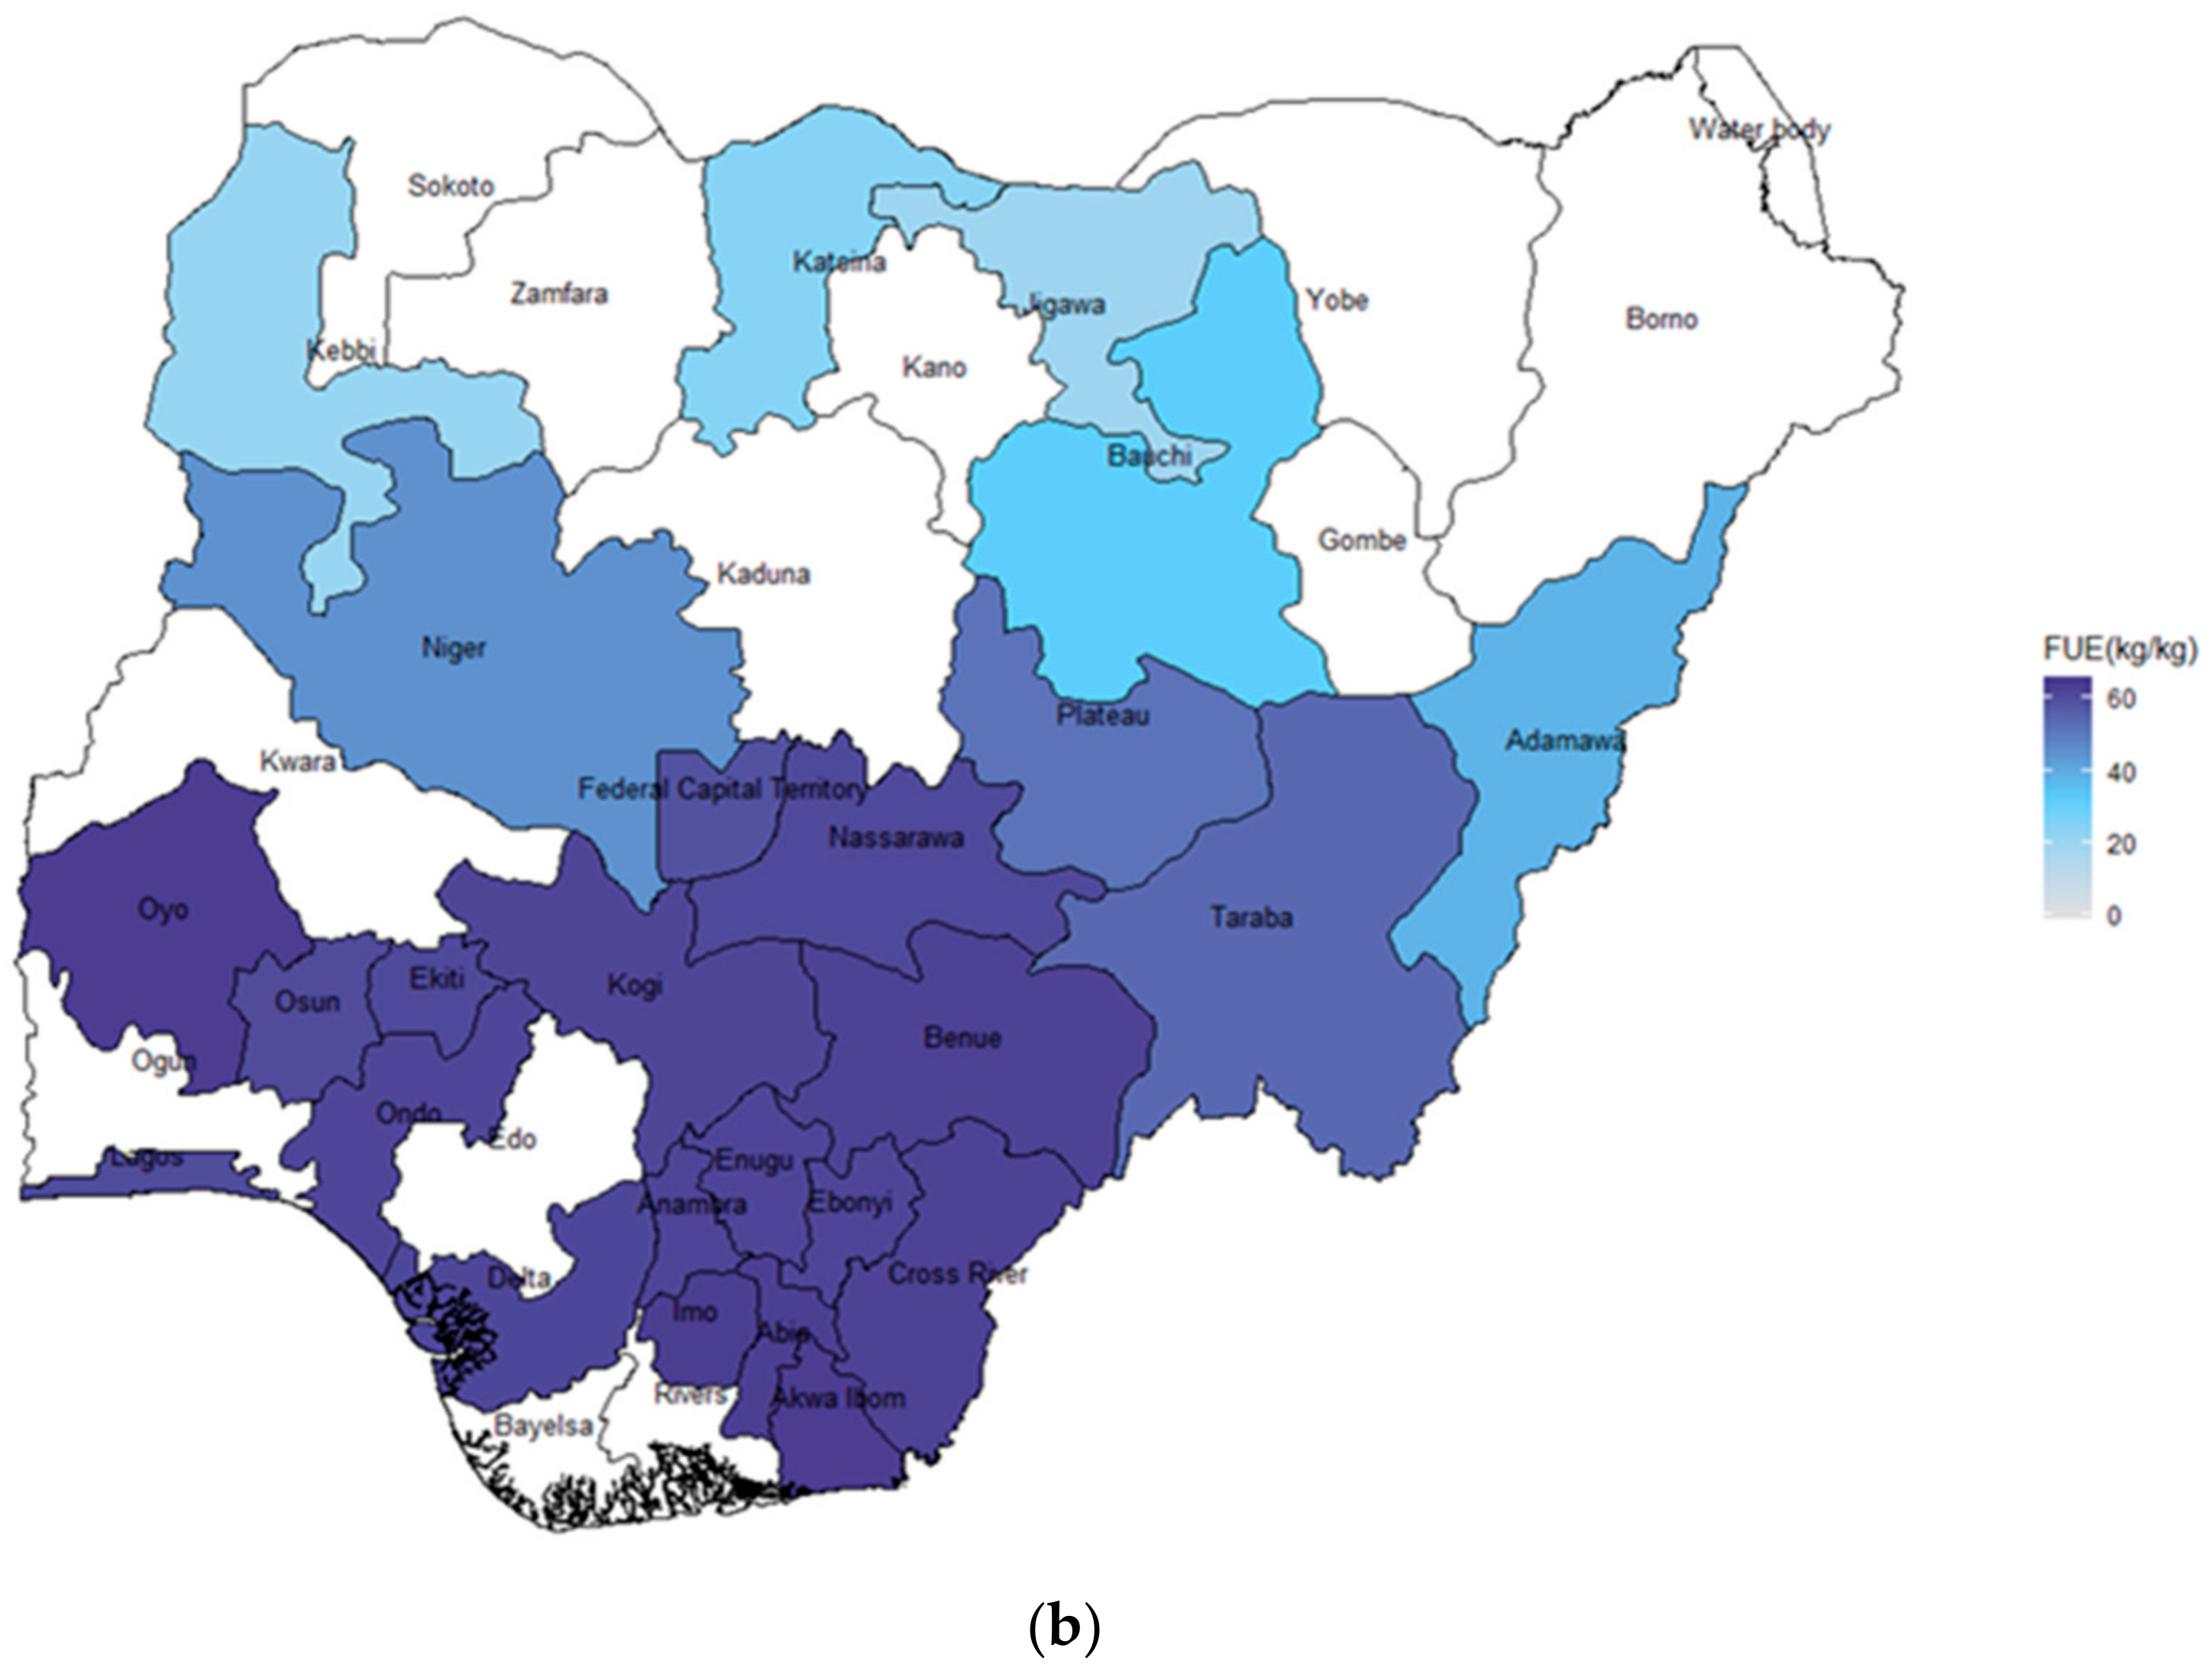
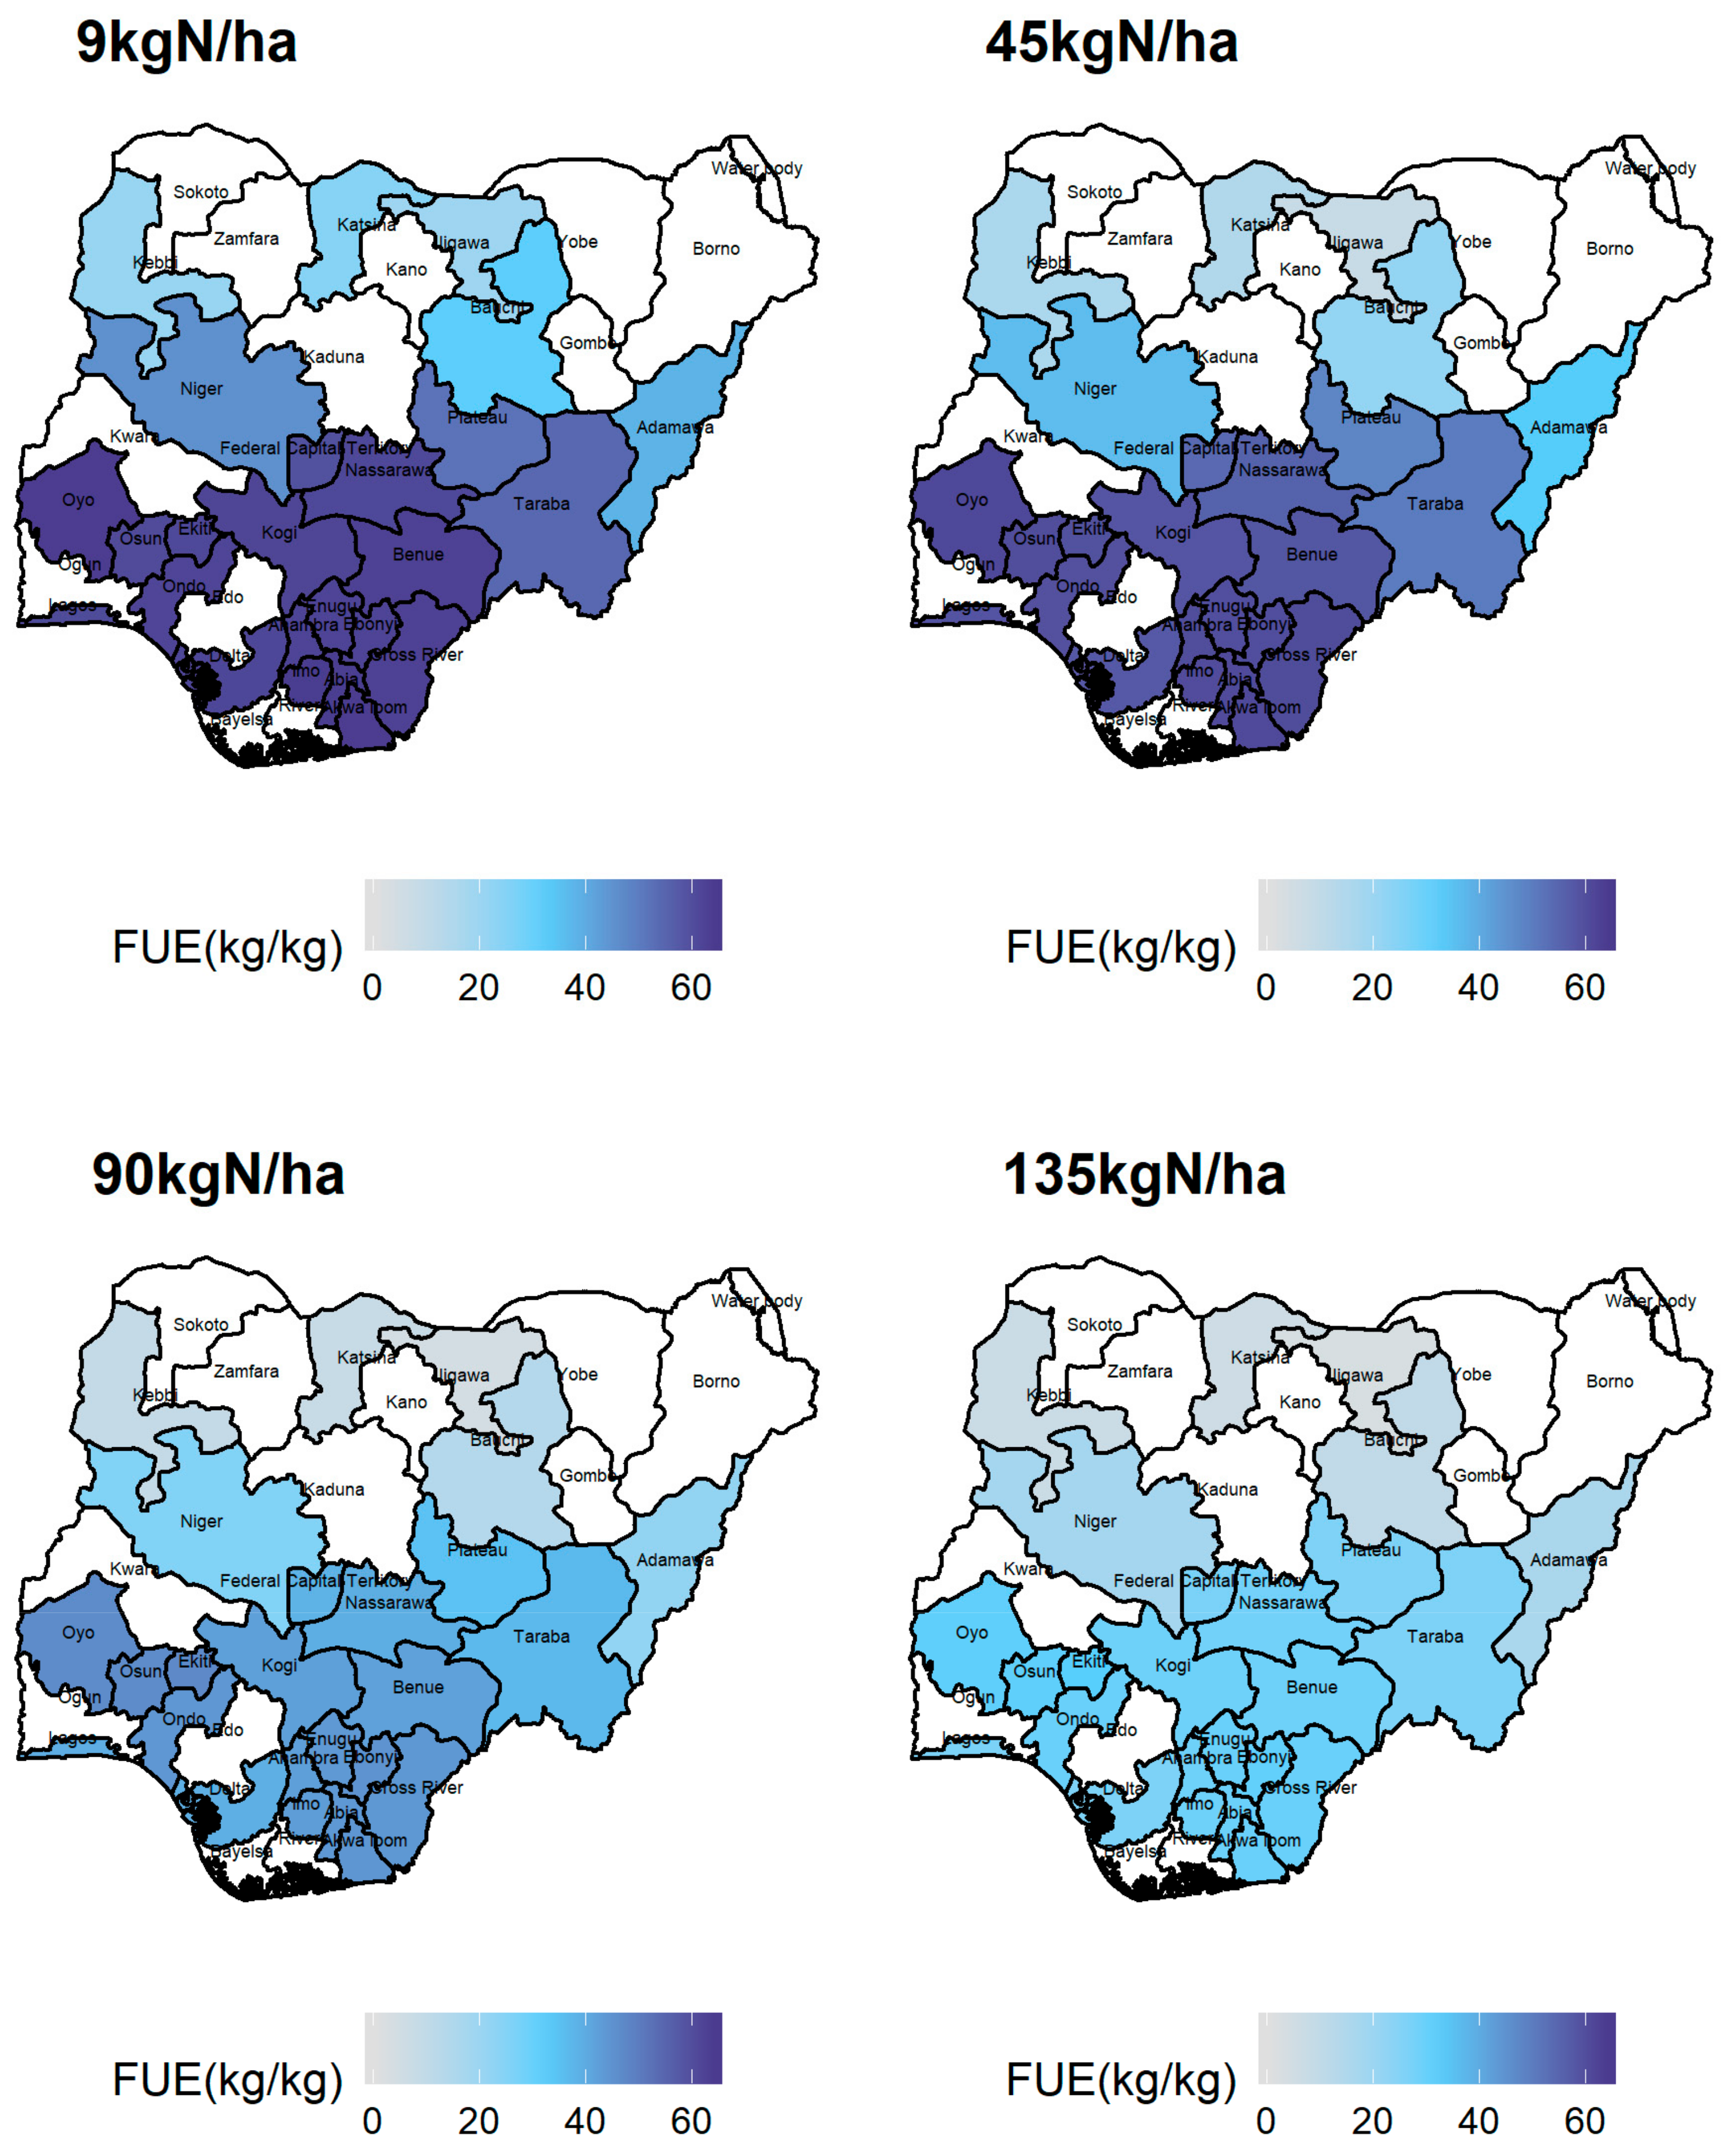
3.5. Simulated Fertilizer Use Efficiency FUE under the Different Rate of Fertilizer Application

The highest simulated Fertilizer Use Efficiency was estimated under the lowest rate of fertilizer application (9 kgN/ha), as can be seen in Figure 6a. The FUE decreased when larger quantities of fertilizer were applied. The increase in yield or biomass due to the addition of each kilogram of fertilizer constrained the feasible production due to the properties of the soil. Equation (3) was used to calculate the FUE:
FUE = (Maize yield or biomass under fertilizer conditions [kg] − Maize yield or biomass under unfertilized conditions [kg])/rate of fertilizer application [kg]
The south of Nigeria presented the most significant simulated FUE; Akwa Ibom and Oyo were the states with the biggest Fertilizer Use Efficiency under the scenarios of 9 and 45 kgN/ha, and Ekiti and Osun were for the scenarios of 90 and 135 kgN/ha. Meanwhile, Jigawa and Katsina were the states which reached the lowest FUE.
Figure 6b shows a map of Nigeria with the representation of the simulated FUE among the states under the application of 9 kgN/ha. Akwa Ibom had the highest FUE value (63.54 kg /kg) and Jigawa the lowest (19.57 kg /kg). The maps of FUE for the remaining scenarios can be observed in Figure A4 in Appendix A.
According to the statistical analysis, a significant (p < 0.01) negative correlation was found between the FUE and the radiation and average temperature during the maize growth period. Additionally, a positive significant (p < 0.01) correlation between FUE and precipitation in the growing season was identified.

4. Discussion

To meet the food demand of Nigeria’s increasing population, the yields have to increase. As the results show, fertilizer application was an effective way to increase yield in the maize crop, which responded well to the fertilizer application. The increased production due to the increase in fertilizer use has previously been observed for maize in sub-Saharan and Asian countries [40]. The recommendation is a combination of organic and mineral fertilizer or other soil conservation practices [2,41,42]. Other studies have concluded that the use of nitrogen in an efficient way to produce higher maize grain yield depending on variety and season.
We found that with higher amounts of fertilizer applied, the use efficiency decreased. This was also found in other studies [2,10,43,44]. Consequently, the increase in fertilizer application increases the ratio of fertilizer remaining unused by the plant. Some studies in China have even shown that the relationship between growth in fertilizer and increase in nitrogen losses to the environment is exponential [5]. As a result, the overuse of fertilizer comes with the risk of endangering the environment, especially soil and water resources [10,43,45,46].
FUE is affected by radiation and daily mean temperature, which have a negative correlation with it. It is also affected by precipitation, which is positively correlated. The soil condition in general and the soil’s water-holding capacity directly influence the N availability for plants [46]. Li et al. have also shown that water availability has a positive effect on FUE [47]. Higher radiation and temperature cause reduced microbiotic activity in the soil; this again reduces the N availability in the topsoil, which reduces the plant uptake of N and so limits the plant growth. This is how the negative correlation between radiation and temperature to FUE can be explained.
The states with the highest FUE were Lagos and Ekiti, depending on the fertilizer scenario. Generally, the states in the south with higher precipitation had higher FUE. So, here, the chance to increase yield by increasing FUE is the highest. It is possible to achieve this by adjusting time and area of fertilizer application to the need of the plants, improving the water-holding capacity of the soil, and breeding for higher N uptake in the plants [10,44,45,46,48]. Additionally, the use of controlled-release urea has been proven to be beneficial to the FUE [47].
For crops grown under rainfed conditions, high WUE is very important [16]. As Nigerian agriculture is entirely dependent on rainfall, finding ways to improve WUE is a top priority. In general, Maize is an efficient user of water [49]. Throughout Nigeria, we saw considerable differences in the WUE between the states. The highest WUE was reached in the states of Kebbi, Jigawa, and Federal Capital. This is interesting because Kebbi and Jigawa are both located in the North, which is a very dry and warm climate. An annual average temperature of 28.4 °C in Kebbi and 24.9 °C in Jigawa is estimated; both have annual precipitation around 800 mm, whereas Federal Capital Territory is in central Nigeria and has rainfall up to 1400 mm a year. The lowest values of WUE were found in Akwa Ibom, a humid forest area with much rainfall. This supports the thesis that the WUE is highest where the least water is available. Additionally, the correlation of precipitation to WUE was always negative.
We saw a positive correlation between mean temperature and radiation in the first two fertilizer scenarios (0 and 9 kgN/ha) and a negative correlation to WUE in the others (45, 90, and 135 kgN/ha). So, WUE seemed to improve with increasing mean temperature and radiation until 9 kgN/ha of fertilizer application, but not with further quantities.
Our results show that an increase in fertilizer application increased the WUE. As nitrogen becomes less limiting in plant growth, the plant can use more of the available water and thus is more efficient. Other studies have also shown increased WUE with increased fertilizer levels [16]. The same outcomes were found in experiments with wheat [50].
The effect of fertilizer on WUE can be increased by including other plants in the crop rotation [16]. WUE generally increases with reduced soil cultivation and length of fallow periods, and decreases with higher intensification [15]. As WUE is positively linked to the yield, fertilizer has an indirect effect on WUE because it promotes yield. The ideal amount of fertilizer depends on the type of soil, precipitation, and management practices [15]. Further strategies for improving WUE are breeding for drought adaptivity and stomatal frequency and adjusting the management in terms of planting date, tillage, and fertilizer application [49,51].
The solar radiation absorbed by vegetation is used in biophysical processes that control the production of biomass and the yield of crops at a potential rate. Since the RUE represents a relationship between dry matter produced and the intercepted photosynthetically active radiation (IPAR) during the crop growth cycle, in the current study, an increase of RUE was observed along with the rise of the biomass.
Not only the fertilizer impacts the RUE; precipitation also plays an important role. Some studies found a high impact of precipitation and N application rate over the RUE. The results show an increase of RUE in an environment with more precipitation and more use of nitrogen [52], as it can be observed in the Appendix A in Figure A3. This could be explained by the decrease of the ability of the photosynthetic organs in the plant to generate energy due to the lack of nitrogen.
Some of the limitations of this study include that model calibration was confined to only three states in Nigeria due to a lack of observations. Only one variety of maize and the same fertilizer application rates across the states were used in the simulations. A fixed planting date was used across the states, which might be an over-simplification of the reality as farmers may use different planting dates depending upon the suitable weather conditions.

Author Contributions

Conceptualization, A.K.S. and T.G.; Methodology, A.K.S.; Software, A.K.S.; Validation, G.L., H.B.K.; Formal Analysis, G.L., H.B.K.; Writing—Original Draft Preparation, G.L., H.B.K., A.K.S.; Writing—Review and Editing, T.G., F.E., A.K.S.

Funding

Work carried out under the project BiomassWeb within the GlobeE research programme. Funding by Federal Ministry of Education and Research (BMBF) of Germany is highly acknowledged.

Acknowledgments

We would like to thank Babacar Faye for his support in R scripts for generating the maps.

Conflicts of Interest

The authors declare no conflict of interest.

Appendix A

Figure A1. Map of Nigeria describing the simulated yields in some states under different scenarios: 0 kgN/ha; 9 kgN/ha; 45 kgN/ha; 90 kgN/ha; and 135 kgN/ha.
Sustainability 11 05114 g0a1
Figure A2. Map of Nigeria describing the simulated WUE based on yields in some states under different scenarios: 0 kgN/ha; 9 kgN/ha; 45 kgN/ha; 90 kgN/ha; and 135 kgN/ha.
Sustainability 11 05114 g0a2
Figure A3. Map of Nigeria describing the simulated RUE based on yields in some states under different scenarios: 0 kgN/ha; 9 kgN/ha; 45 kgN/ha; 90 kgN/ha; and 135 kgN/ha.
Sustainability 11 05114 g0a3
Figure A4. Map of Nigeria describing the simulated FUE based on yields in some states under different scenarios: 9 kgN/ha; 45 kgN/ha; 90 kgN/ha; and 135 kgN/ha.
Sustainability 11 05114 g0a4

References

  1. Ranum, P.; Peña-Rosas, J.P.; Garcia-Casal, M.N. Global maize production, utilization, and consumption: Maize production, utilization, and consumption. Ann. NY Acad. Sci. 2014, 1312, 105–112. [Google Scholar] [CrossRef] [PubMed]
  2. Vanlauwe, B.; Kihara, J.; Chivenge, P.; Pypers, P.; Coe, R.; Six, J. Agronomic use efficiency of N fertilizer in maize-based systems in sub-Saharan Africa within the context of integrated soil fertility management. Plant Soil 2011, 339, 35–50. [Google Scholar] [CrossRef]
  3. FAO. Country Brief: Nigeria. 2018. Available online: http://www.fao.org/giews/countrybrief/country.jsp?code=NGA (accessed on 15 February 2019).
  4. World Bank. Nigeria | Data. The World Bank. Available online: https://data.worldbank.org/country/nigeria?view=chart (accessed on 1 February 2019).
  5. Liu, J.; Pattey, E.; Miller, J.R.; McNairn, H.; Smith, A.; Hu, B. Estimating crop stresses, aboveground dry biomass and yield of corn using multi-temporal optical data combined with a radiation use efficiency model. Remote Sens. Environ. 2010, 114, 1167–1177. [Google Scholar] [CrossRef]
  6. Morris, M.; Kelly, V.A.; Kopicki, R.J.; Byerlee, D. Fertilizer Use in African Agriculture: Lessons Learned and Good Practice Guidelines; The World Bank: Washington, DC, USA, 2007. [Google Scholar]
  7. World Bank. Agricultural land (% of land area) | Data. The World Bank. Available online: https://data.worldbank.org/indicator/AG.LND.AGRI.ZS?contextual=default&end=2016&locations=NG&name_desc=false&start=1999http://www.fao.org/faostat/en/#data/RFBhttps://www.indexmundi.com/nigeria/area.html (accessed on 1 February 2019).
  8. FAO. FAOSTAT. Available online: http://www.fao.org/faostat/en/#data/QC (accessed on 15 February 2019).
  9. IITA. Transforming African Agriculture Through Research. IITA Annual Report; IITA: Ibadan, Nigeria, 2017; Available online: www.iita.org/annual-reports (accessed on 1 February 2019).
  10. Srivastava, A.K.; Mboh, C.M.; Gaiser, T.; Kuhn, A.; Ermias, E.; Ewert, F. Effect of mineral fertilizer on rain water and radiation use efficiencies for maize yield and stover biomass productivity in Ethiopia. Agric. Syst. 2019, 168, 88–100. [Google Scholar] [CrossRef]
  11. Umoh, G.S. Resource Use Efficiency in Urban Farming: An Application of Stochastic Frontier Production Function. Int. J. Agric. Biol. 2006, 8, 38–44. [Google Scholar]
  12. Adeyemo, R.; Kuhlmann, F. Resource Use Efficiency in Urban Agriculture in Southwestern Nigeria. Tropicultura 2009, 27, 49–53. [Google Scholar]
  13. Singh, B.; Singh, Y.; Sekhon, G.S. Fertilizer-N use efficiency and nitrate pollution of groundwater in developing countries. J. Contam. Hydrol. 1995, 20, 167–184. [Google Scholar] [CrossRef]
  14. Xu, G.; Fan, X.; Miller, A.J. Plant Nitrogen Assimilation and Use Efficiency. Annu. Rev. Plant Biol. 2012, 63, 153–182. [Google Scholar] [CrossRef] [Green Version]
  15. Hatfield, J.L.; Sauer, T.J.; Prueger, J.H. Managing Soils to Achieve Greater Water Use Efficiency. Agron. J. 2001, 93, 271. [Google Scholar] [CrossRef]
  16. Varvel, G.E. Monoculture and Rotation System Effects on Precipitation Use Efficiency of Corn. Agron. J. 1994, 86, 204. [Google Scholar] [CrossRef]
  17. Condon, A.G. Breeding for high water-use efficiency. J. Exp. Bot. 2004, 55, 2447–2460. [Google Scholar] [CrossRef] [PubMed] [Green Version]
  18. Hassanli, A.M.; Ebrahimizadeh, M.A.; Beecham, S. The effects of irrigation methods with effluent and irrigation scheduling on water use efficiency and corn yields in an arid region. Agric. Water Manag. 2009, 96, 93–99. [Google Scholar] [CrossRef]
  19. Stockle, C.O.; Kiniry, J.R. Variability in crop radiation-use efficiency associated with vapor-pressure deficit. Field Crop. Res. 1990, 25, 171–181. [Google Scholar] [CrossRef]
  20. Srivastava, A.K.; Mboh, C.M.; Gaiser, T.; Ewert, F. Impact of climatic variables on the spatial and temporal variability of crop yield and biomass gap in Sub-Saharan Africa—A case study in Central Ghana. Field Crop. Res. 2017, 203, 33–46. [Google Scholar] [CrossRef]
  21. Srivastava, A.K.; Mboh, C.M.; Gaiser, T.; Webber, H.; Ewert, F. Effect of sowing date distributions on simulation of maize yields at regional scale—A case study in Central Ghana, West Africa. Agric. Syst. 2016, 147, 10–23. [Google Scholar] [CrossRef]
  22. Trawally, D.; Webber, H.; Agyare, W.A.; Fosu, M.; Naab, J.; Gaiser, T. Effect of heat stress on two varieties under irrigation in northern region of Ghana. Int. J. Biol. Chem. Sci. 2015, 9, 1571–1587. [Google Scholar]
  23. Eyshi Rezaei, E.; Siebert, S.; Ewert, F. Impact of data resolution on heat and drought stress simulated for winter wheat in Germany. Eur. J. Agron. 2015, 65, 69–82. [Google Scholar] [CrossRef]
  24. Zhao, G.; Webber, H.; Hoffmann, H.; Wolf, J.; Siebert, S.; Ewert, F. The implication of irrigation in climate change impact assessment: a European-wide study. Glob. Chang. Biol. 2015, 21, 4031–4048. [Google Scholar] [CrossRef]
  25. Webber, H.; Zhao, G.; Wolf, J.; Britz, W.; de Vries, W.; Gaiser, T.; Hoffmann, H.; Ewert, F. Climate change impacts on European crop yields: Do we need to consider nitrogen limitation? Eur. J. Agron. 2015, 71, 123–134. [Google Scholar] [CrossRef]
  26. Gaiser, T.; Perkons, U.; Küpper, P.M.; Kautz, T.; Uteau-Puschmann, D.; Ewert, F.; Endwers, A.; Krauss, G. Modeling biopore effects on root growth and biomass production on soils with pronounced sub-soil clay accumulation. Ecol. Model. 2013, 256, 6–15. [Google Scholar] [CrossRef]
  27. Franke, A.C.; Haverkort, A.J.; Steyn, J.M. Climate Change and Potato Production in Contrasting South African Agro-Ecosystems 2. Assessing Risks and Opportunities of Adaptation Strategies. Potato Res. 2013, 56, 51–66. [Google Scholar] [CrossRef] [Green Version]
  28. Wolf, J. User Guide for LINTUL5: Simple Generic Model for Simulation of Crop Growth Under Potential, Water Limited and Nitrogen, Phosphorus and Potassium Limited Conditions; Wageningen University: Wageningen, The Netherlands, 2012. [Google Scholar]
  29. Addiscott, T.M.; Whitmore, A.P. Simulation of solute leaching in soils of differing permeabilities. Soil Use Manag. 1991, 7, 94–102. [Google Scholar] [CrossRef]
  30. Corbeels, M.; Mcmurtrie, R.; Pepper, D.; O’Connell, A.M. A process-based model of nitrogen cycling in forest plantations: Part I. Structure, calibration and analysis of the decomposition model | Request PDF. Ecol. Model. 2005, 187, 426–448. [Google Scholar] [CrossRef]
  31. Allen, R.G.; Pereira, L.S.; Raes, D.; Smith, M. Crop Evapotranspiration—Guidelines for Computing Crop Water Requirements—FAO Irrigation and Drainage Paper 56; FAO: Rome, Italy, 1998; p. 15. [Google Scholar]
  32. Ruane, A.C.; Goldberg, R.; Chryssanthacopoulos, J. Climate forcing datasets for agricultural modeling: Merged products for gap-filling and historical climate series estimation. Agric. For. Meteorol. 2015, 200, 233–248. [Google Scholar] [CrossRef] [Green Version]
  33. Rienecker, M.M.; Suarez, M.J.; Gelaro, R.; Todling, R.; Bacmeister, J.; Liu, E.; Bosilovich, M.G.; Schubert, S.D.; Takacs, L.; Kim, G.; et al. MERRA: NASA’s Modern-Era Retrospective Analysis for Research and Applications. J. Clim. 2011, 24, 3624–3648. [Google Scholar] [CrossRef]
  34. Saha, S.; Moorthi, S.; Wu, X.; Wang, J.; Nadiga, S.; Tripp, P.; Behringer, D.; Hou, Y.; Chuang, H.; Iredell, M.; et al. The NCEP Climate Forecast System Reanalysis. Bull. Amer. Meteor. Soc. 2010, 91, 1015–1058. [Google Scholar] [CrossRef]
  35. Rawls, W.J.; Ahuja, L.R.; Brakensiek, D.L.; Shirmohammadi, A. Handbook of Hydrology; McGraw-Hill: New York, NY, USA, 1993. [Google Scholar]
  36. Boogaard, H.L.; van Diepen, C.A.; Rotter, R.P.; Cabrera, J.M.C.A.; van Laar, H.H. WOFOST 7.1; User’s Guide for the WOFOST 7.1 Crop Growth Simulation Model and WOFOST Control Center 1.5; Wageningen, SC-DLO, 1998. Techn. Doc. 52; Wageningen University: Wageningen, The Netherlands, 1998; p. 144. [Google Scholar]
  37. Boons-Prins, E.R.; PenningdeVries, F.W.T. Crop-Specific Simulation Parametersfor Yield Forecasting Across the European Community; Wageningen University: Wageningen, The Netherlands, 1993; p. 201. [Google Scholar]
  38. Ceglar, A.; Črepinšek, Z.; Kajfež-Bogataj, L.; Pogacar, T. The simulation of phenological development in dynamic crop model: The Bayesian comparison of different methods. Agric. For. Meteorol. 2011, 151, 101–115. [Google Scholar] [CrossRef]
  39. Papula, A. Mathematik Für Chemiker; Enke-Verlag: Stuttgart, Germany, 1982. [Google Scholar]
  40. Tsujimoto, Y.; Rakotoson, T.; Tanaka, A.; Saito, K. Challenges and opportunities for improving N use efficiency for rice production in sub-Saharan Africa. Plant Prod. Sci. 2019, 1–15. [Google Scholar] [CrossRef]
  41. Onasanya, R.O.; Aiyelari, O.P.; Onasanya, A.; Oikeh, S.; Nwilene, F.E.; Oyelakin, O.O. Growth and Yield Response of Maize (Zea mays L.) to Different Rates of Nitrogen and Phosphorus fertilizers in Southern Nigeria. World J. Agric. Sci. 2009, 5, 400–407. [Google Scholar]
  42. Bosede, A.J. Economic assessment of fertilizer use and integrated practices for environmental sustainability and agricultural productivity in Sudan savannah zone, Nigeria. AJAR 2010, 5, 338–343. [Google Scholar]
  43. Fowler, D.B.; Brydon, J.; Darroch, B.A.; Entz, M.H.; Johnston, A.M. Environment and Genotype Influence on Grain Protein Concentration of Wheat and Rye. Agron. J. 1990, 82, 655. [Google Scholar] [CrossRef]
  44. Cassman, K.G.; Dobermann, A.; Walters, D.T. Agroecosystems, Nitrogen-use Efficiency, and Nitrogen Management. AMBIO A J. Hum. Environ. 2002, 31, 132–140. [Google Scholar] [CrossRef] [PubMed]
  45. Cui, Z.; Wang, G.; Yue, S.; Wu, L.; Zhang, W.; Zhang, F.; Chen, X. Closing the N-Use Efficiency Gap to Achieve Food and Environmental Security. Environ. Sci. Technol. 2014, 48, 5780–5787. [Google Scholar] [CrossRef]
  46. Bryan, B.A.; King, D.; Zhao, G. Influence of management and environment on Australian wheat: Information for sustainable intensification and closing yield gaps. Environ. Res. Lett. 2014, 9, 044005. [Google Scholar] [CrossRef]
  47. Li, G.; Zhao, B.; Dong, S.; Zhang, J.; Liu, P.; Vyn, T.J. Impact of controlled release urea on maize yield and nitrogen use efficiency under different water conditions. PLoS ONE 2017, 12, e0181774. [Google Scholar] [CrossRef] [PubMed]
  48. Reeves, D.W.; Wood, C.W.; Touchton, J.T. Timing Nitrogen Applications for Corn in a Winter Legume Conservation-Tillage System. Agron. J. 1993, 85, 98. [Google Scholar] [CrossRef]
  49. Huang, R.; Birch, C.J.; George, D.L. Water Use Efficiency in Maize Production—The Challenge and Improved Strategies. In Proceedings of the 6th Water to Gold Triennial Conference, Maize Ass, Griffith, NSW, Australia, 21–23 February 2006. [Google Scholar]
  50. Kröbel, R.; Campbell, C.A.; Zentner, R.P.; Lemke, R.; Steppuhn, H.; Desjardins, R.L.; De Jong, R. Nitrogen and phosphorus effects on water use efficiency of spring wheat grown in a semi-arid region of the Canadian prairies. Can. J. Soil Sci. 2012, 92, 573–587. [Google Scholar] [CrossRef]
  51. Bramley, H.; Turner, N.C.; Siddique, K.H.M. Water Use Efficiency. In Genomics and Breeding for Climate-Resilient Crops: Vol. 2 Target Traits; Kole, C., Ed.; Springer: Berlin/Heidelberg, Germany, 2013; pp. 225–268. [Google Scholar]
  52. Miranzadeh, H.; Emam, Y.; Seyyed, H.; Zare, S. Productivity and Radiation Use Efficiency of Four Dryland Wheat Cultivars under Different Levels of Nitrogen and Chlormequat Chloride. J. Agric. Sci. Tech. 2011, 13, 339–351. [Google Scholar]
Figure 1. Map illustrating the simulation units over the whole of Nigeria.
Sustainability 11 05114 g001
Figure 2. Comparison of simulated and observed maize yield in three states, namely, Edo, Kwara, and Ogun, in Nigeria. The bars are values of standard deviation.
Sustainability 11 05114 g002
Figure 3. Simulated maize yields and biomass: (a) Graph of the simulated yields and biomass under different scenarios of fertilizer application rates; (b) Map of Nigeria showing the simulated maize yields across the states under the application of 90 kg of nitrogen per hectare.
Sustainability 11 05114 g003
Figure 4. Simulated Water Use Efficiency (WUE): (a) Graph of the simulated WUE based on yield and biomass under different scenarios of fertilizer application rate; (b) Map of Nigeria describing the simulated WUE based on yield in states under the application of 90 kg of nitrogen per hectare.
Sustainability 11 05114 g004
Figure 5. Simulated Radiation Use Efficiency (RUE): (a) Graph of the simulated RUE based on yields and biomass under different scenarios of rate of fertilizer; (b) Map of Nigeria describing the simulated RUE across the states under the application of 90 kg of nitrogen per hectare.
Sustainability 11 05114 g005
Figure 6. Simulated Fertilizer Use Efficiency (FUE): (a) Graph of the simulated FUE based on yields and biomass under different scenarios of rate of fertilizer; (b) Map of Nigeria describing the simulated FUE across the states under the application of 9 kg of nitrogen per hectare.
Sustainability 11 05114 g006aSustainability 11 05114 g006b
Table 1. Crop parameters of LINTUL5 used in the study for long cycle variety “Obatanpa”.
NameDescription Unit Value
Crop parameters
TSUM1Temperature sum from emergence to anthesis°C/day1060
TSUM2Temperature sum from anthesis to maturity °C/day990
TBASEMLower threshold temperature for emergence°C8.0
TEFFMXMaximum effective temperature for emergence°C30.0
TSUMEMTemperature sum from sowing to emergence°C56.0
RUE-0.0Radiation use efficiency at development stage 0g/MJ3.8
RUE-1.25Radiation use efficiency at development stage 1.25g/MJ3.8
RUE-1.50Radiation use efficiency at development stage 1.50g/MJ3.0
RUE-1.75Radiation use efficiency at development stage 1.75g/MJ2.0
RUE-2.0Radiation use efficiency at development stage 2.0g/MJ1.4
SLATB-0.0Specific leaf area at development stage 0m2/g0.022
SLATB-0.9Specific leaf area at development stage 0.9m2/g0.03
SLATB-1.0Specific leaf area at development stage 1.0m2/g0.032
SLATB-2.0Specific leaf area at development stage 2.0m2/g0.02
LAI critical Critical leaf area beyond which leaves die duem2/m24
to self shading
RGRLAIMaximum relative increase in LAIha/ha/day0.02
ROOTDIInitial rooting depthm0.1
ROOTDMMaximum rooting depth m1
RRDMAXMaximum rate of increase in rooting depthm0.012
TDWIInitial total crop dry weight kg/ha5

