Article

The Technical Efficiency of French Regional Airports and Low-Cost Carrier Terminals

1
Department of Marketing, Logistics and Operations Management, G. Brint Ryan College of Business, University of North Texas, Denton, TX 76203, USA
2
Department of Information Technology and Decision Science, G. Brint Ryan College of Business, University of North Texas, Denton, TX 76203, USA
*
Author to whom correspondence should be addressed.
Sustainability 2019, 11(18), 5107; https://doi.org/10.3390/su11185107
Submission received: 3 September 2019 / Revised: 13 September 2019 / Accepted: 17 September 2019 / Published: 18 September 2019
(This article belongs to the Special Issue Toward Sustainability: Airport Risk Assessment)

Abstract

:
In France, the regional airport’s demand for services is facing challenges due to the continuous expansion of the high-speed train, high-speed line, and highway networks. This study focuses on the viability of regional airports in France through technical efficiency using data envelopment, principle component analysis, Malmquist productivity index, and regression analysis using bootstrapping. To face the current competitive environment, the regional airports in France adopted strategies, such as the construction of low-cost carrier (LCC)-dedicated terminals (LCCTs) with lower expenses to attract more LCCs, increasing non-aeronautical revenue, and hosting regional hubs of LCCs. This is the first study that analyzes all of the French regional airports. The findings indicate that the existence of LCCTs positively affects technical efficiency on the airport’s performance, and share of LCCs at a regional airport leads to neither the efficiency nor the profit level.

1. Introduction

An efficiency (or performance) measurement of an airport’s management and operations is one of the critical issues to ensure that resources are used efficiently [1] and to verify that policies are applied effectively. The major issues of policy effectiveness are privatization [2], corporatization [3], regionalization [4], over-investment in regional airports [5], mode of airport governance [6], ownership [7], and economic regulation [8]. Some researchers have analyzed airports and measured their efficiency and effectiveness with different regional scopes, such as the major hub airports of the world [9] or airports on continents such as Europe [10], Latin America [11], Asia [12], and Northeast Asia [13]. Other researchers have examined countries like the United States [14], Britain [15], France [1], Italy [16], Spain [3], China [17], Japan [5], Korea [18], and Brazil [6]. This measurement gives insight into the operating characteristics and performance (efficiency) of airports [10].
Airport management and operations vary widely by country, size, location, demand, airline, and competitive environment, especially substitute transport modes. The presence of an efficient surface transportation alternative, such as High-Speed Trains (HST), High-Speed Line (HSL), and expansion highways, has created pressure on airlines and airport terminals [19]. Particularly, the HST has a strong negative impact on domestic air markets [20]. Airports are also recognized as having a catalytic effect on economic growth and investment, and they compete for airline services to ensure global connectivity for the communities they serve [8]. This study focuses on the viability of regional airports in France that provide global or regional connectivity, considering technical efficiency (TE) as a performance measurement, how other variables influence efficiency, and how efficiency changes operations. The variables include recent drivers of change, such as a change in the source of airport revenue, labor productivity, operational cost-effectiveness, a decline of state control [21], presence or ratio of low-cost carriers (LCCs) [22], and LCC-dedicated terminals (LCCTs), and the variables show how various factors influence the use of airports in France. This paper is organized as follows: Section 2 describes French airports and privatization. Section 3 measures technical efficiency by applying the data envelopment analysis-principal component analysis (DEA-PCA) and Malmquist Productivity Index. Section 4 presents the discussion and implications focusing on LCCs and LCCTs, and Section 5 concludes.

2. Review of French Airports and Privatization

The DGAC (French Civil Aviation Authority) classifies airports by their annual number of passengers in six different groups: (1) Paris airports (Charles-de-Gaulle, CDG; Orly, ORY), (2) Large airports located in metropolitan cities aside from Paris, (3) DOM-TOM (Overseas France consists of all the French-administered territories outside of the European continent.) airports located in the main cities in overseas France outside the European continent, (4) Middle airports with over 4,000,000 passengers, (5) Small airports with over 85,000 passengers, and (6) Other airports with over 500 passengers (see Table 1). The number of airports in each category varies from year to year, particularly for the Middle, Small, and Other airports. Also, a major airport in the DOM-TOM was added in 2011 (Mayotte-Dzaoudzi-Pamandzi, DZA) after the airport operator changed to the SNC-Lavalin airport company.
The number of Other airports decreased from 49 airports in 2006 to 18 airports in 2012. The average workload unit (WLU = cargo tonnage + [0.1 × passenger number]) for the Large airport group handled 539,901 passengers per year from 2006 to 2012. In comparison, the DOM-TOM airports handled only 26.2% of the amount handled by Large airports, Middle airports, 16.1%, Small airports, 3.8%, and for Others, 0.3% (see Table 2). French airport traffic is centralized in Paris, and in 2012, it handled 52.9% of the total passengers in France. With the inclusion of the Beauvais Airport (BVA), located 85 km north of Paris and mostly used by charters and LCCs, 55.2% of the airport traffic was accounted for. Regional airports handled 41%, and Large airports handled 30.6% (74.7% regional airports in 2012) of the total passengers in France. Therefore, three Paris airports (CDG, ORY, BVA) and nine Large airports handled 95.2% of all passengers in France in 2012. Large airports led with an annual growth rate of 3.6%, compared to 1.7% for the two Paris airports and −0.3% for DOM-TOM airports from 2011 to 2014 (see Table 3). The annual growth rate is due, in a large part, to the growth rate of LCC traffic, which was 13.7% of the Large airports despite rates of 2.8% in Paris and −3.9% for other airports (including Middle, Small, and Others) in 2011/2012.
The state-owned regional airports in France are managed exclusively under concession agreements by the Chambers of Commerce and Industry (Chambres de Commerce et d’Industrie, CCI), which are public entities in charge of the promotion of the local economy. The French Government owns at least 60% of the airports, CCIs at least 25%, and local government 15%. The law established on August 13, 2004, decentralized airport ownership to improve competency by creating companies, particularly local public entities (CCIs), to own, manage, and operate airports at the regional level [23]. The law established on April 20, 2005, focused on modernizing and enhancing the competitiveness of state-owned airports through corporatization and privatization. The legal status of the Paris Airport (Aéroport de Paris, ADP) changed from a public entity to a private company and is now listed on the Paris stock exchange, full privatization was planned through selling the government’s 50.6% stake [24]. The main challenge for the French airports is the privatization that has been focused on Paris (ADP) and major regional airports (BOD, LYS, NCE, TLS) for some years [25,26]. The long-awaited privatization is in the process of turning over the state-owned shares of regional airports to the private sector, mainly French companies, and of ADP to the public. The purpose of privatization is to secure viability by improving the airports’ efficiency and competitiveness, as well as avoiding the financial burdens associated with subsidizing airport capital and expenses. The concession agreements for eight Large airports (Bordeaux—BOD, Toulouse—TLS, Nice—NCE, Montpellier—MPL, Marseille—MRS, Lyon—LYS, Strasbourg—SXB, Nantes—NTE) and one DOM-TOM airport (Martinique—FDF) were transferred to airport management companies from 2007 to 2014. The transfers include satellite airports of Large airports, such as Aix-les-Milles, Marignane-Berre, Saint-Nazaire-Motoir, Cannes-Mandelieu, and Lyon-Bron [25,27].
Decree number 2014-795 issued on July 11, 2014, privatized the TLS airport, representing 49.99% of the French state’s stake. The TLS airport’s managing company, Aéroport de Toulouse-Blagnac (ATB), bought the stake in 2015 [23,26]. Based on the Macron Law established on August 6, 2015, by the provision of the ordinance of August 20, 2014, the French state would sell the majority of the share capital of publicly-owned companies in the private sector if the number of employees exceeded 500 or turnover exceeded €75 million [25]. For many years, government-owned and controlled airports have shifted toward private sector funding through partial or full privatization of airports [28]. The LYS and NCE airports are the candidate airports for selling the state-owned share (60%) to a private company. LYS was sold to a Vinci airport consortium for the value of €535 m in July 2016 [29].

3. Research Methodology

We collected data from all of the 99 regional airports in France from 2006 to 2012 [30,31], excluding two airports in Paris to avoid the heterogeneity that they would impose on the dataset [1]. This study includes data on 535 total observations from 2006 to 2012, 433 (81%) observations of valid data for data envelopment analysis (DEA), and the principal component analysis (PCA) with at least one input and one output for each airport.

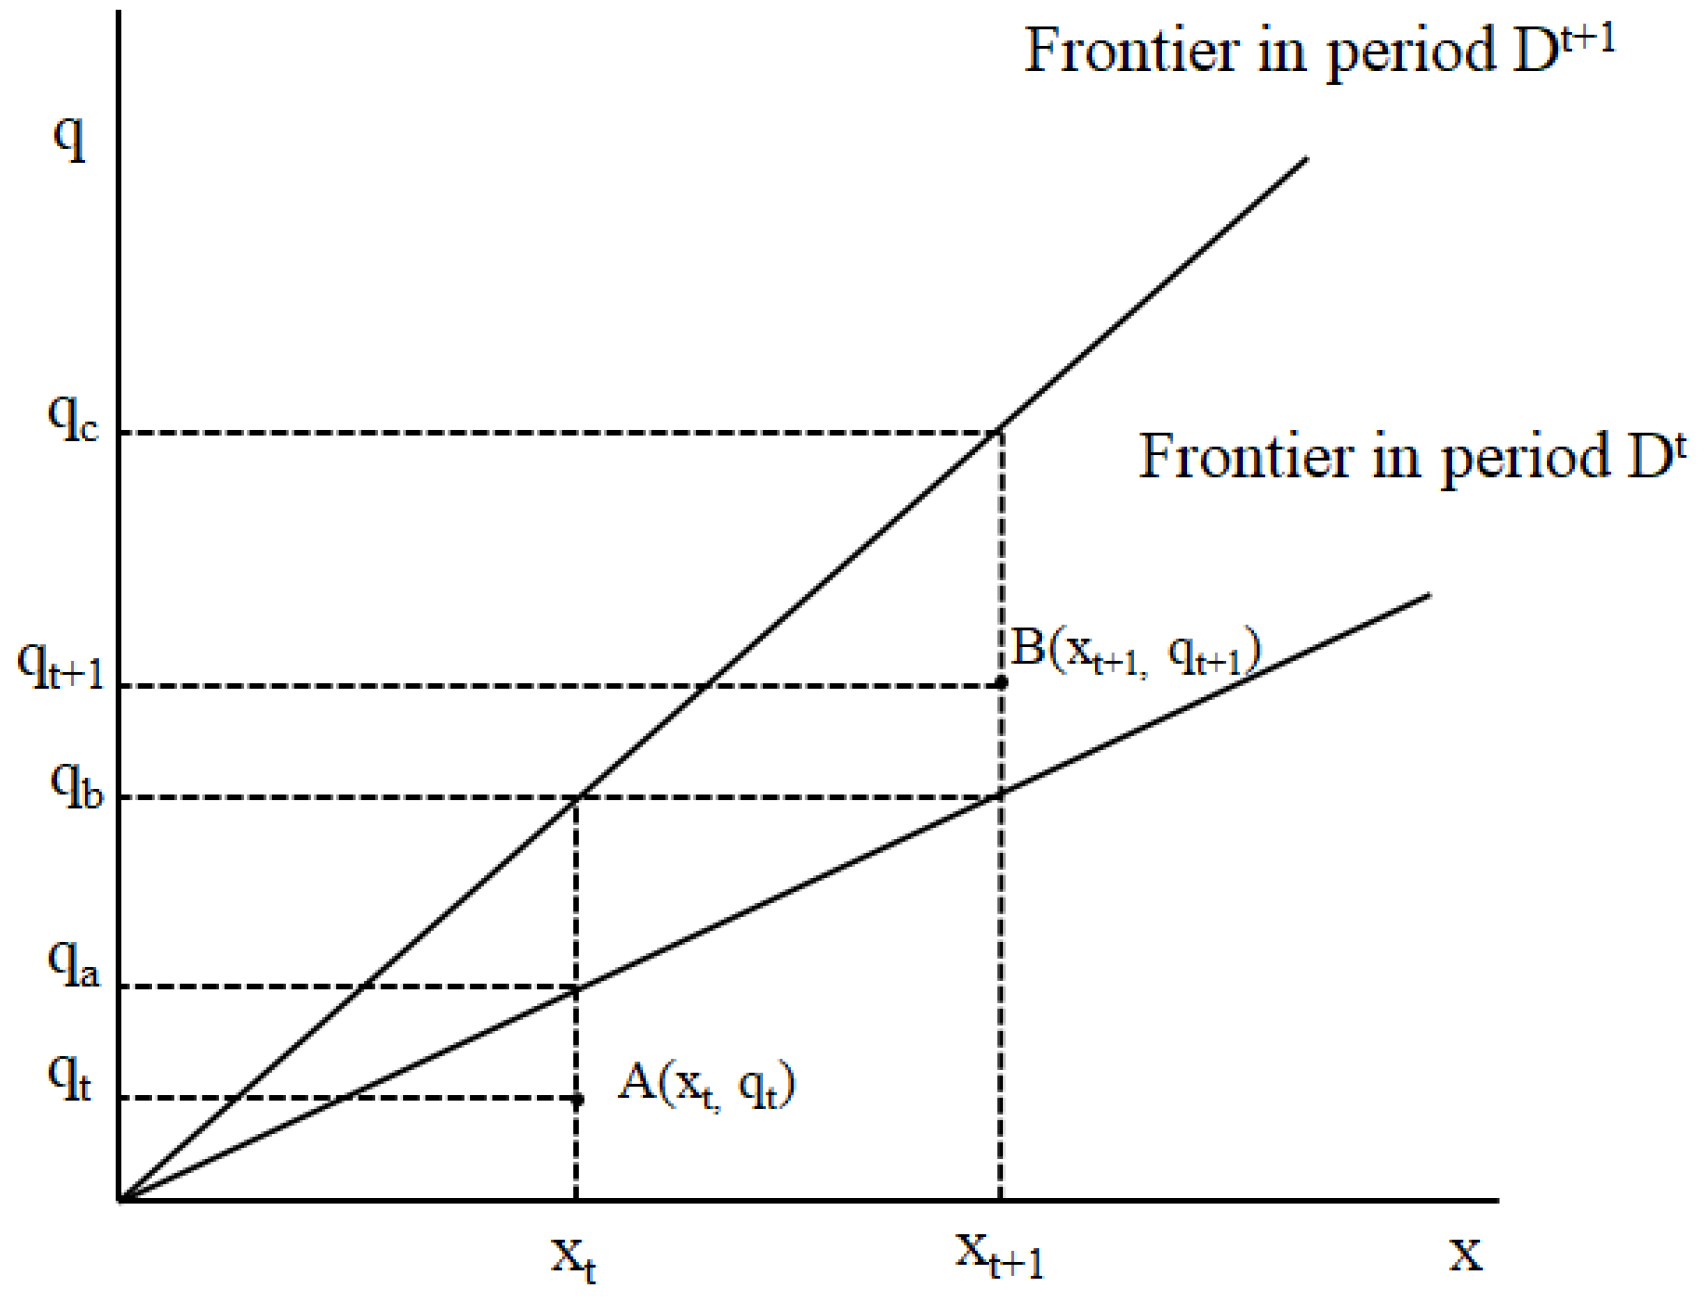
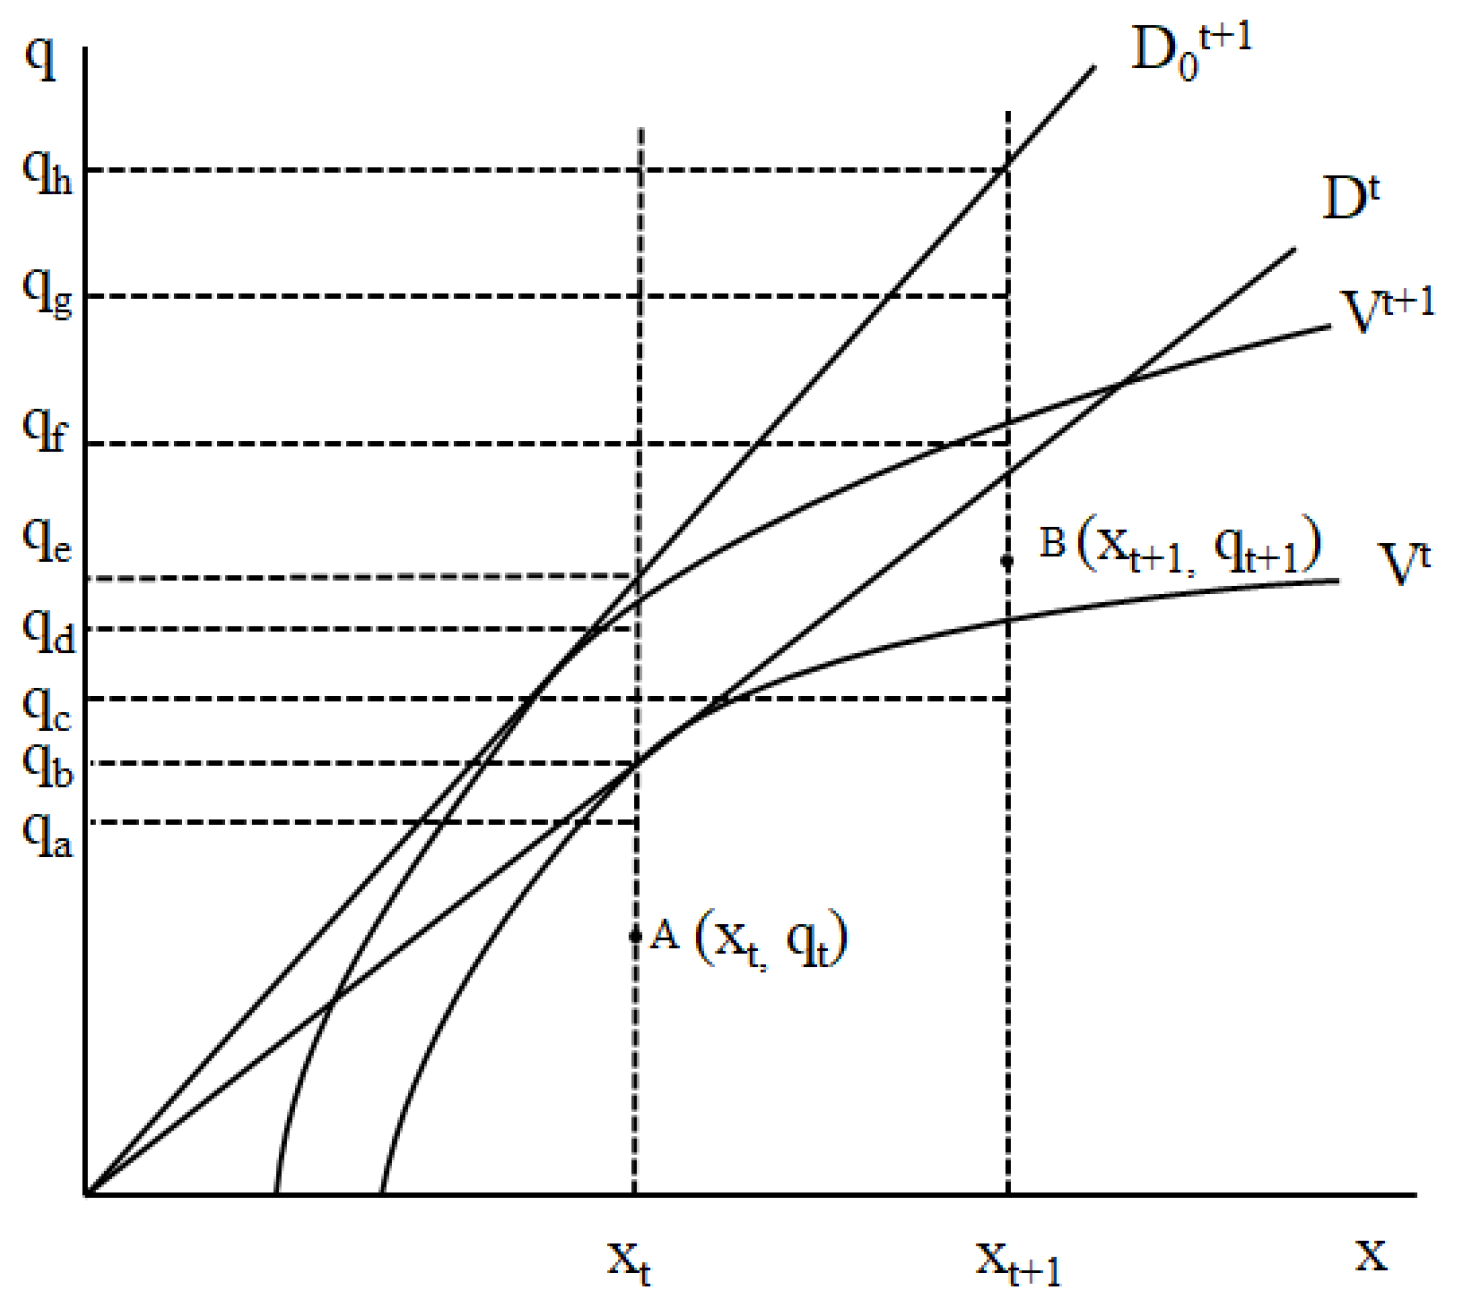
3.1. Data Envelopment Analysis-Principal Component Analysis (DEA-PCA) and Malmquist Productivity Index

We used a three-stage model where we computed the annual technical efficiency (TE) in the first stage, applying the data envelopment analysis (DEA). The DEA produces airports’ TE varying from 0 to 1 using inputs and outputs. For a decision-making unit (DMU), an efficiency value equal to one indicates high efficiency. The minimum number of DMU observations should be greater than three times the input plus the output variables (433 > 3 (5+5)) [32]. The observation consists of a combination of five inputs (number of employees, labor costs, debt, subsidies, and operational costs) and five outputs (passenger volume, cargo handling, aircraft movements, revenue, and annual profit rate). The data do not contain common input variables, such as runway length or number, terminal size, or number of boarding bridges because of data collection difficulty (see Table 4). However, we included some financial and proxy data to compensate for these shortcomings.
In the second stage, PCA is used to increase discrimination among the DMU efficiency scores. To improve the discriminatory power of the DEA results, the DEA and PCA are combined [33,34,35,36]. The PCA ranking procedure is based on the ratios of the individual inputs and outputs and is defined as follows: R i r j = the   ratio   of   the   i th   input and rth output of DMU j = y r j x i j , i = 1 , , m ,   r   = 1 , , s where, there are n DMUs ( j = 1 , , n ), each with m inputs and s outputs, denoted by x1j, x2j, …, xmj and y1j, y2j, …, ysj, respectively [37]. In the DEA result,   R i r j could be obtained using Max h 0 = r = 1 s u r y r 0 , subject to r = 1 s u r y r j i = 1 m v i x i j 0 , j = 1 , , n and i = 1 m v r x i 0 = 1 to avoid an infinite number of solutions in the case of constant return-to-scale (CRS, CCR model) and Max h 0 = r = 1 s u r y r 0 + u 0 , subject to r = 1 s u r y r j i = 1 m v i x i j + u 0 0 , j = 1 , , n and i = 1 m v r x i 0 = 1 for a variable return-to-scale (VRS, BCC model) based on the output-oriented equation (B. The case of the input-oriented equation minimizes the θ subject to y i + Y λ 0 , θ x i X λ 0 , λ 0 , where, θ is a scalar and λ is an n × 1 vector. The DEA results always satisfy the condition that h 0   or θ of VRS is greater than or equal to   h 0   or θ of CRS. For various reasons, the application of DEA in airport efficiency studies has focused on the input rather than the output-oriented equation [38]. One possible reason for this finding is that greater control is possible over input variables [6] than output variables, given restrictions on the maximum number of aircraft and passenger movements allowed by the government [10]. However, the rankings of DMUs are not the same when we use different DEA methods. Deregulation of the airport market has stimulated maximization of output with the given input. Therefore, we have 71 different DEA results from four DEA methods (input-oriented, output-oriented, CRS, and VRS) and 25 different combinations of one to five input and output variables.
Using the 71 DEA results, we obtained a column vector V ( k ) = | | R i r 1 , R i r 2 , R i r 3 , , R i r n | | 1 x n T , where, k is defined such that k = 1 when i = 1 and r = 1, k = 2 when i = 1 and r = 2, and up to k ( = i = 1 m i × r = 1 s r × four   different   DEA   methods ) . We applied PCA, yielding PC1, PC2, …, PCp, eigenvalues e 1 , e 2 , , e M ( e 1 e 2 e M 0 ) and normalized eigenvalues l 1 , l 2 , , l M . Based on References [36,37], we have X i = k = 1 M l k d j k , where,   d j k = R i r j n , (j = 1, …, n). Thus, we can obtain X i = i = 1 M β i d ( j k ) i , where, i = 1, …, m, where, β i ( l i ) = normalized eigenvalue (proportion) of each principal component (PCi) for DMU j of t from 2006 to 2012. The four different methods, namely, CRS and VRS with input- and output-orientation, give different DEA results (71 R i r j , i = 1, …,5, r = 1, …,5, j = 1, … n) varying from 0.0063 to 1.0000 for the pooled technical efficiency of NCE from 2006 to 2012. Additionally, we applied PCA to the 71 different DEA results to improve the discriminatory power, obtain more stable and objective technical efficiency of all the regional airports in France, and offer more results to measure efficiency. When we combine DEA and PCA, the data variation is narrower than in DEA alone, from 0.7542 to 0.8472 (see Table 5). In the third stage, based on the first and second steps, we applied the Malmquist Productivity Index (MPI) to compute the total factor productivity change (TFPC), which can be decomposed into technical change (TC) and TE change (TEC) of each airport. Productivity and technical change can be measured in several ways. The Malmquist index was first presented in a consumer theory context [39] and later for productivity analyses [40]. The index is as a geometric mean of two Malmquist productivity indexes expressed in distance functions.
The TEC can be decomposed into pure efficiency change (PEC) and scale efficiency change (SEC). M 0 ( x t + 1 , q t + 1 , x t , q t ) = D 0 t + 1 ( x t + 1 , q t + 1 ) D 0 t ( x t , q t ) [ D 0 t ( x t + 1 , q t + 1 ) D 0 t + 1 ( x t + 1 , q t + 1 ) × D 0 t ( x t , q t ) D 0 t + 1 ( x t , q t ) ] 0.5   ( TFPC = TEC · TC ) . Therefore, the TEC = D 0 t + 1 ( x t + 1 , q t + 1 ) D 0 t ( x t , q t ) (1), and TC = [ D 0 t ( x t + 1 , q t + 1 ) D 0 t + 1 ( x t + 1 , q t + 1 ) × D 0 t ( x t , q t ) D 0 t + 1 ( x t , q t ) ] 0.5 (2). The TEC (1) can decompose PEC and SEC as follows: V 0 t + 1 ( x t + 1 , q t + 1 ) V 0 t ( x t , q t ) [ V 0 t ( x t , q t ) D 0 t ( x t , q t ) × V 0 t + 1 ( x t + 1 , q t + 1 ) D 0 t ( x t + 1 , q t + 1 ) ] (3) when V 0 t ( x t , q t ) is a distance function for VRS during the period t. Using Equations (1) and (2), we could get TEC = D 0 t + 1 ( q t + 1 ) D 0 t ( q t + 1 ) (4), and TC = [ D 0 t + 1 ( q t ) D 0 t + 1 ( q t + 1 ) × D 0 t ( q t ) D 0 t ( q t + 1 ) ] 0.5 (5) when we use m inputs and s outputs, q = y r j x i j , i = 1, …, m, r = 1, …, s for DMU j (=1, …, n) for the case of CRS. Based on References [11,41], we have depicted a CRS technology involving a single input and a single output (see Figure 1). Points A (qt, xt) and B (qt+1, xt+1) are the quantities of input and output variables in periods t and t+1, and the efficiencies are defined by the frontier of t and t+1, respectively. Using Equations (4) and (5), we obtain TEC = q t + 1 q c (6) and TC = [ q t + 1 / q b q t + 1 / q c × q t / q b q t / q a ] 0.5 (7). This research uses both CRS and VRS (see Figure 2). Therefore, the PEC = [ q t + 1 / q g q t / q a ] (8), SEC = [ q b / q a q h / q g ] (9), and TC = [ q e q b q h q f ] 0.5 (10).

3.2. DEA-PCA and Malmquist Productivity Index Results

The TE result of DEA-PCA for 87 of the 99 French regional airports with valid data is for more than two years. The NCE airport shows a high efficiency (0.8005) and is the only airport with over 80% of TE from 2006 to 2012, LYS follows with 0.7862. Approximately one-quarter of the airports (21), including nine Large airports, have an efficiency of more than 50%. Among Large airports, the MPL airport shows the worst efficiency (0.5143). Interestingly, among Middle airports, BVA (0.6841) and RNS (0.6358) had efficiencies of more than 60% and ranked as the sixth and ninth most efficient airports, and the Tahiti airport ((PPT), 0.6814) in the DOM-TOM was ranked seventh. Interestingly, the NCE airport, the airport with the highest TE, had 100% decreasing return-to-scale (DRS, this indicates DRS for 25 of the 25 different DEA methods applied). Moreover, eight of the nine Large airports showed a high level of DRS.
Table 6 shows the pooled TE comparison by airport category. The efficiency of Large airports is the highest, followed by Middle, DOM-TOM, Small, and Other airports. The differences between Large/Middle, Large/DOM-TOM, Large/Small, and Large/Other are significant with less than 0.000. The efficiency of Middle airports is statistically the same as that of DOM-TOM airports. Therefore, statistically, the regional airports in France could be classified into four different groups, namely, Large, Middle/DOM-TOM, Small, and Other airports. Figure 3 shows the changes in pooled TE from 2006 to 2012. Notably, only the efficiency of the Large airport group shows an increase after 2008.
With Equations (8)–(10), we find the PEC, SEC, TC, and TFPC, as shown in Table 7. As noted earlier, the TEC can be decomposed to PEC for the relative efficiency change compared to the comparable year and SEC for scale efficiency change. The TC describes a change in output produced from the same amount of inputs. A TC is not necessarily technological, as it might be organizational or due to modification of a constraint such as regulation, input prices, or input quantity. The productivity of all of the French airports has increased slightly (1.0345). However, if we exclude the unstable data, such as the productivity of some Small and Other airports (>10), productivity is extremely high based on the fluctuation of raw data year-by-year, particularly 2006 and 2007 because the airports handled the smallest number of passengers (fewer than 10,000 passengers per year), and then, we see a decrease in the French airports’ productivity (0.7799). In this case, only the productivity of the Large airport group shows an increase of approximately 11.85% (1.1185) from 2008 to 2012. Of the Large group, the TLS airport has the highest productivity increase (1.4251), followed by the SXB (1.3852), and BOD (1.2533) airports.

4. Interpretation and Implications: Focusing on Low-Cost Carriers (LCCs) and LCC-Dedicated Terminals (LCCTs)

4.1. Interpretation of Pooled Technical Efficiency (TE) Results

DEA-PCA clarifies the TE of the regional airports in France. However, the DEA does not identify the reasons for the efficiency, it only directs attention to the units in which inefficiency exists [1]. In this section, we examine which variables influence the DEA-PCA results. The dependent variable is the DEA-PCA result, θ k = l n γ k , where, θ k for an airport increases as the airport gets a lower DEA-PCA efficiency score. θ k is observed through the θ k = β z k + d u m m y ( L C C T ) + ε k , where z k is the independent variable (IV) vector. The parameters of the model are estimated using the ordinary least square (OLS) method and bootstrapping. The IVs are labor productivity (ln_WLU_Emp), cost-effectiveness Ln_Op_WLU), the ratio of aeronautical over non-aeronautical revenue (ln_A_NA), the percentage of LCCs’ movement (ln_LCC), and a dummy variable for the existence of an LCCT. Next, we tested multicollinearity, which measures how much the variance of the estimated regression coefficient is inflated due to the correlation of variables. A variance inflation factor (VIF) was applied to detect the multicollinearity of IVs (predictors) in the regression analysis. The VIFs are usually calculated by [ 1 1 R i 2 ] with ith independent variables. Some researchers point out that a VIF above 10 indicates a high correlation, less than 10 is acceptable [42], five as the maximum level of VIF [43], and some conservatives take 2.5 [44]. We used 2.5 as the maximum level of VIF to analyze the hypotheses. The regression result obtained from the bootstrapping test is shown in Table 8. The bootstrapping method can be used to quantify the uncertainty associated with a given estimator or statistical learning method [45] instead of the t-value of OLS. This result indicates that the variables ln_WLU-EMP and LCCT are significantly negative. The variable of ln_Op_WLU is significantly positive. The variable of LCC and non-aeronautical revenue is not insignificant. According to the Airports Council International-North America, non-aeronautical revenues critically determine the financial viability of an airport because these revenue sources tend to generate higher profit margins in comparison with aeronautical activities [46]. The research shows that the non-aeronautical (NA) revenue is not a major factor that increases technical efficiency. In 2012, the aeronautical revenue for the French regional airports was still 1.84 times greater than the NA, while the ratio for all of the US airports was 1.23 in 2012 [46]. This indicates that labor productivity (ln_WLU-EMP) and the existence of LCCT (LYS, MRS, and BOD) positively affect technical efficiency. The operational cost-effectiveness has a negative impact. Thus, this finding proves that lower operational costs (ln_Op_WLU) yield a higher TE. The LCCs’ occupancy ratio does not influence airports’ efficiency.

4.2. LCCT and French Regional Airports

In France, the air transport demand of the regional airports is facing challenges due to the continuous expansion of the high-speed train (HST), the high-speed line, and highway networks. The HST was launched between Paris and Lyon in 1981, and was expanded from Lyon to Marseille in June 2001. Now, it only takes three hours to travel between Paris and Marseille (783 km) at 261 km/h. In 2006, the Marseille airport turned its cargo terminal into an LCCT to host more LCCs with low user charges in response to the HST and HSL’s expansion. The Bordeaux airport opened an LCCT in 2010 in response to the HSL connection from Tours to Bordeaux and Paris to Rennes in 2017. The expansion makes it possible to travel between Paris and Bordeaux in two hours and four minutes (584 km). The Lyon Saint-Exupery airport opened on the outskirts of Lyon in 1987, six years after the HST and HSL were launched. However, the airport is not only an air transport terminal but also a multimodal terminal, including an HST, with access to the check-in counter in just a five-minute walk from the HST station. Furthermore, in 2008, the Lyon airport turned its cargo terminal into an LCCT to invite more LCCs to connect with other cities in Europe. The LCCT positively affects demand, particularly demand led by LCCs [47].
The French airport has allowed differentiated airport charges between various terminals that have encouraged the use of LCCTs [22]. When LCCs use an LCCT, passengers and carriers can reduce their transportation costs from 25% to 70% [48]. The LCCT provides a short moving distance with a one-story building, reduced parking charge, and other creative ideas to lower the costs [47,48]. Due to the ongoing expansion of the HST, HSL, and highways under the Trans European Transport Network’s (TEN-T) policy to maintain the European Union’s competitiveness and wealth, the French regional airports face difficulties securing demand for their facilities, particularly the Large airports with high traffic to/from Paris. However, the dramatic growth of LCCs following the integration of Europe has provided a substantial boost in demand to/from foreign countries for regional airports in France as well as in Europe. This allows the airports to serve as regional bases of operation for LCCs, such as MRS, and Bergamo airport in Italy for Ryanair, BSL for EasyJet, and BOD, NTE and SXB for Volotea. Through the HST, HSL, and highway connections, the regional airports in France connect cities to nearby airports and act as regional hubs for the Large airports. These connections are why the Middle, Small, and Other airports suffer a shortage of demand.
LCCs for the regional airports in Europe guarantee long-term passenger growth in exchange for lower costs, increased employment, increased commercial revenues, improved cost efficiency, and recovery of fixed costs with the profit generated [49]. Even though LCCs offer several benefits to regional airports in Europe, as we discussed in Section 4.1, LCCs do not necessarily increase the efficiency or profit of the regional airports in France, particularly the Middle, Small, and Other airports. The Middle airports in France (FNI) face a worsening financial situation because of the power of LCCs, especially by Ryanair [1]. If the French regional airports depend mainly on LCCs or one major LCC, it would be difficult to assure their viability regarding efficiency and financial productivity.

4.3. Viability of Regional Airports in France

Table 9 shows the operational and financial performance with subsidies per traffic (WLU) per employee, the operational cost per WLU, and WLU changes year over year (YoY). The operational indices include revenue changes, net profit percentage, the ratio of aeronautical over non-aeronautical revenues, subsidies in a thousand euros, and subsidies per WLU in euros. The worst performance during the period 2006 to 2012 was in 2009 due to the financial crisis, with recovery in 2010 despite the air travel disruption by volcanic ash in Iceland in April 2010. As mentioned in Section 3.2, the performance of French regional airports is also led by the Large airport group.
The total subsidies to the regional airports in France amount to approximately €252.7 million (4.2% of total operating costs) from 2006 to 2012. The subsidies focus on the DOM-TOM airports (€101.9 million, 40.3% of total), followed by Large (€59.9 million, 23.7%), Middle (€40.5 million, 16%), Other (€39.8 million, 13.8%), and Small (€10.6 million, 4.2%). The number of subsidies per traffic (WLU) is highly concentrated on Other airports (€104.46 per WLU) and the DOM-TOM airports (€16.38). Considerable attention has focused on the future of the DOM-TOM, Middle, Small, and Other regional airports in France. Their efficiency and operational/financial performance are much lower than the Large airports, and their contribution regarding passenger and cargo handling is far lower as well. Of 60 (55%) French regional airports, 15 Small, and 18 Other airports handled 4.3% of traffic (341,701 WLUs), and they handled 2.1% of the total traffic for all of the French airports in 2012. However, the state subsidies are concentrated on these airports. The airports provide some benefit to residents using high-speed transport modes. However, if other transport modes are sufficient for connections, such as HST and highways, the reasons for the existence of Small and Other airports should be considered based on a cost-benefit analysis.

5. Conclusions, Limitations, and Recommendations

This study applied the DEA and PCA methods to measure the technical efficiency of French regional airports from 2006 to 2012, analyzed the TFPC using the MPI from 2008 to 2012, and regression analysis using bootstrapping to find which factors influence airport efficiency. We found that three Paris airports and nine Large airports handled more than 95% of the total passengers in France, and the 90 Other airports handled less than 5%. The Large airport category leads the TE because of the LCCs, particularly for the airports that are largely dependent on LCCs. However, the volume of LCCs leads neither to the efficiency nor the profit level of airports. These findings lead to the question of why the French regional airports invite LCCs if they lose money. Future research could investigate the level of service for customers and the impact on the regional economy. Presumably, LCCs could provide customer benefits and stimulate the local economy. Thus, more studies are needed on the general welfare associated with LCCs at the French regional airports. The BVA airport is slightly different from the other airports, handling more than 80% of LCCs (CCF, EGC, LRH, BZR, FNI, XCR, DNR, and TUF) due to its proximity to Paris where sufficient demand exists.
In this research, we found that the Large airport group has higher TE than the other airport groups and is increasing in efficiency. Moreover, the French Government is attempting to privatize Large airports to guarantee competitiveness. We also found that other airport groups, such as the DOM-TOM, Middle, Small, and Others, which have low levels of TE, are not focusing on the improvement of efficiency or productivity even though more than 75% of the government subsidies support them. Privatization would be a major contributor to the viability of the French regional airports. An LCCT could invite more LCCs to connect with other cities in Europe and reduce airlines’ operational costs as well as increase non-aeronautical revenue and improve labor productivity.

Author Contributions

S.-J.H. designed and developed the study model including conceptualization, methodology, software, validation, and writing—review and editing formal analysis. M.J. collected data, visualization, and prepared a draft.

Funding

No funding for this research.

Conflicts of Interest

The authors have no conflicts of interest to declare.

References

  1. Tovar, B.; Martín-Cejas, R.R. Technical efficiency and productivity changes in Spanish airports: A parametric distance functions approach. Transp. Res. Part E Logist. Transp. Rev. 2010, 46, 249–260. [Google Scholar] [CrossRef]
  2. Martin, J.C.; Roman, C. An application of DEA to measure the efficiency of Spanish airports prior to privatization. J. Air Transp. Manag. 2001, 7, 149–157. [Google Scholar] [CrossRef]
  3. Aivazian, V.; Ge, Y.; Qiu, J. Can corporatization improve the performance of state-owned enterprises even without privatization? J. Corp. Financ. 2005, 11, 791–808. [Google Scholar] [CrossRef]
  4. Barros, C.; Liang, Q.B.; Peypoch, N. The efficiency of French regional airports: An inverse B-convex analysis. Int. J. Prod. Econ. 2013, 141, 668–674. [Google Scholar] [CrossRef]
  5. Yoshida, Y.; Fujimoto, H. Japanese-airport benchmarking with the DEA and endogenous-weight TFP methods: Testing the criticism of overinvestment in Japanese regional airports. Transp. Res. Part E Logist. Transp. Rev. 2004, 40, 533–546. [Google Scholar] [CrossRef]
  6. Pacheco, R.R.; Fernandes, E.; de Sequeira Santos, M.P. Management style and airport performance in Brazil. J. Air Transp. Manag. 2006, 12, 324–330. [Google Scholar] [CrossRef]
  7. Oum, T.H.; Yan, J.; Yu, C. Ownership forms matter for airport efficiency: A stochastic frontier investigation of worldwide airports. J. Urban Econ. 2008, 64, 422–435. [Google Scholar] [CrossRef] [Green Version]
  8. Assaf, A.G.; Gillen, D. Measuring the joint impact of governance form and economic regulation on airport efficiency. Eur. J. Op. Res. 2012, 202, 187–198. [Google Scholar] [CrossRef]
  9. Oum, T.H.; Yu, C.; Choo, Y. ATRS Global Airport Performance Benchmarking Project; The Air Transport Research Society: College Park, MD, USA, 2015. [Google Scholar]
  10. Pels, E.; Nijkamp, P.; Rietveld, P. Relative efficiency of European airports. Transp. Policy 2001, 8, 183–192. [Google Scholar] [CrossRef]
  11. Perelman, S.; Serebrisky, T. Measuring the Technical Efficiency of Airports in Latin America; The World Bank: Washington, DC, USA, 2010. [Google Scholar]
  12. Lee, J.G.; Hong, S.J.; Leem, C.W. A study on efficiency of major airports in Asia: Using DEA and super efficiency. J. Aviation Manag.Soc. Korea 2009, 7, 3–12. [Google Scholar]
  13. Ha, H.-K.; Wan, Y.; Yoshida, Y.; Zhang, A. Airline market structure and airport efficiency: Evidence from major Northeast Asian airports. J. Air Transp. Manag. 2013, 33, 32–42. [Google Scholar] [CrossRef]
  14. Sarkis, J. Operational efficiency of major U.S. airports. J. Op. Manag. 2000, 18, 335–351. [Google Scholar] [CrossRef]
  15. Parker, D. The performance of BAA before and after privatisation. J. Transp. Econ. Policy 1999, 33, 133–146. [Google Scholar]
  16. Barros, C.; Diekeb, P.U.C. Performance evaluation of Italian airports: A data envelopment analysis. J. Air Transp. Manag. 2007, 13, 184–191. [Google Scholar] [CrossRef]
  17. Chi-Lok, A.Y.; Zhang, A. Effects of competition and policy changes on Chinese airport productivity: An empirical investigation. J. Air Transp. Manag. 2009, 15, 166–174. [Google Scholar] [CrossRef]
  18. Hong, S.J.; Moon, H.J. A performance analysis of the airports in Korea (DEA approach using WLU). J. Korean Soc. Transp. 2005, 22, 89–98. [Google Scholar]
  19. Hong, S.J.; Domergue, F. Estimation viability of LCCs business model in Korea. J. Int. Logistics Trade 2018, 16, 11–20. [Google Scholar] [CrossRef]
  20. Wan, Y.; Ha, H.-K.; Yoshida, Y.; Zhang, A. Airlines’ reaction to high-speed rail entries: Empirical study of the Northeast Asian market. Transp. Res. Part A Policy Practice 2016, 94, 532–537. [Google Scholar] [CrossRef]
  21. Freathy, P. The commercialisation of European airports: Successful strategies in a decade of turbulence? J. Air Transp. Manag. 2004, 10, 191–197. [Google Scholar] [CrossRef]
  22. Graham, A. Understanding the low-cost carrier and airport relationship: A critical analysis of the salient issues. Tourism Manag. 2013, 36, 66–76. [Google Scholar] [CrossRef]
  23. Mamontoff, C. La Réforme Aéroportuaire de la loi du 13 Août 2004 à L’épreuve des Faits; Harmattan: Paris, France, 2011. [Google Scholar]
  24. Protard, M.; Guillaume, G. France’s Macron Seen Launching Privatization Drive with Airports. Available online: https://www.kitco.com/news/2017-06-09/France-apos-s-Macron-seen-launching-privatisation-drive-with-airports.html (accessed on 11 September 2019).
  25. Dabreteau, J. The New Wave of French Airport Privatizations: Ready for Take-Off. Available online: https://www.ashurst.com/en/news-and-insights/legal-updates/the-new-wave-of-french-airport-privatisations-ready-for-take-off/ (accessed on 11 September 2019).
  26. Observatoire de L’aviation Civile; DGAC: Providencia, Chile, 2014.
  27. Cliffordchance. The Privatization of Large Regional Airports in France: Key Issues and Opportunities; Cliffordchance: London, UK, 2015. [Google Scholar]
  28. Gillen, D. The evolution of airport ownership and governance. J.Air Transp. Manag. 2011, 17, 3–13. [Google Scholar] [CrossRef]
  29. France 3. Aéroport Lyon Saint Exupéry: La Privatisation Entérinée. Available online: http://france3-regions.francetvinfo.fr/auvergne-rhone-alpes/aeroport-lyon-saint-exupery-privatisation-enterinee-1171343.html (accessed on 30 July 2017).
  30. DGAC (Direction Générale de l’Aviation Civile). Activité des Aéroports Français; DGAC: Paris, France, 2006. [Google Scholar]
  31. UAF (Union des Aéroports Français). Résultats d’activité des aéroports français; UAF: Paris, France, 2018. [Google Scholar]
  32. Raab, R.L.; Lichty, R.W. Identifying subareas that comprise a greater metropolitan area: The criterion of county relative efficiency. J. Reg. Sci. 2002, 42, 579–594. [Google Scholar] [CrossRef]
  33. Adler, N.; Golany, B. Evaluation of deregulated airline networks using data envelopment analysis combined with principal component analysis with an application to Western Europe. Eur. J. Op. Res. 2001, 132, 260–273. [Google Scholar] [CrossRef]
  34. Adler, N.; Golany, B. Including principal component, weights to improve discrimination in data envelopment analysis. J. Op. Res. Soc. 2002, 53, 985–991. [Google Scholar] [CrossRef]
  35. Adler, N.; Yazhemsky, E. Improving discrimination in data envelopment analysis: PCA–DEA or variable reduction. Eur. J. Op. Res. 2010, 202, 273–284. [Google Scholar] [CrossRef]
  36. Hong, S.-J.; Randall, W.; Han, K.; Malhan, A. Estimation viability of air cargo business of combination carriers: A data envelopment and principal component analysis. Int. J. Prod. Econ. 2018, 202, 12–20. [Google Scholar] [CrossRef]
  37. Zhu, J. Data envelopment analysis vs. principal component analysis: An illustrative study of economic performance of Chinese cities. Eur. J. Op. Res. 1998, 111, 50–61. [Google Scholar] [CrossRef]
  38. Ganley, J.A.; Cubbin, J.S. Public Sector Efficiency Measurement: Applications of Data Envelopment Analysis; Elsevier: Amsterdam, The Netherlands, 1992. [Google Scholar]
  39. Malmquist, S. Index numbers and indifference surfaces. Trabajos Estadistica 1953, 4, 209–242. [Google Scholar] [CrossRef]
  40. Caves, D.W.; Christensen, L.R.; Diewert, W.E. The economic theory of index numbers and the measurement of input, output, and productivity. Econometrica 1982, 50, 1393–1414. [Google Scholar] [CrossRef]
  41. Coelli, T.J.; Rao, D.S.P.; O’Donnell, C.J.; Battese, G.E. An Introduction to Efficiency and Productivity Analysis, 2nd ed.; Springer: New York, NY, USA, 2005. [Google Scholar]
  42. Hair, J.F., Jr.; Anderson, R.E.; Tatham, R.L.; Black, W.C. Multivariate Data Analysis, 7th ed.; Pearson: Noida, India, 2015. [Google Scholar]
  43. Ringle, C.M.; Wende, S.; Becker, J.M. SmartPLS 3. Bönningstedt. Available online: http://www.smartpls.com (accessed on 18 May 2018).
  44. Allison, P. When Can You Safely IGNORE multicollinearity? Statistical Horizons: Ardmore, PA, USA, 2012. [Google Scholar]
  45. Simar, L.; Wilson, P.W. Estimation and inference in two-stage, semi-parametric models of production processes. J. Econ. 2007, 136, 31–64. [Google Scholar] [CrossRef]
  46. Airports Council International-North America. AirportInfo: Non-Aeronautical Revenue; ACI-NA: Washington, DC, USA, 2013. [Google Scholar]
  47. Personne, P. Bordeaux airport: Billi effect. In Proceedings of the ATRS 2014 World Conference Proceedings, Bordeaux, France, 17–20 July 2014. [Google Scholar]
  48. Fanning, N. Low Cost Airport Development; EasyJet: Luton, UK, 2007. [Google Scholar]
  49. Skeels, J. Challenges facing low fares airlines: The European perspective. In Proceedings of the Asia Pacific Low Cost Airline Symposium Proceedings, Bordeaux, France, January 2005. [Google Scholar]
Figure 1. Malmquist productivity indices for constant return-to-scale (CRS) [11,41].
Sustainability 11 05107 g001
Figure 2. Malmquist productivity indices for CRS and variable return-to-scale (VRS). Source: Authors’ elaboration.
Sustainability 11 05107 g002
Figure 3. Pooled Technical efficiency changes from 2006 to 2012 for regional airport groups in France.
Sustainability 11 05107 g003
Table 1. French Regional Airports by Category.
CategoryAirportsNumber
Paris airportsCDG Charles-de-GaulleORY Orly 2
LargeBOD Bordeaux; BSL Basel-Mulhouse-Freiburg; LYS Lyon; MPL Montpellier; MRS MarseilleNCE Nice; NTE Nantes; SXB Strasbourg; TLS Toulouse 9
Dom-TomCAY Cayenne; DZA Mayotte-Dzaoudzi-Pamandzi; FDF Martinique; NOU NouméaPPT Tahiti; PTP Pointe-à-Pitre; RUN La Réunion 7
MiddleAJA Ajaccio; BES Brest; BIA Bastia; BIQ Biarritz; BVA BeauvaisCGF Carcasonne; FSC Figari; LDS Tarbes; LIL Lille; PGF PeripignanPUF Pau; RNS Rennes; TLN Toulon13
SmallBZR Beziers; CFE Clermont-Ferrand; CFR Caen; CLY Calvi; CMF Chambery; DOL DeauvilleEGC Bergerac; ETZ Metz; FNI Nimes; GNB Grenoble; LIG Limoges; LRH La RochelleLRT Lorient; PIS Poitiers; RDZ Rodez; UIP Quimper; XCR Chalons17
OthersAGF Agen; ANE Angers; ANG Angouleme; AUF Auxerre; AUR Aurillac; AVN Avignon; BOU Bourges; BVE Brive; BYF Albert; CER Cherbourg; CET Cholet; CHR Chateauroux; CMR Colmar; CQF Calais; CTT Le Castelet; CVH Courchevel; DCM Castres; DIJ DijonDLE Dole; DNR Dinard; EBU Saint-Etienne; ENC Nancy; EPL Epinal; GAT Gap; IDY Ile-d’yeu; LAI Lannion; LEH Le Havre; LFEA Belle-Ile; LFEC Ouessant; LME Le Mans; LPY Le Puy; LTQ Le Touquet; LTT La Mole; LVA Laval; NCE (*) Port Grimaud; NCY AnnecyNIT Niort; NVS Nevers; ORE Orleans; PGX Perigueux; QAM Amiens; QYR Troyes; RHE Reims; RNE Roanne; SBK Sanit-Brieuc; SYT Saint-Yan; TUF Tours; URO Rouen; VAF Valence; VNE Vannes; XCZ Charleville; XMF Montbeliard; XVS Valaciennes53
Total number of airports101 99 (**)
(*) Grimaud is a village and commune in the Var department in the Provence-Alpes-Côte d’Azur region in southeastern France that can be reached from the Nice airport. (**) 99 airports, except two Paris airports, were analyzed for this research.
Table 2. The Number of Airports in France and Valid Data.
CategoryAvg WLU per Airport *2006200720082009201020112012
Large539,901 (100%)9999999
DOM-TOM141,371 (26.2% **)6666677
Middle86,968 (16.1% **)1414141413911
Small20,741 (3.8% **)15151515141115
Others1595 (0.3% **)49443944281718
Total (535)94,26193888388705360
Valid data (433, 81%)41 (44.1%)66 (75.0%)70 (84.3%)74 (84.1%)69 (98.6%)53 (100%)60 (100%)
* Average WLU per airport from 2006 to 2012. ** Relative size compared to Large airports. (Source: DGAC 2006 to 2012).
Table 3. The Number of Passengers and the Share in Regional, Paris, and DOM-TOM Airports.
Region2011201220132014CAGR (*)
Regional airports64,808,64639.6%68,783,29141.0%71,049,91541.3%72,108,64641.1%3.6%
Large48,032,20429.4% (74.1%)51,398,90730.6% (74.7%)
Paris airports88,109,62753.9%88,788,46552.9%90,327,07152.6%92,676,34252.8%1.7%
Sub-total152,918,27393.5%157,526,75693.8%161,376,98693.9%164,784,98894.0%2.5%
DOM-TOM10,677,3786.5%10,426,0056.2%10,482,7876.1%10,596,2276.0%−0.3%
Total163,595,651100%167,953,254100%171,859,773100%175,381,215100.0%2.3%
(*) CAGR (Compound Annual Growth Rate) from 2001 to 2014 (Source: UAF, 2014, 2013, 2012).
Table 4. Descriptive Statistics for Input and Output Variables.
In/OutVariablesObs.Min.Max.AverageStd. Dev.CV
Input variablesA. # of employees4091573981121.14
B. Labor cost (k€)397284,212732814,5941.99
C. Debt (k€)2411175,80222,50440,7081.81
D. Subsidization (k€)183118,936138129752.15
E. Operational cost (k€)321283183,33618,68531,4941.69
Output variables1. Passenger53413311,197,734891,9111,901,2112.13
2. Cargo (ton)1342142,25320,90925,9131.24
3. Movement52741184,90113,63428,4722.09
4. Revenue (k€)32276210,38321,04936,5921.74
5. Net Profit (%)321−73.9%42.1%1.4%10.8%7.91
Note: Obs.: Observation number; CV: Coefficient of Variation.
Table 5. Different Combinations of Input and Output Variables.
Input VariablesOutput Variables# of Observation/TotalEfficiency of the Nice (NCE) Airport (2012)
A, B, C, D, E1, 2, 3, 4, 5154/5350.9227/1.0000/1.0000; CCR_Out/BCC_Out/BCC_In
A, D, E1, 2, 3306/5350.8427/1.0000/1.0000
A3407/5350.6192/N/A/0.8153
B3396/5350.0063 (CCR_In)/N/A/0.5258
25 different combinations of variables433/5350.4934/1.0000/0.9555
Table 6. Pooled Technical Efficiency Comparison by Airport Category.
Airport SizeNMeanStd. DevStd. Error95% Confidence Interval for MeanMinMaxMean Difference (Post Hoc Test)ANOVA
Lower BoundUpper BoundLDMS
Large (L)630.70120.1220.0150.670.730.34490.8737 F-value 68.567 **
Dom-Tom (D)440.49020.1670.0250.440.540.13490.80330.2111 **
Middle (M)880.49930.1500.0160.470.530.16000.80200.2019 **−0.0091
Small (S)940.38700.1870.0190.350.430.00740.78770.3142 **0.1031 *0.1122 **
Others1360.31560.1610.0140.290.340.03260.78500.3857 **0.1746 **0.1837 **0.0714 *
Total4250.44470.2060.0100.430.460.00740.8737
** Significant at α = 0.001; * Significant at α = 0.05s.
Table 7. Malmquist Productivity Indices from 2008 to 2012 for all French Airports.
AirportsTFPC (M)PECSECTCObservation Years
NCE0.98651.05030.94700.99192008–12
LYS0.97941.00390.98780.98762008–12
MRS1.02151.06120.95031.01282008–12
TLS1.42511.12131.02761.23682008–12
BSL1.22781.13070.96011.13102008–12
BOD1.25331.07381.01931.14512008–12
NTE1.06001.01611.00741.03562008–12
MPL0.86200.98420.95740.91472008–12
SXB1.38521.02051.11631.21592008–12
Geometric Mean of Large airports1.11851.05020.99581.0695
RUN0.67740.88970.96180.79162008–12
PTP0.60530.84250.97100.73992008–12
PPT0.73290.83071.06300.82992008–12
FDF0.93040.98820.98310.95762008–12
NOU1.98860.92871.41751.51052008–12
CAY0.93271.03760.93730.95912008–12
DZA0.09760.42490.92790.24752011–12
AJA1.37310.98220.98311.20952008–12
LIL1.24341.10981.04241.13972008–12
BIQ1.79331.21180.98711.41972008–12
BIA0.79000.92201.00120.86812008–12
BES3.03351.55680.93321.94612008–12
PUF0.25260.61801.01740.43802008–12
LDE0.62630.81511.21220.75522008–12
FSC3.10781.29840.90501.97462008–12
TLN0.45500.80631.03490.62342008–10, 12
RNS0.82880.89630.68560.89342008–10, 12
BVA1.32251.63100.98951.18262008–10, 12
PGF0.22960.56100.98260.41362008–10
CCF0.94060.99301.00460.96392008–09
Geometric Mean of Middle and Dom-TOM airports0.82160.9239 0.99360.888
CFE7.48552.93840.76133.34602008–10, 12
GNB0.24760.68310.83750.43272008–12
LIG0.21300.66760.80690.39542008–10, 12
CLY0.79210.90021.01190.86952008–11
ETZ0.09070.46820.81780.23692008–10, 12
EGC2.34751.35191.04061.66862008–12
CMF14.08421.64601.75014.88922008–12
LRH3.57341.44801.14942.14712008–12
BZR3.01181.54641.00511.93772008–12
FNI2.78771.28081.17651.84992008–10
LRT0.74590.92130.96530.83872008–12
RDZ0.21090.61330.87480.39302008–12
DOL4.82131.97160.95162.56982008–12
UIP0.23710.58040.96890.42172008–12
CFR0.87250.89581.05700.92142008–12
PIS10.18272.01231.25744.02452008–12
XCR151.32915.52581.347620.32142009–12
Geometric Mean of Small airports
(): excluding extreme outliers value exceed 10 of TFPC.
1.6805 (0.9205)1.2032 (1.0171)1.0229 (0.9511)1.3654 (0.9515)-
DIJ6.53121.82911.15823.08312009–12
AGF2.78971.41561.06491.85072008–12
URO0.37391.07960.62490.55422009, 12
ENC0.14990.61430.76200.32032008–10, 12
AUR1.22581.03631.04681.12992008–12
CMR0.36930.61161.09760.55002008–10, 12
AUF0.37270.69430.97050.55312008–10, 12
LME0.51630.79480.96580.67262008–12
PGX3.67931.26221.33412.18502008–12
AVN0.42630.72140.98570.59962009–10, 12
CHR0.81750.91961.00320.88612009–12
XVS0.13140.58830.75500.29602008–12
LTQ0.58610.99410.81230.72572009–12
DCM0.23970.70470.80140.42442008–10, 12
VAF0.07320.35280.99590.20822008–12
ANG0.32431.35860.46910.50882008–12
VNE25.03221.86961.93946.90402010, 12
LEH1.25170.93581.16901.14422008, 10–11
be0.15370.52450.90140.32512008–11
LPY2.09841.44870.92851.56002008–11
CVF1.72571.05781.17601.38732010–11
DLE1.13300.99801.05331.07782008–11
XMF1.16421.03401.02781.09552008–11
DNR0.12850.47560.92520.29202008–10
NCY0.83410.94330.98590.89692008–10
ANE0.43341.11420.64240.60552008–10
QYR0.82571.17690.78700.89142008–10
BOU24.36952.23911.60206.79372008–09
NVS0.88571.54390.61700.92982008–09
ORE19.60409.69270.33925.96222008–09
EBU14.52412.15581.35284.98032008–09
Geometric Mean of Other airports
(): excluding extreme outliers value exceed 10 of TFPC
0.9588 (0.6094)1.0602 (0.9062)0.9274 (0.9052)0.9750 (0.7429)-
All French airports (): excluding extreme outliers value exceed 10 of TFPC.1.0345 (0.7799)1.0223 (0.9500)0.9916 (0.9510)1.0206 (0.8614)2008–12
1.25991.07311.02211.14872011–12
0.91480.98490.97980.94792010–11
0.99651.00430.99440.99792009–10
7.07201.20801.81033.23392008–09
Note: Airports that do not have two consecutive years’ data after 2008 are omitted.
Table 8. Regression on Technical Efficiency.
Dependent VariableDEA-PCA
VariablesCoeff.Std. Coeff.Std. ErrorVIFt-ValueBootstrap (1) Sig.
Constant3.005 0.258 11.6610.000 **
ln_WLU_Emp−0.328−0.5560.0372.030−8.859 **0.000 **
ln_Op_WLU0.3680.3010.0711.7465.177 **0.008 *
ln_A_NA0.0930.1120.0391.1242.395 *0.062
ln_LCC0.0380.0670.0271.1791.4110.196
LCCT−0.178−0.1010.0841.190−2.105 *0.000 **
R2 = 0.736 (F-test 76.011 **); ** Significant at α = 0.001; * Significant at α = 0.05; (1) 1,000 bootstrap samples.
Table 9. Operational and Financial Indices for Regional Airports in France.
IndicesCategory2006200720082009201020112012Average/Total
Operational IndicesWLU/Emp-609639631660743775702
Large-1972180117661960194420661921
DOM-TOM-863899907926942847891
Middle-773899801810846905829
Small-480449487451530520499
Others-991151101349778106
Op/WLU--1.40612.14342.07372.06731,65041.8629
Large--0.14490.15210.14570.14240.14420.1459
DOM-TOM--0.21770.22950.22920.22220.25980.2323
Middle--0.17410.18050.18260.19140.18320.1816
Small--0.24500.49910.30580.33870.32740.3441
Others--3.33145.40554.78755.95794.94334.8174
WLU change (yoy)-−10.32%7.63%−16.33%0.98%6.91%1.64%−2.97%
Large-2.99%−7.44%−4.39%4.33%7.82%6.15%1.42%
DOM-TOM-5.52%11.50%−1.80%3.70%3.46%−2.38%3.07%
Middle-5.10%8.55%−5.98%−3.24%1.50%5.45%1.71%
Small-−11.75%0.87%−20.63%−4.11%10.63%9.95%−1.27%
Others-−18.86%13.28%−22.37%3.72%8.24%−2.97%−7.88%
Financial IndicesRevenue change (yoy)---−1.79%5.86%11.34%4.32%4.62%
Large---−2.02%10.25%2.26%8.14%4.54%
DOM-TOM---5.99%0.43%11.92%15.08%8.47%
Middle---−4.99%−0.09%4.52%11.30%1.82%
Small---1.86%6.77%26.55%−8.62%3.85%
Others---−4.40%8.21%10.64%5.94%5.71%
Net Profit %--−2.51%−1.65%2.91%4.28%1.33%0.64%
Large--3.52%4.90%6.90%8.16%8.54%6.39%
DOM-TOM--3.92%3.81%5.19%1.68%−16.66%−1.24%
Middle--−2.94%−1.05%−0.42%0.52%4.34%−0.18%
Small--−6.30%−5.05%1.54%3.08%0.08%−1.43%
Others--−3.61%−3.45%3.37%6.18%4.85%0.96%
A/NA ratio4.74731.57741.87902.00122.07252.26401.83672.27
Large1.26011.24781.31401.35631.34571.39271.37361.33
DOM-TOM2.46512.50642.82682.47802.60374.51354.04413.10
Middle3.41881.59261.67921.70182.07412.45602.07882.13
Small4.23441.98462.51852.50892.12151.77981.96462.45
Others9.73541.31571.62861.98262.16541.98211.07802.39
Subsidization (k€)42,84019,76722,56344,21544,56927,41151,329252,694 (100%)
Large14,1742513931049342,274607120,59359,869 (23.7%)
DOM-TOM22,94915,391880815,30115,975494718,534101,905 (40.3%)
Middle23541730294720,81559151843491840,522 (16.0%)
Small3363056726933833524310,567 (4.2%)
Others0133931289620,37213,717204139,831 (13.8%)
Subsidization/WLU (€)6.222.733.126.346.253.916.455.01
Large3.040.511.981.080.481.203.811.76
DOM-TOM29.1818.669.7417.5117.605.0719.5816.38
Middle2.261.552.4117.465.102.483.905.24
Small10.450.001.710.900.124.1316.275.09
Others0.001.8913.8545.88280.74568.52105.13104.46
Note: Original data source: DGAC 2006 to 2012; author’s calculation.

