Taxonomic Assessment of Transition to the Green Economy in Polish Regions
Abstract
1. Introduction
- environmental and resource productivity,
- natural assets base,
- environmental dimension of quality of life,
- economic opportunities and policy responses,
- socio-economic context.
2. Materials and Methods
2.1. Socio-Economic Characteristics of Studied Regions
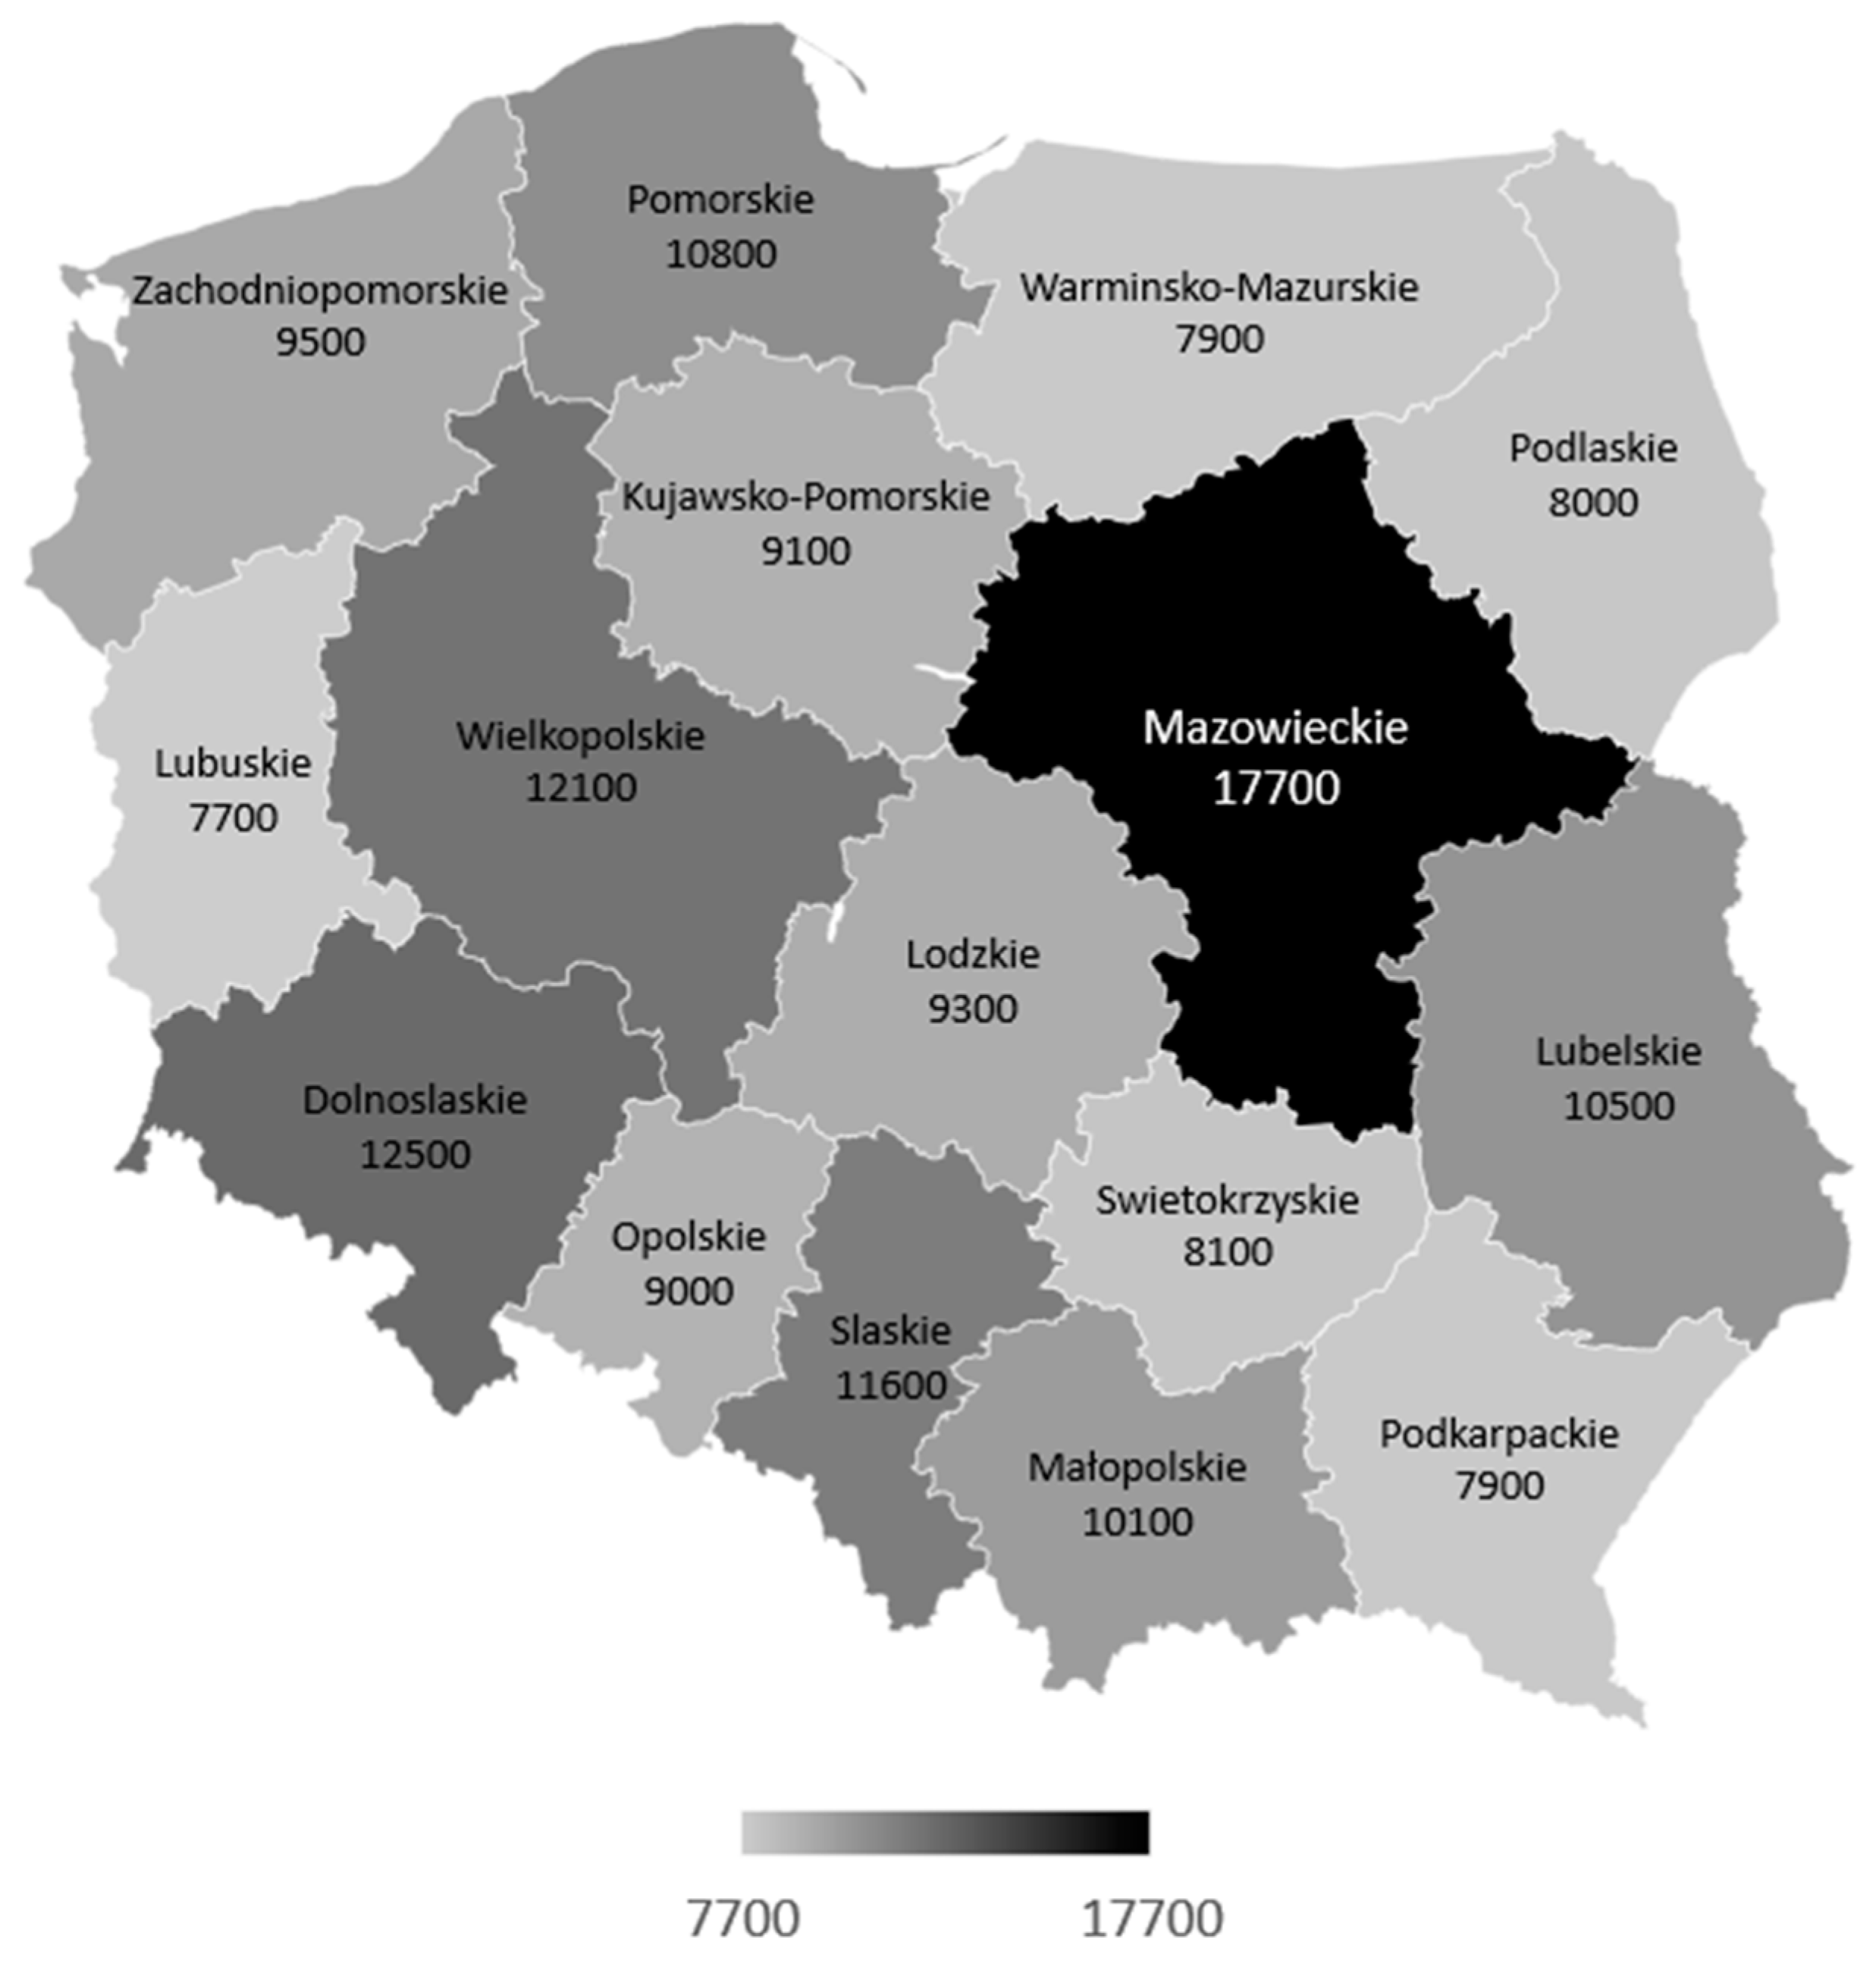
- the central region and the remaining regions of the country (Mazowieckie with Warsaw, the capital of Poland clearly dominates in terms of GDP per capita, as seen in Figure 1);
- geographical axis: North East–South West (in the north-east there are less developed regions (except for Mazowieckie), with a smaller share of industry, while moving towards the south-west, regions are more developed).
2.2. Description of the Method
3. Results
3.1. Ideal and Anti-Ideal Solution and Weights for Variables and Subsystems
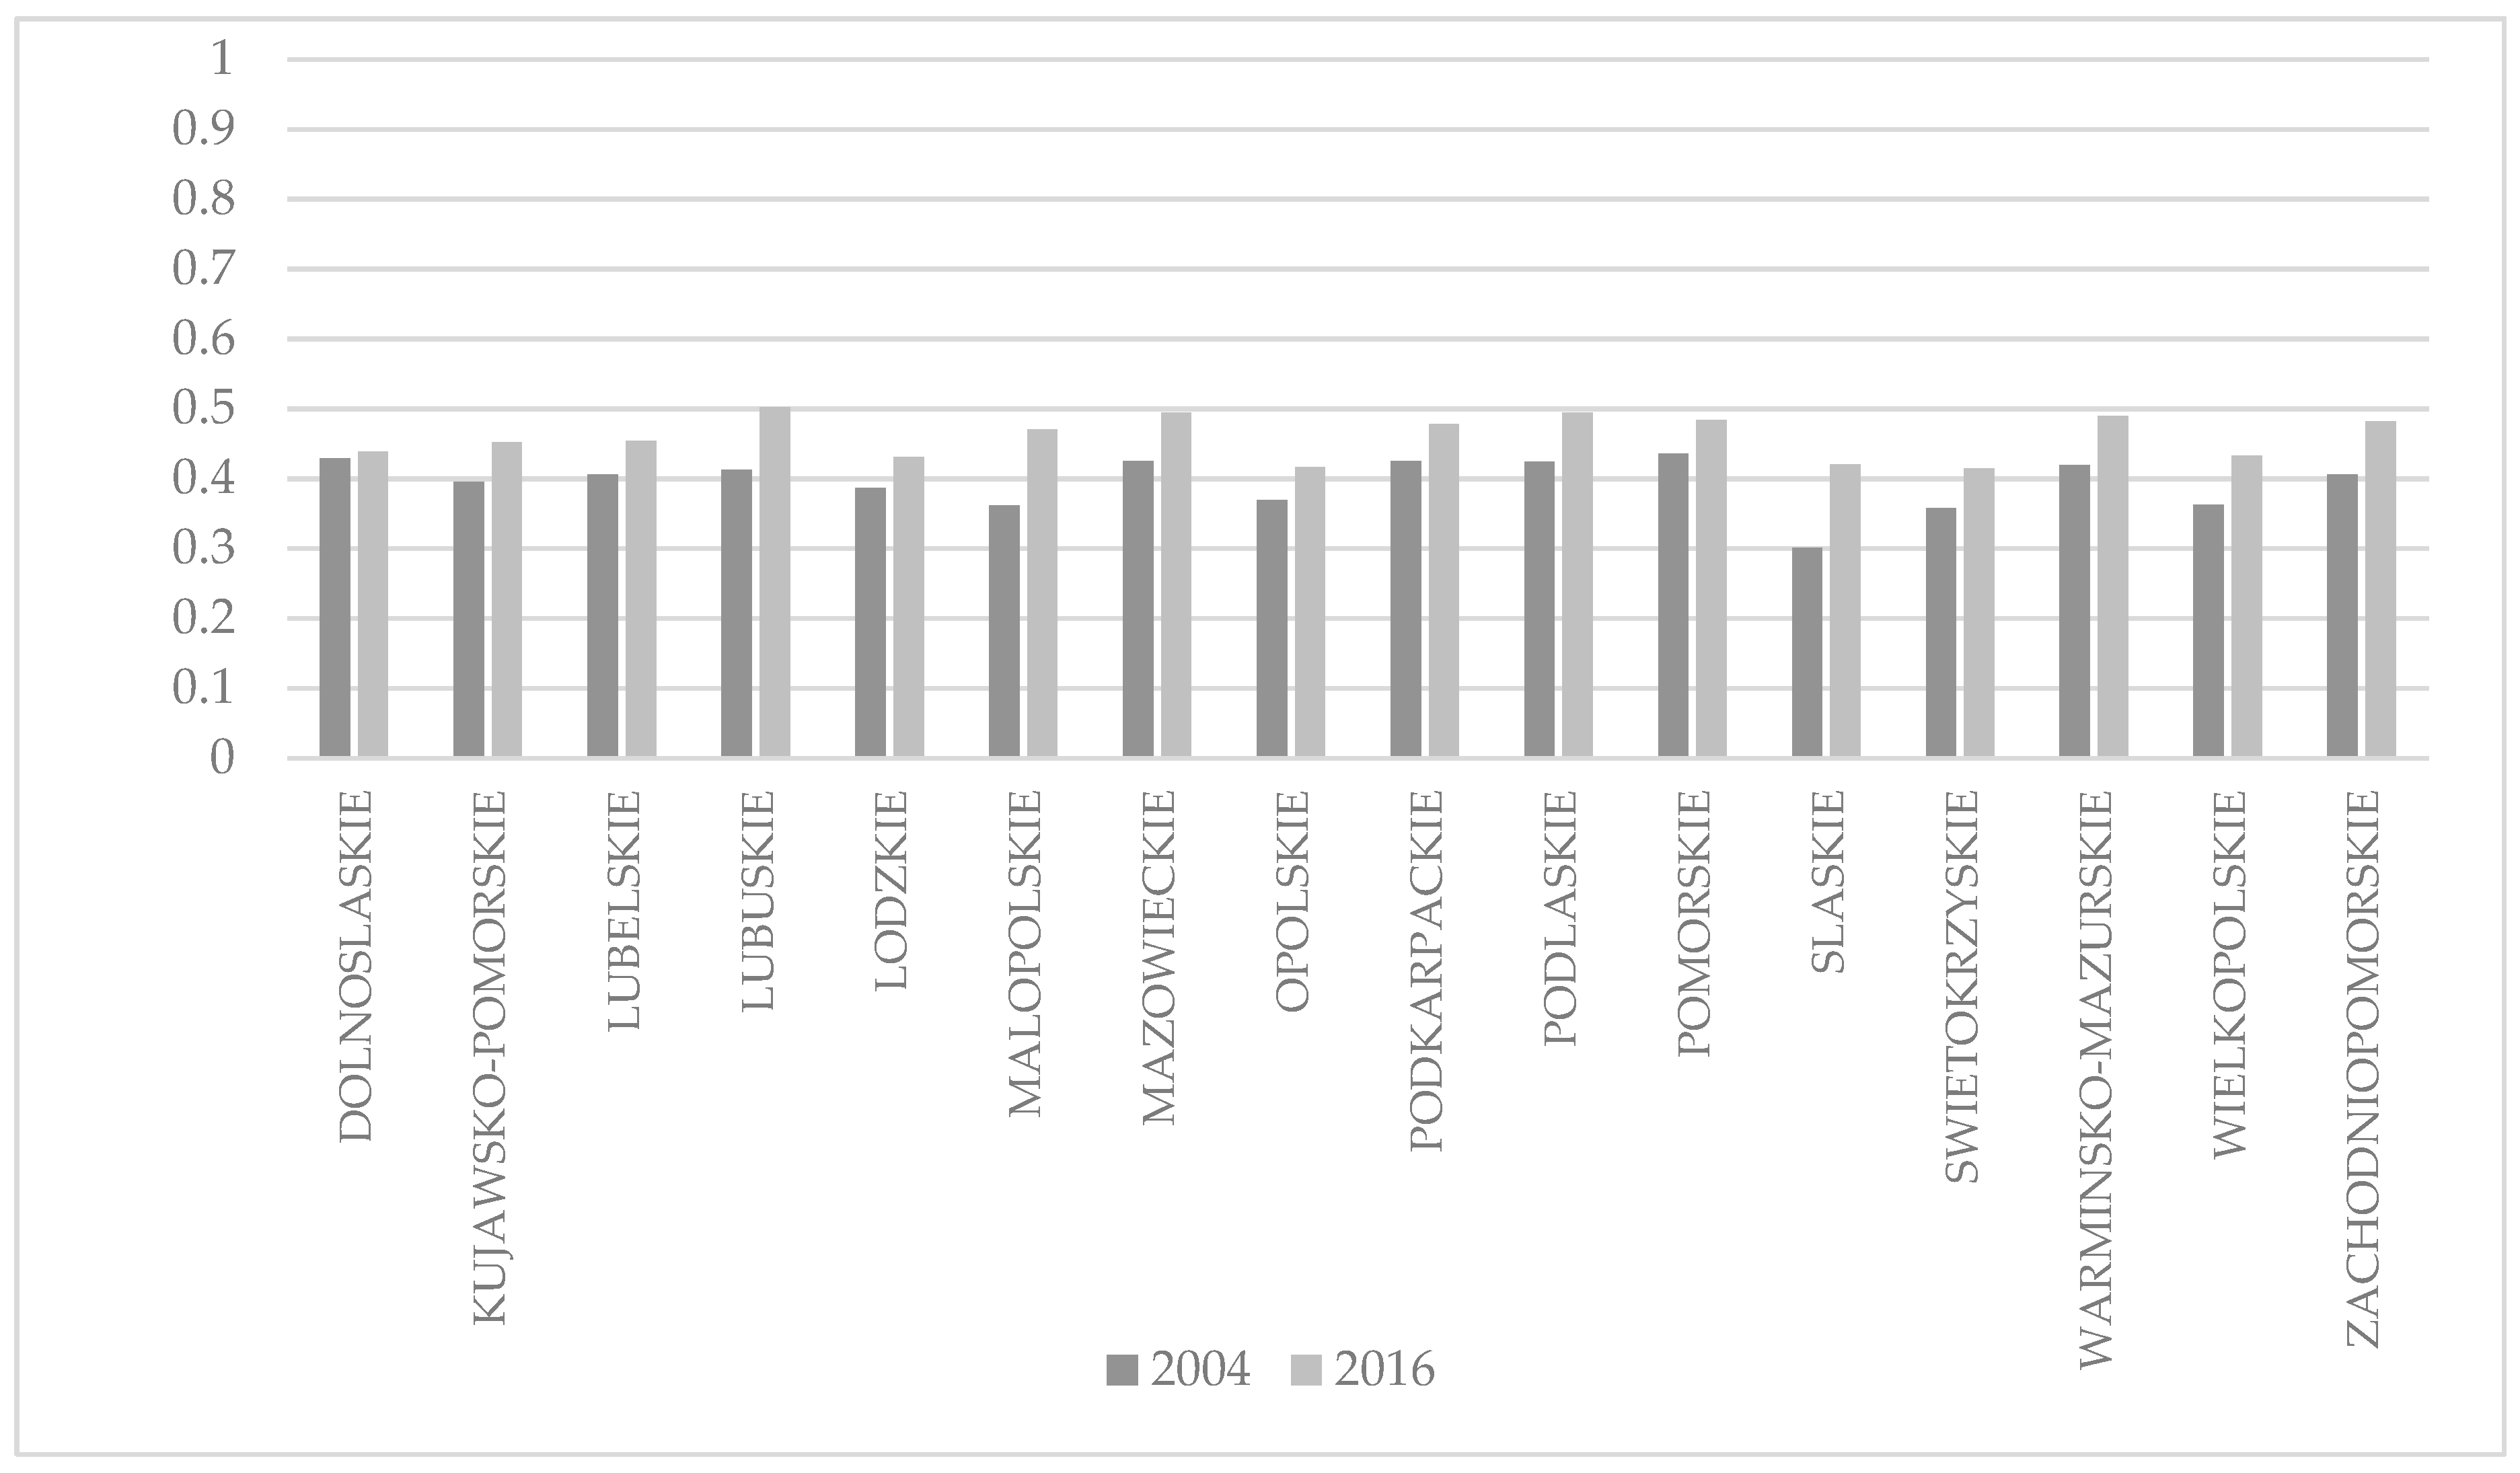
3.2. Green Economy Index and Indexes for Thematic Areas in Polish Regions in 2004–2016
3.3. Ranking of Regions in Terms of Green Economy Indexes
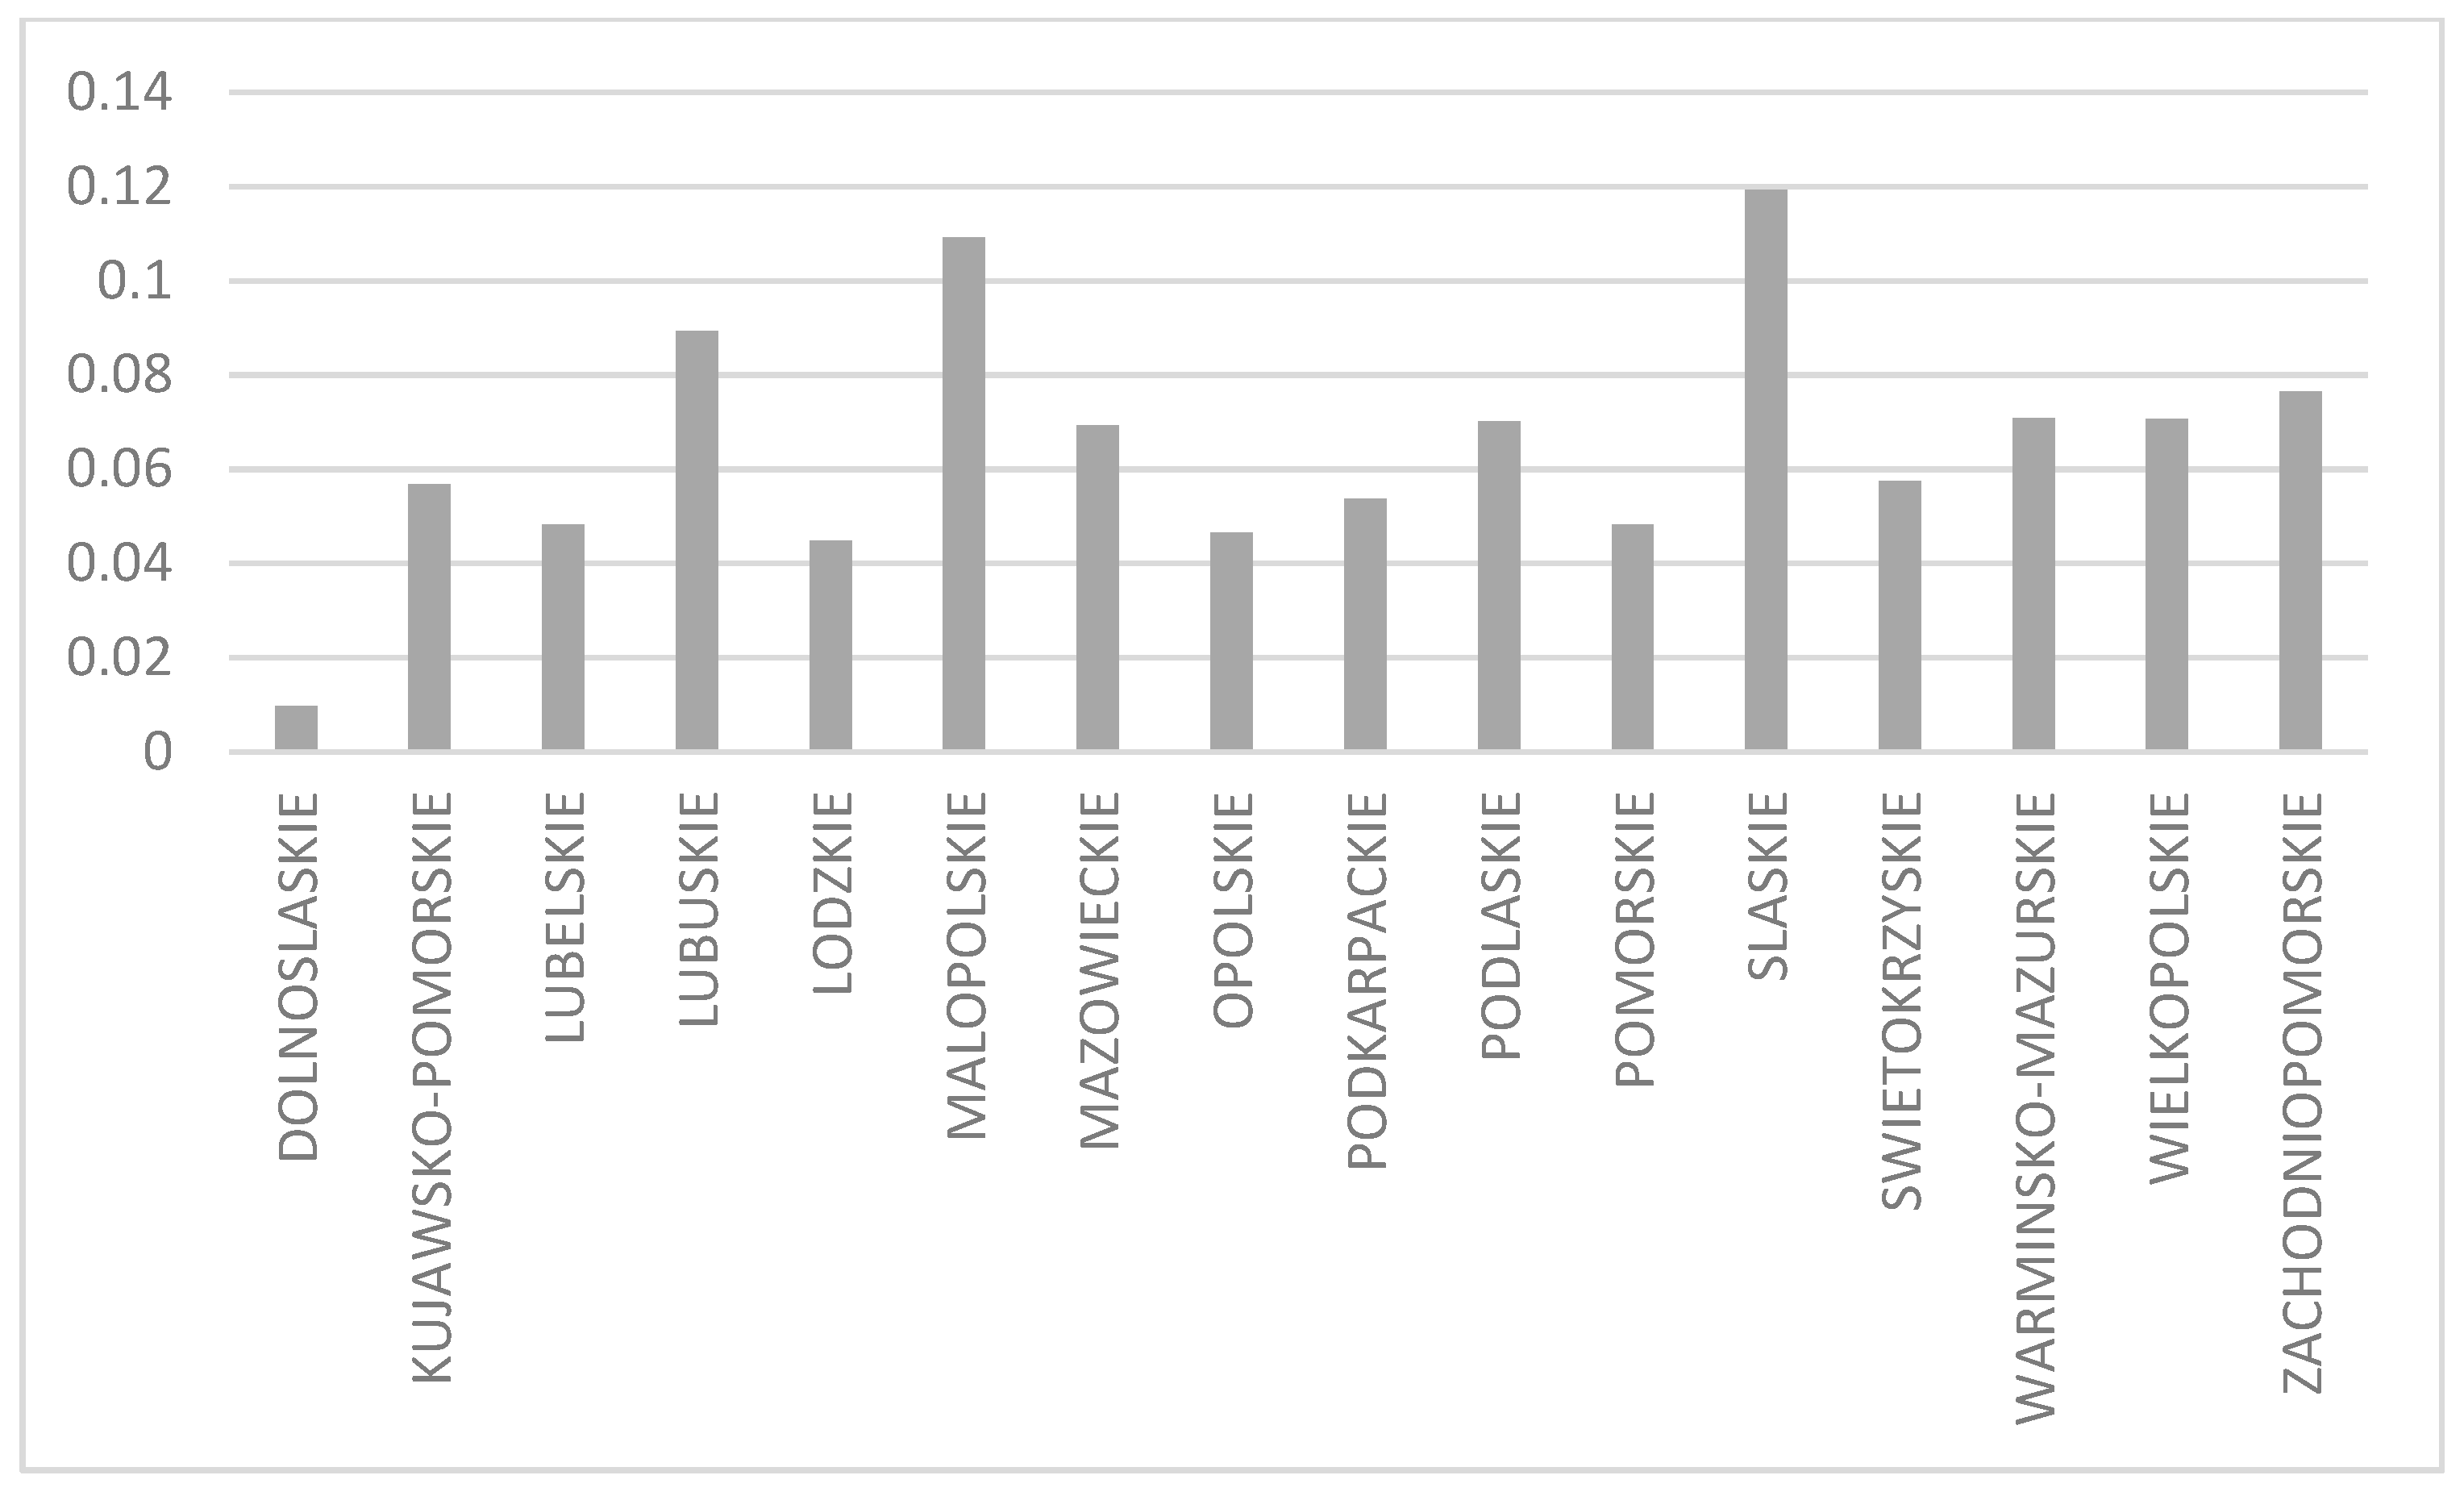
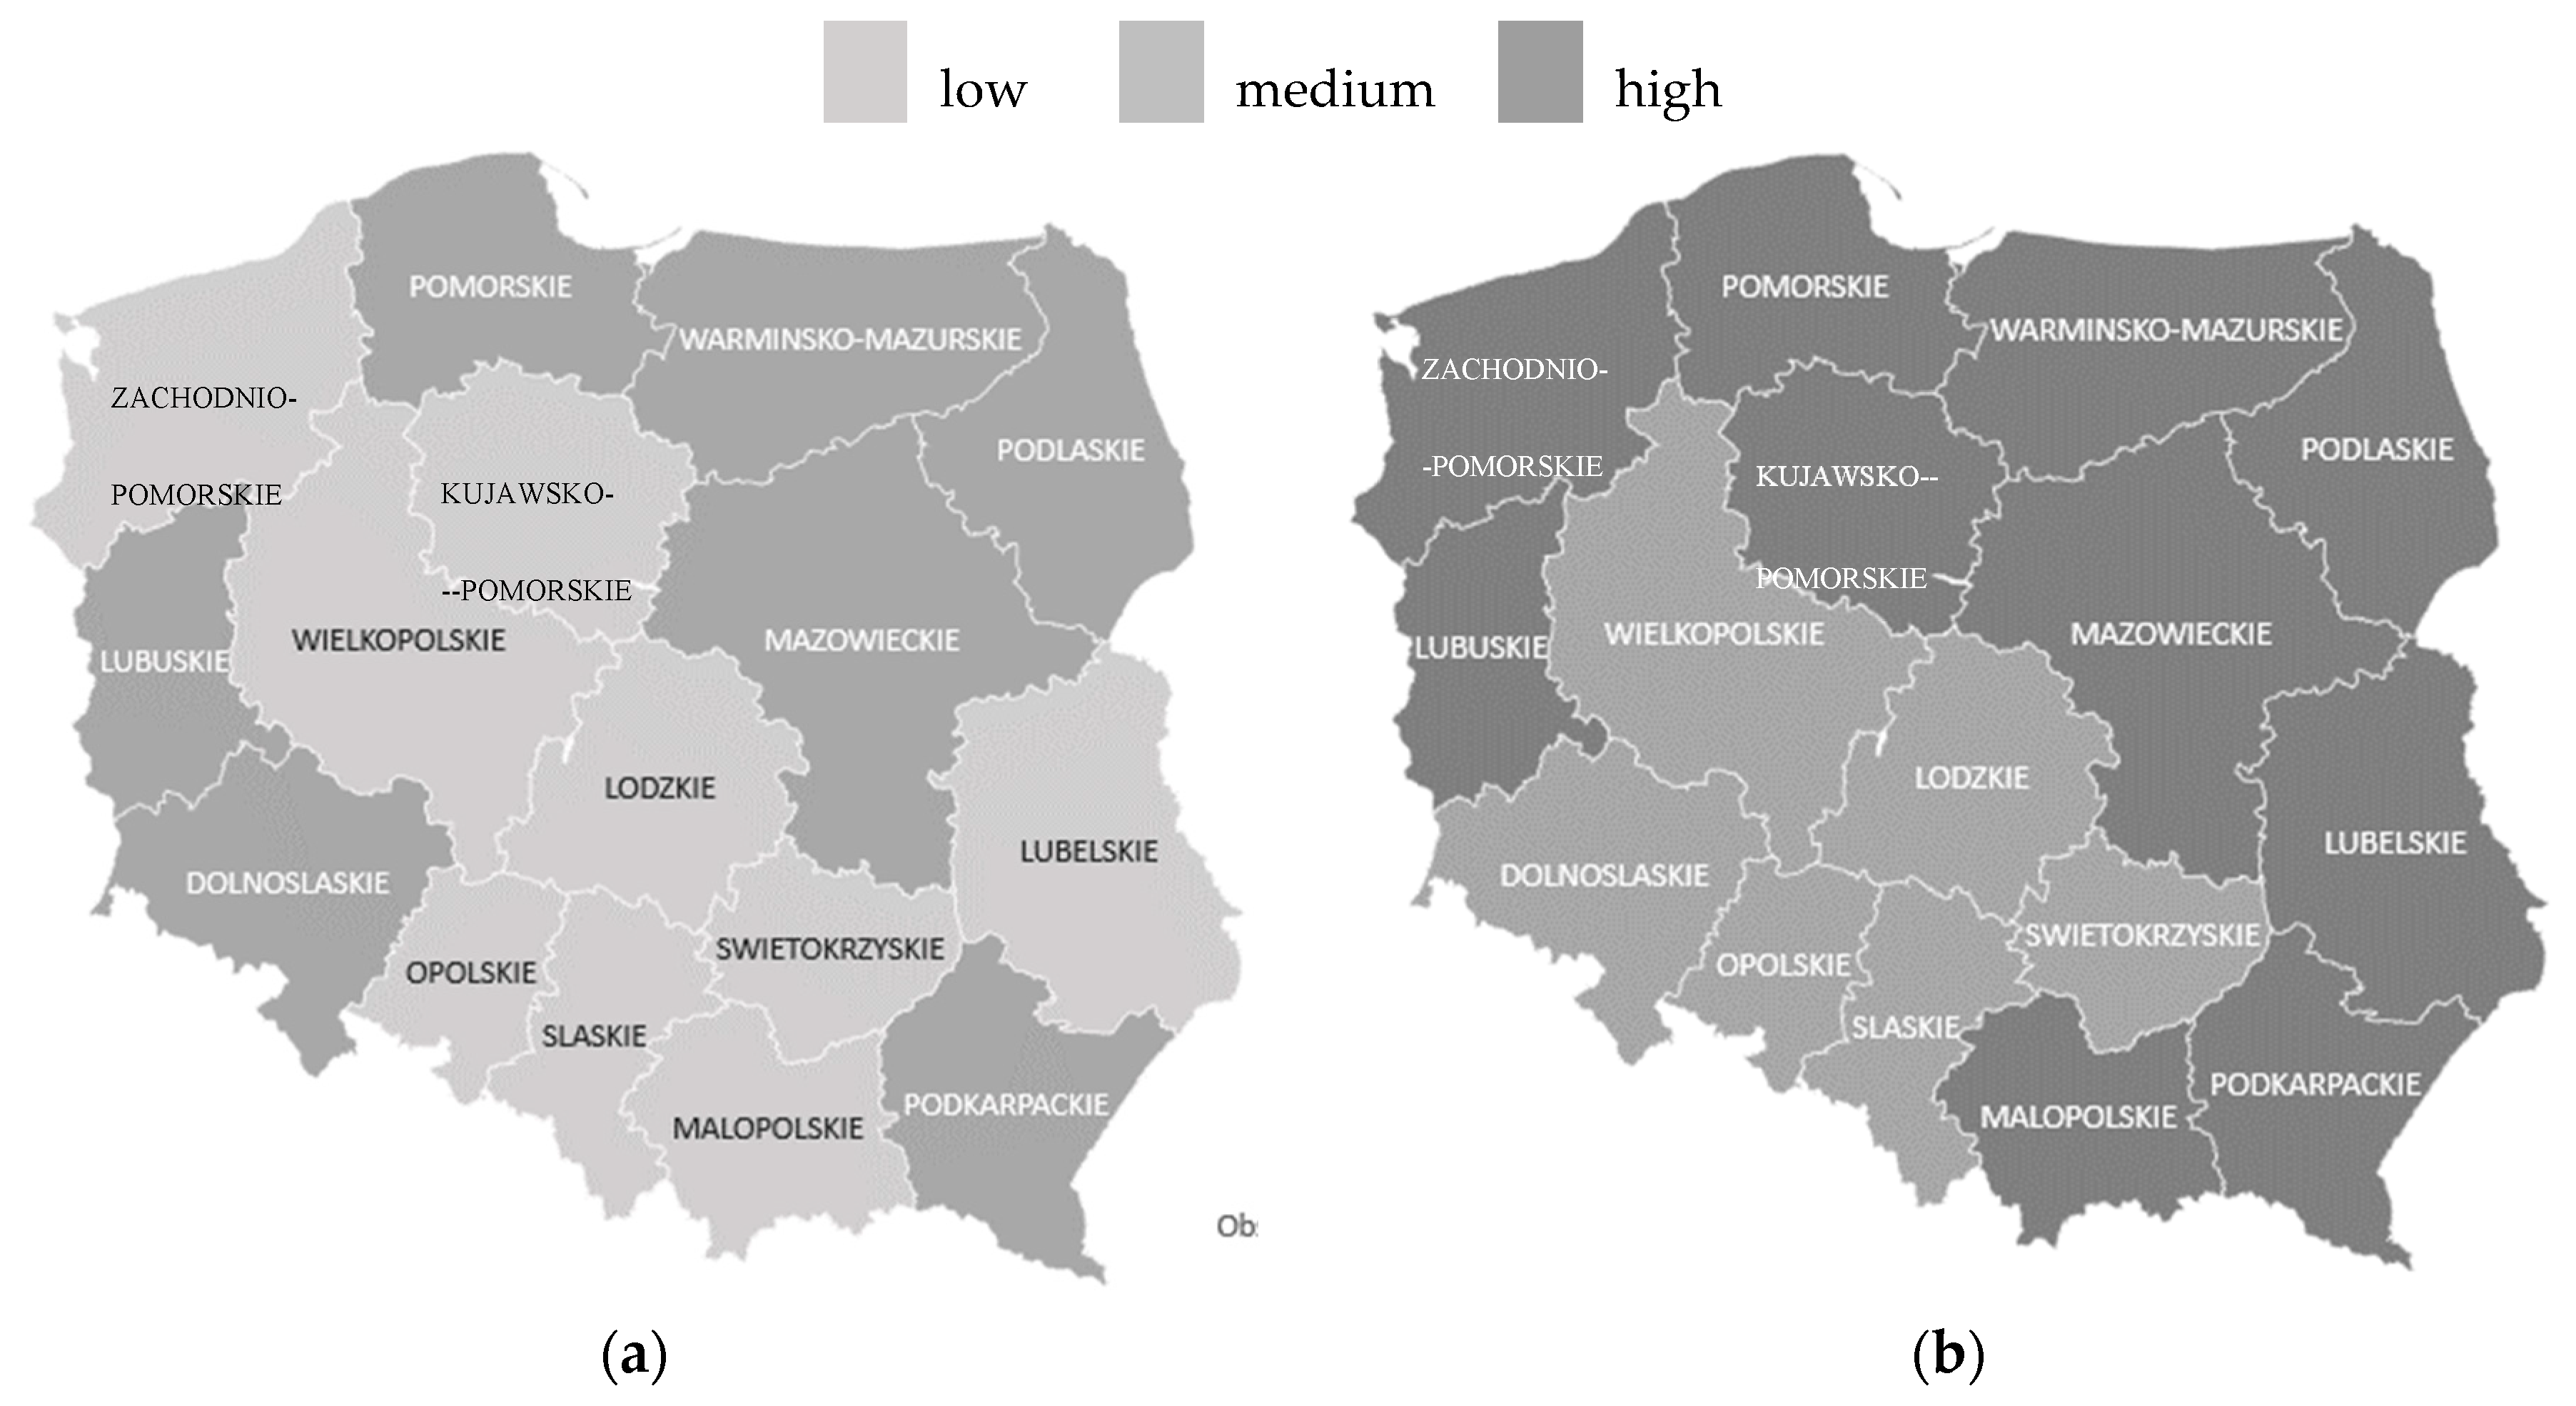
3.4. Classification of Regions Due to Changes in the Level of the Green Economy Index
- low: ;
- medium: ;
- high:
- low: below 0.4074;
- medium: between 0.4074 and 0.4471;
- high: more than 0.4471.
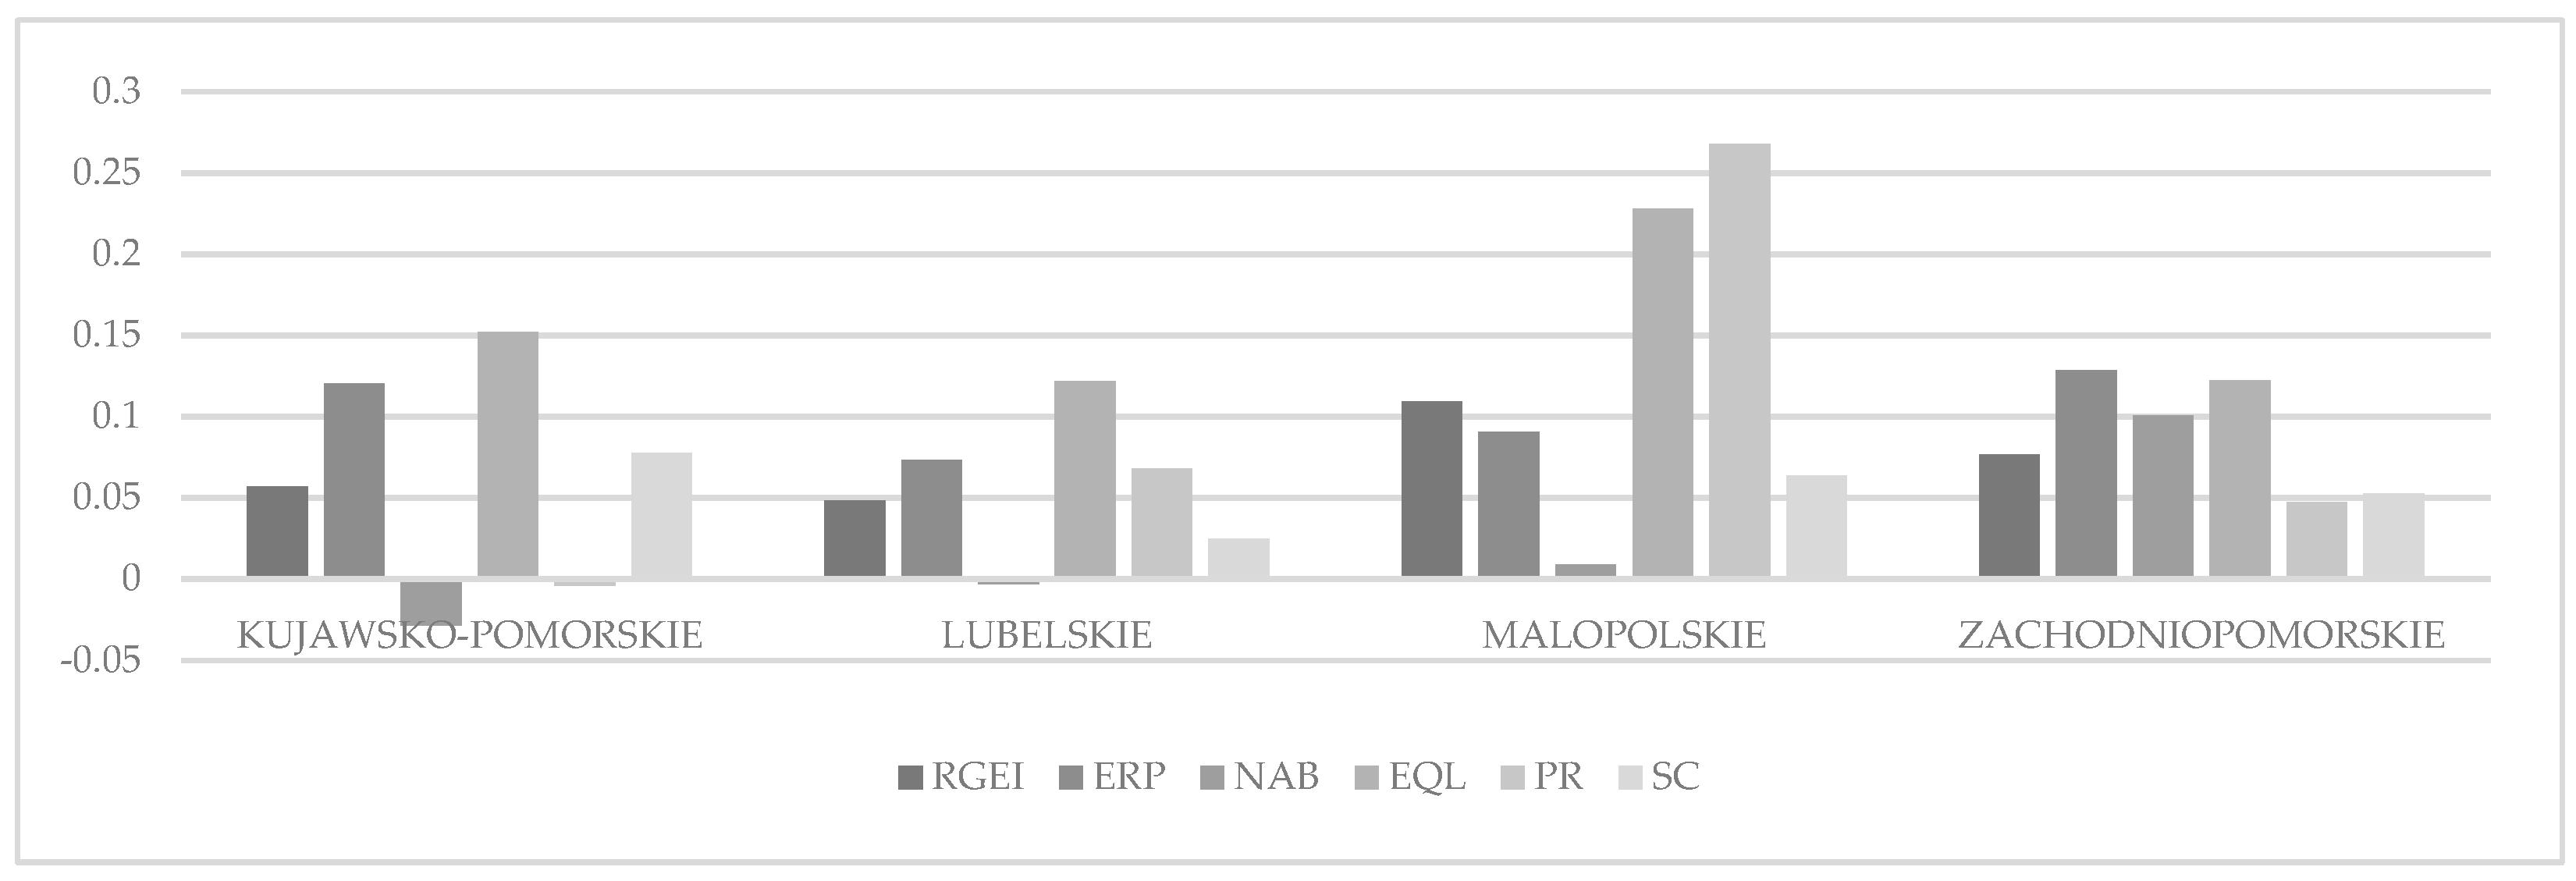
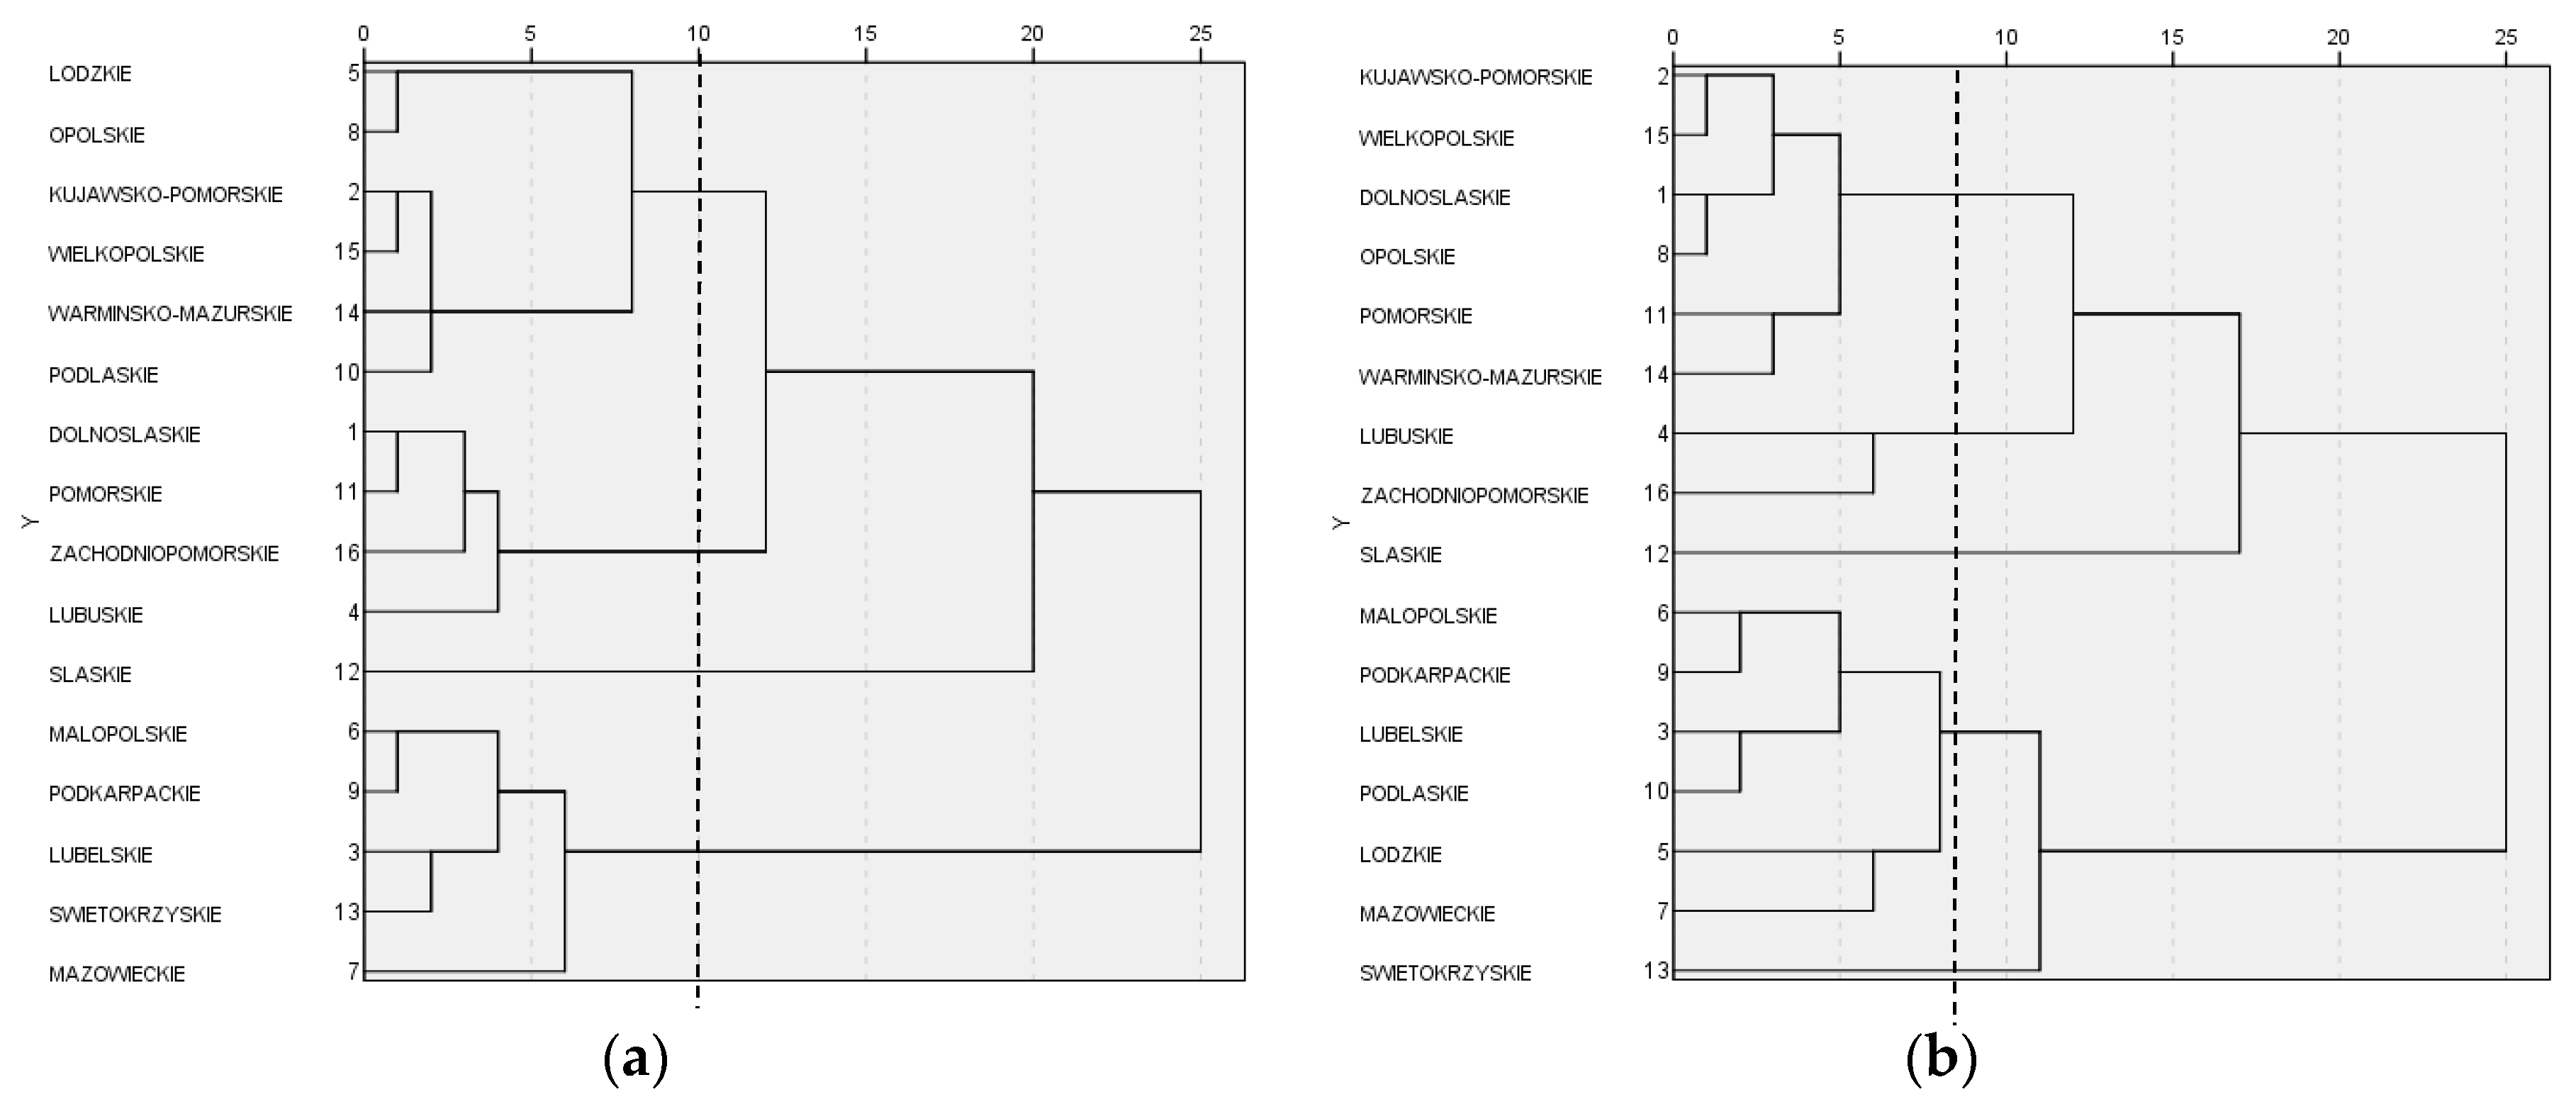
- regions of south-west Poland: Lubuskie, Zachodniopomorskie (with industrial enclaves, but also relatively less populated and with less transformed environments), followed by Slaskie and Dolnoslaskie (higher urbanized, with a greater role for industry);
- regions of eastern and south-eastern Poland, less developed economically, with less developed industry, with a greater share of rural areas and agriculture, with urban enclaves (Podlaskie, Lubelskie, Podkarpackie, but also the Malopolskie Voivodeship);
- central regions with dynamically developing services, with enclave-located industries: Pomorskie, Wielkopolskie, Kujawsko-Pomorskie.
4. Discussion and Conclusions
Author Contributions
Funding
Acknowledgments
Conflicts of Interest
References
- Roland Berger Strategy Consultants Gmbh. Green Growth, Green Profit. How Green Transformation Boosts Business; Palgrave Macmillan: Basingstoke, UK, 2011; p. 21. [Google Scholar]
- Allen, C.; Clouth, S. A guidebook to the Green Economy; UNDESA: New York, NY, USA, 2012; pp. 6–8. [Google Scholar]
- Khoshnava, S.M.; Rostami, R.; Zin, R.M.; Štreimikienė, D.; Yousefpour, A.; Strielkowski, W.; Mardani, A. Aligning the Criteria of Green Economy (GE) and Sustainable Development Goals (SDGs) to Implement Sustainable Development. Sustainability 2019, 11, 4615. [Google Scholar] [CrossRef]
- Newton, A.C. The green economy and the knowledge economy: Exploring the interface. Int. J. Green Econ. 2011, 5, 231. [Google Scholar] [CrossRef]
- Georgeson, L.; Maslin, M.; Poessinouw, M. The global green economy: A review of concepts, definitions, measurement methodologies and their interactions. Geo Geogr. Environ. 2017, 4, e00036. [Google Scholar] [CrossRef]
- Ryszawska, B. Green economy—Theoretical Basics of the Concept and Measuring its Implementation in the European Union, (Zielona Gospodarka—Teoretyczne Podstawy Koncepcji i Pomiar jej Wdrażania w Unii Europejskiej); Wroclaw University of Economics: Wroclaw, Poland, 2013; pp. 50–70. [Google Scholar]
- Nardo, M.; Saisana, M.; Saltelli, A.; Tarantola, S.; Hoffman, A.; Giovannini, E. Handbook on Constructing Composite Indicators; OECD Publishing: Paris, France, 2005. [Google Scholar]
- Saisana, M.; Tarantola, S. State-of-the-Art Report on Current Methodologies and Practices for Composite Indicator Development; European Commission, Joint Research Centre, Institute for the Protection and the Security of the Citizen, Technological and Economic Risk Management Unit: Ispra, Italy, 2002. [Google Scholar]
- Vukovic, N.; Pobedinsky, V.; Mityagin, S.; Drozhzhin Mingaleva, Z. A Study on Green Economy Indicators and Modeling: Russian Context. Sustainability 2019, 11, 4629. [Google Scholar] [CrossRef]
- Stiglitz, J.E.; Sen, A.; Fitoussi, J.P. Report by the Commission on the Measurement of Economic Performance and Social Progress; Commission on the Measurement of Economic Performance and Social Progress: Paris, France, 2010. [Google Scholar]
- Narloch, U.; Kozluk, T.; Lloyd, A. Measuring Inclusive Green Growth at the Country Level. Taking Stock of Measurement Approaches and Indicators; GGKP Working Paper; Green Growth Knowledge Platform, UNEP: Nairobi, Kenya, 2016. [Google Scholar]
- United Nations Environment Programme. PAGE Green Economy Progress Measurement Framework. Evaluating National Progress Towards Poverty Eradication and Shared Prosperity within Planetary Boundaries; Partnership for Action on Green Economy, United Nations Environment Programme: Nairobi, Kenya, 2017. [Google Scholar]
- Nahman, A.; Mahumani, B.K.; de Lange, W.J. Beyond GDP: Towards a Green Economy Index. Dev. South. Afr. 2016, 33, 215–233. [Google Scholar] [CrossRef]
- OECD. Towards Green Growth: Monitoring Progress OECD Indicators; OECD: Paris, France, 2011; pp. 31–35. [Google Scholar]
- UNEP. Measuring Progress towards an inclusive Green Economy; UNEP: Nairobi, Kenya, 2012; pp. 9–18. [Google Scholar]
- Statistics Poland and Statistical Office in Bialystok. Green Economy Indicators in Poland 2017; Statistics Poland and Statistical Office in Bialystok: Bialystok, Poland, 2017.
- Bartolj, T.; Murovec, N.; Slabe-Erker, R. Development of a Household Sustainable Consumption Index and Its Application to EU-28. Sustain. Dev. 2018, 26, 34–50. [Google Scholar] [CrossRef]
- Li, M.; Wang, J.; Chen, Y. Evaluation and Influencing Factors of Sustainable Development Capability of Agriculture in Countries along the Belt and Road Route. Sustainability 2019, 11, 2004. [Google Scholar] [CrossRef]
- Iddrisu, I.; Bhattacharyya, S.C. Sustainable Energy Development Index: A multi-dimensional indicator for measuring sustainable energy development. Renew. Sustain. Energy Rev. 2015, 50, 513–530. [Google Scholar] [CrossRef]
- Bandura, R. Composite indicators and rankings: Inventory 2011; Technical report; Office of Development Studies, United Nations Development Programme (UNDP): New York, NY, USA, 2011. [Google Scholar]
- Yang, L. An inventory of composite measures of human progress, Technical report; United Nations Development Programme Human Development Report Office: New York, NY, USA, 2014. [Google Scholar]
- Global Green Economy Index: Dual Citizen Inc. Available online: dualcitizeninc.com/global-green-economy-index/economic-environmental-indicators.php?id=3 (accessed on 24 July 2019).
- Ryszawska, B. Green Economy Indicators. In Towards a green economy. From ideas to practice; Burchard-Dziubińska, M., Ed.; Wydawnictwo Uniwersytetu Lodzkiego: Lodz, Poland, 2015. [Google Scholar]
- Hellwig, Z. Wielowymiarowa analiza porównawcza i jej zastosowanie w badaniach wielowymiarowych obiektów gospodarczych. (Multidimensional comparative analysis and its application in research on multidimensional economic objects), (chapter in Polish); In Metody i Modele Ekonomiczno-Matematyczne w Doskonaleniu Zarządzania Gospodarką Socjalistyczną; Welfe, W., Ed.; PWE: Warszawa, Poland, 1981; pp. 46–68. [Google Scholar]
- Hwang, C.-L.; Yoon, K. Multiple Attribute Decision Making: Methods and Applications A State-of-the-Art Survey. In Lecture Notes in Economics and Mathematical Systems; Springer: Berlin/Heidelberg, Germany, 1981. [Google Scholar]
- Van De Kerk, G.; Manuel, A. Short Survey of Relevant Indexes and Sets of Indicators Concerning Development towards Sustainability; Northern Alliance for Sustainability: Brussels, Belgium, 2010. [Google Scholar]
- Decancq, K.; Lugo, M.A. Weights in Multidimensional Indices of Wellbeing: An Overview. Econom. Rev. 2013, 32, 7–34. [Google Scholar] [CrossRef]
- Diakoulaki, D.; Mavrotas, G.; Papayannakis, L. Determining objective weights in multiple criteria problems: The critic method. Comput. Oper. Res. 1995, 22, 763–770. [Google Scholar] [CrossRef]
- Gan, X.; Fernandez, I.; Guo, J.; Wilson, M.; Zhao, Y.; Zhou, B.-B.; Wu, J. When to use what: Methods for weighting and aggregating sustainability indicators. Ecol. Indic. 2017, 81, 491–502. [Google Scholar] [CrossRef]
- Carbonaro, I. Measuring Italian well-being by modified TOPSIS. In Proceedings of the 58th World Statistical Congress, Dublin, Ireland, 21–26 August 2011; pp. 4079–4084. [Google Scholar]
- Wang, M.; Zhao, X.; Gong, Q.; Ji, Z. Measurement of Regional Green Economy Sustainable Development Ability Based on Entropy Weight-Topsis-Coupling Coordination Degree—A Case Study in Shandong Province, China. Sustainability 2019, 11, 280. [Google Scholar] [CrossRef]
- Communication from the Commission EUROPE 2020 A strategy for smart, sustainable and inclusive growth, European Commission Brussels, 3.3.2010 COM(2010) 2020. Available online: https://eur-lex.europa.eu/legal-content/en/ALL/?uri=CELEX%3A52010DC2020 (accessed on 11 April 2019).
- European Parliament resolution of 15 March 2012 on a Roadmap for moving to a competitive low carbon economy in 2050, 2011/2095(INI). Available online: https://eur-lex.europa.eu/legal-content/en/ALL/?uri=CELEX:52011DC0112 (accessed on 11 April 2019).
- Communication from the Commission to the European Parliament, the Council, the European Economic and Social Committee and the Committee of the Regions Roadmap to a Resource Efficient Europe, COM/2011/0571 final. Available online: https://eur-lex.europa.eu/legal-content/EN/TXT/?uri=CELEX%3A52011DC0571 (accessed on 11 April 2019).
- Communication from the Commission to the European Parliament, the Council, the European Economic and Social Committee and the Committee of the Regions: Closing the loop - An EU action plan for the Circular Economy, COM/2015/0614 final. Available online: https://eur-lex.europa.eu/legal-content/EN/TXT/?uri=CELEX%3A52015DC0614 (accessed on 12 April 2019).
- EU Cohesion Policy 2014–2020, Targeting Investments on Key Growth Priorities, European Commission 2013. Available online: https://ec.europa.eu/regional_policy/sources/docgener/informat/2014/fiche_low_carbon_en.pdf (accessed on 30 August 2019).
- Roszkowska, E.; Filipowicz-Chomko, M. Ocena realizacji koncepcji zrównoważonego rozwoju województw Polski w zakresie poziomu rozwoju społecznego w roku 2005 oraz 2013. Optimum 2016, 3, 94–118. [Google Scholar] [CrossRef]
- Iwacewicz-Orłowska, A.; Sokołowska, D. Ocena realizacji koncepcji zrównoważonego rozwoju w podregionach województw Polski Wschodniej z wykorzystaniem metody wzorca rozwoju Hellwiga. Optimum 2016, 1, 182–197. [Google Scholar] [CrossRef]
- Perło, D. Modelling green economy in the Podlaskie province as a management tool of sustainable development of the region (article in Polish). Zarządzanie Finans. 2013, 11, 207–224. [Google Scholar]
- Li, X.; Pan, J. China Green Development Index Report 2012; Springer: Berlin, Germany, 2013. [Google Scholar]
- Li, J.; Lin, B. Green Economy Performance and Green Productivity Growth in China’s Cities: Measures and Policy Implication. Sustainability 2016, 8, 947. [Google Scholar] [CrossRef]
- Wei, C.; Ni, J.; Du, L. Regional allocation of carbon dioxide abatement in China. China Econ. Rev. 2012, 23, 552–565. [Google Scholar] [CrossRef]
- Su, M.; Li, R.; Lu, W.; Chen, C.; Chen, B.; Yang, Z. Evaluation of a Low-Carbon City: Method and Application. Entropy 2013, 15, 1171–1185. [Google Scholar] [CrossRef]
- Shi, B.; Yang, H.; Wang, J.; Zhao, J. City Green Economy Evaluation: Empirical Evidence from 15 Sub-Provincial Cities in China. Sustainability 2016, 8, 551. [Google Scholar] [CrossRef]
- Shi, L.; Xiang, X.; Zhu, W.; Gao, L. Standardization of the Evaluation Index System for Low-Carbon Cities in China: A Case Study of Xiamen. Sustainability 2018, 10, 3751. [Google Scholar] [CrossRef]
- STRATEG. Available online: https://strateg.stat.gov.pl (accessed on 12 July 2019).
- Statistics Poland. Statistical Yearbook of the Regions—Poland; Statistics Poland: Warsaw, Poland, 2017.
- United Nations. Human Development Report 2014. Technical notes; United Nations: San Francisco, CA, USA, 2014.
- Kahneman, D.; Deaton, A. High income improves evaluation of life but not emotional well-being. Proc. Natl. Acad. Sci. USA 2010, 107, 16489. [Google Scholar] [CrossRef] [PubMed]
- Roszkowska, E.; Lašakevič, R. Taxonomic analysis of development disparities of Lithuanian labour market in 2004–2014 (paper in Polish). Optim. Econ. Stud. 2018, 6, 42–61. [Google Scholar] [CrossRef]
- Młodak, A. Taxonomic Analysis in Regional Statistics; (Analiza Taksonomiczna w Statystyce Regionalnej); Difin: Warszawa, Poland, 2006; pp. 28–33. [Google Scholar]
- Lotfi, F.H.; Fallahnejad, R. Imprecise Shannon’s Entropy and Multi Attribute Decision Making. Entropy 2010, 12, 53–62. [Google Scholar] [CrossRef]
- Guidance Document on Evaluation Plans. Terms of Reference for Impact Evaluations. Guidance on Quality Management of External Evaluations, European Commission, DG Regional and Urban Policy, Brussels 2015. Available online: https://ec.europa.eu/regional_policy/sources/docoffic/2014/working/evaluation_plan_guidance_en.pdf (accessed on 4 September 2019).
- Dvorak, J. Evaluation of the European Union structural funds’ support in Poland: Scope and significance. Balt. J. Law Politics 2010, 3, 53–75. [Google Scholar] [CrossRef][Green Version]
- Kupiec, T. Evaluation Practice of Regional Operational Programmes in Poland. Manag. Bus. Adm. Cent. Eur. 2014, 126, 135–151. [Google Scholar] [CrossRef]
- Nigohosyan, D.; Vutsova, A. The 2014–2020 European Regional Development Fund Indicators: The Incomplete Evolution. Soc. Indic. Res. 2018, 137, 559–577. [Google Scholar] [CrossRef]
| Aspects | Global Green Economy Index | Green Economy Index | Green Economy Progress Index | Green Growth Index |
|---|---|---|---|---|
| Subdomains covered/indicators | Leadership and climate change, efficiency sectors, markets and investment, environment. Total of 20 indicators | Total of 26 indicators (currently data available for 20 indicators) | Total of 13 indicators | Natural assets, resource efficiency and decoupling, risks and resilience, economic opportunities/efforts, inclusiveness. Total of 15 indicators |
| Normalization (standardisation) method | Z-score and associated percentiles | Min-max [0–10], values for minimum and maximum based on natural or target minima and maxima, if possible | Relative distance between the actual change observed and the desired change (target) of an indicator with respect to a threshold for the indicator | Min-max [0–1], values for minimum and maximum thresholds based on international standards or targets; adjustment for outliers and scaling |
| Weighting | Equal weights except for the Leadership and climate change dimension | Equal weights | Individual weights for countries | Under discussion |
| Form of final result | 0–100 | 0–10 | <0 regress <−1 high regress >0 progress 1—target met >1—high progress | 0–1 |
| Region | Population [In Thousands] | Index of Urbanization [%] | GDP per Inhabitant in Relation to the National Average [%] | Sold Production of Industry [%] | Protected Natural Area [% of Grand Total Area] |
|---|---|---|---|---|---|
| Poland | 38,433.0 | 60.2 | 100.0 | 100.0 | 32.5 |
| Dolnoslaskie | 2903.7 | 69.0 | 110.8 | 9.0 | 18.6 |
| Kujawsko-Pomorskie | 2083.9 | 59.5 | 81.6 | 4.2 | 31.8 |
| Lubelskie | 2133.3 | 46.4 | 68.9 | 2.8 | 22.8 |
| Lubuskie | 1017.4 | 64.9 | 83.9 | 2.5 | 38.1 |
| Lodzkie | 2485.3 | 62.9 | 93.3 | 5.8 | 19.7 |
| Małopolskie | 3382.3 | 48.4 | 90.6 | 6.9 | 53.0 |
| Mazowieckie | 5365.9 | 64.3 | 159.7 | 19.0 | 29.7 |
| Opolskie | 993.0 | 51.9 | 79.6 | 1.9 | 27.7 |
| Podkarpackie | 2127.7 | 41.2 | 70.4 | 3.3 | 44.9 |
| Podlaskie | 1186.6 | 60.7 | 70.8 | 1.8 | 31.6 |
| Pomorskie | 2315.6 | 64.2 | 96.9 | 6.7 | 32.7 |
| Slaskie | 4559.2 | 77.0 | 103.6 | 16.6 | 22.0 |
| Swietokrzyskie | 1252.9 | 44.6 | 71.5 | 1.9 | 64.6 |
| Warminsko-Mazurskie | 1436.4 | 59.0 | 71.3 | 2.4 | 46.7 |
| Wielkopolskie | 3481.6 | 54.7 | 109.1 | 12.2 | 31.6 |
| Zachodniopomorskie | 1708.2 | 68.5 | 83.8 | 3.0 | 21.9 |
| Subsystem | OECD Indicator | Regional Indicator for Poland | Unit | Indicator Type (+/-) | Selection Decision |
|---|---|---|---|---|---|
| Environmental and resource productivity (ERP) | Production-based CO2 productivity, GDP per unit of energy-related CO2 emissions | Production-based CO2 productivity, GDP per unit of CO2 emissions from plants especially noxious to air purity | PLN(2004) per kg CO2 | + | Excluded by correlation |
| Production-based CO2 intensity, energy-related CO2 per capita | Production-based CO2 intensity, CO2 emissions from plants especially noxious to air purity per capita | tonnes per person | _ | Included | |
| Energy productivity, GDP per unit of TPES | Energy productivity, GDP per electric energy consumption | PLN(2004) per kWh | + | Included | |
| Energy intensity, TPES per capita | Electric energy consumption per capita | kWh per person | _ | Excluded by correlation | |
| Renewable electricity, % total electricity generation | Share of renewable energy sources in total consumption of electricity | % | + | Included | |
| Nitrogen balance, kg per hectare | Consumption of nitrogenous (N) fertilizers per 1 ha of agricultural land | kg/ha | _ | Included | |
| Phosphorus balance, kg per hectare | Consumption of phosphatic (P2O5) fertilizers per 1 ha of agricultural land | kg/ha | _ | Excluded by correlation | |
| Municipal waste generated, kg per capita | Municipal waste collected during the year per capita | kg per person | _ | Included | |
| Municipal waste disposed to landfills, % treated waste | Waste landfilled in relation to the mixed municipal waste collected | % | _ | Included | |
| Municipal waste recycled or composted, % treated waste | Waste collected separately in relation to the total municipal waste collected | % | + | Excluded by correlation | |
| Natural asset base (NAB) | Total freshwater abstraction per capita | Consumption of water per capita | m3 per person | _ | Included |
| Natural and semi-natural vegetated land, % total | Natural and semi-natural vegetated areas (forests and ecological areas) | % of total area | + | Included | |
| Bare land, % total | Waste land | % of total area | - | Excluded by correlation | |
| Cropland, % total | Agricultural land | % of total area | + | Included | |
| Artificial surfaces, % total | Built-up and urbanized areas | % of total area | - | Excluded by correlation | |
| Water, % total | Lands under waters | % of total area | + | Excluded by correlation | |
| - | Organic farming | % of agricultural land | + | Included | |
| Intensity of use of forests resources | Wood extraction | m3 of wood per ha of forests | - | Included | |
| Environmental dimension of quality of life (EDQL) | Exposure to air pollution | Emission of air pollutants-gases (excluding CO2) | tonnes per 1 km2 of area | - | Included |
| Percentage of population exposed to more than 35 micrograms/m3 | Emission of air pollutants—particulates | tonnes per 1 km2 of area | - | Included | |
| Population with access to improved drinking water sources, % total population | Population connected to water supply systems | % of total population | + | Included | |
| Population connected to public sewerage, % total population | Population connected to sewerage systems, | % of total population | + | Included | |
| Population connected to sewerage with tertiary treatment, % total population | Population connected to wastewater treatment plants with increased biogene removal, % of population | % of total population | + | Excluded by correlation | |
| Economic opportunities and policy responses (EOPR) | - | Regeneration and afforestation in relation to forest area | % | + | Included |
| Threatened mammal/bird/vascular plant species, % total known species | Number of protected animals | Index, 2004 = 100 | + | Included | |
| Renewable energy public RD and D budget, % total energy public RD and D | Outlays on fixed assets related to energy savings | % GDP | + | Included | |
| - | Outlays on fixed assets related to waste management, % GDP | % GDP | + | Included | |
| Socio-economic context (SEC) | Value added in agriculture, % of total gross value added | Value added in agriculture | % of total value added | - | Included |
| Value added in industry, % of total gross value added | Value added in industry | % of total value added | - | Excluded by correlation | |
| Value added in services, % of total gross value added | Value added in services | % of total value added | + | Included | |
| Gross domestic product per capita | Real GDP per capita | PLN (2004) per capita | + | Included | |
| Population density, person per 1 km2 | Population density | inhabitants per km2 | - | Included |
| Subsystem | Variable | Max | Min | Weight | Weight of an Index for a Subsystem | Weight of a Variable within a Subsystem |
|---|---|---|---|---|---|---|
| Environmental and resource productivity | Production-based CO2 intensity, CO2 emissions from plants especially noxious to air purity, [tonnes per capita] | 17.04 (Lodzkie 2013) | 0.95 (Warminsko-Mazurskie 2011) | 0.043515 | 0.260787 | 0.166859 |
| Energy productivity, GDP per electric energy consumption, [PLN 2004/1 kWh] | 21.58 (Mazowieckie 2015) | 5.29 (Opolskie 2006) | 0.04349 | 0.166765 | ||
| Share of renewable energy sources in total consumption of electricity, [%] | 63.82 (Zachodnio—pomorskie 2015) | 0.08 (Lubelskie 2004) | 0.043379 | 0.166338 | ||
| Consumption of nitrogenous (N) fertilizers per 1 ha of agricultural land [kg/ha] | 129.70 (Opolskie 2011) | 30.82 (Podkarpackie 2004) | 0.04352 | 0.166879 | ||
| Municipal waste collected during the year per capita [kg/person] | 360.62 (Dolnoslaskie 2011) | 132.31 (Swietokrzyskie 2013) | 0.043496 | 0.166786 | ||
| Waste landfilled in relation to the mixed municipal waste collected [%] | 100.00 (Lubelskie. Opolskie. Podkarpackie. Swietokrzyskie 2004) | 29.90 (Malopolskie 2016) | 0.043388 | 0.166373 | ||
| Natural asset base | Consumption of water per capita [m3/person] | 1129.34 (Swietokrzyskie 2016) | 64.51 (Podlaskie 2004) | 0.043515 | 0.217373 | 0.200186 |
| Forests and ecological areas, [% of total area] | 51.63 (Lubuskie 2016) | 21.04 (Lodzkie 2004) | 0.043464 | 0.199951 | ||
| Agricultural land total, [% of total area] | 72.27) (Lodzkie 2004) | 40.33 (Lubuskie 2016) | 0.043503 | 0.200129 | ||
| Organic farming [% of agricultural land] | 15.59 (Zachodnio-pomorskie 2016) | 0.08 (Opolskie 2004) | 0.043391 | 0.199614 | ||
| Intensity of use of forests resources, wood extraction [m3 of per ha of forests] | 5.96 (Slaskie 2007) | 2.34 (Mazowieckie 2006) | 0.043501 | 0.20012 | ||
| Environmental dimension of quality of life | Population connected to water supply systems [% of population] | 96.80 (Opolskie 2016) | 71.40 (Malopolskie 2004) | 0.043513 | 0.174075 | 0.250408 |
| Population connected to sewerage systems [% of population] | 82.90 (Pomorskie 2016) | 43.00 (Swietokrzyskie 2004) | 0.043503 | 0.25035 | ||
| Emission of air pollutants-gases (excluding CO2) [t per 1 km2 of area] | 62.81 (Slaskie 2015) | 0.35 (Warminsko-Mazurskie 2014) | 0.043525 | 0.250473 | ||
| Emission of air pollutants—particulates [t per 1 km2 of area] | 2.15 (Slaskie 2004) | 0.03 (Warminsko-Mazurskie 2016) | 0.043534 | 0.250525 | ||
| Policy responces | Regeneration and afforestations in relation to forest area [%] | 1.19 (Warminsko-mazurskie 2006) | 0.30 (Podlaskie 2009) | 0.043504 | 0.17377 | 0.250355 |
| Number of protected animals, index [2004 = 100] | 1364.74 (Slaskie 2016) | 21.55 (Mazowieckie 2005) | 0.043419 | 0.249864 | ||
| Outlays on fixed assets serving energy efficiency, [% of GDP] | 0.13 (Swietokrzyskie 2015) | 0.00 (Podkarpackie 2007) | 0.043436 | 0.249961 | ||
| Outlays on fixed assets serving waste management, [% of GDP] | 0.60 (Wielkopolskie 2015) | 0.00 (Lubuskie 2006) | 0.043411 | 0.24982 | ||
| Socio-economic context | Value added in agriculture, [% of total gross value added] | 8.70 (Podlaskie 2013) | 0.60 (Slaskie 2015) | 0.043516 | 0.173996 | 0.250425 |
| Value added in services, [% of total gross value added] | 74.50 (Mazowieckie 2009) | 54.00 (Dolnoslaskie 2011) | 0.043491 | 0.250281 | ||
| Gross domestic product per capita, [constant prices 2004] | 62841.63 (Mazowieckie 2016) | 17302.00 (Lubelskie 2004) | 0.04347 | 0.250161 | ||
| Population density [person per 1 km2] | 381.23 (Slaskie 2004) | 58.78 (Podlaskie 2016) | 0.043518 | 0.250434 |
| Regions | Environment and Resource Productivity | Natural Assets Base | Environmental Quality of Life | Policy Response | Socio-Economic Context | |||||
|---|---|---|---|---|---|---|---|---|---|---|
| 2004 | 2016 | 2004 | 2016 | 2004 | 2016 | 2004 | 2016 | 2004 | 2016 | |
| Dolnoslaskie | 0.22 | 0.25 | 0.48 | 0.45 | 0.73 | 0.90 | 0.39 | 0.26 | 0.51 | 0.56 |
| Kujawsko-Pomorskie | 0.24 | 0.36 | 0.50 | 0.47 | 0.68 | 0.83 | 0.26 | 0.25 | 0.42 | 0.50 |
| Lubelskie | 0.26 | 0.34 | 0.54 | 0.54 | 0.50 | 0.62 | 0.11 | 0.18 | 0.50 | 0.52 |
| Lubuskie | 0.25 | 0.31 | 0.49 | 0.55 | 0.68 | 0.87 | 0.27 | 0.50 | 0.48 | 0.50 |
| Lodzkie | 0.20 | 0.35 | 0.54 | 0.53 | 0.62 | 0.76 | 0.36 | 0.34 | 0.43 | 0.52 |
| Malopolskie | 0.26 | 0.35 | 0.53 | 0.54 | 0.40 | 0.63 | 0.08 | 0.35 | 0.51 | 0.57 |
| Mazowieckie | 0.25 | 0.31 | 0.51 | 0.51 | 0.56 | 0.77 | 0.13 | 0.13 | 0.68 | 0.82 |
| Opolskie | 0.20 | 0.26 | 0.50 | 0.44 | 0.64 | 0.86 | 0.30 | 0.33 | 0.42 | 0.49 |
| Podkarpackie | 0.28 | 0.38 | 0.56 | 0.54 | 0.49 | 0.67 | 0.22 | 0.19 | 0.52 | 0.53 |
| Podlaskie | 0.27 | 0.41 | 0.54 | 0.57 | 0.64 | 0.75 | 0.13 | 0.21 | 0.45 | 0.48 |
| Pomorskie | 0.24 | 0.35 | 0.48 | 0.47 | 0.82 | 0.98 | 0.24 | 0.33 | 0.56 | 0.59 |
| Slaskie | 0.23 | 0.27 | 0.48 | 0.46 | 0.44 | 0.61 | 0.25 | 0.52 | 0.38 | 0.46 |
| Swietokrzyskie | 0.27 | 0.41 | 0.46 | 0.38 | 0.49 | 0.69 | 0.17 | 0.22 | 0.44 | 0.49 |
| Warminsko-Mazurskie | 0.26 | 0.35 | 0.46 | 0.54 | 0.71 | 0.88 | 0.29 | 0.25 | 0.44 | 0.47 |
| Wielkopolskie | 0.22 | 0.32 | 0.44 | 0.42 | 0.66 | 0.85 | 0.24 | 0.26 | 0.41 | 0.53 |
| Zachodniopomorskie | 0.22 | 0.35 | 0.30 | 0.40 | 0.84 | 0.96 | 0.28 | 0.33 | 0.55 | 0.60 |
| Regions | RGEI 2004 | Ranking 2004 | RGEI 2016 | Ranking 2016 |
|---|---|---|---|---|
| Dolnoslaskie | 0.4293 | 2 | 0.4389 | 11 |
| Kujawsko-Pomorskie | 0.3955 | 10 | 0.4522 | 10 |
| Lubelskie | 0.4056 | 8 | 0.4537 | 9 |
| Lubuskie | 0.4125 | 7 | 0.5017 | 1 |
| Lodzkie | 0.3865 | 11 | 0.4312 | 13 |
| Malopolskie | 0.3613 | 14 | 0.4705 | 8 |
| Mazowieckie | 0.4249 | 3 | 0.4942 | 2 |
| Opolskie | 0.3696 | 12 | 0.4161 | 15 |
| Podkarpackie | 0.4248 | 4 | 0.4784 | 7 |
| Podlaskie | 0.4240 | 5 | 0.4941 | 3 |
| Pomorskie | 0.4358 | 1 | 0.4840 | 5 |
| Slaskie | 0.3012 | 16 | 0.4205 | 14 |
| Swietokrzyskie | 0.3574 | 15 | 0.4148 | 16 |
| Warminsko-Mazurskie | 0.4188 | 6 | 0.4897 | 4 |
| Wielkopolskie | 0.3621 | 13 | 0.4327 | 12 |
| Zachodniopomorskie | 0.4054 | 9 | 0.4819 | 6 |
© 2019 by the authors. Licensee MDPI, Basel, Switzerland. This article is an open access article distributed under the terms and conditions of the Creative Commons Attribution (CC BY) license (http://creativecommons.org/licenses/by/4.0/).
Share and Cite
Godlewska, J.; Sidorczuk-Pietraszko, E. Taxonomic Assessment of Transition to the Green Economy in Polish Regions. Sustainability 2019, 11, 5098. https://doi.org/10.3390/su11185098
Godlewska J, Sidorczuk-Pietraszko E. Taxonomic Assessment of Transition to the Green Economy in Polish Regions. Sustainability. 2019; 11(18):5098. https://doi.org/10.3390/su11185098
Chicago/Turabian StyleGodlewska, Joanna, and Edyta Sidorczuk-Pietraszko. 2019. "Taxonomic Assessment of Transition to the Green Economy in Polish Regions" Sustainability 11, no. 18: 5098. https://doi.org/10.3390/su11185098
APA StyleGodlewska, J., & Sidorczuk-Pietraszko, E. (2019). Taxonomic Assessment of Transition to the Green Economy in Polish Regions. Sustainability, 11(18), 5098. https://doi.org/10.3390/su11185098


