Article

Quantifying the Spatial Integration Patterns of Urban Agglomerations along an Inter-City Gradient

1
College of Resources and Environment Sciences, Hunan Normal University, Changsha 410081, China
2
Key Laboratory of Geospatial Big Data Mining and Application, Changsha 410081, China
3
Department of Urban and Rural Planning, Hunan University, Changsha 410082, China
4
School of Remote Sensing and Information Engineering, Wuhan University, Wuhan 430079, China
5
Department of Land Surveying and Geo-Informatics, The Hongkong Polytechnic University, Hongkong, China
*
Authors to whom correspondence should be addressed.
These authors contributed equally to this work.
Sustainability 2019, 11(18), 5000; https://doi.org/10.3390/su11185000
Submission received: 3 August 2019 / Revised: 4 September 2019 / Accepted: 9 September 2019 / Published: 12 September 2019

Abstract

:
Understanding the integration process of urban agglomeration is essential for sustainable regional development and urban planning. However, few studies have analyzed the spatial integration patterns of metropolitan regions according to the impacts of landscape ecology along rail transit corridors. This study performed a comprehensive inter-city gradient analysis using landscape metrics and radar charts in order to determine the integration characteristics of an urban agglomeration. Specifically, we analyzed the evolution of spatial heterogeneity and functional landscapes along gradient transects in the Changsha–Zhuzhou–Xiangtan (CZT) metropolitan region during the period of 1995–2015. Four landscape functional zones (urban center, urban area, urban–rural fringe, and green core) were identified based on a cluster analysis of landscape composition, connectivity, and fragmentation. The landscape metric NP/LPI (number of patches/largest patch index) was proposed to identify the urban–rural fringe, which revealed that the CZT region exhibited a more aggregated form, characterized by a single-core, continuous development, and the compression of green space. The integration of cities has resulted in continued compression and fragmentation of ecological space. Therefore, strategies for controlling urban expansion should be adopted for sustainable urban development. The proposed method can be used to quantify the integration characteristics of urban agglomerations, providing scientific support for urban landscape planning.

1. Introduction

Cities are usually the main carriers of capital, labor, and information. A large number of the world’s population has settled in urban areas; this figure is projected to increase to approximately 6.3 billion by 2050 [1]. Due to city-centered regional development and industrialization, the spatial evolution of urban land will be characterized by alternating processes of diffusion and coalescence, which will inevitably lead to urban agglomeration [2,3]. Urban agglomerations, also defined as megalopolises or metropolitan areas, are an advanced form of spatial organization for cities, characterized by contiguous areas of constantly developed urban territories with increasing economic interconnection [4]. Cities within an urban agglomeration are ordered and have a clear hierarchy and division of functions. The unprecedented growth of urban agglomerations has resulted in profound and irreversible changes to socioeconomic system development, as well as various environmental and ecological challenges, including massive rural-urban migration [5,6,7], drastic landscape structural changes [8,9,10], and intensive anthropogenic activities [11,12]. Therefore, identifying the structures, inter-city interactions, and impact factors of urban agglomerations is not only a fundamental societal challenge, but also essential for understanding sustainable regional development trends and supporting urban planning and decision-making [13].
From the early 20th century, urban studies have proposed various theories to describe the emerging spatial organization of city clusters, such as the concentric zone model [14], the sector model [15], and the multiple nuclei model [16]. The geographer Gottmann presented the concept of a megalopolis [17] and Fang defined an urban agglomeration from six specific perspectives [4]. Many studies have investigated the process of urban development using the dynamics of land use patterns or urban morphology at the individual prefectural level (e.g., Morelia [18], Hangzhou [19], Tianjin [20]) or urban agglomeration level (e.g., European Metropolitan Regions [21], the Pearl River Delta [22,23], Jing-Jin-Ji Metropolitan Region [20], and the Yangtze River Delta [24]). However, some important gaps remain in current urban agglomeration-level research. For example, the majority of previous studies focused on the regional network structure or dynamic characteristics of a city; therefore, the spatial integration patterns and interaction features of urban agglomerations are not well understood. The spatial integration is a spatial and functional interaction process within and between cities of urban agglomeration and reflects the level of cooperation between cities [25]. Recently, remarkable achievements of interaction features have been made by methods in advancing the analysis of regional interaction [26,27]. But most of these methods simplify cities into points, thus ignoring the spatio-temporal changes of land use and landscape in the process of urban integration.
Land use is an important parameter for assessing regional and global environmental changes; thus, numerous studies have conducted empirical investigations on the delineation of urban land use patterns and changes in urban agglomerations [28,29,30]. Landscape metrics are widely used to quantify landscape patterns and their changes, as well as interactions between the natural environment and human activities [24,31,32,33,34]. Within urban areas and urban–rural fringes, landscapes are predominantly dominated by human activities. Some fundamental approaches can provide an overview of changes in land use structure, such as the growth rate or a land use transfer matrix [19,35]. However, urban land is constantly diffusing and coalescing. Landscape patterns and their changes are spatially heterogeneous and urban expansion has directional characteristics, which cannot be expressed by existing indicators. Moreover, existing theories mainly focus on the inherent drivers of human land use variations and the qualitative inner hierarchical structure of functions, rather than interactions between the ecological environment and human land use, which is a prerequisite for sustainable urban agglomeration. Thus, integrating landscape ecology with urban integration could provide solutions to emerging urbanization problems and ensure both environmental and socio-economic sustainability. From this perspective, it is essential to characterize urban integration and its gradient variations in order to explore the connections between landscape ecology and urban agglomerations through urban functional landscapes.
Transportation systems have an important impact on urban forms and expansion processes [36]. Unlike other modes of transportation, rail transit typically connects neighboring cities and makes urban forms more compact, thereby effectively reflecting the integration characteristics of urban agglomerations [37,38,39]. For example, Huang reviewed research on rail transit in the United States and Canada and revealed that it has a positive impact on land use near railway stations [40]. A study by Pan and Zhang showed that the rail transit system in Shanghai shapes urban expansion and restructuring by attracting new development or redevelopment to areas covered by the rail network [37]. These studies analyzed urban structure or changes in land use near transit stations; however, research on the integration characteristics of urban agglomeration along an inter-city rail network are rare. Li et al. analyzed the spatial heterogeneity and urban structural changes along the Guangzhou-Foshan inter-city rail network, revealing the metropolitan coalescence process and the significant impact of rail transit on urban expansion at the urban fringes [2]. However, their research did not consider the interactions between landscape ecology and urban agglomerations along the inter-city rail transit corridor.
To understand the urban expansion process, the spatio-temporal characteristics of urbanization are generally evaluated using gradient analysis. The gradient approach can be used to effectively quantify local spatial landscape patterns using a constant sampling size. For example, Luck et al. investigated the spatio-temporal characteristics of urbanization in Arizona, USA, by combining the gradient paradigm with landscape metrics [41,42]. Since then, scholars such as Lin et al. [33], Yu and Ng [43], Dai et al. [44], and Vizzari et al. [45] have applied this approach to investigate the spatial patterns of urban landscapes along the urban–rural gradient. Considering that rail transit networks represent an important connection corridor between cities, this study conducts a comprehensive analysis of the inter-city gradient using landscape metrics and radar charts, which reflect the direction of urban expansion. The aim of this study is to identify the spatial variation characteristics of regional integration and the interactions between urban land expansion and the ecological environment. Specifically, three key questions are addressed: (a) What are the spatiotemporal heterogeneity characteristics of urban expansion in an urban agglomeration (using the Changsha–Zhuzhou–Xiantan metropolitan region as a case study)? (b) What are the differences in urban expansion heterogeneity and integration between the regional scale and the scale of a prefectural-level city? (c) What is the dynamic pattern of urban integration in a metropolitan region and the impacts on the ecological environment? The contribution of this study is to provide a new perspective of the integration process of urban agglomeration. Furthermore, this analysis will provide insights for urban planning and land use policy towards more sustainable urban development.

2. Study Area and Data

2.1. Study Area

The case study was conducted in the north-central part of Hunan Province (Figure 1), which is representative of the developing provinces in central China. The Greater Changsha metropolitan region, also called the Changsha–Zhuzhou-Xiangtan (CZT) city cluster, consists of three prefecture-level cities: Changsha, Xiangtan, and Zhuzhou. The CZT is a core area for economic growth in the middle reaches of the Yangtze River and an important hub of Chinese transportation, with a total area of 28,087 km 2 and a population of 14.78 million [24]. Along with rapid economic growth, this area has become a heavily urbanized region of Hunan and the focal point of intelligent manufacturing, machinery, and cultural industry in central China. By the end of 2017, the urbanization rate of CZT exceeded 70% and the gross domestic product (GDP) had increased to 1517.17 billion yuan, accounting for 1.83% of the GDP of the entire country [46].
Historically, Changsha, Zhuzhou, and Xiangtan have long been closely connected, with frequent exchanges of residents and materials. In 1997, Hunan established a provincial-level coordinating agency for the economic integration of CZT and proposed an integration plan for the CZT city cluster. Under this plan, the governments of all three cities strengthened their cooperation from the perspective of transportation infrastructure, economic exchange, and cooperation, resulting in drastic land use/land cover (LULC) changes over the last few decades. Hence, the period from 1997 is characterized by rapid development of CZT integration. In addition, as one of China’s 13 megalopolises and the national comprehensive experimental area for resource-saving and environmental-friendly society construction, the efficient, organized, and high-quality development and integration of CZT is essential for promoting the development of other metropolitan areas in China.
According to previous studies, city extension typically occurs along important transportation routes; urban agglomeration integration is no exception [47]. Thus, this study employed an urban integration transect along the main routes of the CZT inter-city rail network, which has a total length of 104.36 km and 24 stations. This line, which was opened in 2016, connects the three urban cores of CZT and overlaps with the routes of the original highways (Furong Avenue, Zhuyi Highway Interchange, Hurui Expressway, and Shidai Avenue). It describes a typical urban sprawl gradient, which can facilitate connections between the three cities and promote regional integration.

2.2. Data Pre-Processing

In order to establish land use datasets, we acquired high quality Landsat TM/ETM+ images of the CZT metropolitan region at a spatial resolution of 30 m for 1995, 2005, and 2015. All images were cloud-free (cloud < 10%). The image preprocessing steps included geometric correction, georeference correction, band composition, image mosaicking, and clipping. Land use types were divided into six categories using the object-based classification in software ENVI 5.3; i.e., cultivated land, forest land, grassland, water bodies, urban land, and bare land based on the latest released Chinese land use standard [48]. Visual interpretation was employed to improve the accuracy of classification and more than 250 stratified random samples were used to check the accuracy. The overall classification accuracy of the three images was 96.5%, 97.54%, and 93.6%, respectively, which meets the accuracy requirements for land cover change evaluation.
Moreover, we extracted CZT inter-city rail data, including the Changsha–Zhuzhou (CZ) line and Changsha–Xiangtan (CX) line, from Open Street Map (OSM), and made a buffer with a radius of 4 km for each rail line in order to generate the inter-city corridors in the CZT region. Furthermore, perpendicular lines were constructed along the rails every 6 km. A total of 11 perpendicular lines for the CZ line and 10 perpendicular lines for the CX line intersected with the buffer. Finally, the buffers of the CZ and CX line were divided into 12 quadrats and 11 quadrats, respectively (Figure 1).

3. Methodology

3.1. Framework

As illustrated in Figure 2, the inter-city rail transit corridors in CZT were extracted from the land use data and 4-km buffer zones of the inter-city railways after the data preprocessing described in Section 2.2. Using the inter-city rail transit corridors, the key research issues were implemented on three levels based on the obtained land use data. Firstly, we characterized the spatial integration of the urban agglomeration at the regional level. For this, the regional urban expansion indicators and landscape changes were calculated to reflect the quantitative changes in overall land use patterns from 1995 to 2015. Secondly, the prefectural-level spatial orientation characteristics were analyzed using radar graphs to reveal the main integration direction of the three cities during urban expansion. Thirdly, we analyzed the landscape structure of urban-green core-urban gradient transects to identify the functional zones and typical patterns. The aim of this was to determine the spatial heterogeneity and similarity aggregation due to inter-city actions through landscape variation analysis and cluster analysis. All spatial data processing and analysis steps were performed using software ArcGIS 10.2 and FRAGSTATS 4.2.

3.2. Qualitative Analysis of Urban Expansion

Urban expansion indicators were adopted to measure the characteristics (e.g., speed, extent, intensity, and direction) of changes in urban form and structure [49]. In this study, we selected two indicators: the annual urban expansion rate (AER) and the urban expansion intensity (UEI) to quantify the spatiotemporal dynamics of urban expansion. The AER can be used to depict the magnitude and speed of urban expansion within a specified period. The UEI can indicate changes in the amount of urban land per unit time through a comparison with the total study area. The formulas are as follows [20,35]:
A E R = 100 U E I = 100
where A E R (%) and U E I (%) are the annual urban expansion rate and urban expansion intensity, respectively, U i and U i + d represent the urban area at the year i and i + d , respectively, d is the time span, and T U i is the total land area of the study region in year i.

3.3. Landscape Metrics

For the objectives of this study, the vector data of the inter-city landscape transect were then converted to raster form at a pixel size of 30 m using ArcGIS 10.2. software. The resulting landscape changes together with the urban expansion in CZT were characterized by spatial metrics based on spatial and complexity criteria. These metrics can reflect the composition, shape of patches, and aggregation of the landscape. As the urban built-up area is the main research class, five class-level prominent metrics were carefully chosen to quantify the pattern of urban processes in Section 4.2 [50]. These metrics include the percentage of landscape (PLAND), largest patch index (LPI), landscape shape index (LSI), patch density (PD), and aggregation index (AI) (Table 1). We used the public software FRAGSTATS (Version 4.2) to calculate selected class-level landscape metrics with the eight-neighbor rule.
The urban–rural fringe has the following characteristics: urban land in this area is fragmented and presented as many small scattered patches. Therefore, we proposed the metric NP/LPI (number of patches/largest patch index) to reflect the degree of human disturbance to the landscape. NP/LPI quantifies the fragmentation and dominance of urban land based on the number of patches and area of patches. A larger NP/LPI indicates a higher degree of fragmentation and patch diversity as well as a lower degree of patch connectivity, which can be used to detect the urban–rural fringe.
Compared to urban areas, the patches of urban land in urban–rural fringe regions increase sharply whereas the dominance of the largest patch of urban land continues to decrease, which can be represented by an increase of the NP/LPI. Hence, this variation along the inter-city rail transit can be used to reveal the boundary between inner city and suburban areas, as well as its movement and the changes in pattern features over time.

3.4. Radar Graph Analysis

The radar graph expresses the specific orientations of urban expansion at the prefectural level. Considering economic determinants as one of the most important drivers on urban expansion [51], the economic center of a city is regarded as the city center. In this research, we defined Changsha Wuyi square, Zhuzhou center square and Xiangtan railway station as the city center of Changsha, Zhuzhou and Xiangtan, respectively. To describe the direction of urban expansion, 16 direction rays were drawn from each city center with a northward orientation and an interval of 22 . 5 . Radar analysis could be implemented by measuring the distance from each city center to the edge of the main urban land patch in each direction. The directions between cities were selected to explore the spatial integration direction in the region. Considering the locations of the cities in the CZT region (Figure 1), the directions from the south to southwest in Changsha and from the northeast to east in Xiangtan represent the integration directions of Changsha–Xiangtan (CX); from the southeast to south in Changsha and from the west to northwest in Zhuzhou represent the integration directions of Changsha–Zhuzhou (CZ); and from the east to southeast in Xiangtan and from the southwest to west in Zhuzhou represent the integration directions of Xiangtan-Zhuzhou (XZ).

3.5. Hierarchical Cluster Analysis

Hierarchical cluster analysis was used with SPSS 19 software to classify the quadrats along the inter-city rail transects and build a hierarchy of clusters. The results of hierarchical clustering are typically presented in a dendrogram. In addition to the NP/LPI index, the indices involving NP/LPI, the area percentages, connectivity and fragmentation of urban land, forest land and cultivated were selected as clustering variables to characterize the functional areas along the gradients more comprehensively. Before applying the hierarchy cluster analysis, the index values of each quadrat were normalized so that the scale of each index is the same. Then, the agglomerative hierarchical clustering with ward method was adopted to measure the similarity between the quadrats.

4. Results

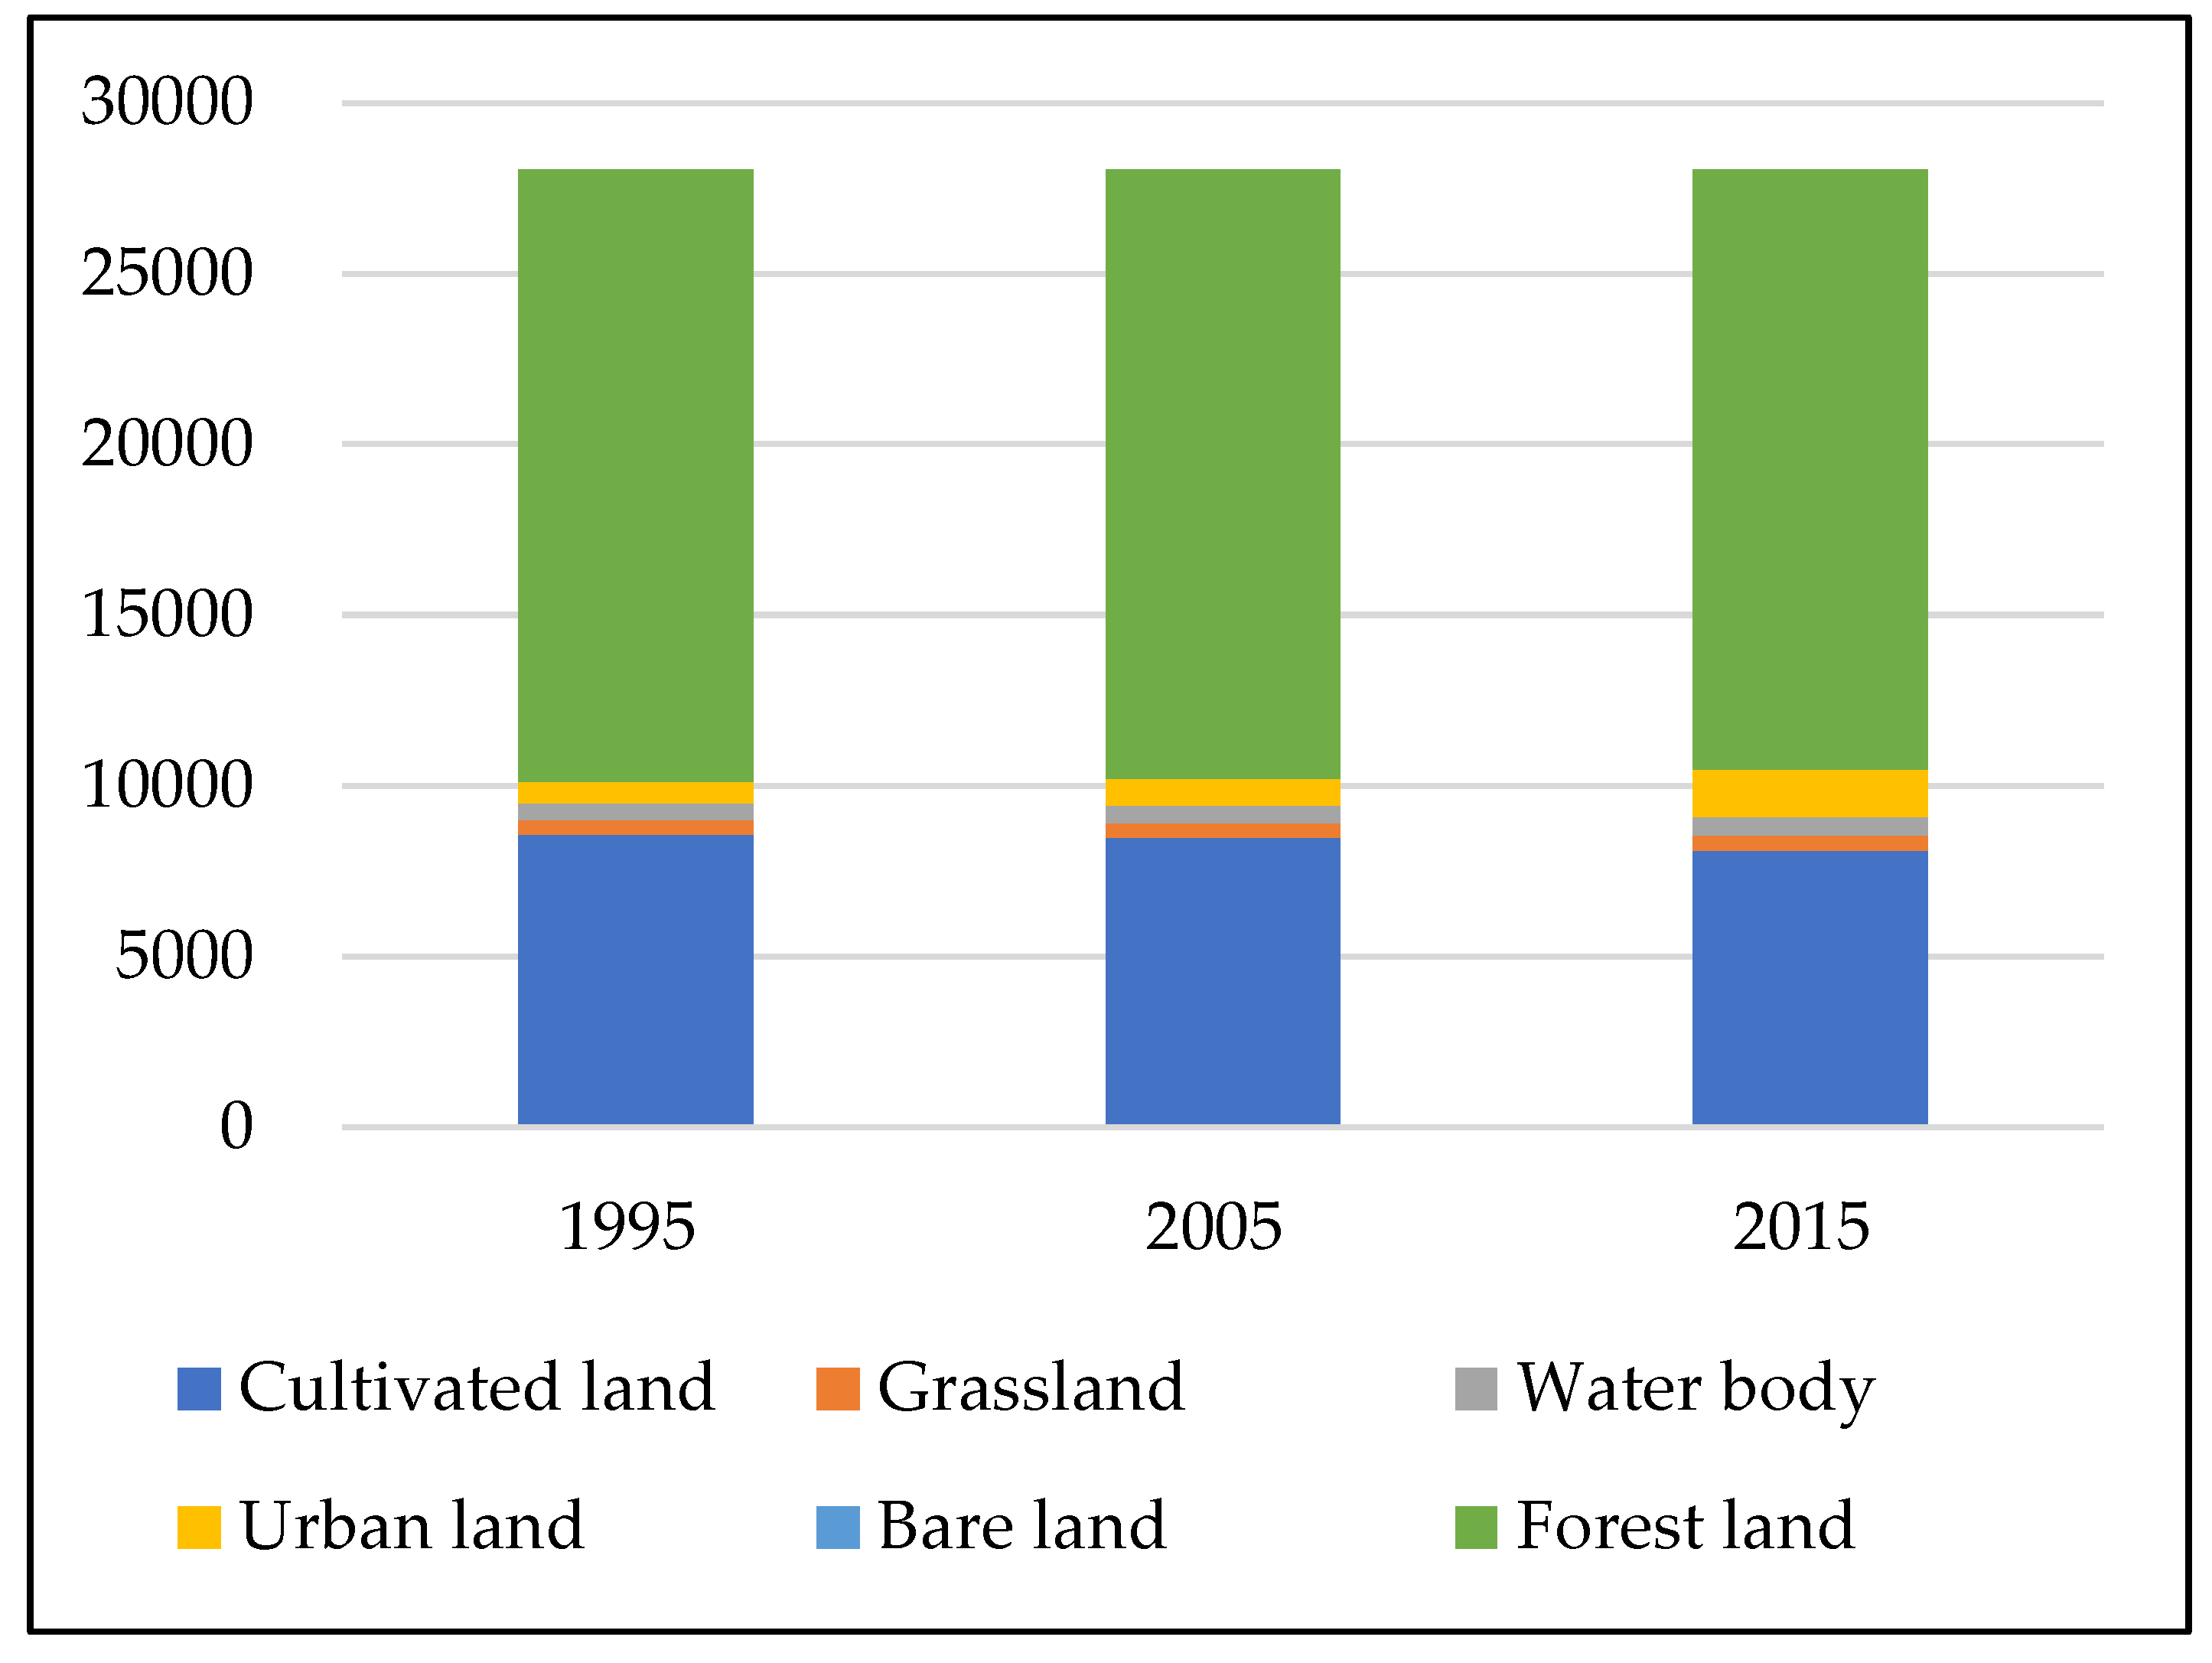
4.1. Dynamic Changes of Urban Expansion at the Regional Level from 1995–2015

The CZT metropolitan region has witnessed rapid urban expansion and changes of land use structure from 1995–2015 (Figure 3 and Table 2). According to the regional spatial distribution shown in Figure 3 and Figure 4, forest land and cultivated land have always been the main land use types in this region, covering more than 90% of the entire CZT metropolitan region. A large area of forest land and cultivated land was converted to urban land cover, thereby steadily declining by 2.07% and 5.23%, respectively; this represented the greatest contribution to urban expansion. Urban land cover increased rapidly from 629.19 to 1389.87 km 2 over the past two decades, representing an increase of 120.898%. The average growth was 38.0341 km 2 per year and the annual growth rate and intensity were 6.0450% and 0.1357%, respectively. Moreover, the expansion of urban land (AER and UEI) was substantially faster during the period of 2005–2015 (7.5906% and 0.2139%) than 1995–2005 (2.5578% and 0.0574%) due to the influence of both policy and socioeconomic factors. The significant growth of urban land in CZT indicates that urban land will still exhibit rapid expansion in the near future.
From the perspective of landscape structure, five landscape metrics were selected to elucidate the overall dynamic pattern of urban agglomeration from 1995 to 2015. Figure 5 demonstrates the features and trends of urban landscape changes in the CZT metropolitan region. The left vertical axis in each combo bar chart represented the results of LSI, AI and PLAND and the right vertical axis indicates the values of LPI and PD. From the perspective of the class level in the entire study region, the patterns of forest land, grass land, and water bodies revealed minimal changes during the 20-year study period. The PD, PLAND, and AI of cultivated land and urban land remained relatively stable, the LSI of cultivated land and urban land increased, the LPI of cultivated land decreased significantly, and the LPI of urban land increased markedly.
These results indicate that, due to a constant increase in human activities, the number of patches for all land use types continued to increase within the study period. Moreover, urban land expansion caused an increase in landscape fragments and irregularity over the past 20 years. Landscape connectivity and agglomeration of cultivated land decreased while that of urban land increased. In addition, urban land exhibited higher patch compactness and a more complex shape than cultivated land.

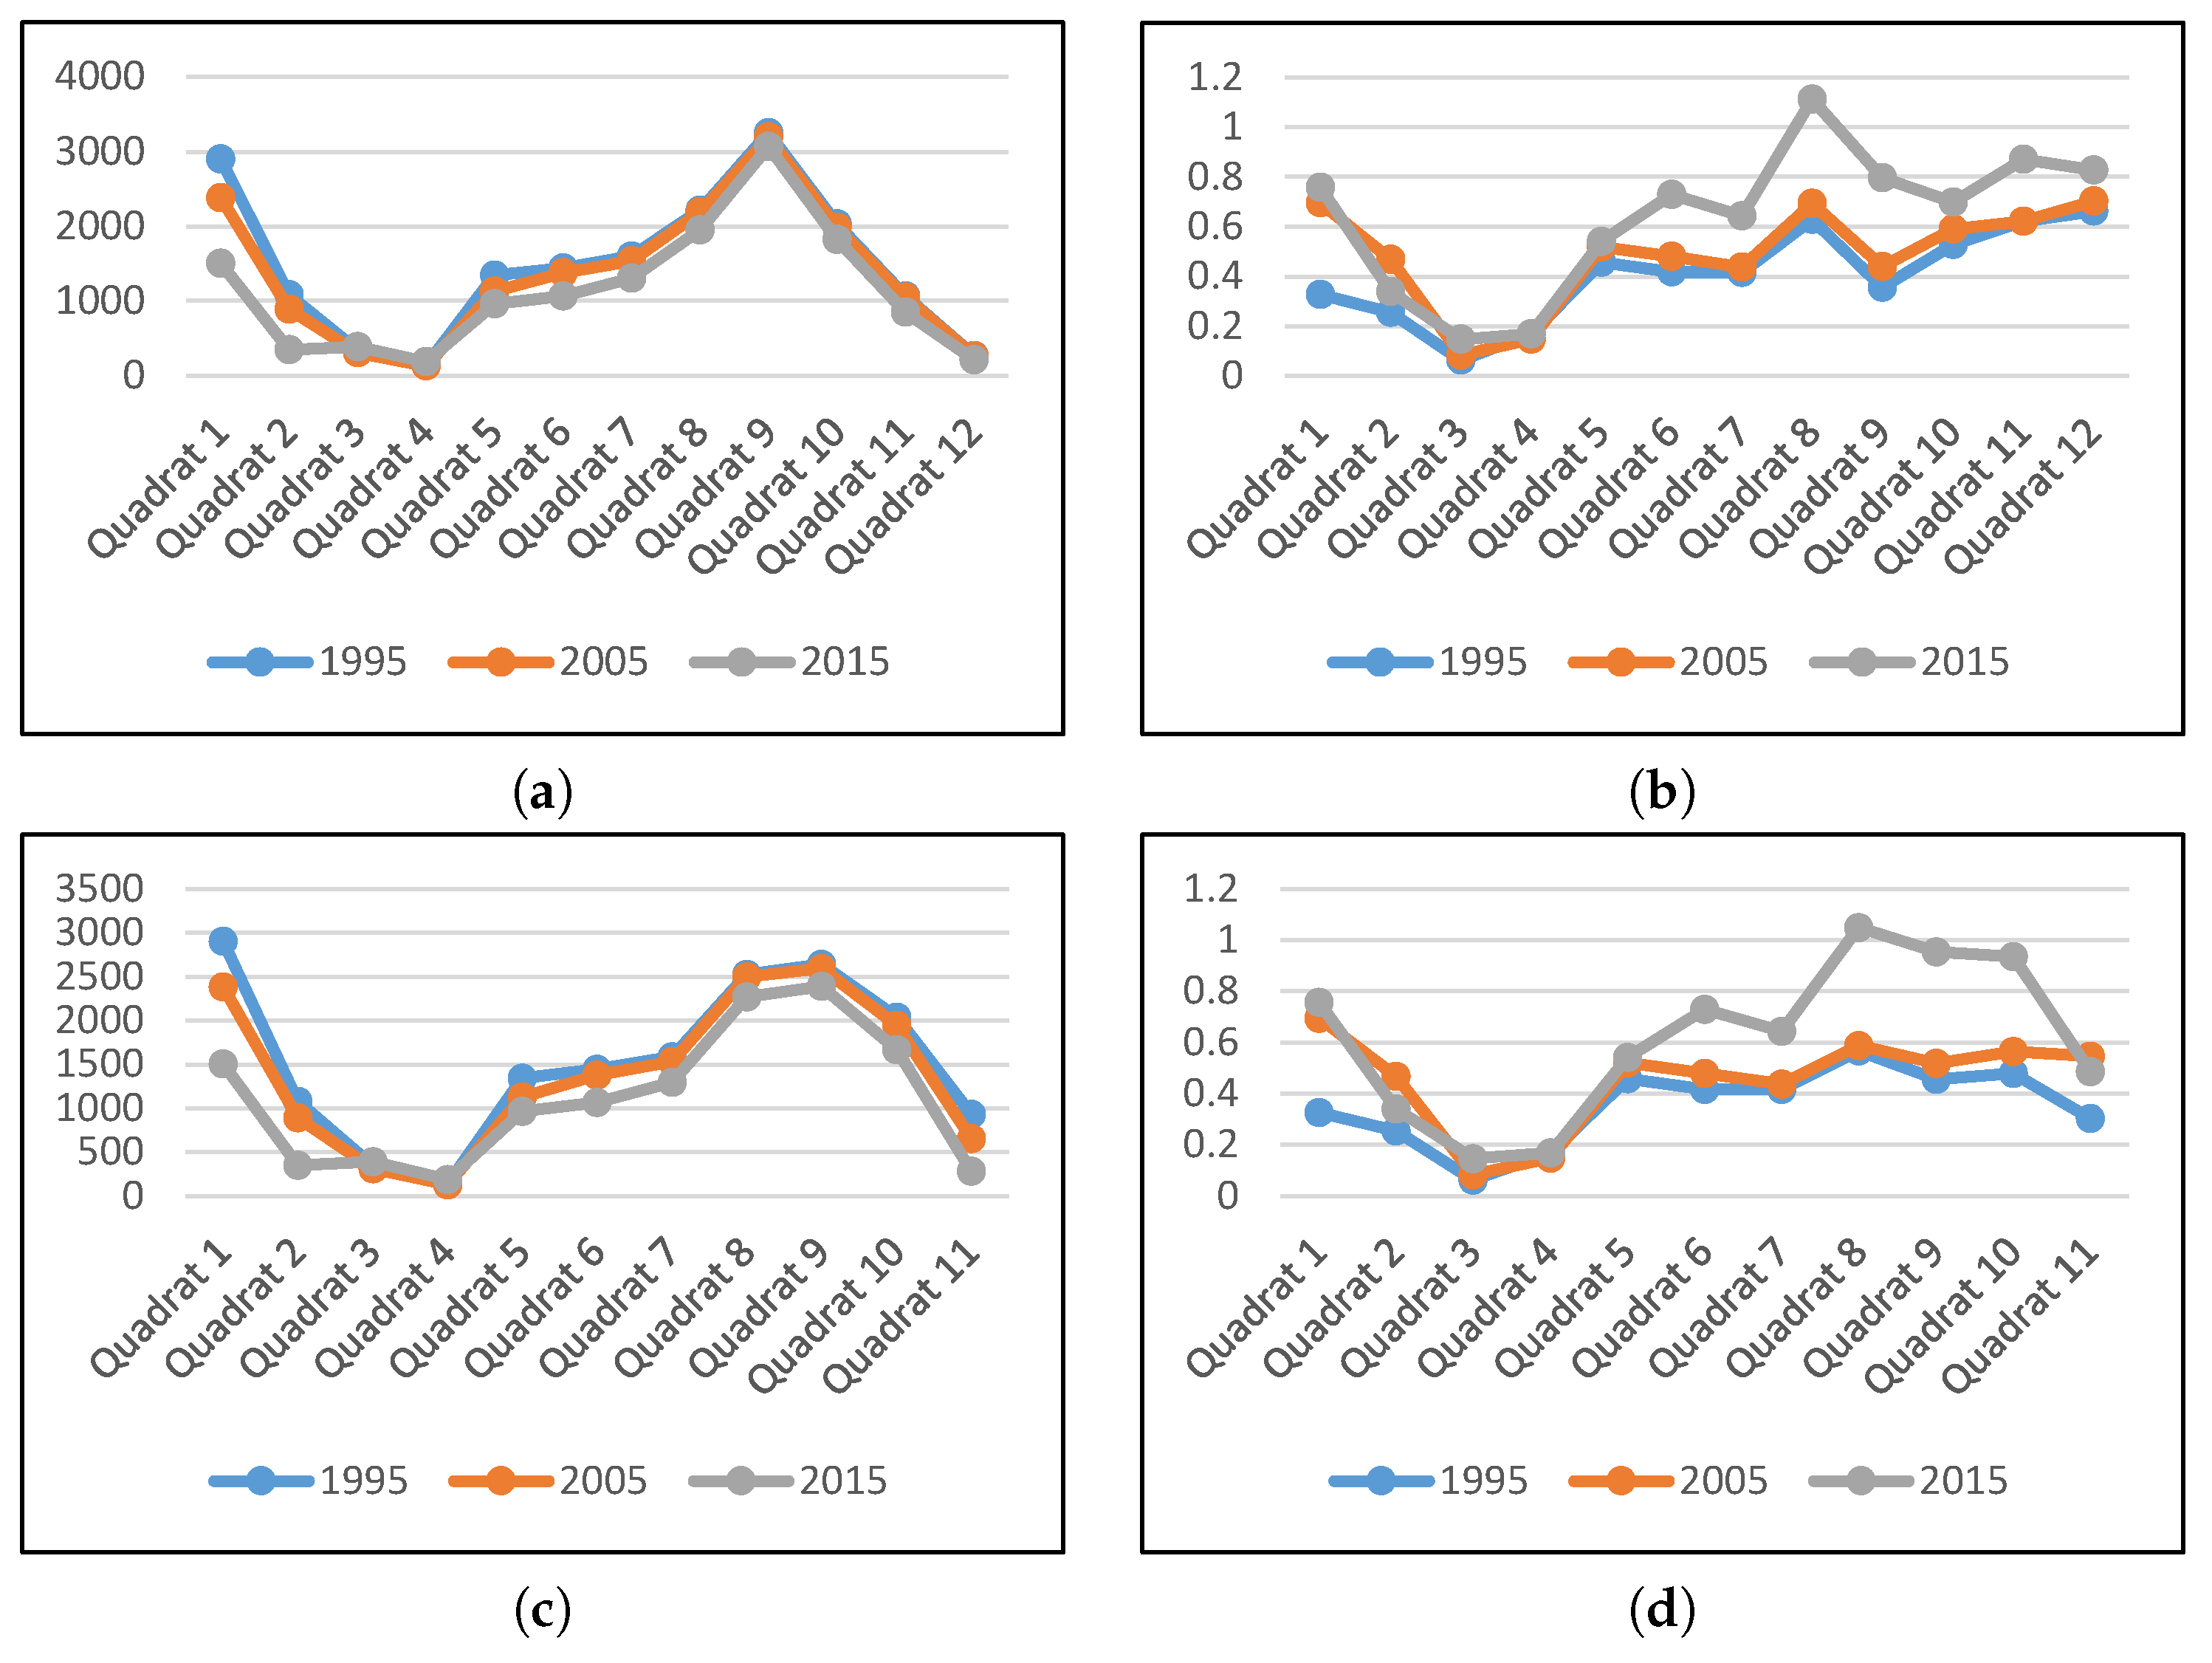
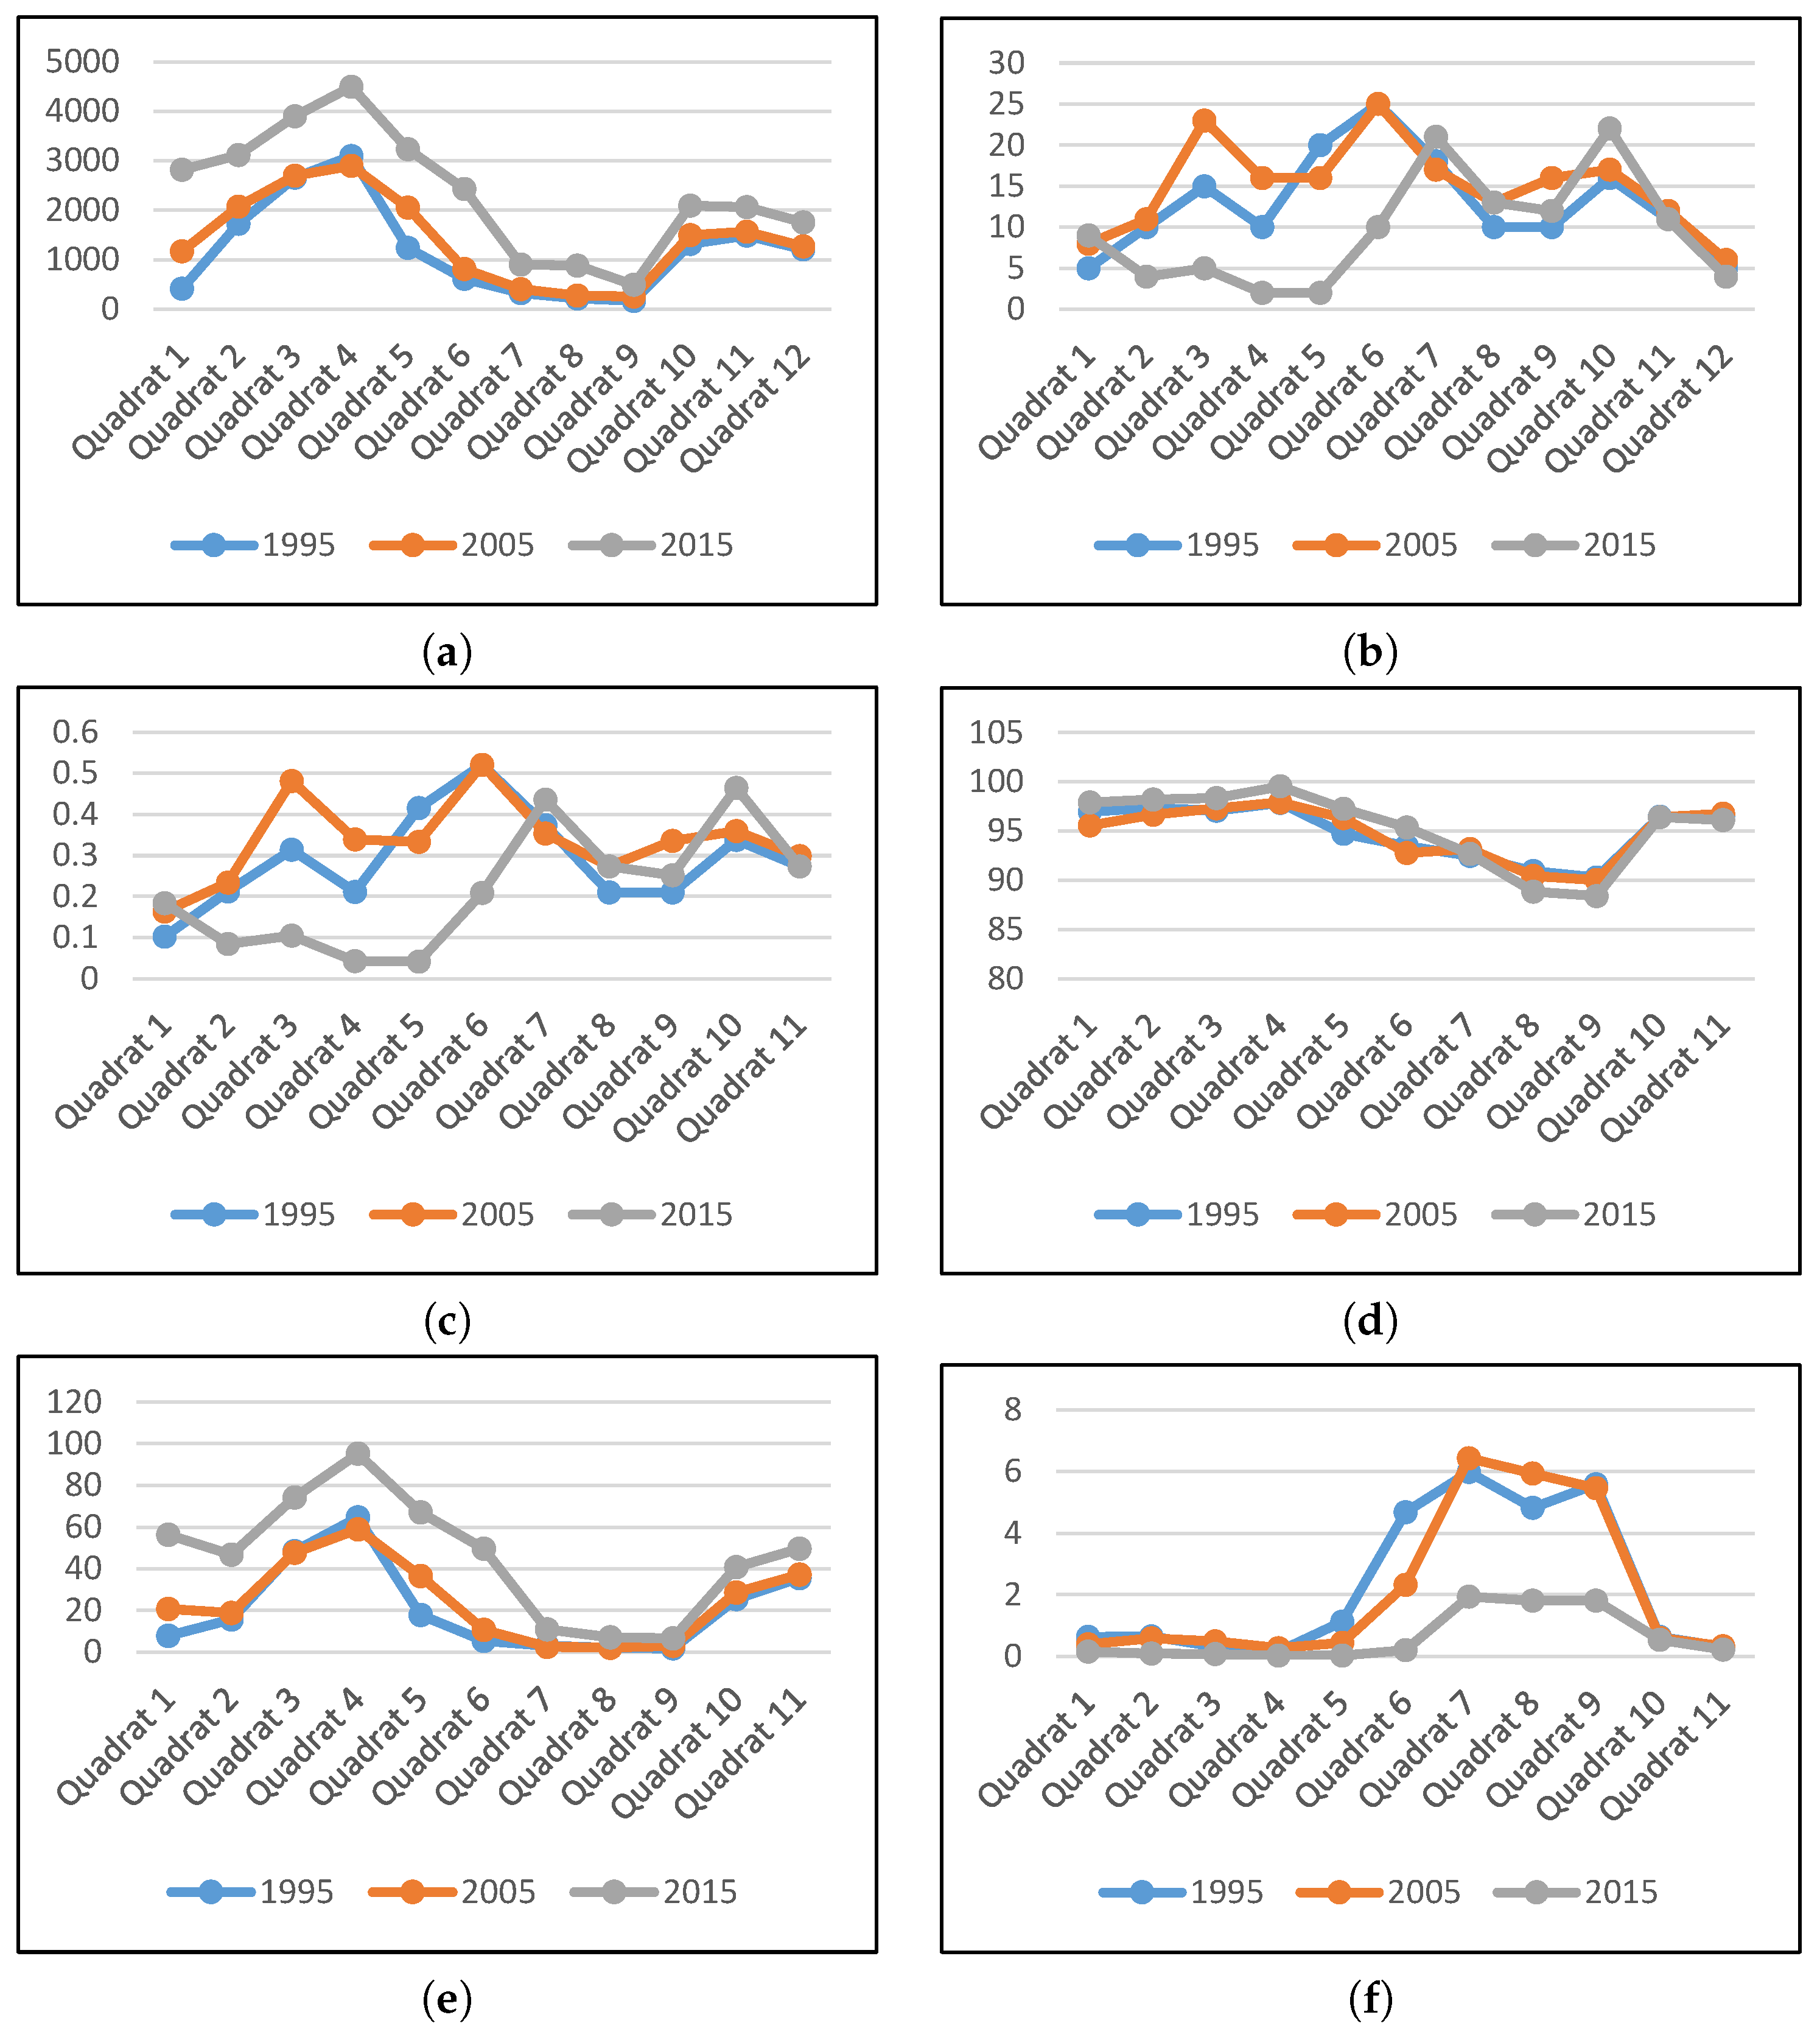
4.2. Spatial Heterogeneity Characteristics at the Prefectural Level

At the metropolitan level, urban land was predominantly distributed in Changsha (56.4% in 2015) (Figure 6) as a result of the higher level of economic development in this region. Additionally, Changsha experienced land expansion in almost every direction. During the period 1995–2005, Changsha mainly extended towards the northeast (NE), northwest (NW), and south, with construction of an edge city and relocation of the Changsha Municipal Government to the west. Due to construction of industrial zones and the gradual improvement of traffic conditions between Zhuzhou, Xiangtan, and Changsha, Xiangtan predominantly spread to the east and NE, whereas Zhuzhou traffic extended to the southwest (SW). During the period 2005–2015, the speed of urban expansion accelerated, urban land cover increased by 75.9%, and the annual increase was 59.957 km 2 . Under the constant influence of government relocation, establishment of industrial zones, use of the high-speed rail station, and the integration of Changsha, Zhuzhou, and Xiangtan, Changsha expanded substantially to the east, south, and northwest (NW), Xiangtan continued to spread to the north and southeast (SE), and Zhuzhou continued to extend to the SW.
Considering the relative position of the cities (Figure 1), the expansions of Changsha from the SW to southeast (SE), Xiangtan from the NE to SE and Zhuzhou from the SW to NW were selected to analyze the spatial integration between the cities in the CZT region. In the CZ directions, Changsha continued to expand to Zhuzhou, while Zhuzhou had few expansions to Changsha during the period 1995–2015. In the CX direction, Changsha and Xiangtan experienced very low integration rate during the period 1995–2005 and a great progress in expanding into each other existed during the period 2005–2015. During the period 1995–2015, Xiangtan and Zhuzhou continued to extend to each other in the XZ direction.

4.3. Landscape Variations along Urban-Green Core-Urban Gradient Transects

To further reflect changes in land use patterns and landscape functional zones, we used two inter-city rail corridors as the two urban-green core-urban gradients; i.e., Changsha–Zhuzhou (CZ) line and Changsha–Xiangtan (CX) line. To explore the gradient changes along the corridors, the fixed distance segmentations were employed to generate various quadrats, which could minimize the biases caused by uneven splitting. Meanwhile, considering the impact of the stations on the urban expansion, the segmentation distance should be close to the average distance between the 24 stations. The average distance ( D a v e ) was evaluated as follows:
D a v e = ( L C Z + L C X ) / ( N s t a i o n s - 1 )
where L C Z and L C X are the lengths of the CZ line (68.3524 km) and the CX line (66.3524 km), respectively; N s t a t i o n s is the total number of the stations. Therefore, 6 km distance close to the evaluated average distance (5.8421 km) was used to generate the quadrats along the rail corridors taking account into the analysis implementability.
The influence of the CX and CZ line should be measured to generate the inter-city corridors. First, the increase rate of the urban land patch number (UNPR) was explored to measure the urban land change and the fragment of the urban land. UNPR was defined as follows:
U N P R = 100
where N P U i and N P U i + d are the NP of urban land at the year i and i + d , respectively; d is the time span. Then, we built eight buffer zones from 1 to 8 km at the regular interval of 1 km, and calculated the UNPR of two periods (1995–2005 and 2005–2015). As shown in Figure 7, the UNPR reached the peak value at the distance of 4 km during the period 2005–2015, and the fluctuation of the UNPR index is significantly reduced after 4 km. Hence, the influence of the CZT line should be within 4 km.
Based on the above results, the urban-green core-urban gradient transect with 4 km wide (a 4-km buffer zone in both two sides of the inter-city rail) was generated and divided into various quadrats by 6 km distance along the CZT line. The landscape metrics were calculated for each quadrat at the class level and landscape level to detect the spatial heterogeneity characteristics of regional integration for three different years (1995, 2005, and 2015). In Figure 1, quadrat 1 and 2 cover the northern part to the city center in Changsha, quadrat 3 represents the city center of Changsha, quadrat 12 is the Chang–Zhuzhou line in the city center of Zhuzhou, and quadrat 11 is the Changsha–Xiangtan line in the city center of Xiangtan. The other quadrats represent the buffers from the city center of Changsha to the city center of Zhuzhou and Xiangtan along the inter-city rail transit network.
Along the transect from urban area to urban-green core to another urban area, changes in landscape dominance, shape complexity, connectivity, and diversity were observed. Figure 8 shows the variation in landscape characteristics of cultivated land along Changsha–Xiangtan line and Changsha–Zhuzhou line. The curves of the total area (TA) and PD along the two gradients exhibited considerable variations over time and began to diverge from quadrat 7 for the CZ line and CX line (Figure 9a,c). TA values decreased overall with time, especially from quadrat 1 to 5 during the period 2005–2015. Moreover, the peak value of the TA index moved south from quadrat 6 to quadrat 7. Values of the PD index increased overall and exhibited a large difference over time, especially during the period 2005–2015 (Figure 9b,d). The results presented in Figure 9 indicate that the cultivated land was extensively occupied and the degree of fragmentation increased during the past 20 years, especially in suburban and green core areas from 2005–2015.
Unlike cultivated land, forest land along the two lines exhibited minimal decreases over time. The minimum values appeared in quadrat 4 of the CZ line and quadrat 3 of the CX line, whereas the maximum values appeared in quadrat 9 for both lines (Figure 10a,c). Landscape fragmentation increased markedly over time, especially from 2005–2015, reaching a relatively high level in quadrat 8 along the CZ line and CX line (Figure 10b,d). These results suggest that forest land in the CZT metropolitan region was predominantly concentrated in the southern part of the green core, with a minimal distribution in urban areas. Moreover, the area of forest land remained stable while the degree of fragmentation increased slightly along the two gradients during the past 20 years, especially in regions between quadrat 6 and the suburban area of Xiangtan and Zhuzhou.
Urban land along these two transects exhibited the opposite pattern to cultivated land and forest land. Due to mature urban development in the urban area, the innermost buffer of the urban area possessed the lowest diversity, with the highest values of TA and LPI in quadrat 4 and the lowest values in quadrat 8 and quadrat 9 of the CZ line and CX line, respectively. Quadrat values near quadrats with relatively high values of TA exhibited a more rapid increase, and resulting in a spatial disparity that continued to expand over time. The LPI index quantifies the percentage of the total landscape area comprised by the largest patch and measures the dominance. Hence, the results indicate that the urban area continued to aggregate in the largest patch and that remarkable land use changes occurred in the urban fringe of these three cities during urban expansion and development.
As indicators of fragmentation, the curves of the NP and PD revealed similar trends; the curves for 2015 differed significantly from the curves of the previous two time periods. Relatively high values in 1995 and 2005 appeared in quadrat 3 and 6, then moved southward to quadrat 7 and 10 in 2015 along the CZ line, whereas relatively high values in 1995 and 2005 appeared in quadrat 3, 6, and 11, which moved to quadrat 7 and 10 in 2015 along the CX line. The NP and PD curves decreased remarkably from quadrat 1 to quadrat 5 in 2015 along both lines. These trends reveal that urban land in urban and fringe areas of Changsha and Zhuzhou had high connectivity whereas urban land in Xiangtan and the southern part of the green core exhibited a relatively high degree of fragmentation and were not spatially concentrated.
AI is measure of similar adjacencies between the same patch type. AI remained relatively stable over the study period. The curves presented slight decreases in quadrats 4–9 along the CZ line and quadrats 4–8 along the CX line whereas other parts of the curves remained at a stable and relatively high value, indicating that the degree of aggregation of urban land in these three cities was relatively stable but declined along the inter-city rail transit in the green core region.
The NP/LPI index can be applied as a measure of spatial connectivity. As shown in Figure 10f and Figure 11f, the NP/LPI index between quadrat 1 and 5 along the CZ and CX lines exhibited relatively low and stable values; however, substantial changes and differences in time were observed between quadrat 5 and 10 along the CZ line and quadrat 5 and 11 along the CX line. The NP/LPI index for each quadrat gradually decreased from 1995–2015. The peak value predominantly occurred within the quadrat 7/9 interval of the CZ line and in quadrat 10 on the CX line. NP/LPI increases due to ruptures of functional diversity relationships, landscape fragmentation, and a lack of patch dominance, which are suggested characteristics of the urban fringe. The variation in NP/LPI illustrates the high connectivity of urban landscape patches in urban centers. Moreover, the urban area patches progressively extended along the inter-city rail transit network, especially in 2015, which narrowed the distance between patches over time. Remarkable changes occurred at the urban fringes of these three cities, and the boundary between the inner city and suburban areas of Changsha moved southward throughout the urbanization process.

4.4. Urban Functional Zones along Urban-Green Core-Urban Gradient Transects

The dendrogram produced by the cluster analysis shows similar aggregation of the quadrats (Figure 12). Based on the relative dominance and difference in the patch area, connectivity, and fragmentation of urban land, cultivated land, and forest land, the quadrats can be divided into four categories that represent four landscape functional zones: city center, urban area, urban–rural fringe, and green core. As shown in Table 3, Quadrats 3, 4, and 2, which was newly converted to an urban core area in 2015, are the core areas of the city. Quadrat 12 on the CZ line gradually became the urban area of Zhuzhou from 2005. Because a much greater proportion of land is primarily used for human habitation and activities, the extent of which can be relatively concentrated, urban areas have are characterized by a large area, a single land use type, and continuity. According to Figure 10 and Figure 11, the connectivity of urban land in Zhuzhou and Xiangtan is substantially lower than that of urban land in Changsha. Among all the urban areas, quadrats 1, 5, 10, and 11 on the CZ line revealed lower compactness of the urban land, and spillover of urban land caused an increase of the urban fringe area in quadrat 6 in 2015. Quadrats 6, 7, 8, and 9 were always dominated by cultivated land and forest land because of the resource-saving and environmentally friendly construction in this region; only quadrat 6 was transformed into urban–rural fringe in 2015. In the CX line, no quadrats became urban core area except quadrat 2 due to the low conectivity and high fragment of the urban land in Xiangtan. These results characterize the changing status and dynamic landscape patterns of different functional zones along the urban-green core-urban gradient transect, which indicate that urban areas are expanding and the central city of this metropolitan region has a stronger land demand, a well-protected ecological infrastructure, and urban functional zones that partially conform to the central place theory.

5. Discussion

In this study, we presented a methodological framework for the accurate detection of landscape changes and urban integration in the Changsha–Zhuzhou-Xiangtan metropolitan region over a 20-year period. By using statistical indices and five landscape metrics, the overall land use change and urban expansion pattern could be measure at regional. Based on the results, we were able to identify an exponential increase in the urban area and it caused an increase in landscape fragments. From the prefectural level, spatio-temporal characteristics of the inter-city were detected by applying radar graph and gradient analysis. Changes in LULC mainly occurred from 2005 to 2015, especially in the northeast and northwest of Changsha and along the transit line between the three cities. Similarly, Zheng [52] verified that rapid growth is the main feature of the CZT metropolitan region. The CZT metropolitan region is in the urban spatial agglomeration stage of continuous development and exhibits a single-core spatial structure. The spatial expansion of the central city was less restricted by the overall development of urban agglomeration and gradually formed two secondary centers in the west and east, whereas spatial expansion of the other two cities was strongly influenced by the center city; therefore, they continued to expand towards the central city. The expansion of these two cities was more concentrated and the range of land use expansion was limited. A large area of urban–rural fringe exists in both cities, and ecological and urban land are relatively fragmented in this region. Compared with Zhuzhou, Xiangtan expanded over a smaller range and the integration process between Xiangtan and the central city was more rapid. In addtion, the integration between Changsha and Zhuzhou was lowest than others. The results at the regional and prefectural level have answered the first research question proposed in Section 1. Meanwhile, the findings based on the radar graph analysis indicated that the spatial integration between Changsha and Zhuzhou needs to be further strengthened in order to make full use of the resources and manpower advantages of the urban agglomeration region. From the results of two different scales, it could be found that the spatial heterogeneity at the regional level mainly paid attention to the overall features and patterns, while the heterogeneity at the prefectural level characterized the interaction between cities, urban expansion direction, and urban expansion pattern of each city. They revealed the differences in urban integration between macro and micro perspective, which was the answer to the second research question.
Further, to answer the third research question of the introduction, landscape metrics and gradient analysis were employed to identify the integration patterns and the impacts on eco-environment. The rapid integration of urban agglomerations has a significant impact on green space structures; cultivated landscapes cover regions within reach of the urban–rural fringes of cities and forest land is gradually distributed far from urban land. In the green core of the CZT metropolitan region, more cultivated land is distributed in the vicinity of Changsha and forest land is typically found to the south of the green core, near the urban–rural fringe of Xiangtan and Zhuzhou. During the study period, the integration of cities resulted in continued compression and fragmentation of ecological space. In order to protect the existing natural ecological environment, policy-makers should focus on effectively controlling the infinite expansion of urban land and the more efficient use of existing urban land, especially the urban–rural fringe.
Urbanization has resulted in a more compact urban land structure, extension of the urban fringe, and compression and fragmentation of green space in the study area. These changes predominantly occurred in the direction of spatial integration and in the fringe areas of the central city during urban agglomeration. Each landscape functional zone exhibited distinctive spatial characteristics of landscape composition. The urban area had the lowest patch number due to the single land use type and substantial extension of patches in this region. The urban–rural fringe revealed an increasing number of patches and a higher level of fragmentation, as well as more abundant and complex urban functions compared to other zones. The urban–rural fringe may become a new urban area in the near future as the population continues to immigrate and industries gradually move outward. Compared with the green core (forest land), the green core (cultivated land) was distributed closer to the urban–rural fringe. The four landscape function zones and their spatial changes revealed the typical integration pattern of urban agglomeration in China, and perhaps even around the world. The integration process of the CZT metropolitan region conforms to the diffusion–coalescence theory of urban evolution [53]. The diversity of the land and human disturbance to the landscape has resulted in more distinct landscape functional zones over time. Although the delimitation of landscape types is complicated and unstable because of the dynamism of nature–society interactions, the landscape functional zones are similar to those found by previous studies [24,54]. This study provides an effective way to quantify and understand the heterogeneity characteristics of urban integration along the inter-city gradient, and link these features to ecological changes and division of urban functional zones, which can offer data support to urban integration process control and ecological protection.

6. Conclusions

An urban agglomeration is the ultimate spatial form for urban development. China is currently developing a hierarchical urban agglomeration system to enhance its capacity for strong economic development. Studies have shown that urban expansion with land use/land cover (LULC) changes is a global issue with extensive impacts on the ecosystem, human wellbeing, and landscape sustainability [6,47,55]. Although the spatial structure of land use and the impacts of connection corridors on urban sprawl have long been studied for individual cities, little is known about the spatial and temporal integration characteristics of urban agglomerations, particularly the effects of inter-city connection corridors. This paper explored a method to quantitatively measure the spatial interaction in urban agglomeration based on inter-city communication lines, which could provide a reference for the studies on the evolution patterns of urban agglomeration.
In this study, based on the complex land use composition and the importance of inter-city rail transit to urban structure, we combined landscape ecology with urban structure theories and investigated the integration process and spatial patterns of an urban agglomeration at three scales (regional, prefectural, and inter-city level) along the inter-city gradient. Four landscape functional zones (urban center, urban area, urban–rural fringe, and green core) were identified based on the similarities between landscape characteristics. This study combined landscape metrics with gradient analysis to analyze spatial dynamics along the inter-city gradient. In addition, due to the landscape characteristics of high fragmentation and low urban patch connectivity in the urban–rural fringe, we proposed the NP/LPI metric in order to detect urban fringes. A subsequent characterization of landscape patterns and classification of landscape functional zones produced deeper insights into the spatial structure and landscape mechanism along specific portions of the gradient. The results showed that spatio-temporal characteristics along the inter-city gradient of Changsha–Zhuzhou-Xiangtan (CZT) can reflect the landscape diversity along the urban-green core-urban gradient transect and the dynamics of integration patterns.
The discovery and characterization of landscape types, spatial heterogeneity, and functional zones is crucial for facilitating more sustainable and effective land use planning that considers the natural environment and maintains an orderly expansion of the urban–rural fringe. The proposed radar graph analysis based on the distances from city center to main urban land edge could reveal the integration direction and interaction of cities in urban agglomeration region, which can provide scientific basis for the potential development of the region. The results showed that the landscape variation measurements and comprehensive analysis at different scales (regional, prefectural) could effectively measure the integration process and the damages on the ecological environment produced by the spatial integration. Furthermore, we explored a hierarchy cluster based method for the detection of urban rural fringes and other functional types (urban center, urban area, green core), which will be helpful for the definition of the urban growth boundary in urban planning.
The approach proposed in this study revealed the integration characteristics of urban agglomeration and the interaction between landscape ecology and urban integration along a rail transit network, which can help us more fully understand the integration process of urban agglomerations and its gradient variations. However, the evolution of urban agglomerations can be influenced by several other factors, such as regional terrain, regional economic performance, and population mobility between cities. Thus, further research should be conducted on the impacts of such factors on the spatial integration patterns of urban agglomerations. This would improve our understanding of the socio-economic drivers of landscape changes and support policy-makers and landscape planners in the decision-making process. In addition, although the impact of urban functional landscapes on urban integration was considered in this study, the functional landscape classification was relatively coarse. To further describe the connections between landscape ecology and urban agglomerations, a more detailed classification considering residential, commercial, and industrial functional landscapes should be employed by integrating population, social media, and human trajectory data.

Author Contributions

Y.W., C.D. and T.W. conceived and designed the experiments; Y.W. made substantial contributions to design, data processing and analysis; P.C. contributed to result analysis; Y.W. and R.J. wrote the original paper draft; R.K. provided suggestions to improve the study and the manuscript. All authors read and approved the manuscript.

Funding

The work was supported by National Natural Science Foundation of China (Grant No. 41701465), Natural Resources Research Project of Department of Natural and Resources of Hunan Province (Grant No. 2017-16 and No. 2019-20), Natural Science Foundation of Hunan Province (Grant No. 2016JJ6100), Open Foundation of Key Laboratory for National Geographic State Monitoring of National Administration of Surveying, Mapping and Geoinformation (Grant No. 2016NGCMZD02).

Conflicts of Interest

The authors declare no conflict of interest.

References

  1. United Nations. World Urbanization Prospects, the 2018 Revision; United Nations: New York, NY, USA, 2017. [Google Scholar]
  2. Li, S.; Liu, X.; Li, Z.; Wu, Z.; Yan, Z.; Chen, Y.; Gao, F. Spatial and Temporal Dynamics of Urban Expansion along the Guangzhou–Foshan Inter-City Rail Transit Corridor, China. Sustainability 2018, 10, 593. [Google Scholar] [CrossRef]
  3. Thapa, R.B.; Murayama, Y. Examining Spatiotemporal Urbanization Patterns in Kathmandu Valley, Nepal: Remote Sensing and Spatial Metrics Approaches. Remote Sens. 2009, 1, 534–556. [Google Scholar] [CrossRef] [Green Version]
  4. Fang, C.; Yu, D. Urban Agglomeration: An Evolving Concept of an Emerging Phenomenon. Landsc. Urban Plan. 2017, 162, 126–136. [Google Scholar] [CrossRef]
  5. Liu, Y.; Zhou, G.; Liu, D.; Yu, H.; Zhu, L.; Zhang, J. The Interaction of Population, Industry and Land in Process of Urbanization in China: A Case Study in Jilin Province. Chin. Geogr. Sci. 2018, 28, 529–542. [Google Scholar] [CrossRef] [Green Version]
  6. Deng, X.; Huang, J.; Rozelle, S.; Uchida, E. Growth, Population and Industrialization, and Urban Land Expansion of China. J. Urban Econ. 2008, 63, 96–115. [Google Scholar] [CrossRef]
  7. Marshall, J.D. Urban Land Area and Population Growth: A New Scaling Relationship for Metropolitan Expansion. Urban Stud. 2007, 44, 1889–1904. [Google Scholar] [CrossRef]
  8. Weng, Y.C. Spatiotemporal Changes of Landscape Pattern in Response to Urbanization. Landsc. Urban Plan. 2007, 81, 341–353. [Google Scholar] [CrossRef]
  9. Yeh, C.T.; Huang, S.L. Investigating Spatiotemporal Patterns of Landscape Diversity in Response to Urbanization. Landsc. Urban Plan. 2009, 93, 151–162. [Google Scholar] [CrossRef]
  10. Deng, J.S.; Wang, K.; Hong, Y.; Qi, J.G. Spatio-Temporal Dynamics and Evolution of Land Use Change and Landscape Pattern in Response to Rapid Urbanization. Landsc. Urban Plan. 2009, 92, 187–198. [Google Scholar] [CrossRef]
  11. Seto, K.C.; Fragkias, M.; Güneralp, B.; Reilly, M.K. A Meta-Analysis of Global Urban Land Expansion. PLoS ONE 2011, 6, e23777. [Google Scholar] [CrossRef]
  12. Fang, C.; Liu, H.; Li, G.; Sun, D.; Miao, Z. Estimating the Impact of Urbanization on Air Quality in China Using Spatial Regression Models. Sustainability 2015, 7, 15570–15592. [Google Scholar] [CrossRef] [Green Version]
  13. Seto, K.C.; Dhakal, S.; Bigio, A.; Blanco, H.; Delgado, G.C.; Dewar, D.; Huang, L.; Inaba, A.; Kansal, A.; Lwasa, S.; et al. Human Settlements, Infrastructure and Spatial Planning. In Climate Change 2014: Mitigation of Climate Change. IPCC Working Group III Contribution to AR5; Cambridge University Press: Cambridge, UK, 2014; Chapter 12. [Google Scholar]
  14. Burgess, E.W. The Growth of the City: An introduction to a research project. In The City; Park, R.E., Burgess, E.W., McKenzie, R.D., Eds.; University of Chicago Press: Chicago, IL, USA, 1925; pp. 47–62. [Google Scholar]
  15. Hoyt, H. The Structure and Growth of Residential Neighborhoods in American Cities; Federal Housing Administration: Washington, DC, USA, 1939. [Google Scholar]
  16. Harris, C.D.; Ullman, E.L. The Nature of Cities. Ann. Am. Acad. Polit. Soc. Sci. 1945, 242, 7–17. [Google Scholar] [CrossRef]
  17. Gottman, J. Megalopolis: On the Urbanization of the Northeastem Seaboard. Econ. Geogr. 1957, 33, 3. [Google Scholar] [CrossRef]
  18. López, E.; Bocco, G.; Mendoza, M.; Duhau, E. Predicting Land-Cover and Land-Use Change in the Urban Fringe: A Case in Morelia City, Mexico. Landsc. Urban Plan. 2001, 55, 271–285. [Google Scholar] [CrossRef]
  19. Yue, W.; Liu, Y.; Fan, P. Measuring Urban Sprawl and Its Drivers in Large Chinese Cities: The Case of Hangzhou. Land Use Policy 2013, 31, 358–370. [Google Scholar] [CrossRef]
  20. Wu, W.; Zhao, S.; Zhu, C.; Jiang, J. A Comparative Study of Urban Expansion in Beijing, Tianjin and Shijiazhuang over the Past Three Decades. Landsc. Urban Plan. 2015, 134, 93–106. [Google Scholar] [CrossRef]
  21. Masini, E.; Tomao, A.; Barbati, A.; Corona, P.; Serra, P.; Salvati, L. Urban Growth, Land-use Efficiency and Local Socioeconomic Context: A Comparative Analysis of 417 Metropolitan Regions in Europe. Environ. Manag. 2019, 63, 322–337. [Google Scholar] [CrossRef] [PubMed]
  22. Seto, K.C.; Kaufmann, R.K. Modeling the Drivers of Urban Land Use Change in the Pearl River Delta, China: Integrating Remote Sensing with Socioeconomic Data. Land Econ. 2003, 79, 106–121. [Google Scholar] [CrossRef] [Green Version]
  23. Ouyang, T.; Kuang, Y.; Hu, Z.; Sun, B. Urbanization in the Pearl River Delta Economic Zone, China. Int. J. Sustain. Dev. World Ecol. 2005, 12, 48–54. [Google Scholar] [CrossRef]
  24. Liu, D.; Chen, N. Satellite Monitoring of Urban Land Change in the Middle Yangtze River Basin Urban Agglomeration, China between 2000 and 2016. Remote Sens. 2017, 9, 1086. [Google Scholar] [CrossRef]
  25. Uszkai, A. Spatial integration and identity: Cases of border regions. J. Glob. Acad. Inst. Educ. Soc. Sci. 2015, 1, 1–13. [Google Scholar]
  26. Geertman, S.C.; Ritsema Van Eck, J.R. GIS and Models of Accessibility Potential: An Application in Planning. Int. J. Geogr. Inf. Syst. 1995, 9, 67–80. [Google Scholar] [CrossRef]
  27. He, J.; Li, C.; Yu, Y.; Liu, Y.; Huang, J. Measuring Urban Spatial Interaction in Wuhan Urban Agglomeration, Central China: A Spatially Explicit Approach. Sustain. Cities Soc. 2017, 32, 569–583. [Google Scholar] [CrossRef]
  28. Alig, R.J.; Healy, R.G. Urban and Built-Up Land Area Changes in the United States: An Empirical Investigation of Determinants. Land Econ. 1987, 63, 215–226. [Google Scholar] [CrossRef]
  29. Vessali, K.V. Land Use Impacts of Rapid Transit: A Review of the Empirical Literature. Berkeley Plan. J. 1996, 11. [Google Scholar] [CrossRef]
  30. Munneke, H.J. Dynamics of the Urban Zoning Structure: An Empirical Investigation of Zoning Change. J. Urban Econ. 2005, 58, 455–473. [Google Scholar] [CrossRef]
  31. Antrop, M.; Van Eetvelde, V. Holistic Aspects of Suburban Landscapes: Visual Image Interpretation and Landscape Metrics. Landsc. Urban Plan. 2000, 50, 43–58. [Google Scholar] [CrossRef]
  32. Zeng, H.; Wu, X.B. Utilities of Edge-Based Metrics for Studying Landscape Fragmentation. Comput. Environ. Urban Syst. 2005, 29, 159–178. [Google Scholar] [CrossRef]
  33. Lin, T.; Sun, C.; Li, X.; Zhao, Q.; Zhang, G.; Ge, R.; Ye, H.; Huang, N.; Yin, K. Spatial Pattern of Urban Functional Landscapes along an Urban–Rural Gradient: A Case Study in Xiamen City, China. Int. J. Appl. Earth Obs. Geoinf. 2016, 46, 22–30. [Google Scholar] [CrossRef]
  34. Wu, H.; Li, Z.; Clarke, K.C.; Shi, W.; Fang, L.; Lin, A.; Zhou, J. Examining the Sensitivity of Spatial Scale in Cellular Automata Markov Chain Simulation of Land Use Change. Int. J. Geogr. Inf. Sci. 2019, 33, 1040–1061. [Google Scholar] [CrossRef]
  35. Xu, X.; Min, X. Quantifying Spatiotemporal Patterns of Urban Expansion in China Using Remote Sensing Data. Cities 2013, 35, 104–113. [Google Scholar] [CrossRef]
  36. Rode, P.; Floater, G.; Thomopoulos, N.; Docherty, J.; Schwinger, P.; Mahendra, A.; Fang, W. Accessibility in Cities: Transport and Urban Form. In Disrupting Mobility: Impacts of Sharing Economy and Innovative Transportation on Cities; Meyer, G., Shaheen, S., Eds.; Lecture Notes in Mobility; Springer International Publishing: Cham, Switzerland, 2017; pp. 239–273. [Google Scholar] [CrossRef] [Green Version]
  37. Pan, H.; Zhang, M. Rail Transit Impacts on Land Use: Evidence from Shanghai, China. Transp. Res. Rec. 2008, 2048, 16–25. [Google Scholar] [CrossRef]
  38. Sung, H.; Oh, J.T. Transit-Oriented Development in a High-Density City: Identifying Its Association with Transit Ridership in Seoul, Korea. Cities 2011, 28, 70–82. [Google Scholar] [CrossRef]
  39. Knowles, R.D. Transit Oriented Development in Copenhagen, Denmark: From the Finger Plan to restad. J. Transp. Geogr. 2012, 22, 251–261. [Google Scholar] [CrossRef]
  40. Huang, H. The Land-Use Impacts of Urban Rail Transit Systems. J. Plan. Lit. 1996, 11, 17–30. [Google Scholar] [CrossRef]
  41. Luck, M.; Wu, J. A Gradient Analysis of Urban Landscape Pattern: A Case Study from the Phoenix Metropolitan Region, Arizona, USA. Landsc. Ecol. 2002, 17, 327–339. [Google Scholar] [CrossRef]
  42. Cushman, S.A.; Gutzweiler, K.; Evans, J.S.; McGarigal, K. The Gradient Paradigm: A Conceptual and Analytical Framework for Landscape Ecology. In Spatial Complexity, Informatics, and Wildlife Conservation; Cushman, S.A., Huettmann, F., Eds.; Springer: Tokyo, Japan, 2010; pp. 83–108. [Google Scholar] [CrossRef]
  43. Yu, X.J.; Ng, C.N. Spatial and Temporal Dynamics of Urban Sprawl along Two Urban–Rural Transects: A Case Study of Guangzhou, China. Landsc. Urban Plan. 2007, 79, 96–109. [Google Scholar] [CrossRef]
  44. Dai, E.; Wang, Y.; Ma, L.; Yin, L.; Wu, Z. ‘Urban-Rural’ Gradient Analysis of Landscape Changes around Cities in Mountainous Regions: A Case Study of the Hengduan Mountain Region in Southwest China. Sustainability 2018, 10, 1019. [Google Scholar] [CrossRef]
  45. Vizzari, M.; Hilal, M.; Sigura, M.; Antognelli, S.; Joly, D. Urban-Rural-Natural Gradient Analysis with CORINE Data: An Application to the Metropolitan France. Lands. Urban Plan. 2018, 171, 18–29. [Google Scholar] [CrossRef]
  46. Hunan, S.B.O. Hunan Statistical Yearbook 2017; Technical Repor; China Statistics Press: Changsha, China, 2018. [Google Scholar]
  47. Li, G.; Sun, S.; Fang, C. The Varying Driving Forces of Urban Expansion in China: Insights from a Spatial-Temporal Analysis. Landsc. Urban Plan. 2018, 174, 63–77. [Google Scholar] [CrossRef]
  48. Chinese Land Surveying and Planning Institute (CLSPI); Cadastral Management Division of the Ministry of Land and Resources of the People’s Republic of China (CMDMLRRPC). Current Land Use Classification; Standard GB/T 21010-2017; Standardization Administration of China (SAC): Beijing, China, 2017.
  49. Jat, M.K.; Garg, P.K.; Khare, D. Monitoring and Modelling of Urban Sprawl Using Remote Sensing and GIS Techniques. Int. J. Appl. Earth Obs. Geoinf. 2008, 10, 26–43. [Google Scholar] [CrossRef]
  50. McGarigal, K.; Cushman, S.; Ene, E. FRAGSTATS v4: Spatial Pattern Analysis Program for Categorical and Continuous Maps. 2012. Available online: http://www.umass.edu/landeco/research/fragstats/fragstats.html (accessed on 15 December 2018).
  51. Zhang, Q.; Su, S. Determinants of Urban Expansion and Their Relative Importance: A Comparative Analysis of 30 Major Metropolitans in China. Habitat Int. 2016, 58, 89–107. [Google Scholar] [CrossRef]
  52. Zhu, Z. Spatial Structure of the Changsha–Zhuzhou–Xiangtan Urban Agglomeration Based on Dynamic Simulation Analysis. J. Urban Plan. Dev. 2015, 141, 04014035. [Google Scholar] [CrossRef]
  53. Dietzel, C.; Oguz, H.; Hemphill, J.J.; Clarke, K.C.; Gazulis, N. Diffusion and Coalescence of the Houston Metropolitan Area: Evidence Supporting a New Urban Theory. Environ. Plan. B Plan. Des. 2005, 32, 231–246. [Google Scholar] [CrossRef] [Green Version]
  54. Quan, B.; Xiao, Z.; Römkens, M.J.M.; Bai, Y.; Lei, S. Spatiotemporal Urban Land Use Changes in the Changzhutan Region of Hunan Province in China. J. Geogr. Inf. Syst. 2013, 5, 136. [Google Scholar] [CrossRef]
  55. Aljoufie, M.; Zuidgeest, M.; Brussel, M.; van Maarseveen, M. Spatial–Temporal Analysis of Urban Growth and Transportation in Jeddah City, Saudi Arabia. Cities 2013, 31, 57–68. [Google Scholar] [CrossRef]
Figure 1. Location and administrative divisions of the study area: (a) map of the CZT study area in China and in Hunan Province; (b) Changsha-Xiangtan and Changsha-Zhuzhou corridors in Hunan Province.
Sustainability 11 05000 g001
Figure 2. Flowchart of the research framework.
Sustainability 11 05000 g002
Figure 3. Land use maps of the CZT metropolitan region from 1995–2015.
Sustainability 11 05000 g003
Figure 4. Changes in land use types from 1995–2015.
Sustainability 11 05000 g004
Figure 5. Landscape metrics for the CZT metropolitan region from 1995–2015. (a) cultivated land; (b) urban land; (c) forest land; (d) grass land; and (e) water bodies.
Sustainability 11 05000 g005
Figure 6. Spatial orientation of urban expansion during the 1995-2015 period. (a) Changsha; (b) Zhuzhou; (c) Xiangtan.
Sustainability 11 05000 g006
Figure 7. Urban patch number increase rate within different buffer zones.
Sustainability 11 05000 g007
Figure 8. Landscape characteristics of cultivated land along the urban-green core-urban gradient transect of the Changsha–Zhuzhou line and Changsha–Xiangtan line. (a) TA of cultivated land along the CZ line; (b) PD of cultivated land along the CZ line; (c) TA of cultivated land along the CX line; and (d) PD of cultivated land along the CX line.
Sustainability 11 05000 g008
Figure 9. Landscape characteristics of forest land along the urban-green core-urban gradient transect of the Changsha–Xiangtan line. (a) TA of cultivated land along the CZ line; (b) PD of cultivated land along the CZ line; (c) TA of forest land along the CX line; (d) and PD of forest land along the CX line.
Sustainability 11 05000 g009
Figure 10. Landscape characteristics of urban land along the urban-green core-urban gradient transect of the Changsha–Zhuzhou line. (a) TA; (b) NP; (c) PD; (d) AI; (e) LPI; and (f) NP/LPI.
Sustainability 11 05000 g010
Figure 11. Landscape characteristics of urban land along the urban-green core-urban gradient transect of the Changsha–Xiangtan line. (a) TA; (b) NP; (c) PD; (d) AI; (e) LPI; and (f) NP/LPI.
Sustainability 11 05000 g011aSustainability 11 05000 g011b
Figure 12. Dendrogram showing the results of the systematic clustering analysis.
Sustainability 11 05000 g012
Table 1. Landscape metrics used to calculate landscape patterns in this study.
Spatial MetricAcronymDescription (Unit)
Percentage of LandscapePLANDProportion of the total area occupied by a particular land use type (Percent).
Largest patch indexLPIPercentage of the landscape comprised by the largest patch (Percent).
Landscape shape indexLSITotal edge length in the landscape divided by the minimum total possible edge length. (None).
Patch densityPDNumber of patches per 100 ha of the corresponding patch type divided by the total landscape area (Number per 100 hectares).
Aggregation indexAINumber of adjacent patches of the corresponding patch type based on the single-count method. (Percent).
Table 2. Anual urban expansion rate (AER) and expansion intensity (UEI) in CZT from 1995 to 2015.
City/RegionAER (%)UEI (%)
 1995–20052005–20151995–20151995–20052005–20151995–2015
Changsha3.33029.41697.94150.08560.32280.2042
Zhuzhou1.78404.59363.59860.03340.10120.0673
Xiangtan1.94377.61735.52070.04490.21030.1276
CZT2.55787.59066.04500.05740.21390.1357
Table 3. Cluster analysis results.
Functional TypeCX LineCZ Line
199520052015199520052015
Urban center3, 43, 42, 3, 43, 43, 42, 3, 4, 12
Urban area221, 52, 122, 121, 5
Urban-rural fringe5, 115, 116,111, 5, 10, 111, 5, 10, 116, 10, 11
Green core1, 6, 7, 8, 9, 101, 6, 7, 8, 9, 107, 8, 9, 106, 7, 8, 96, 7, 8, 97, 8, 9

