Article

Bottlenecks, Shockwave, and Off-Ramp Blockage on Freeways

1
Key Laboratory of Road and Traffic Engineering of the Ministry of Education, Tongji University, Shanghai 200092, China
2
Zhejiang University Urban-Rural Planning & Design Institute, Hangzhou 310000, China
3
Zhejiang Provincial Institute of Communications Planning, Design & Research, Hangzhou 310006, China
4
Institute of Intelligent Transportation Systems, Zhejiang University, Hangzhou 310058, China
5
Faculty of Maritime and Transportation, Ningbo University, Ningbo 315211, China
*
Author to whom correspondence should be addressed.
The first three authors contributed to this work equally.
Sustainability 2019, 11(18), 4991; https://doi.org/10.3390/su11184991
Submission received: 7 June 2019 / Revised: 20 August 2019 / Accepted: 25 August 2019 / Published: 12 September 2019

Abstract

:
Freeway congestion may spill back for several kilometers, blocking a number of on/off-ramps upstream. As a consequence, flows at the off-ramps may be substantially reduced, and vehicles bound for the off-ramps are trapped in the mainstream congestion, causing intensified spillback of congestion that blocks even more off-ramps further upstream. Such off-ramp blockage is readily understood and its impact is empirically recognized, but there is a lack of analysis to provide more insights. In this paper, some flow conditions for the activation of bottlenecks and congestion propagation are first established, and the mechanism of the off-ramp blockage is theoretically explored. Macroscopic and microscopic simulations are conducted to demonstrate the analytical results, and some general relations between the total demand, total inflow, total off-ramp outflow, and the number of vehicles within a freeway system are examined.

1. Introduction

Road transport consumes a huge amount of oil products, and it is one of the main sources of greenhouse gas emissions, which lead to global warming and climate change. According to recent studies [1,2], the transportation sector alone accounts for 25% and 32% of the total carbon dioxide (CO2) emissions in Europe and in the USA, respectively. In the EU, road transportation is responsible for 71% of the total transport share in total emissions [3].
Greenhouse gas emissions of a car depend highly on traffic conditions it encounters en route. Congestion does not only waste a massive amount of time, but also leads to much excessive fuel consumption and greenhouse gas emissions. In the USA, congestion is responsible for 1.9 billion gallons of wasted fuel, 4.8 billion hours of extra time, and 101 billion dollars of delay and fuel cost annually [4]. In the EU, congestion costs 1% of the total GDP annually [5]. It is expected that the cost of congestion may increase by 50% by 2030 [6]. Therefore, congestion mitigation plays a significant role in sustainable traffic mobility, and the understanding of complicated mechanism of traffic congestion is a prerequisite for the development and deployment of appropriate traffic control approaches to dealing with congestion. This paper is concerned with off-ramp blockage, a specific aspect of freeway congestion.
Traffic operation in a road network is a game between the traffic demand and network supply. If the network capacity suffices to accommodate the total demand, the total network outflow is equal to the total demand, albeit with some time delay. When the total demand exceeds the network capacity, congestion sets in and the network outflows start to decline. If traffic conditions deteriorate further, the network outflows drop even more. This general image of network traffic dynamics has been described in a number of previous works [7,8,9,10,11,12].
The total network outflow is of much importance to traffic operation, as it represents the network productivity. In an early report, Papageorgiou proved that the total time spent within an isolated freeway network is related to the integral of the sum of all exit flows [8]. It was later confirmed by Ros et al. [13] that maximizing the network outflow leads to the minimization of the total time spent by all motorists during peak periods. Therefore, if a traffic control measure facilitates the increase of the total network exit flow, it serves to attenuate network traffic congestion and is hence beneficial for the whole motorist population [14]. Off-ramp blockage is a typical counterexample concerning what is stated above, i.e., the performance of a freeway network deteriorates with the decrease of total off-ramp exit flow under congestion. This paper is concerned with off-ramp blockage.
Normally freeway congestion is initiated at a bottleneck such as a ramp merging area, a tunnel, or an incident location. In many cases, congestion may spill back for several kilometers, blocking a number of on/off-ramps upstream of the bottleneck. This causes off-ramp blockage; that is, exiting flows from the off-ramps dominated by the mainstream congestion are substantially reduced, and vehicles bound for the blocked off-ramps are trapped in the mainstream congestion, contributing to further spillback of congestion that blocks even more off-ramps further upstream with similar effects. The off-ramp blockage can cause severe degradation of infrastructure performance. In fact, prolonged congestion in a freeway network during a peak period is not necessarily due to total demand much exceeding total capacity. Instead, the propagation of initial congestion can be accelerated and intensified by the consequential occurrence of off-ramp blockage. Eventually, the congestion may cover a significant part of the freeway and even spill over to other freeways. It should be emphasized that the off-ramp blockage under discussion is caused by congestion in the freeway mainstream rather than by congestion spillback from arterial roads adjoining the off-ramps; see e.g., references [15,16,17] for the latter case.
Off-ramp blockage has a severe impact on freeway operation, and hence needs to be prevented by traffic control measures such as ramp metering and variable speed limit control. Papageorgiou and Papamichail first mentioned off-ramp blockage when dealing with ramp metering [14], while Iordanidou et al. considered the same issue for the purpose of variable speed limit control [18]. So far, only a small number of works [14,18,19,20,21,22] have mentioned off-ramp blockage, and in particular, [20,21,22] just mentioned it as a concept without giving any detail. Overall, off-ramp blockage is readily understood and the resulting impact has been empirically recognized for a long time, but there is a lack of analytical studies, and its detailed mechanism is yet to be brought to light. In addition, since there is a strong connection between off-ramp blockage and freeway traffic control performance, the exploration of off-ramp blockage mechanisms also contributes to the better understanding and execution of traffic control.
The aim of this paper is twofold. Firstly, it theoretically explores the mechanism of off-ramp blockage. Due to the complexity involved with mathematical modelling, a static and algebraic approach based on the first-order Lighthill-Whitham-Rechards (LWR) model is applied. Secondly, to demonstrate the off-ramp blockage effect in a dynamic traffic environment for more insights, macroscopic and microscopic traffic simulations are conducted with a variety of scenarios considered. Some general relations between the total demand, total network inflow, total off-ramp flow, and the number of vehicles within a freeway system are investigated. This study has not been reported before.
The rest of the paper is organized as follows. Section 2 examines the effect of flow conditions on bottleneck activation and congestion propagation in freeways and explores the mechanism of off-ramp blockage. Macroscopic and microscopic simulation studies are reported in Section 3. The paper is concluded in Section 4.

2. Analysis of Off-Ramp Blockage

2.1. Problem Statement

To introduce the general issue of off-ramp blockage for our work, a simple example is first discussed. A freeway stretch with an on-ramp and off-ramp pair is displayed in Figure 1. Particularly, Figure 1a depicts the no-ramp-metering case where the ramp merging area is overloaded and the resulting congestion has already spilled back to the upstream of the off-ramp, while Figure 1b addresses the case where ramp merging congestion is prevented via appropriate ramp metering.
The mainstream inflow, off-ramp exiting rate, on-ramp demand, and capacity of the ramp merging area are denoted by qin, α, r, and qcap, respectively. The same traffic scenario is considered for both cases in Figure 1. For Figure 1a, the off-ramp exit flow and discharge flow of the ramp merging area are denoted by s and qout, and for Figure 1b, the off-ramp outflow and metered on-ramp inflow are denoted by s’and r’. In Figure 1a, qcapqout represents the capacity drop, which is avoided in Figure 1b. Then, we have for Figure 1a,
q i n ( 1 α ) + r > q c a p
q i n ( 1 α ) + r = q o u t < q c a p
s = α 1 α ( q o u t r )
and for Figure 1b,
q i n ( 1 α ) + r = q c a p
s = α q i n
thus,
s < s
i.e., the off-ramp flow drops due to off-ramp blockage. Note also that s < s holds even without considering capacity drop, i.e., assuming qout = qcap.
Next, we intend to derive the same conclusion for a general case as depicted by Figure 2 and Figure 3. More specifically, Figure 3 displays a freeway stretch including n pairs of on/off-ramps and a downstream bottleneck of capacity C. Without loss of generality, the downstream bottleneck may be an un-metered on-ramp (like that in Figure 1a) or an incident site (an accident location or a work zone), which can be activated during peak periods. In contrast, Figure 2 addresses the same freeway stretch without the downstream bottleneck, i.e., the downstream on-ramp is appropriately metered (as in Figure 1b) or there is no incident.
To demonstrate that the total off-ramp exit flow in Figure 3 is less than that in Figure 2, the following assumptions are made without loss of generality:
(i)
the same traffic demands are considered for both cases, i.e., the mainstream demand is q, and the on-ramp demands are qm (m = 1, 2, …, n).
(ii)
the scenario is such that no congestion occurs in Figure 2, while congestion in Figure 3 is only initiated at the downstream bottleneck and spills back to block the off-ramps upstream.
Equivalent to (ii), we assume with respect to Figure 3 that no congestion is initiated at any ramp merging location upstream of the bottleneck. Thus, given an on-ramp, we do not distinguish between the ramp demand and ramp inflow until the downstream congestion spills back to the on-ramp. On the other hand, there is no difference between the ramp demand and ramp inflow in Figure 2, as no merging congestion happens anywhere.
While studying the off-ramp blockage issue based on Figure 3, we must take it into account that, given demands and off-ramp exiting rates a priori, the congestion spillback may affect the on-ramp inflows and off-ramp exiting rates, which was not considered for the simple case in Figure 1. More specifically, we will consider that q m q m and α m α m   ( m = 1 , 2 , , n ) .

2.2. Flow Conditions for Bottleneck Activation and Congestion Propagation

2.2.1. Basic Definitions and Relations

Some general relations and conditions are first developed to set a basis for the subsequent analyses. In Figure 2, the location between the mth off-ramp and mth on-ramp is denoted by Ym, and the location right downstream of the mth on-ramp (m = 1, 2, …, n) is denoted by Zm. Q Y m and Q Z m denote the flows at Ym and Zm, we then have:
Q Y 1 = q ( 1 α 1 )
Q Z 1 = q ( 1 α 1 ) + q 1
Q Y 2 = q ( 1 α 1 ) ( 1 α 2 ) + q 1 ( 1 α 2 )
Q Z 2 = q ( 1 α 1 ) ( 1 α 2 ) + q 1 ( 1 α 2 ) + q 2
By induction, we have for 1 m n ,
Q Y m = q i = 1 m ( 1 α i ) + i = 1 m 1 q i j = i + 1 m ( 1 α j )
Q Z m = Q Y m + q m = q i = 1 m ( 1 α i ) + i = 1 m 1 q i j = i + 1 m ( 1 α j ) + q m
and for 1 m n 1 ,
Q Z m = Q Y m + 1 1 α m + 1
Concerning bottleneck activation and congestion propagation in Figure 3, if a queue forms at the downstream bottleneck due to overflow, and the resulting shockwave propagates backward, the mainstream flows would then be constrained by the bottleneck capacity C. An idealized (simplified) case was considered by Newell [23], and Cassidy and Bertini [24] where, for each pair of on/off-ramps, if the ramp inflow is assumed to exceed the ramp outflow, then traffic density increases monotonically from downstream to upstream. This means that densities in a long freeway queue are highest at its tail and progressively less dense towards its head. However, since there is no guarantee that the above assumption always holds, we establish in what follows more general conditions on bottleneck activation and congestion propagation.
Consider in Figure 3 that congestion is already initiated at the bottleneck and propagates backward along the freeway stretch. In addition to locations Ym and Zm already defined, the location right upstream of off-ramp m (m = 1, 2, …, n) is denoted by Xm in Figure 3. Obviously, Xm in Figure 3 and Zm−1 in Figure 2 address the same location. Besides the non-congested flows Q defined for Figure 2 and used in Equations (1)–(7), the flows on the congestion-side of the shockwave in Figure 3 are denoted by Q’. More specifically, Q X m (m = 1, 2, …, n) is well defined only if the shockwave has already passed Xm, while Q Z m and Q Y m (m = 1, 2, …, n) are similarly defined.
Unlike Figure 2, it is necessary to distinguish between ramp demands and ramp inflows in Figure 3. More precisely, under congestion, on-ramp inflow q m may be lower than the on-ramp demand q m (m = 1, 2, …, n). In addition, with the mainstream congestion prevailing, the off-ramp exiting rates could stay unchanged, or even become bigger as more vehicles may wish to escape from the congestion, hence α m α m (m = 1, 2, …, n).
Like Equations (1)–(7), some basic relations are obtained for Figure 3:
Q Z n = C
Q Y n = C q n
Q X n = Q Y n 1 α n
Q Y n 1 = Q X n q n 1 = C q n q n 1 ( 1 α n ) ( 1 α n )
Q X n 1 = Q Y n 1 1 α n 1 = C q n q n 1 ( 1 α n ) ( 1 α n ) ( 1 α n 1 )
By simple induction, for 1 m n
Q Y m = C q n i = m n 1 q i j = i + 1 n ( 1 α j ) i = m + 1 n ( 1 α i )
Q X m = C q n i = m n 1 q i j = i + 1 n ( 1 α j ) i = m n ( 1 α i )
Q X m = Q Y m 1 α m
Q Y m = Q X m + 1 q m

2.2.2. Mathematic Analysis

Lemma 1.
The condition for bottleneck activation is:
q i = 1 n ( 1 α i ) + i = 1 n 1 q i j = i + 1 n ( 1 α j ) + q n > C
Proof. 
Based on Figure 3 and Equation (6), the condition Q Z n > C can be re-written as Condition (17).  □
Lemma 2.
Assume that qm’ = qmand αm’ = αm(m = 1, 2, …, n). Congestion keeps spilling back if Condition (17) is satisfied.
Proof. 
See Appendix A.  □
Corollary 1.
Assume that qm’ = qmand αm’ = αm(m = 1, 2, …, n), congestion can spill back to the upper bound of the stretch and further upstream, if and only if the bottleneck is activated with Condition (17).
Proof. 
First, by Lemma 2, congestion keeps spilling back if Condition (17) is satisfied. As such, the shockwave can reach the upper bound of the stretch and further upstream. Second, if the shockwave has reached the upper bound of the stretch and can propagate further upstream, we have by the LWR theory that q > Q X 1 in Figure 3, which means by Equation (14):
q > C q n i = 1 n 1 q i j = i + 1 n ( 1 α j ) i = 1 n ( 1 α i )
which is equivalent to Condition (17).  □
Lemma 2 and Corollary 1 hold under the conditions that qm’ = qm and αm’ = αm (m = 1, 2, …, n). However, these requirements may not be met in general, and hence the activation of the bottleneck with Condition (17) does not guarantee that congestion spills back over the whole freeway stretch. Rather, in general, q m q m and α m α m (m = 1, 2, …, n), i.e., under heavy congestion less flows could enter the freeway mainstream via on-ramps and more flows may wish to exit via off-ramps. As a result, the backward propagation of congestion is not necessarily so “sustainable” as stated by Lemma 2 and Corollary 1. Some more general results are given below.
Theorem 1.
Consider that q m q m and α m α m (m = 1, 2, …, n) and suppose that Condition (17) is satisfied so that congestion is triggered at the bottleneck. Then, the condition that the shockwave reaching location Ym keeps moving upstream is:
Q i = 1 m ( 1 α i ) + i = 1 m 1 q i j = i + 1 m ( 1 α j ) > C q n ' i = m n 1 q i ' j = i + 1 n ( 1 α j ' ) i = m + 1 n ( 1 α i ' )
the condition that the shockwave reaching Xm keeps moving upstream is:
q i = 1 m ( 1 α i ) + i = 1 m 1 q i j = i + 1 m ( 1 α j ) 1 α m > C q n i = m n 1 q i j = i + 1 n ( 1 α j ) i = m n ( 1 α i )
and the condition that the shockwave reaching X1 keeps moving further upstream is:
q > C q n i = 1 n 1 q i j = i + 1 n ( 1 α j ) i = 1 n ( 1 α i )
Proof. 
Based on the LWR theory, Condition (18) is straightforward from the relation Q Y m > Q Y m in consideration of Equations (5) and (13); Condition (19) is immediate from Q Z m 1 > Q X m , with Equations (5), (7), and (14); Condition (20) stands with Equation (14).  □
Unlike in Corollary 1, Condition (20) is not equivalent to Condition (17). More specifically, it is stricter than Condition (17), as the quantity on the right side of Condition (20) is greater than that on the right side of Condition (17). This means that congestion spillback to the upper bound of the stretch must have resulted from the original bottleneck activation, while triggering congestion at the bottleneck does not guarantee the shockwave propagation throughout the stretch. In fact, congestion may dissipate; see the corollary below.
Corollary 2.
Reversing the direction of the inequality signs in Conditions (18)–(20) leads to the conditions for congestion dissolution at the corresponding locations.
To summarize the main results of this section,
(1)
under an idealized condition were qm’ = qm and αm’ = αm (m = 1, 2, …, n) (i.e., on-ramp inflows and off-ramp exiting rates do not change under congestion), the resulting shockwave keeps spilling back if and only if it arises at the downstream bottleneck (Lemma 2 and Corollary 1);
(2)
under general conditions where q m q m and α m α m (m = 1, 2, …, n) (i.e., on-ramp inflows may drop and off-ramp exiting rates may increase under congestion), the resulting shockwave keeps propagating upstream if some additional conditions are satisfied (Theorem 1);

2.3. Off-Ramp Blockage

We are now ready to discuss the issue of off-ramp blockage by comparing the total off-ramp exit flows in Figure 2 and Figure 3, under the same traffic scenario. The total off-ramp flow is denoted by Q1 in Figure 2 and by Q2 in Figure 3. Empirically, it is believed that off-ramp blockage takes place when Q 2 < Q 1 . This is analytically examined below, particularly with the general conditions q m q m and α m α m (m = 1, 2, …, n) taken into account. As far as Q2 in Figure 3 is concerned, Condition (20) is considered, i.e., the shockwave propagation has covered the whole stretch in Figure 3.
Theorem 2.
Consider that congestion is triggered at the downstream bottleneck and spills back to reach the upper bound of the stretch with Condition (20) satisfied. In addition, q m q m and α m α m (m = 1, 2, …, n). Then, off-ramp blockage takes place with Q 2 < Q 1 , if
C { i = 1 n ( 1 α i ) i = 1 n ( 1 α i ) } + i = 1 n ( 1 α i ) { i = 1 n 1 q i [ 1 j = i + 1 n ( 1 α j ) ] i = 1 n 1 q i [ 1 j = i + 1 n ( 1 α j ) ] } 0
Proof. 
See Appendix B.  □
Corollary 3.
Replace the condition α i α i (i = 1, 2, …, n) in Theorem 2 with αi’ = αi(i = 1, 2, …, n), then the result that Q 2 < Q 1 holds unconditionally.
Proof. 
Note that the expression of Condition (21) is rather complex and hence its physical image is quite obscure. Replacing condition α i α i with αi’ = αi (i = 1, 2, …, n), it is easy to see that Condition (21) is reduced to:
i = 1 n 1 ( q i q i ) [ 1 j = i + 1 n ( 1 α j ) ] i = 1 n ( 1 α i ) 0
which holds absolutely. Then, Corollary 3 holds.  □
Theorem 2 says that the satisfaction of Condition (21) leads to the occurrence of off-ramp blockage, i.e., Q2 < Q1, if the general condition of Equation (20) and conditions q m q m and α m α m (m = 1, 2, …, n) are met. The physical meaning of Condition (20), that q m q m and α m α m (m = 1, 2, …, n), and of Q2 < Q1 is already clear in Section 2.2. However, the mathematical expression of Condition (21) is very complicated. For this reason, one more assumption is introduced to Corollary 3, i.e., αm’ = αm (m = 1, 2, …, n). Then, Condition (21) holds absolutely. It is also noted that αm’ = αm (m = 1, 2, …, n) is quite reasonable during daily peak periods.

2.4. Further Discussions

As mentioned in Section 2.1, the concerned downstream bottleneck may refer to an un-metered on-ramp or an accident site, during peak periods. No distinction has been made between the two types of bottleneck for the mathematical analysis, and the obtained results apply to either case. In addition, the two types of bottleneck were specifically considered for simulation studies in Section 3.
The off-ramp exiting rates αm or αm (m = 1, 2, …, n) are assumed constant in the previous theoretical studies. To justify this assumption, a sensitivity analysis is made as follows. With reference to Figure 2, we denote the mainstream entry, the 1st, 2nd, …, and the nth on-ramps as origins 0, 1, 2, …, n, and also denote the 1st, 2nd, …, nth off-ramps, and the mainstream exit as destinations 1, 2, …, n, n + 1. The mainstream inflow is denoted by q0, i.e., q0 = q, while qm (m = 1, 2, …, n) are already marked in Figure 2. The origin-destination (OD) rates for qi (i = 1, 2, …, n) with respect to destinations j ( i < j n + 1 ) and j = i + 1 n + 1 β i j = 1 are denoted by βij. Given an off-ramp m(m = 1, 2, …, n), the exiting rate αm is a function of upstream demands qi (i = 0, 1, 2, …, m − 1) and OD rates βij (i = 0, 1, 2, …, m – 1; j = 0, 1, 2, …, m – 1). More specifically,
α m = i = 0 m 1 q i β i m i = 0 m 2 q i ( 1 j = i + 1 m 1 β i j ) + q m 1
Now we examine numerically the sensitivity of off-ramp exiting rates to the upstream demands and relevant OD rates. Let us focus on the fourth off-ramp in Figure 3, with n equal to 7, and thus examine the sensitivity of α4 with respect to qi (i = 0, 1, 2, 3) and βij (i = 0, 1, 2, 3; j = 1, 2, 3). First, assume that βij keeps constant at 10% for each related (i, j) pair. Figure 4 addresses the sensitivity of α4 to q0 and qi (i = 1, 2, 3). With qi (i = 1, 2, 3) fixed at 500 veh/h and q0 growing from 2000 veh/h to 5000 veh/h, it is shown in Figure 4a that α4 increases from 0.13 to 0.14. With q0 fixed at 2000 veh/h and qi (i = 1, 2, 3) growing from 0 veh/h to 2000 veh/h, it is shown in Figure 4b that α4 decreases from 0.14 to 0.13. Thus, off-ramp exiting rates αm (m = 1, 2, …, n) are not very sensitive to upstream traffic demands, based on this numerical example.
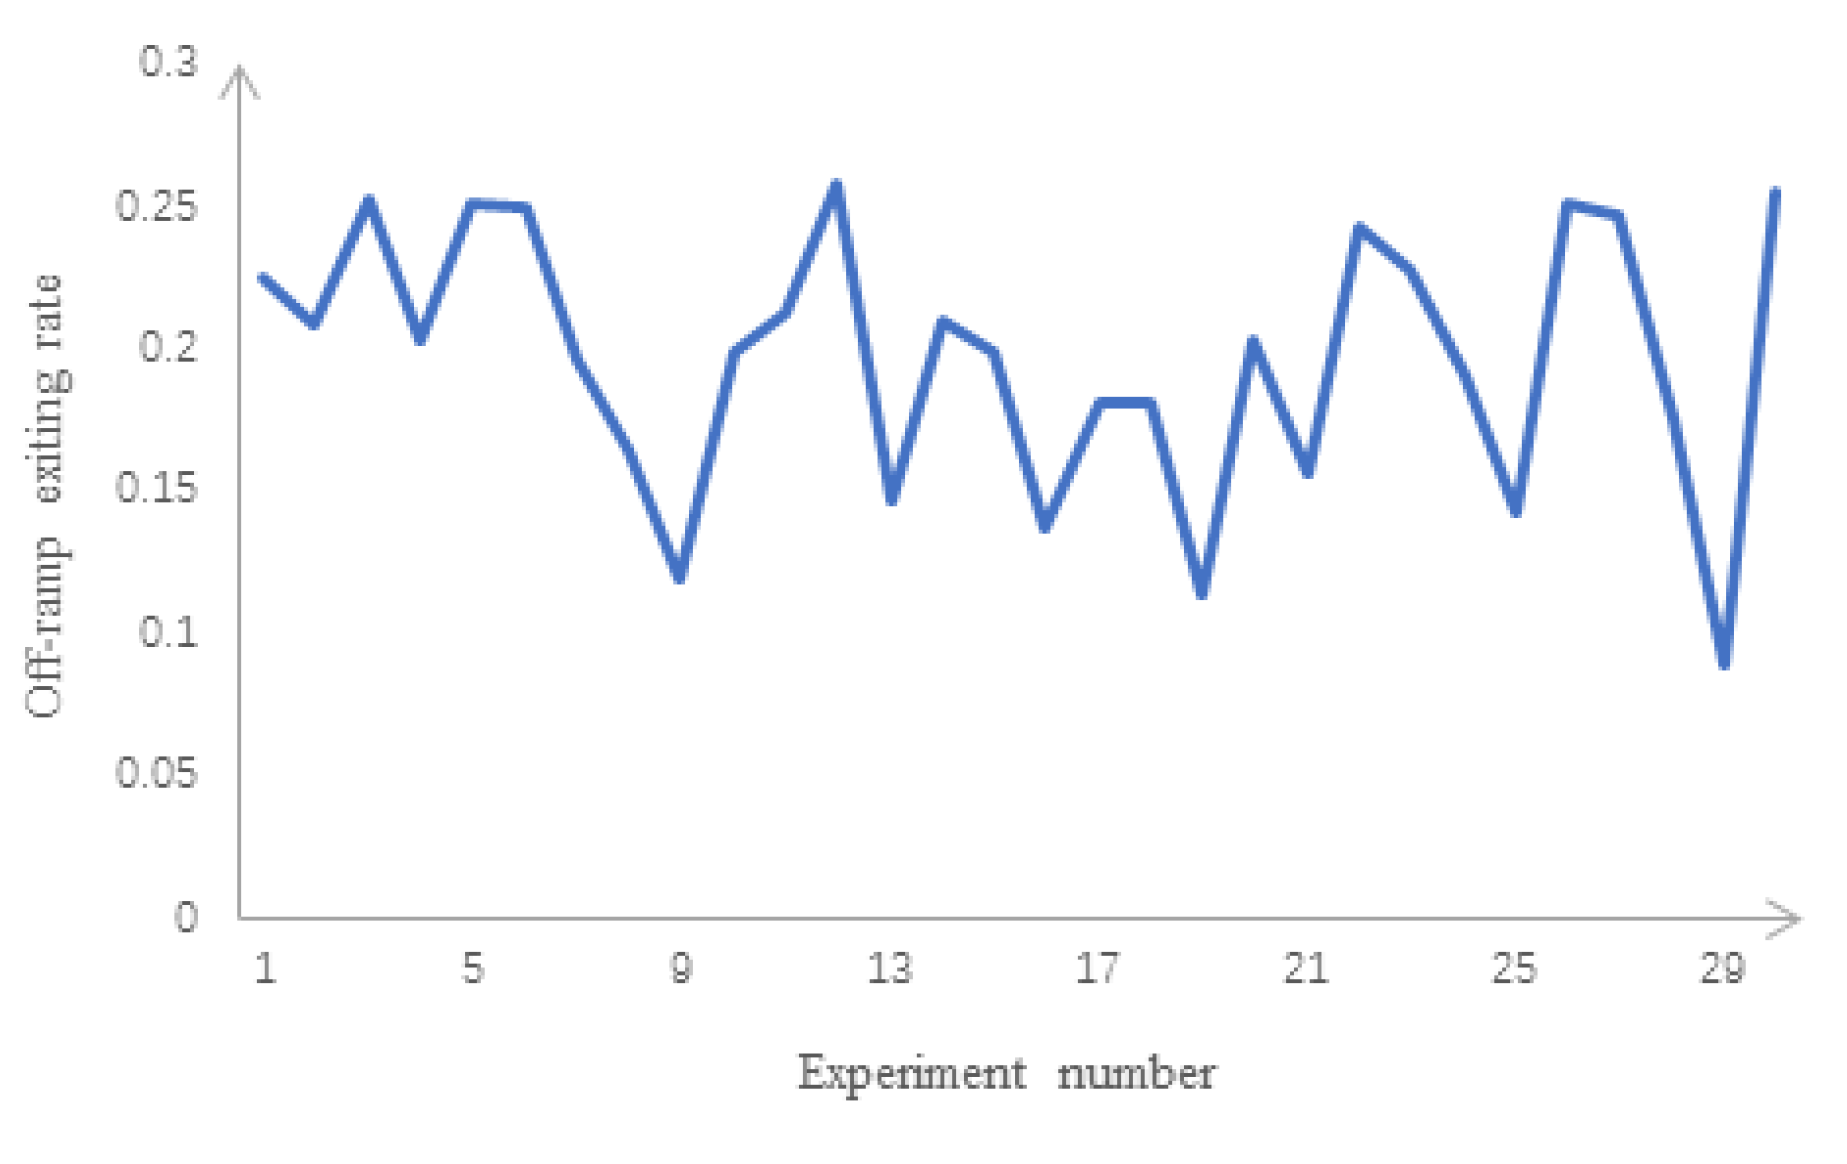
Second, assume qi (i = 0, 1, 2, 3) keeps constant (q0 = 4000 veh/h, q1/2/3 = 1400 veh/h), and βij (i = 0, 1, 2, 3; j = 1, 2, 3) are taken from a uniform distribution over [0, 1]. Thirty values of α4 resulting from Equation (23) are displayed in Figure 5, where the x-axis addresses 30 samples of βij (i = 0, 1, 2, 3; j = 1, 2, 3). Clearly, the exiting rate αm (m = 1, 2, …, n) is sensitive to OD rates βij (i = 0, 1, 2, …, m − 1; j = 1, 2, …, n − 1). If we focus on peak periods, however, OD rates can be reasonably thought nearly constant. Overall, it is justified that off-ramp exiting rates are assumed constant in the previous analytical studies.

3. Simulation Investigations

It is assumed for the theoretical analysis in Section 2 that qm and αm (m = 0, 2, …, n + 1) are basically constant, and the approach employed there based on the LWR theory is essentially static. Nevertheless, the mathematical analyses are complicated. Some questions remain unaddressed. First, what happens if qm and αm (m = 1, 2, …, n) are not constant, and how sensitive is the off-ramp blockage effect to various values of qm and αm (m = 1, 2, …, n)? Second, the static analyses considered previously make no distinction between the causes of the bottleneck, e.g., overflow in a ramp-merging area or the occurrence of an accident. Would this make any difference to the off-ramp blockage effect in practice? Macroscopic and microscopic simulation studies are conducted in this section to address these questions. It should be emphasized that the condition αm’ = αm (m = 1, 2, …, n) is used for all simulation studies conducted.

3.1. Off-Ramp Blockage Effect

This section demonstrates in dynamic traffic simulation environments the off-ramp blockage effect, i.e., to show that the total off-ramp flow Q2 in the case of Figure 3 is less than Q1 in the case of Figure 2 (see Theorem 2 and Corollary 3 in Section 2.3).

3.1.1. An Accident Case

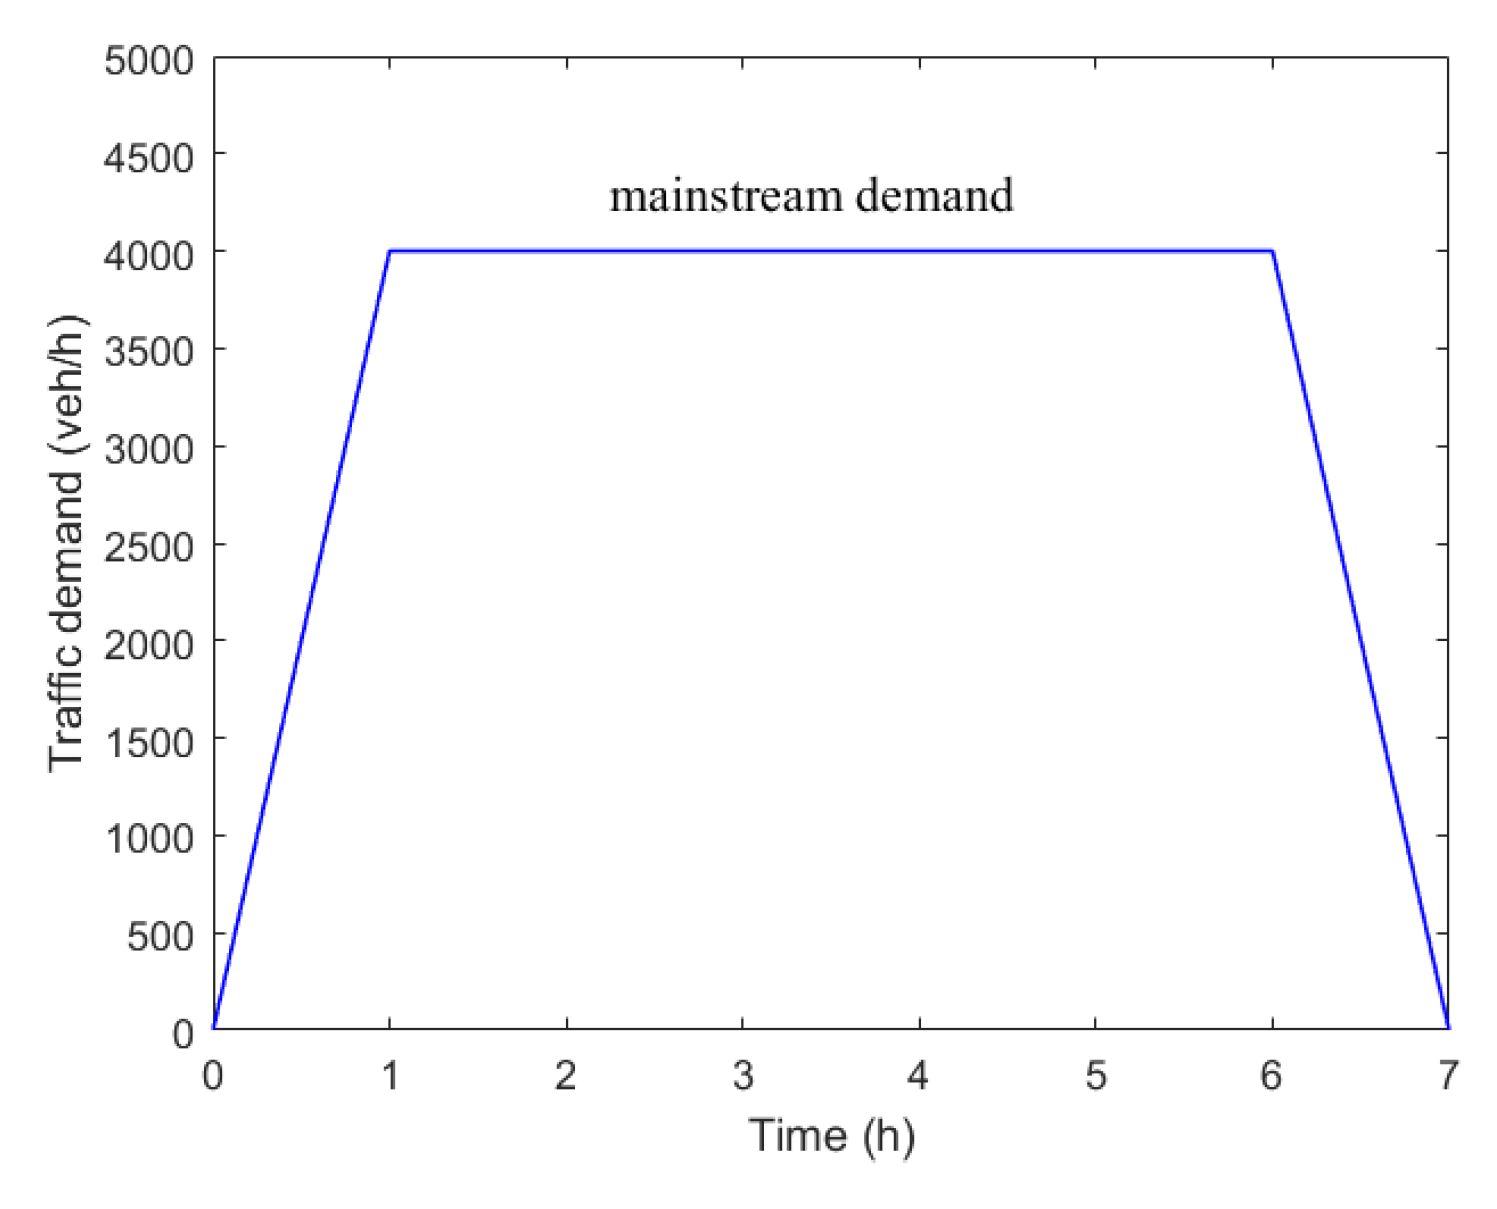
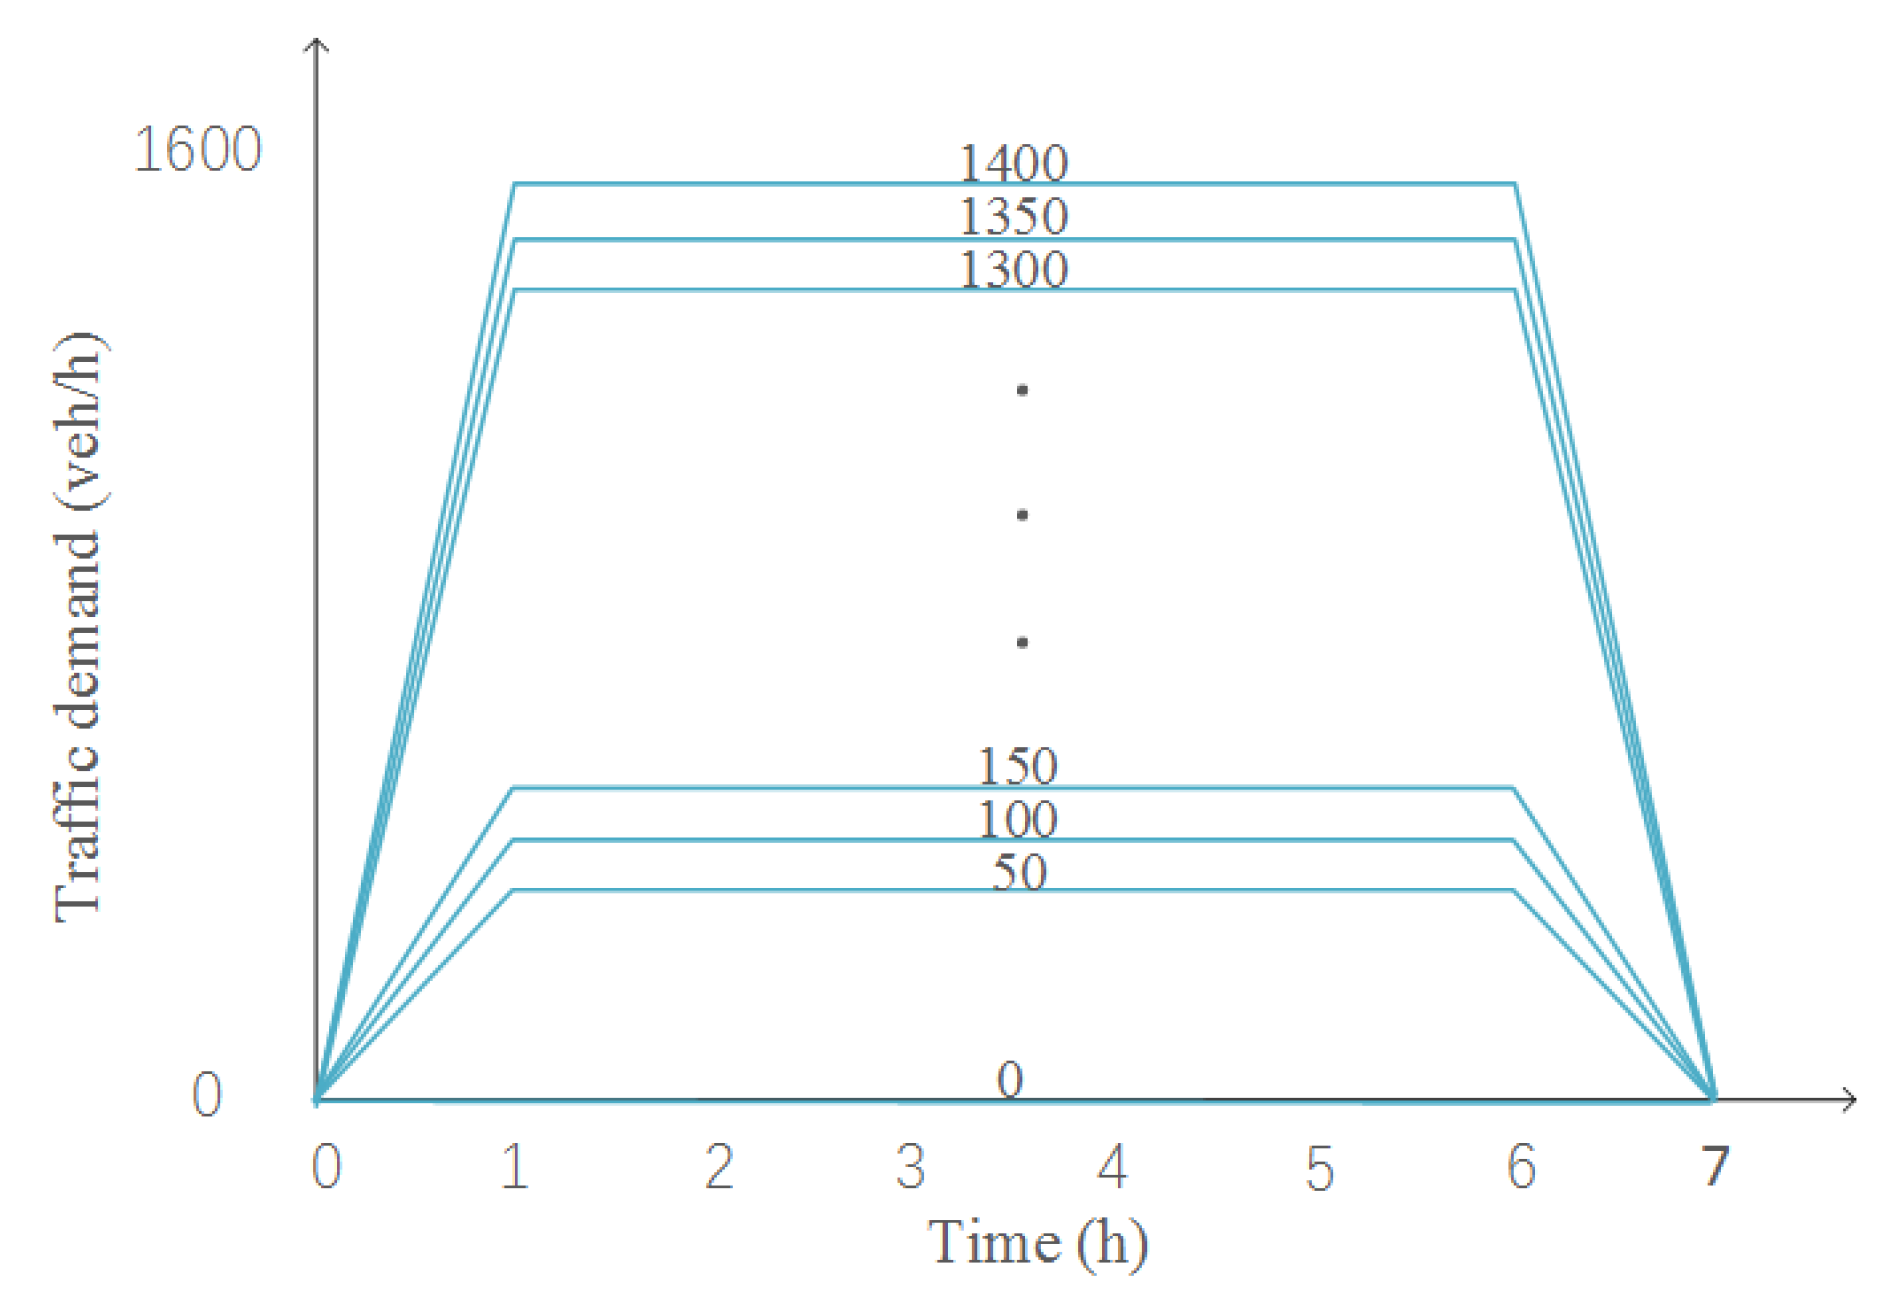
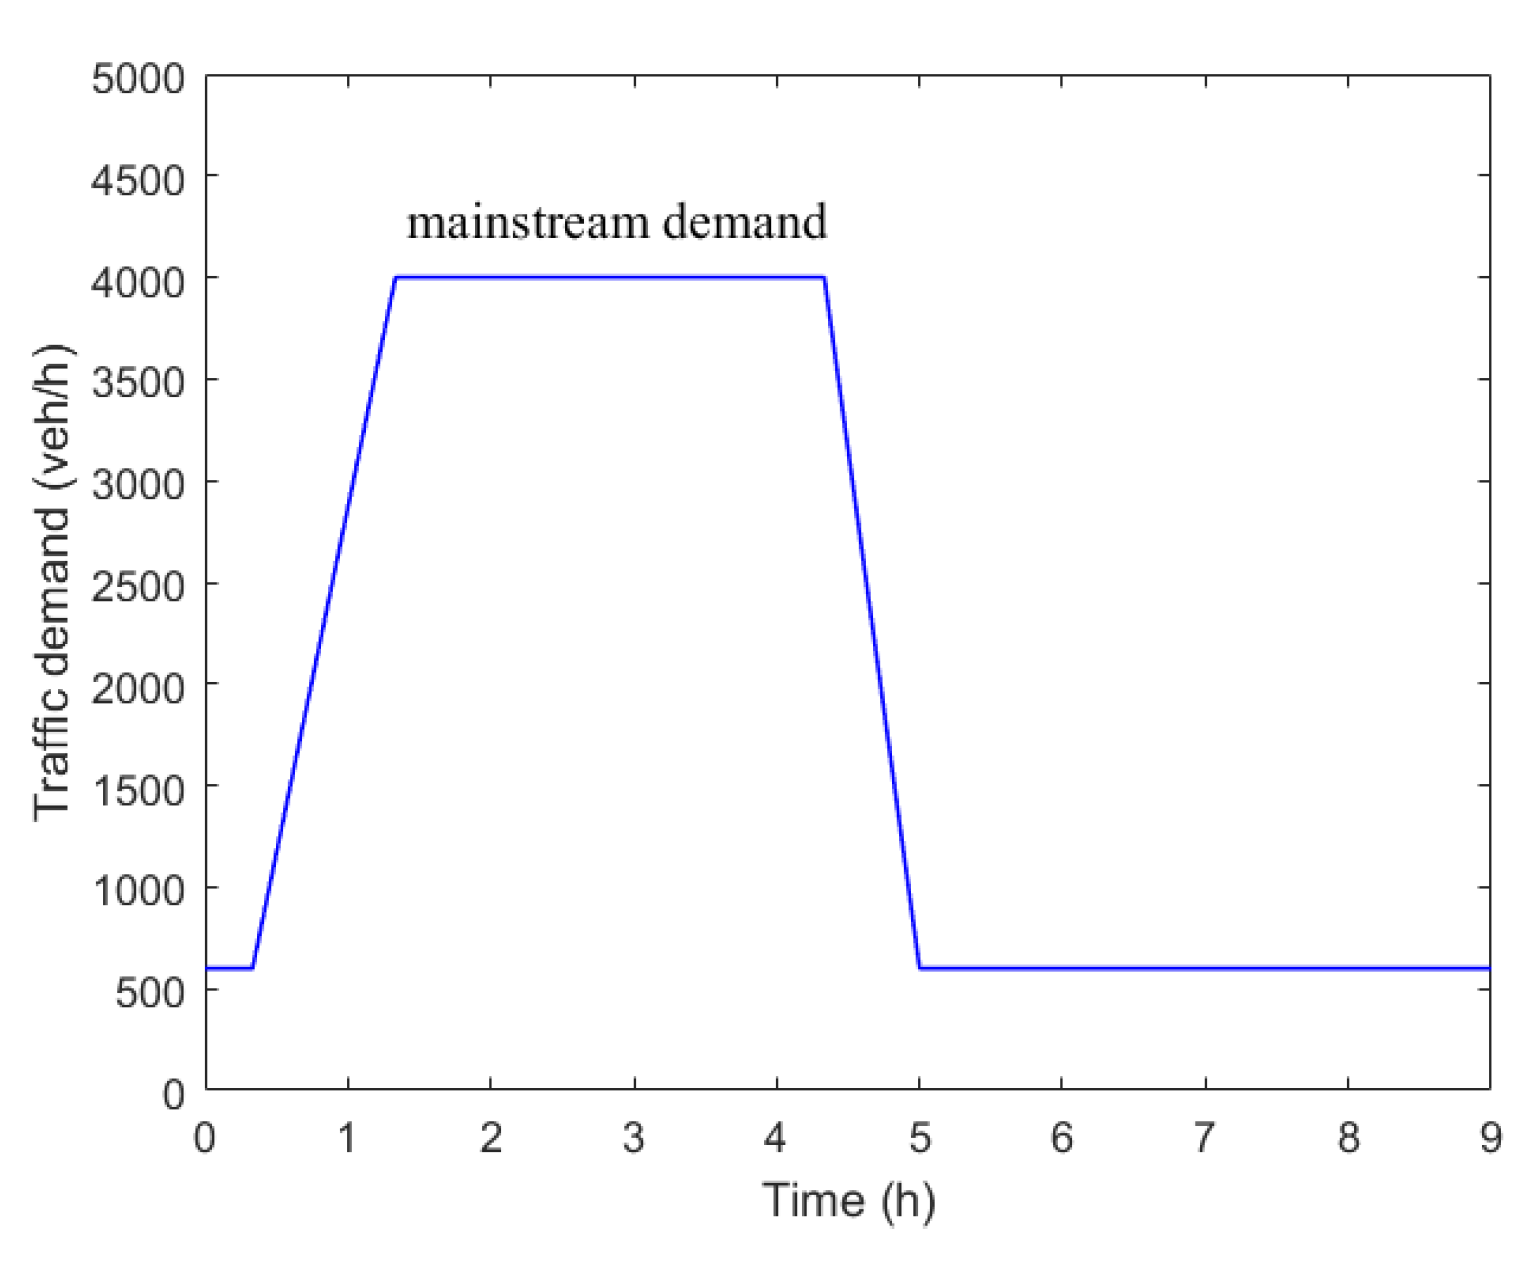
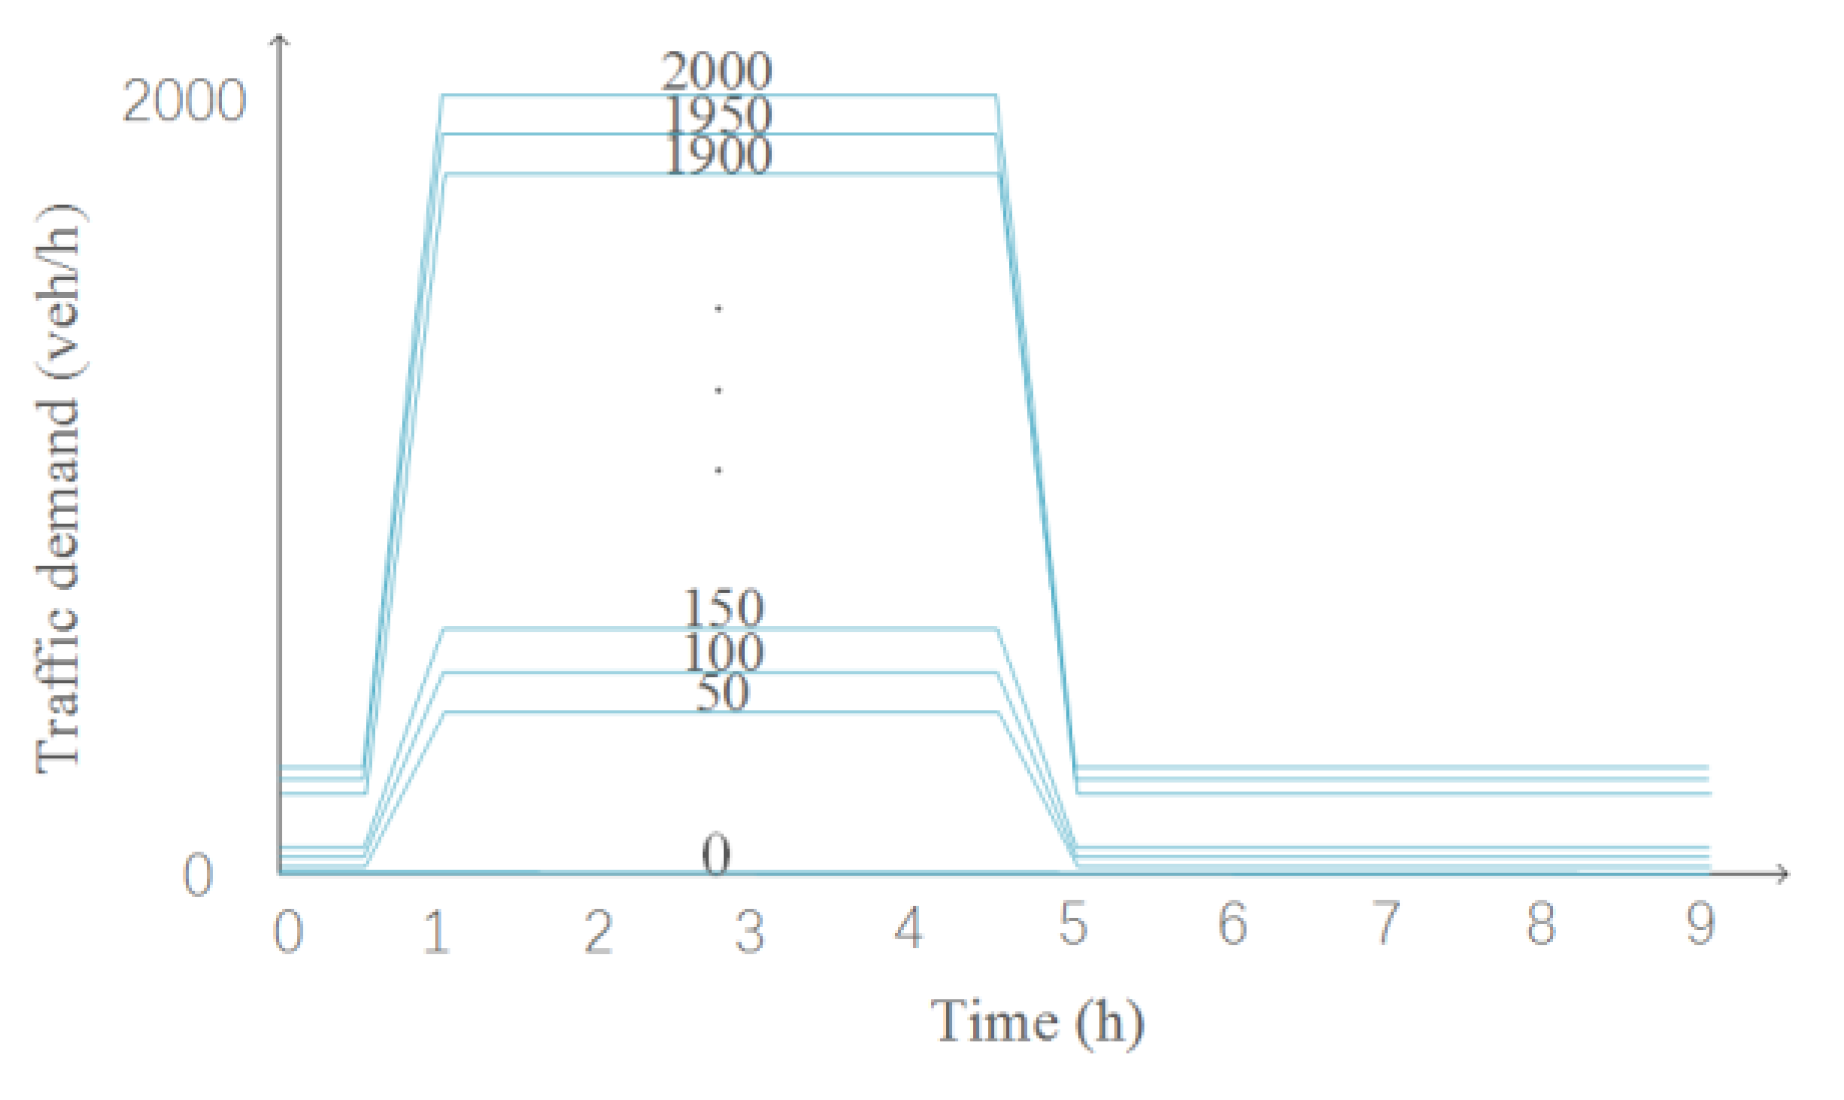
A non-recurrent bottleneck is assumed with a traffic accident. The related freeway stretch is displayed in Figure 6, which is 15 km long with seven pairs of on/off-ramps and an accident-induced bottleneck at the downstream. The stretch has three lanes throughout except the bottleneck section of two lanes. The normal capacity is 6600 vehicles/h (for three lanes) and the bottleneck capacity is 4800 veh/h (for two lanes). The mainstream demand is displayed in Figure 7, while multiple on-ramp demand scenarios are plotted in Figure 8, assuming equal demands at all on-ramps given any scenario. As stipulated already, we focus on the case where congestion appears first at the downstream bottleneck and keeps spilling back to the upper bound of the stretch. For this reason, given a mainstream demand, only a feasible set of ramp-demand scenarios in Figure 8 ought to be considered. The macroscopic simulation tool METANET [25,26] and microscopic simulator VISSIM were employed for the simulation studies [27]. For the purpose of macroscopic simulation, the freeway stretch in Figure 6 is divided into 32 segments, each of 500 meters.
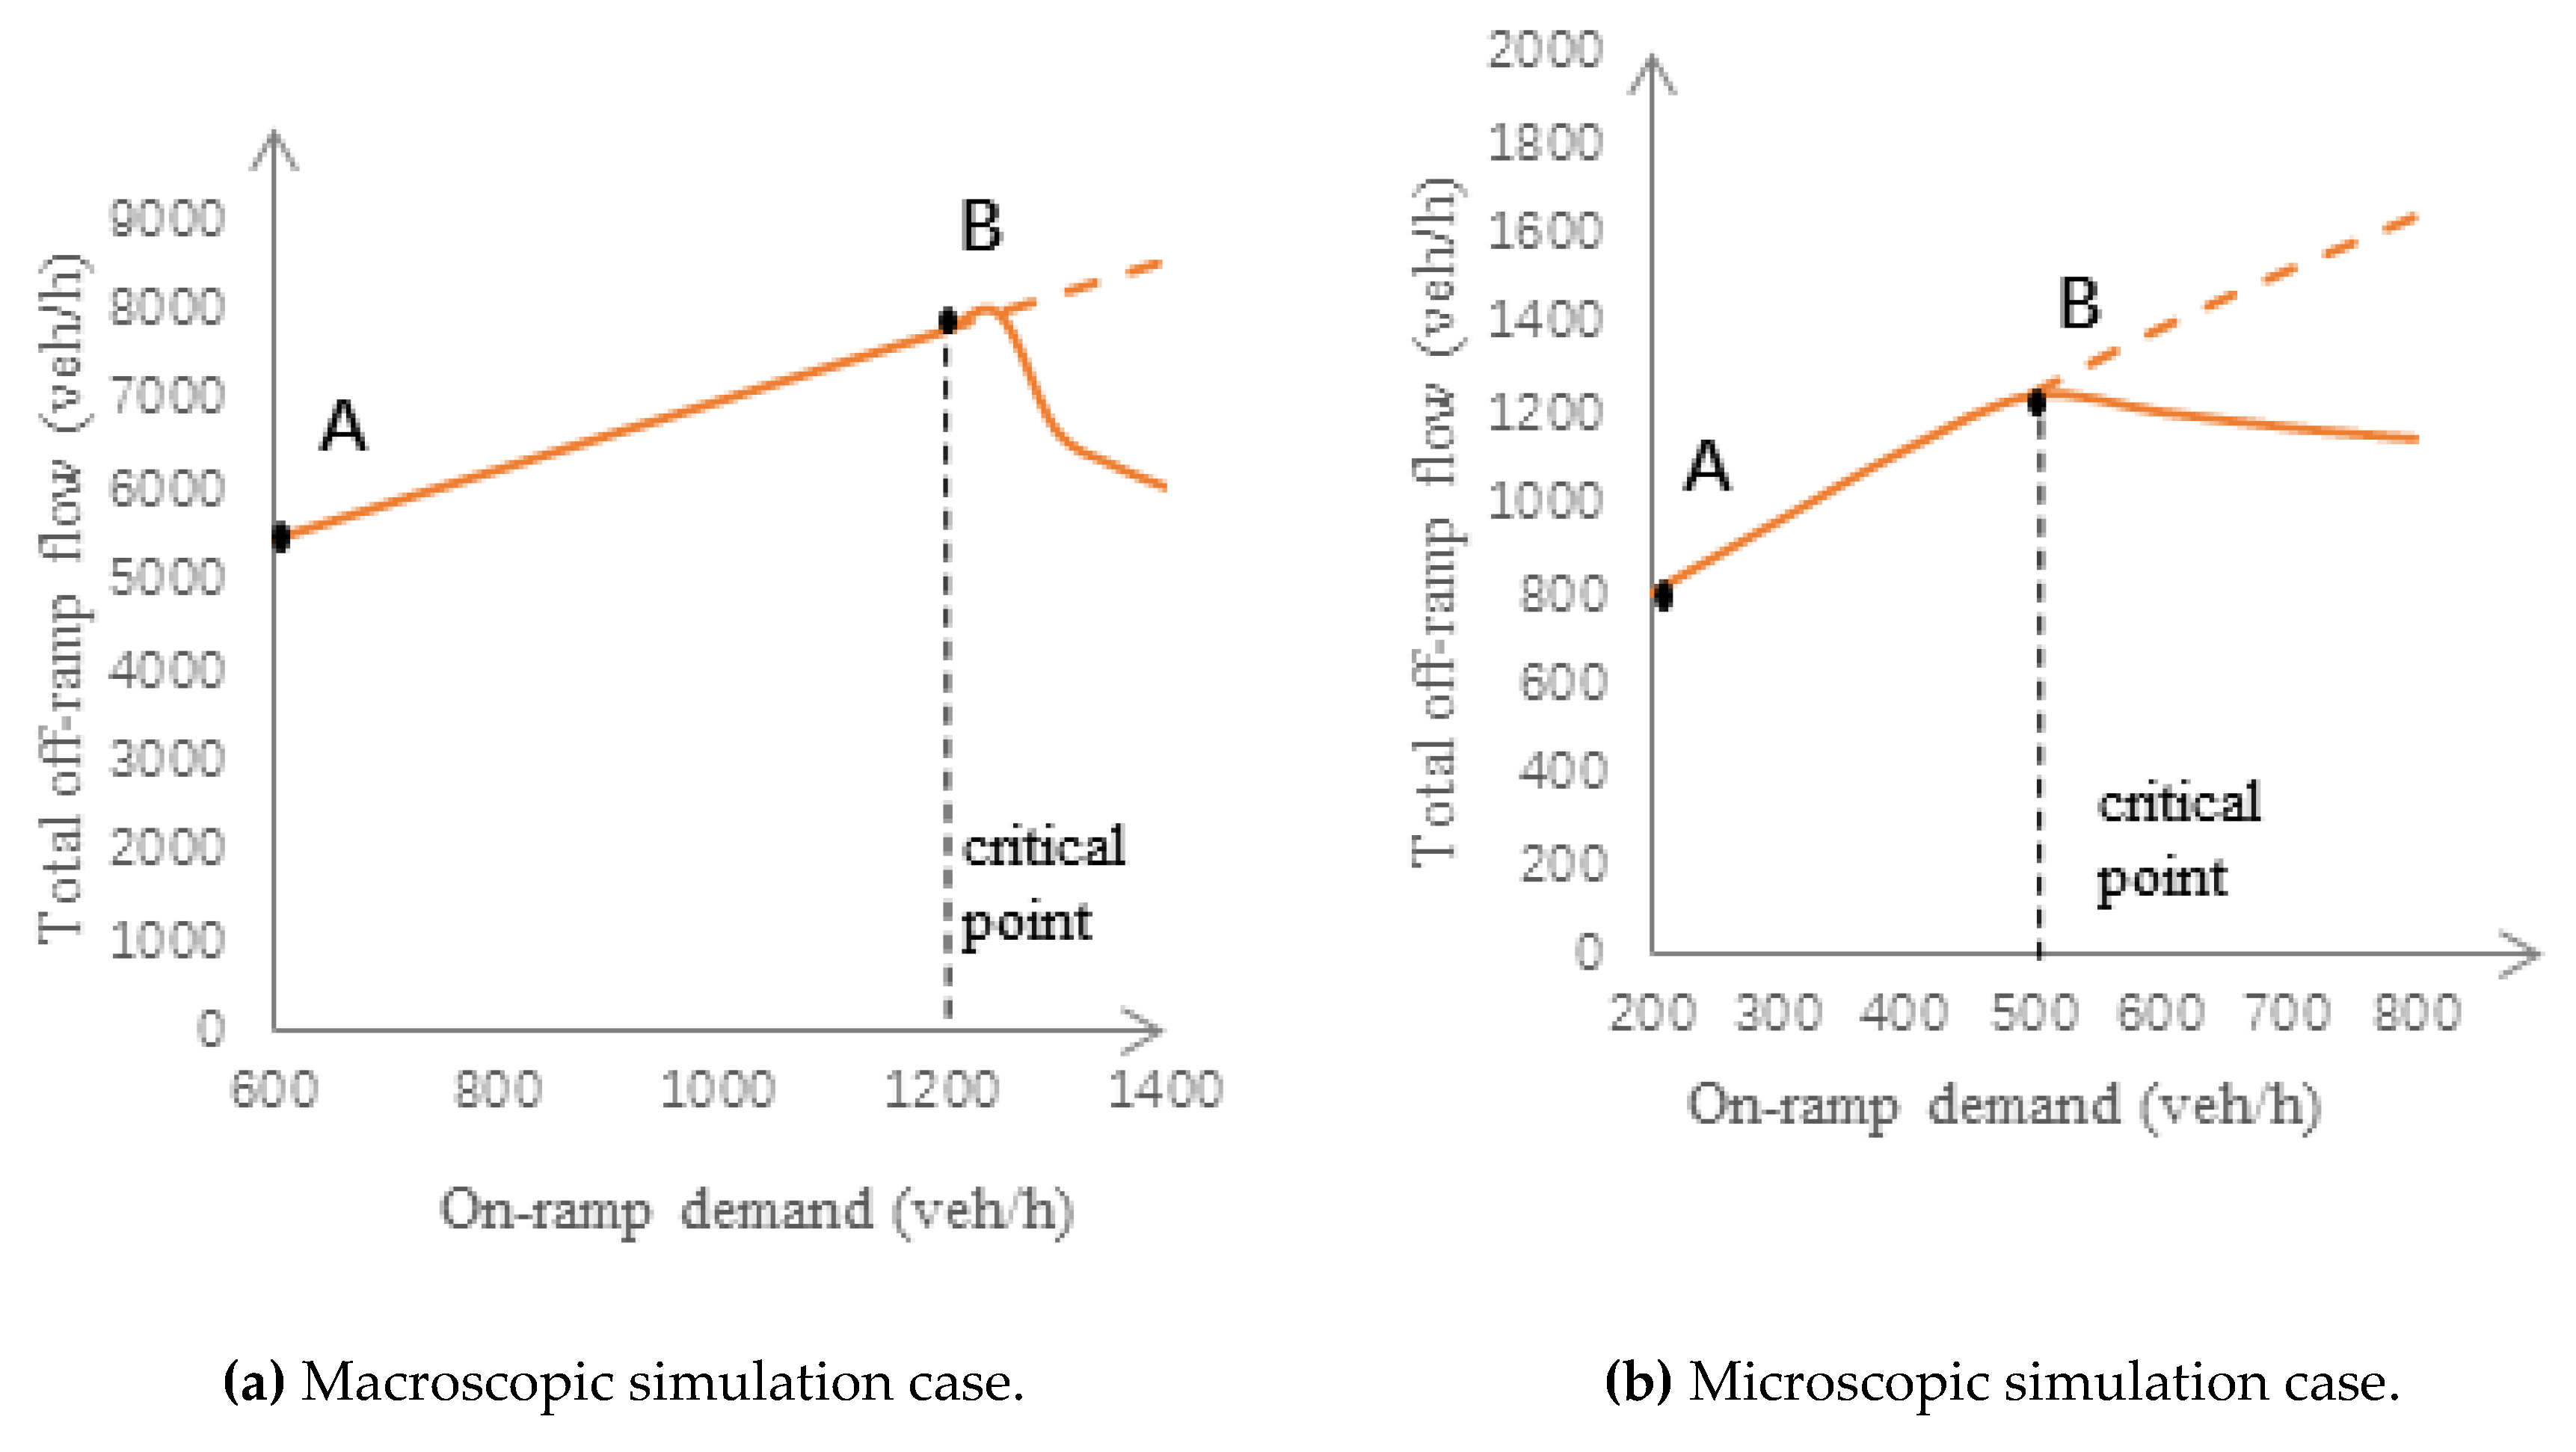
The total off-ramp flows Q1 and Q2 via macroscopic simulation are compared in Figure 9a, where the x-axis refers to all peak ramp-demand values in Figure 8. The solid curve addresses Q2 in the bottleneck case and the dashed line addresses Q1 in the no-bottleneck case. Prior to the critical point displayed, the solid curve and dashed line coincide between points A and B, i.e., Q2 = Q1 before the downstream bottleneck is activated. At the critical point, congestion sets in at the downstream bottleneck and Q2 starts to drop. If the on-ramp demand increases further, Q2 keeps decreasing and gets increasingly smaller than Q1. The corresponding microscopic simulation results are presented in Figure 9b.
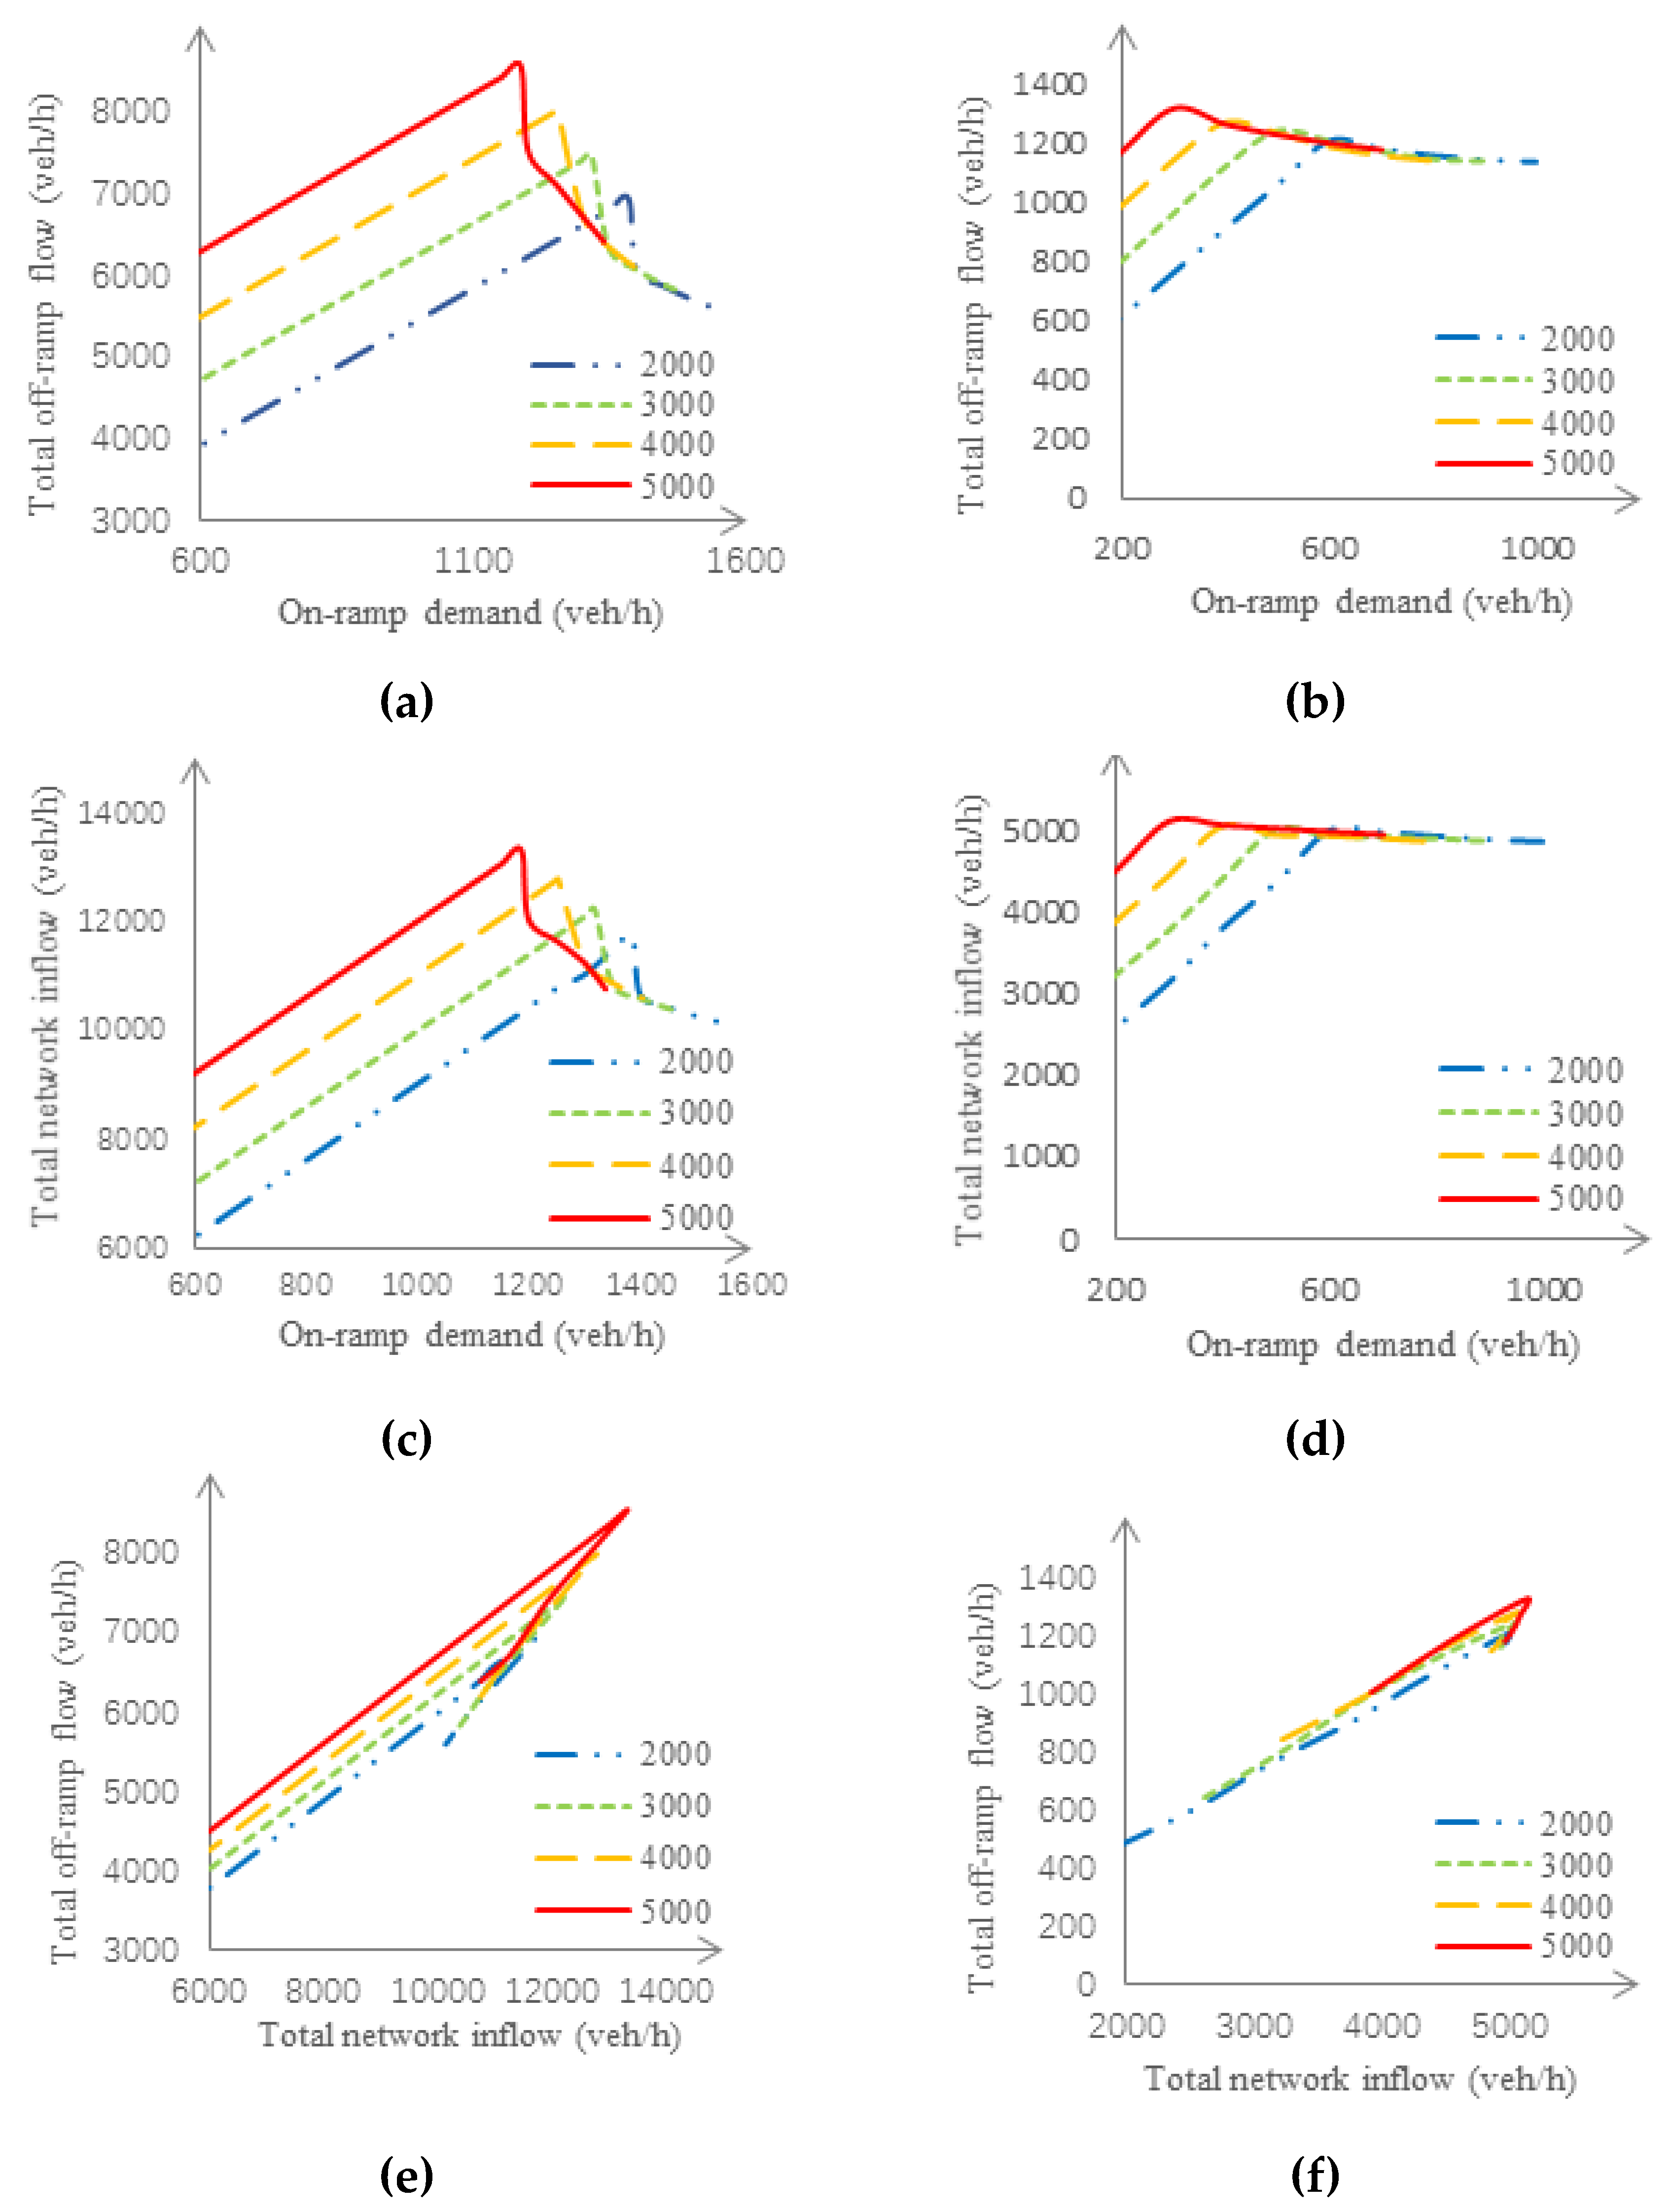
The mainstream demand considered for Figure 9 is given by Figure 7. More results are presented in Figure 10, where the legends address various peak values of the mainstream demand. In particular, the data in Figure 9 are part of Figure 10 (where the peak value of the mainstream demand is 4000 veh/h).
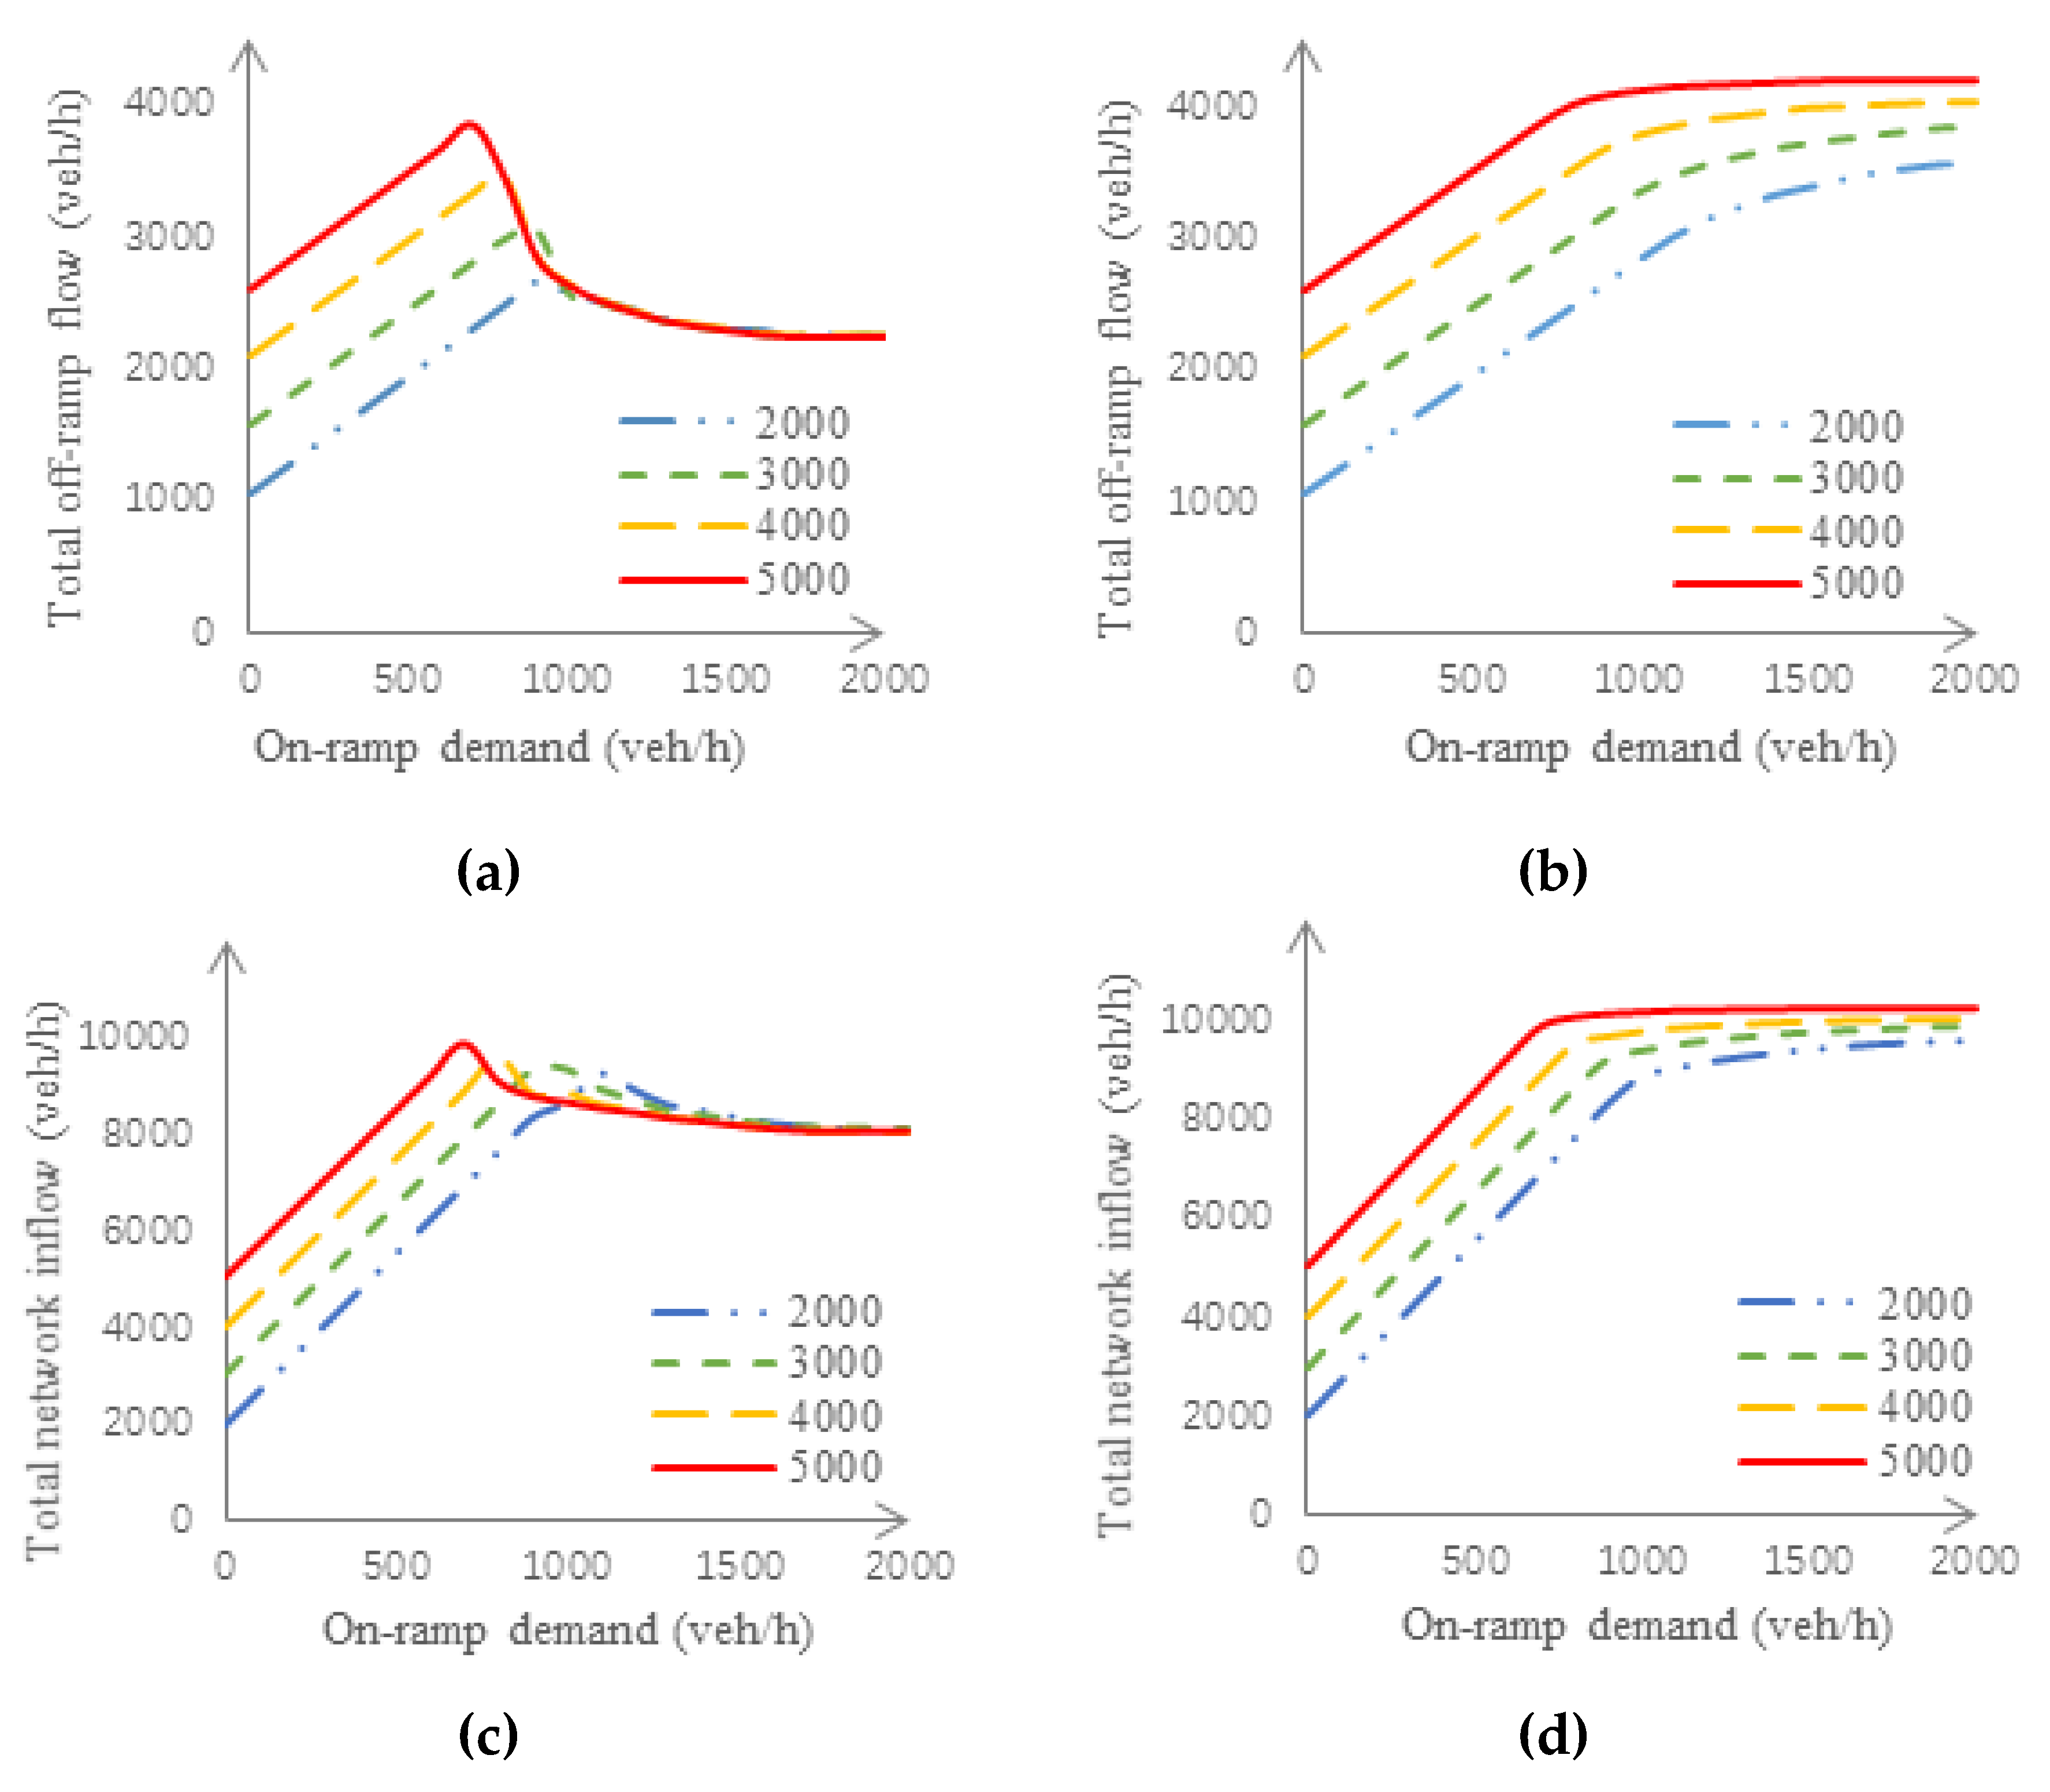
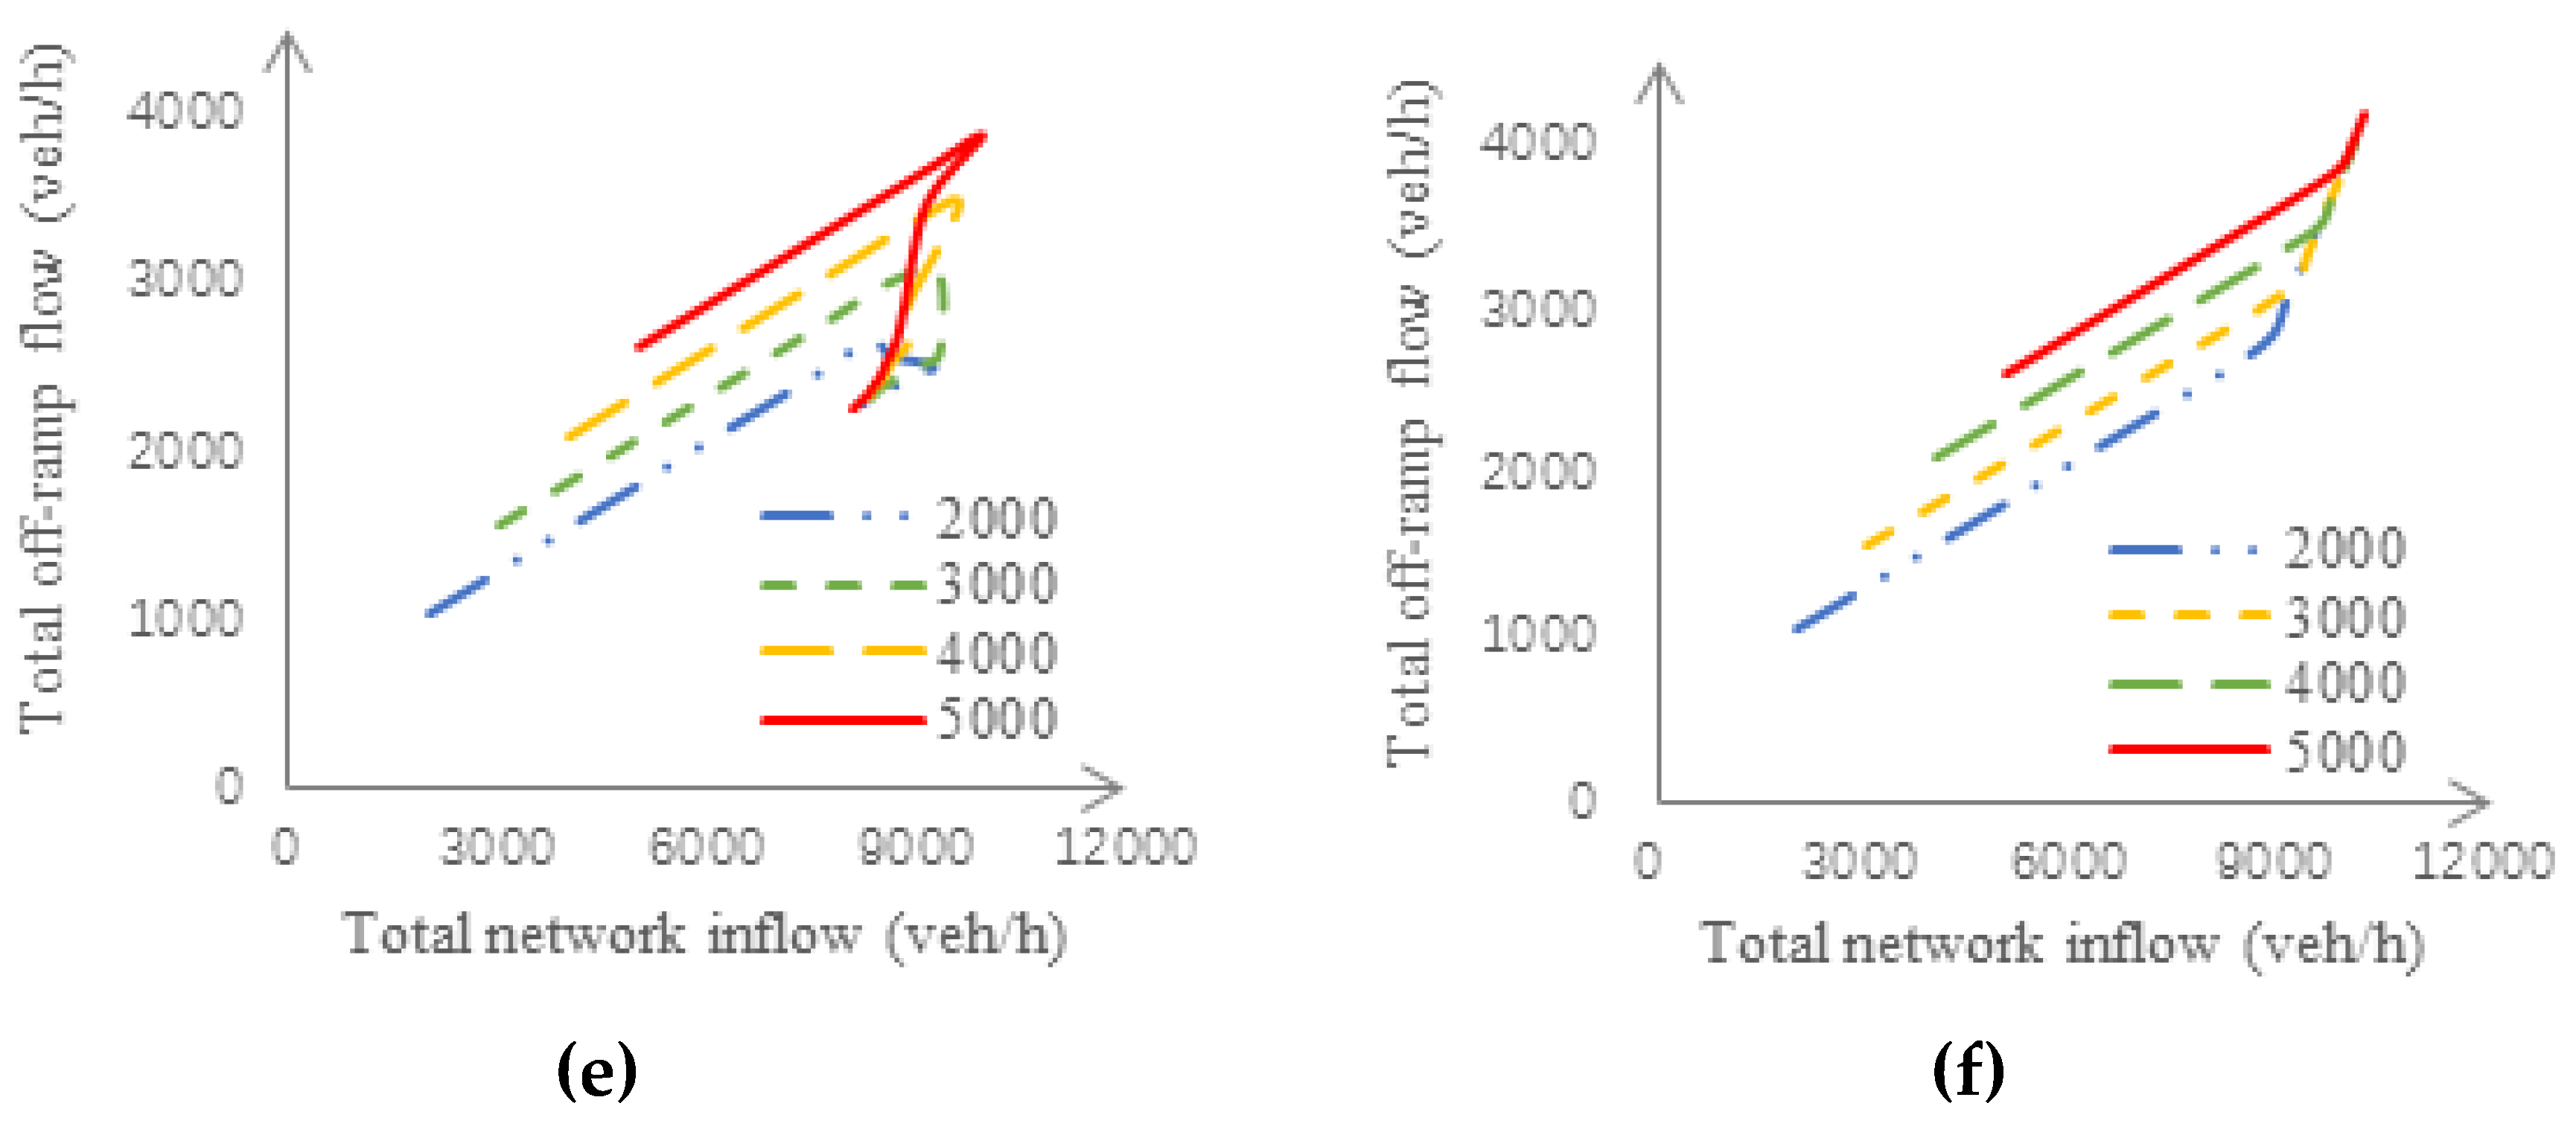
The left and right columns of Figure 10 deliver macroscopic and microscopic results, respectively. The two sub-figures in each line address the same dynamic relation. More specifically, Figure 10a,b present the relation of the total off-ramp flow and on-ramp demand (per on-ramp), Figure 10c,d the relation of the total network inflow (the sum of the mainstream inflow and total on-ramp inflow) and on-ramp demand (per on-ramp), and Figure 10e,f the relation of the total off-ramp flow and total network inflow.
Clearly, given a mainstream demand, when the ramp demand reaches the critical point, congestion arises, and both the total network inflow and total off-ramp flow start to drop. With the ramp demand further increasing, the freeway congestion is getting more serious, and the total network inflow and total off-ramp flow become even smaller. Note that the critical points in either simulation case (e.g., Figure 10a,c,e in the macroscopic case) are consistent. Overall, Figure 10 demonstrates the off-ramp blockage effect in semi-dynamic simulation environments and depicts how the effect gets intensified after congestion sets in.

3.1.2. A Ramp Merging Case

The considered freeway stretch with its segmentation is plotted in Figure 11. The segment capacity is 6000 veh/h. A recurrent bottleneck is caused by overloading at on-ramp O7. The utilized mainstream demand is presented in Figure 12, and a number of on-ramp demand scenarios are presented in Figure 13, assuming equal demands for all on-ramps for each given scenario. Macroscopic simulation tool METANET is employed for the simulation studies [19]. The ramp metering controller ALINEA [28] is applied at on-ramp O7 in the ramp metering case, whereby the density in the ramp-merging area is stabilized at the critical density and the flow there is kept at the capacity flow level.
The relation between the total off-ramp flow and on-ramp demand is presented in Figure 14 for both the no-ramp-metering case and ramp-metering case. Before the ramp demands reach a critical value, ramp metering is not activated, and there is no difference between the two cases, i.e., both figures fully coincide between points A and B. The total off-ramp flow keeps dropping after the critical point without ramp metering, while this is avoided with ramp metering. This means that appropriate ramp metering manages to prevent ramp merging congestion from being triggered so as to avoid the occurrence of off-ramp blockage. With multiple mainstream demand values considered, more results are produced in Figure 15, where the left/right columns address the results of no ramp metering/ramp metering, and the legends refer to the mainstream demand values. In fact, the data in Figure 14a,b are part of Figure 15a,b, where the mainstream demand is equal to 5000 veh/h.
The comparability of the left column in Figure 15 (ramp-merging bottleneck, macroscopic simulation) and Figure 10 (accident-induced bottleneck, macroscopic and microscopic simulation) demonstrates the off-ramp blockage effect discussed in Section 2. With ramp metering, the total off-ramp flow and total network inflow in Figure 15b,d tend to be steady with the increase of the on-ramp demand. This results from appropriate ramp metering at O7. Also, it is noteworthy in Figure 15e,f that the strikingly negative relationship in the case of no ramp metering after the critical point is completely reversed by ramp metering. The above results are consistent to what was claimed by [14] that is, if a traffic control measure facilitates the increase of the total network exit flow, it serves to attenuate network traffic congestion and is hence beneficial for the whole motorist population.

3.2. Sensitivity Studies

Corresponding to Section 2.4, it is important to check if the simulation results concerning off-ramp blockage would be sensitive to demands, off-ramp exiting rates, and OD rates. First, it is already depicted in Figure 10 and Figure 15 that the sensitivity to traffic demands is not much.
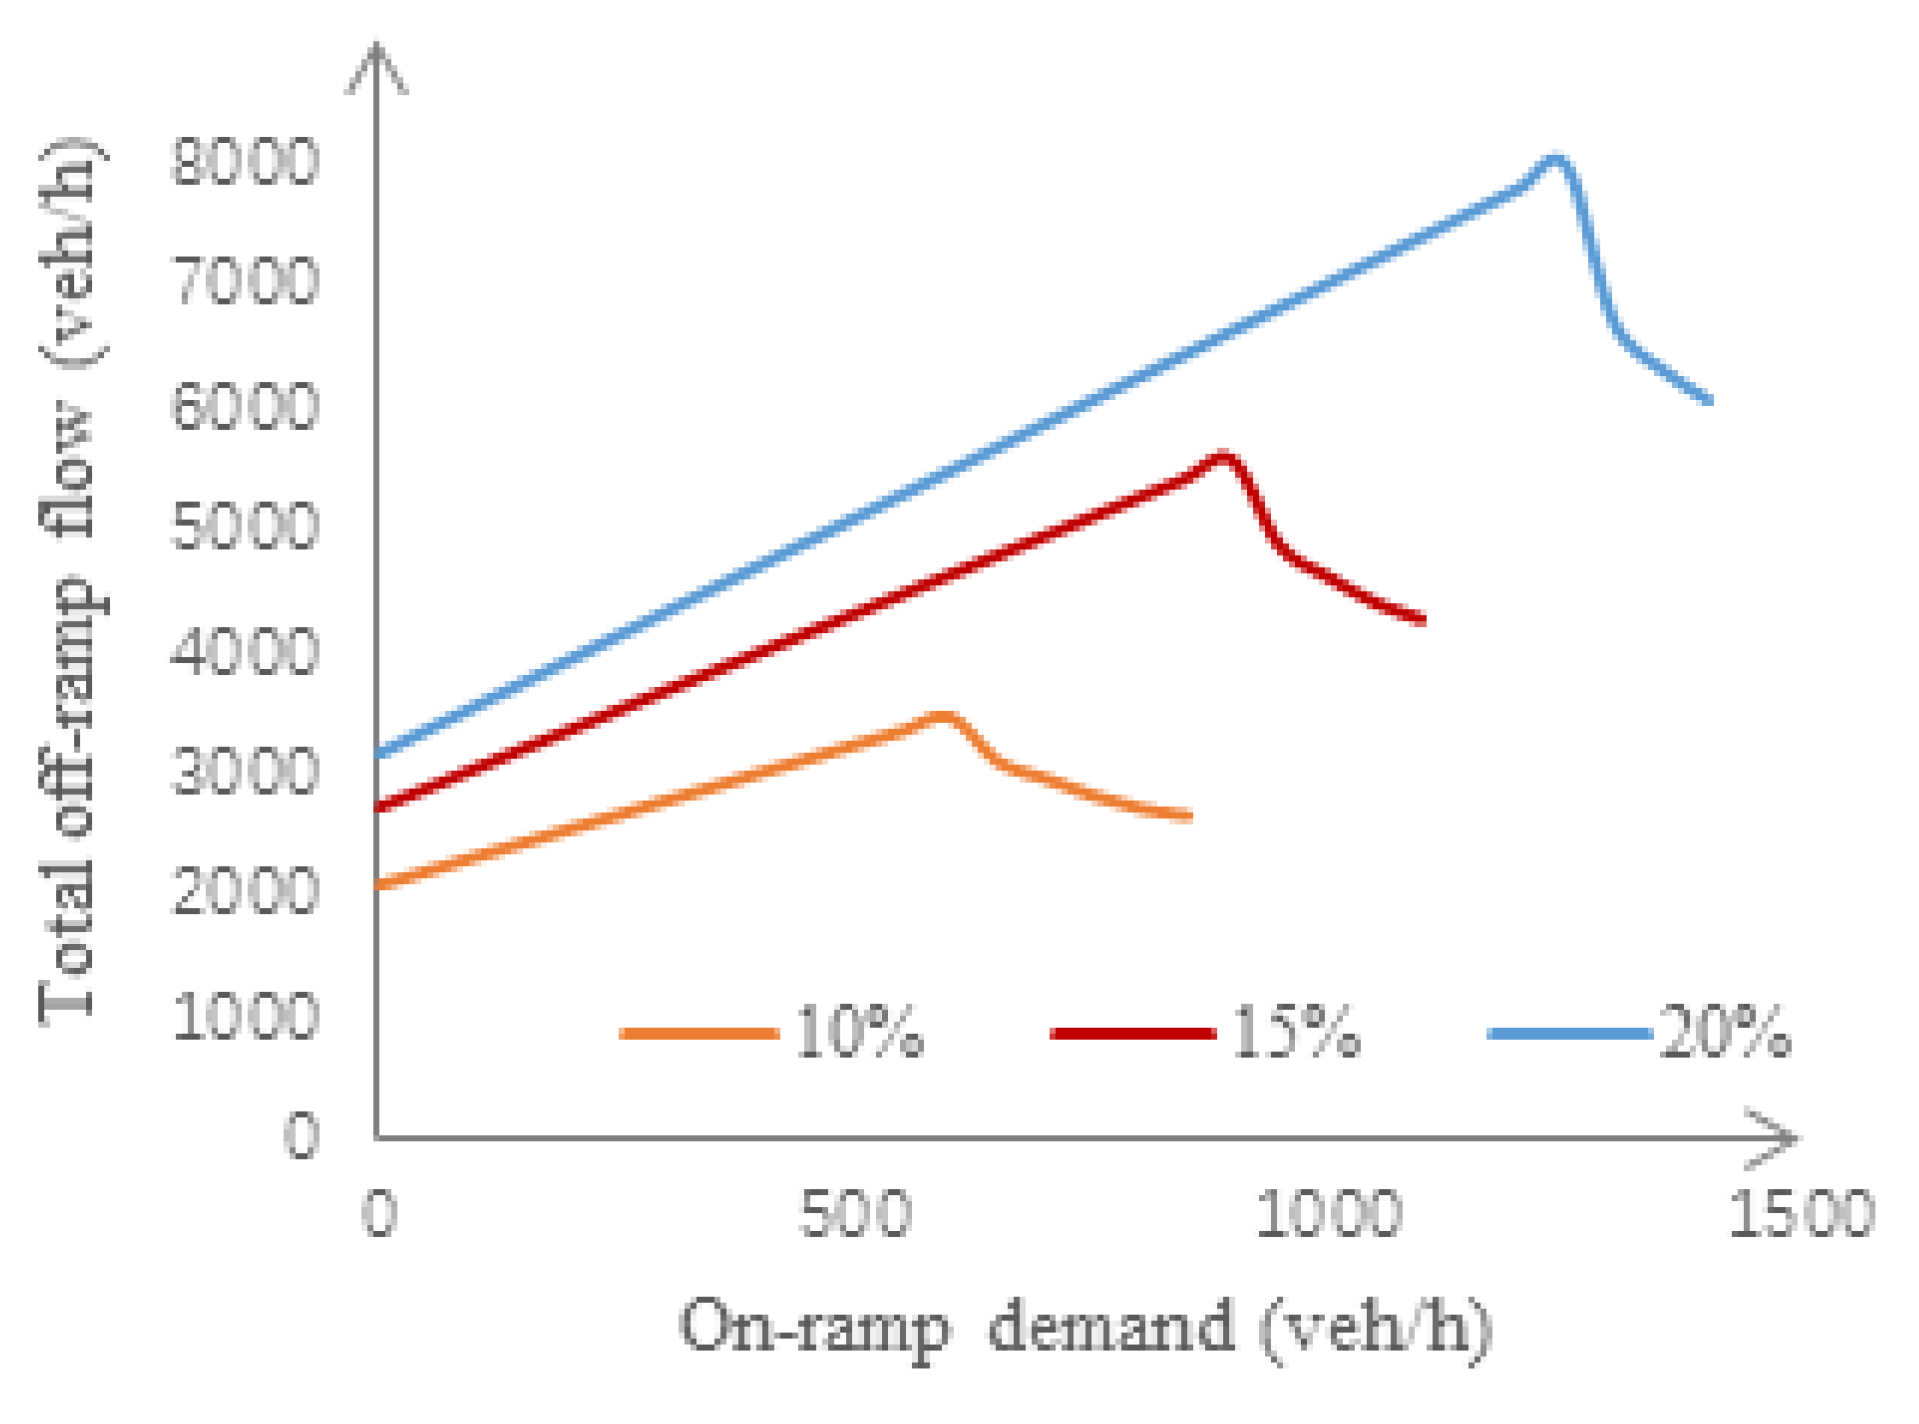
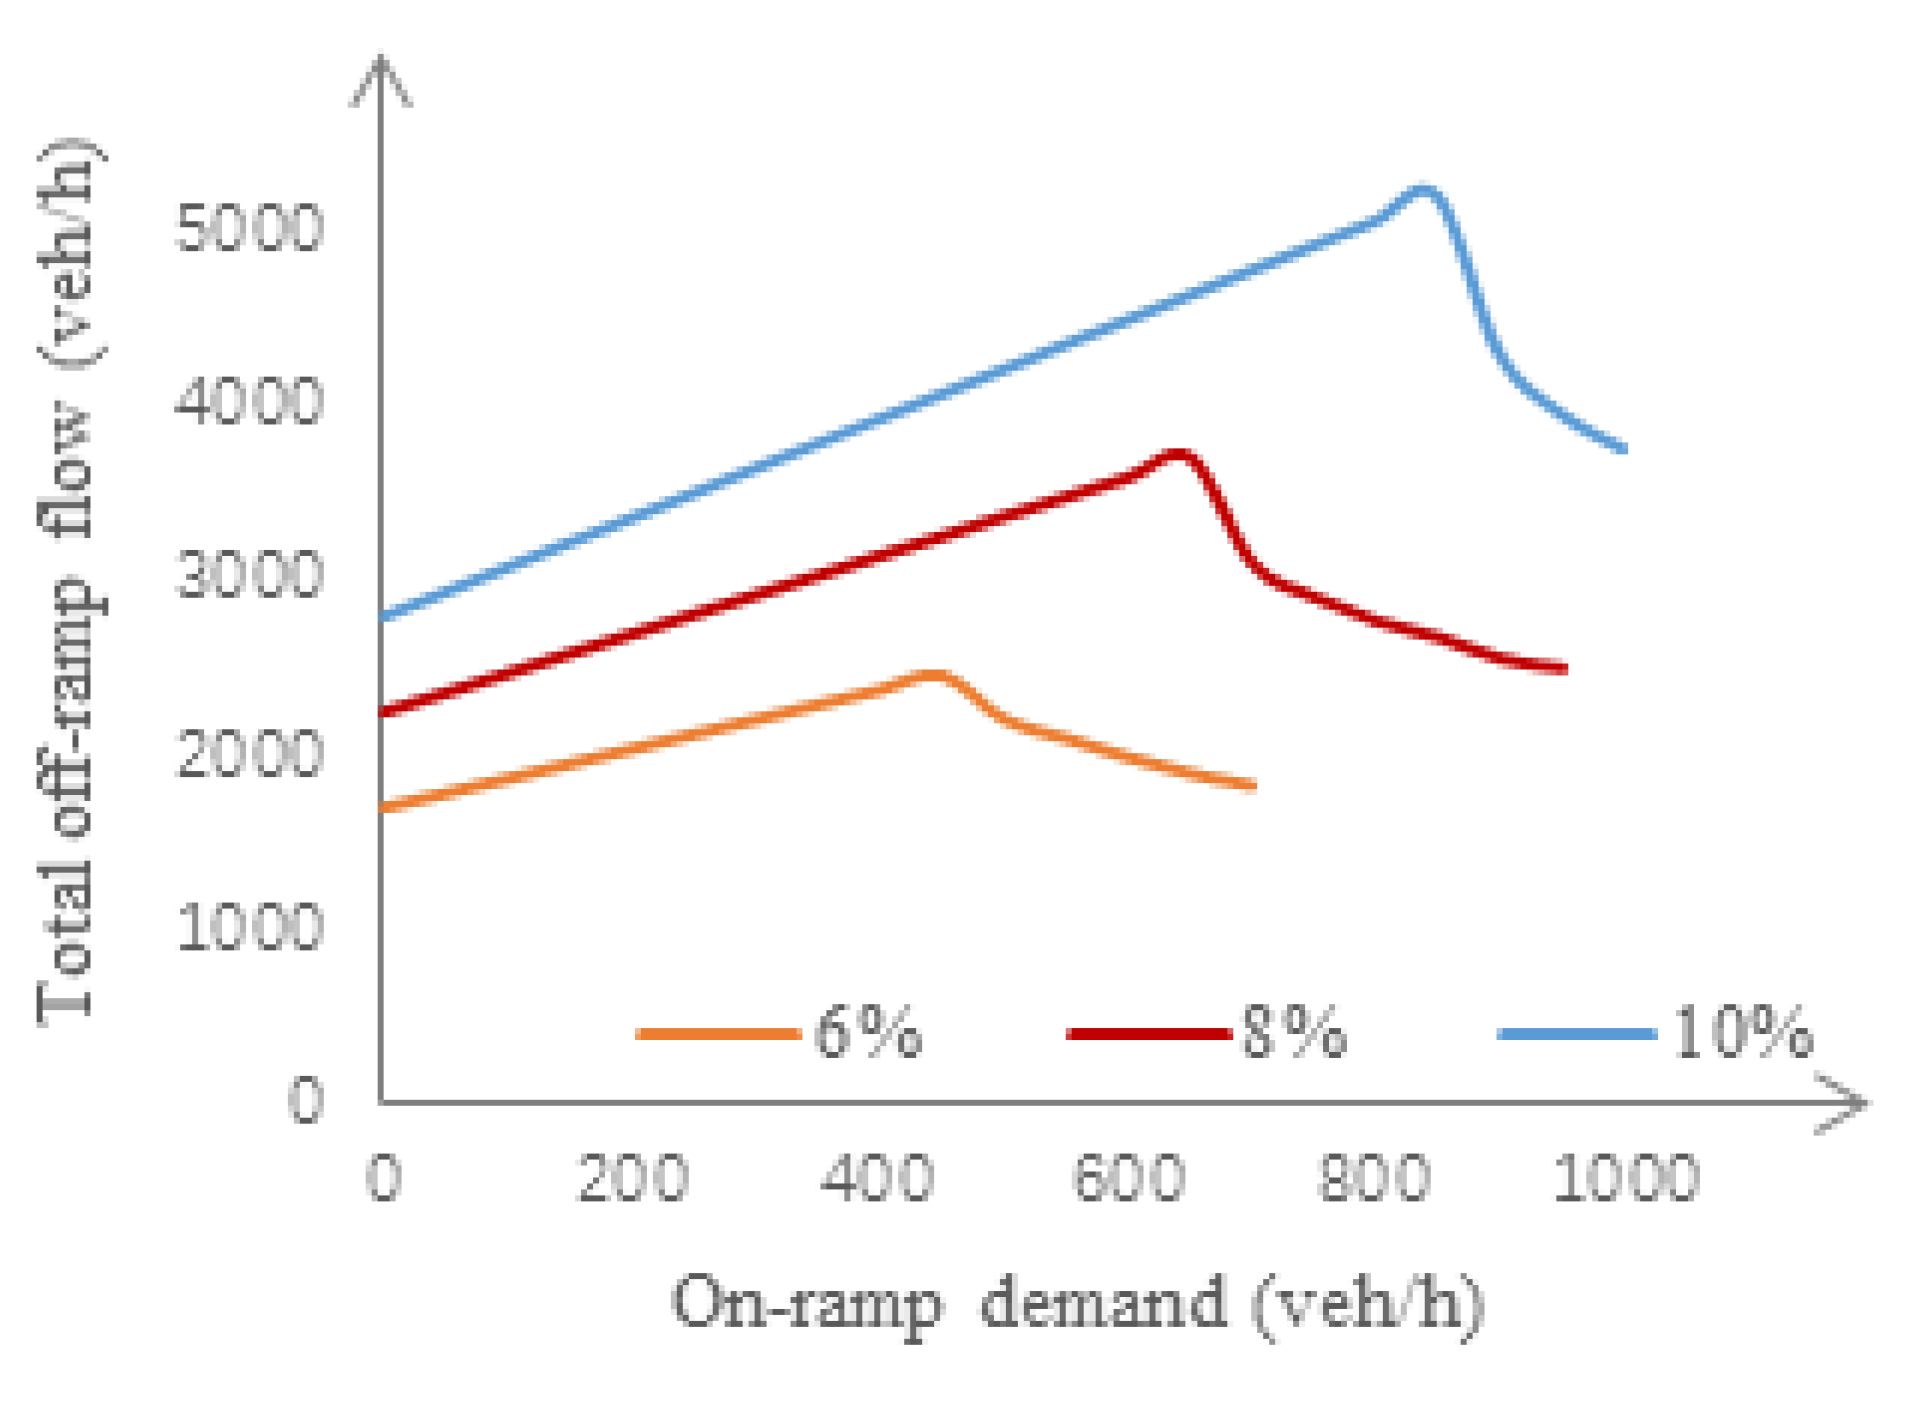
Second, only constant OD rates and exiting rates have been considered so far. Given the mainstream demand of 4000 veh/h, the impacts of exiting rates and OD rates are presented in Figure 16 and Figure 17 in macroscopic simulation for the accident-induced bottleneck case. Clearly, the specific exiting rates and OD rates do not alter the fact that off-ramp blockage takes place whenever some basic conditions are met. It is natural that the higher the exiting or OD rates, the later the off-ramp blockage arises. It is seen in Figure 17 and Figure 18 that different ranges of on-ramp demands are considered for different exiting rate and OD rate. This is because different feasible sets of on-ramp demands apply to different exiting or OD rates so as to guarantee that congestion always first arises at the downstream bottleneck. Similar results are obtained in the ramp-merging congestion case, and the corresponding figures are omitted.

3.3. Macroscopic Fundamental Diagrams

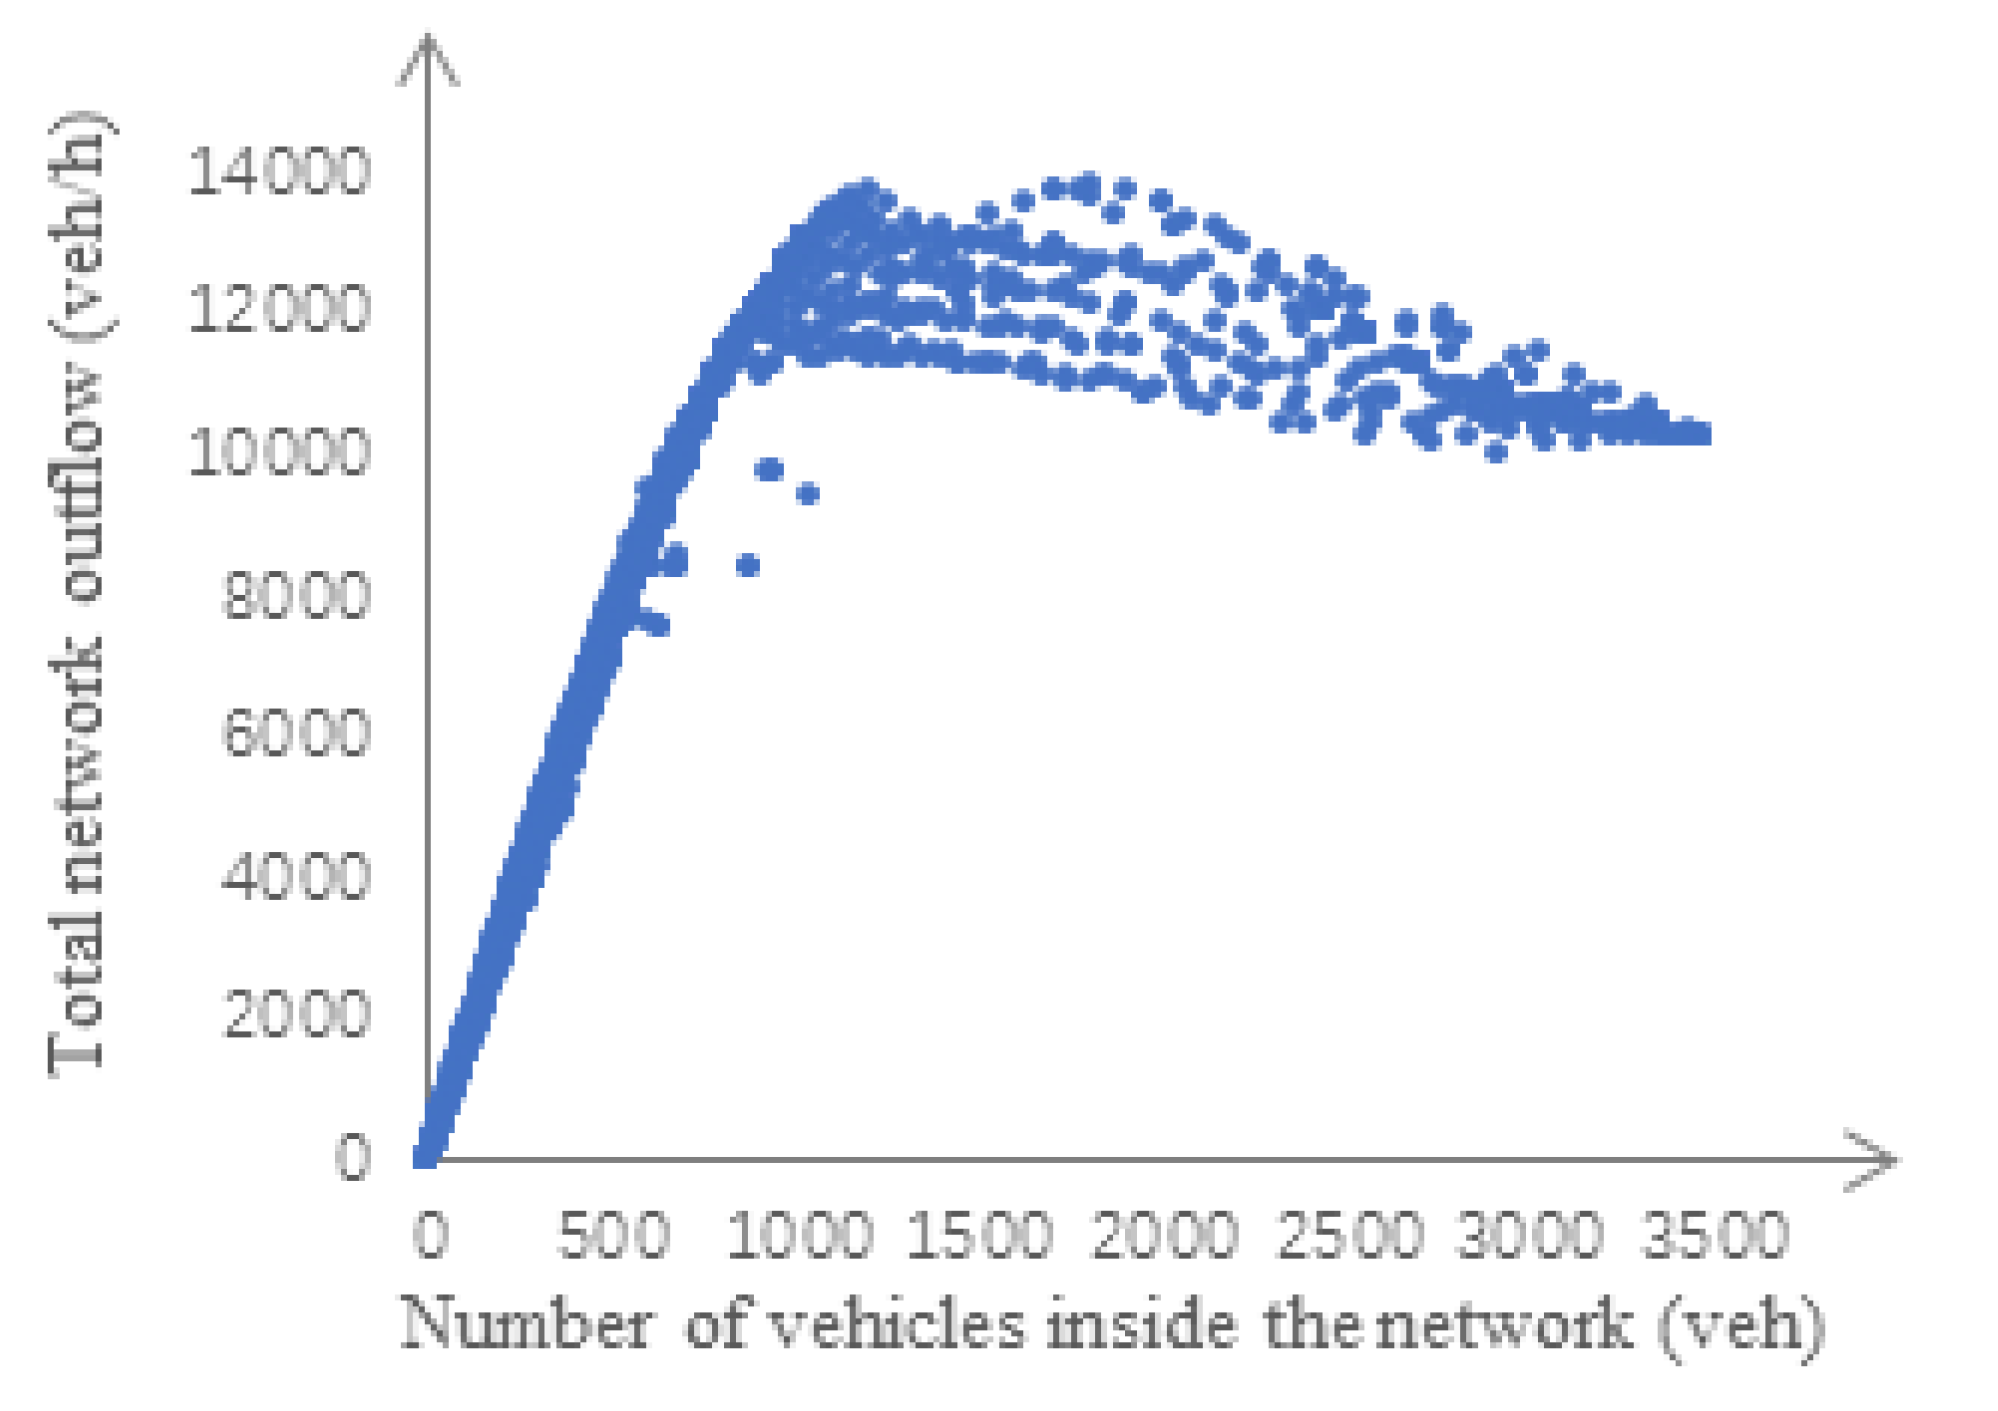
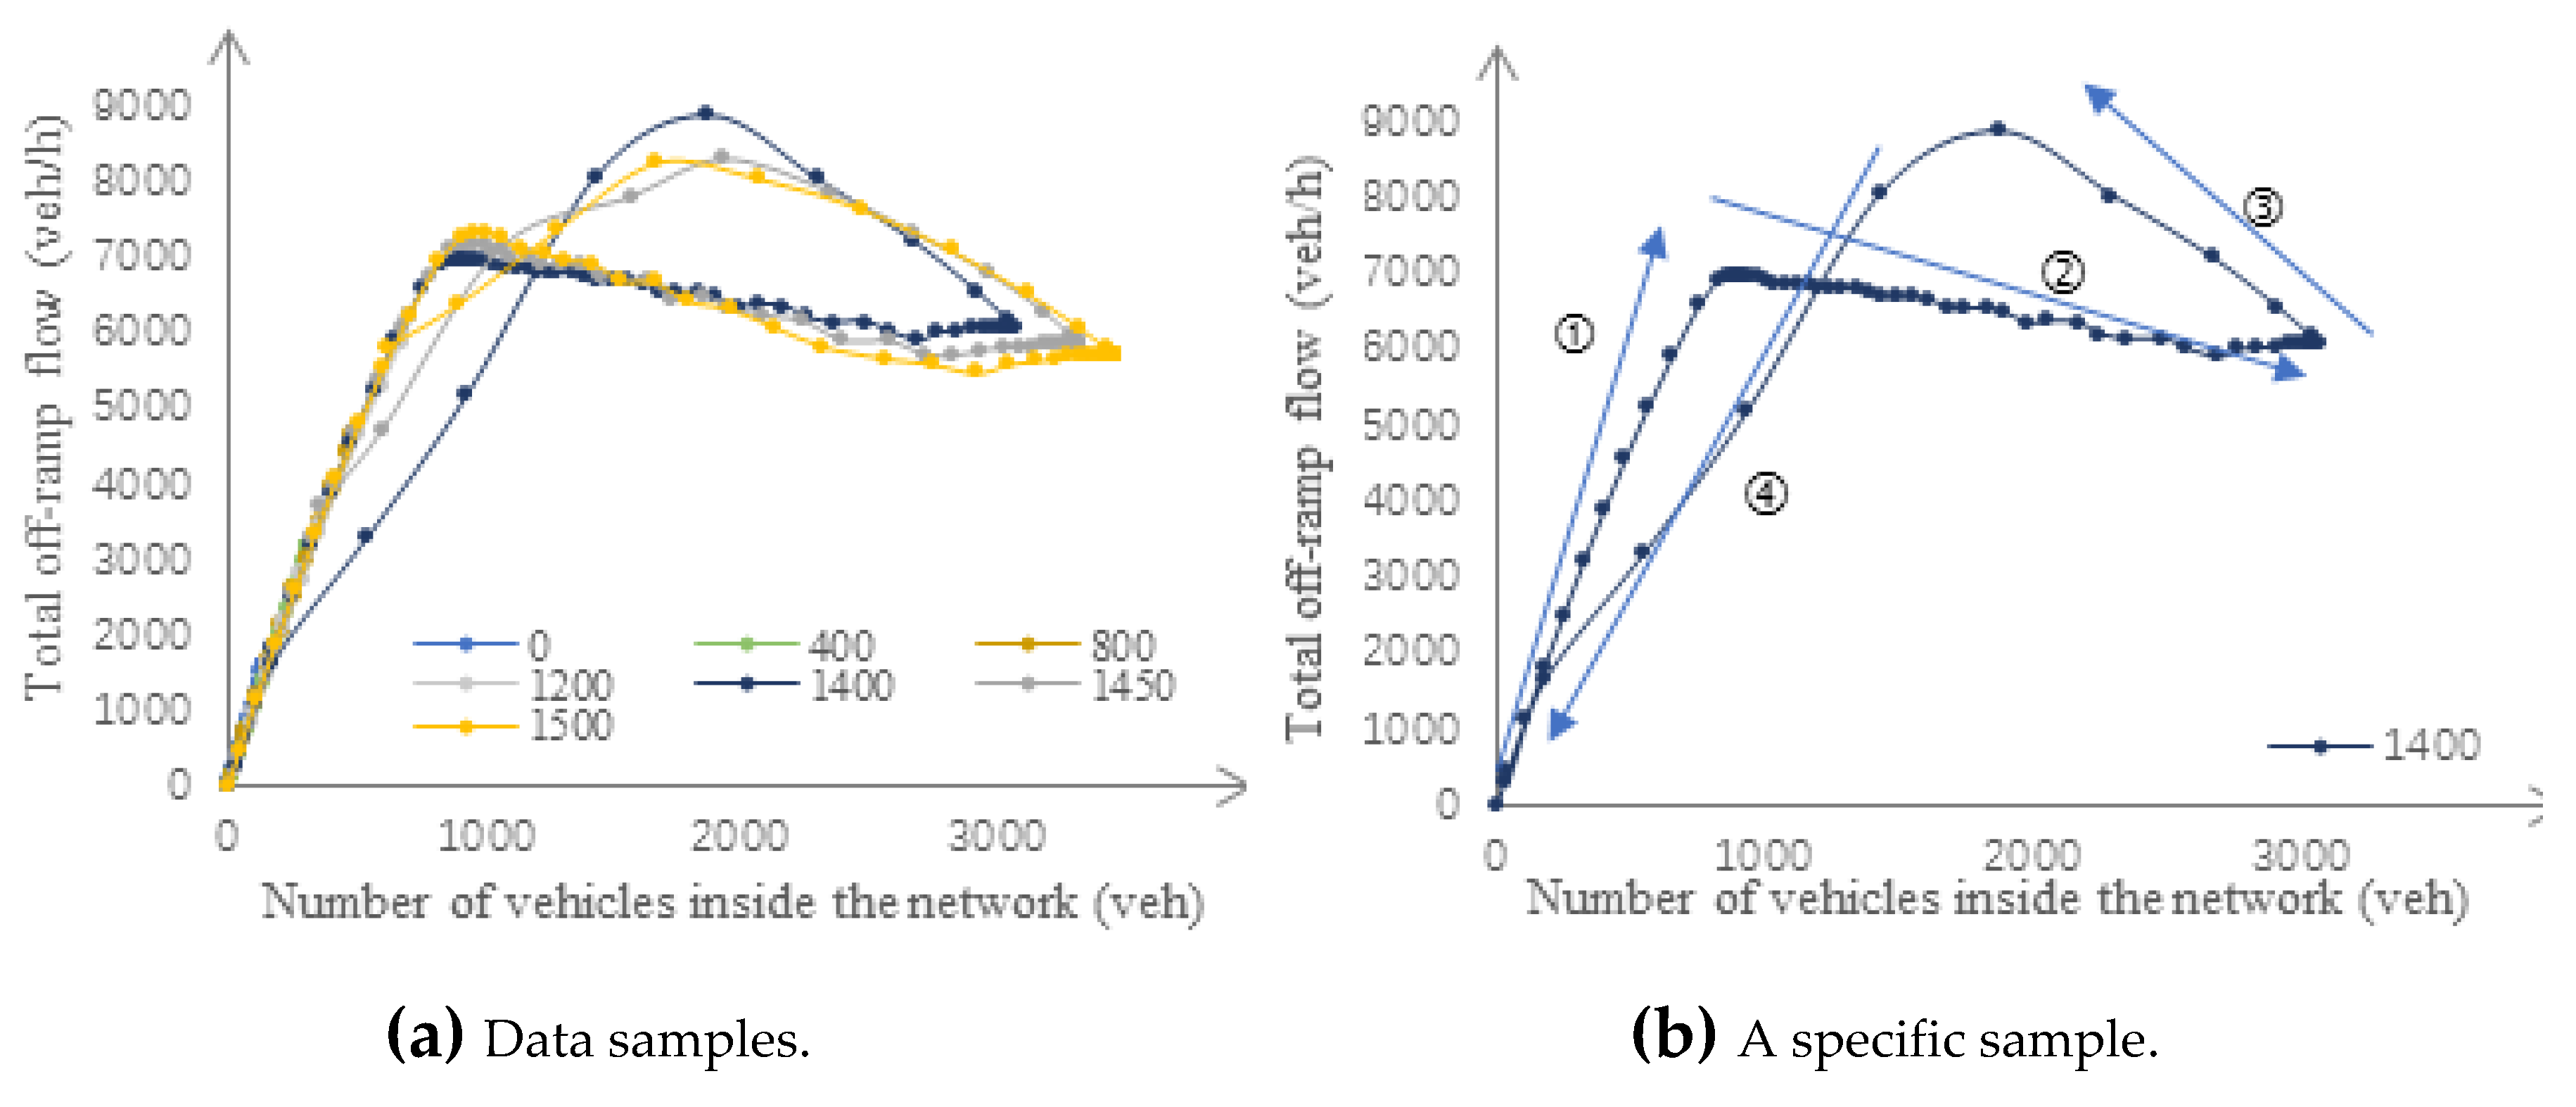
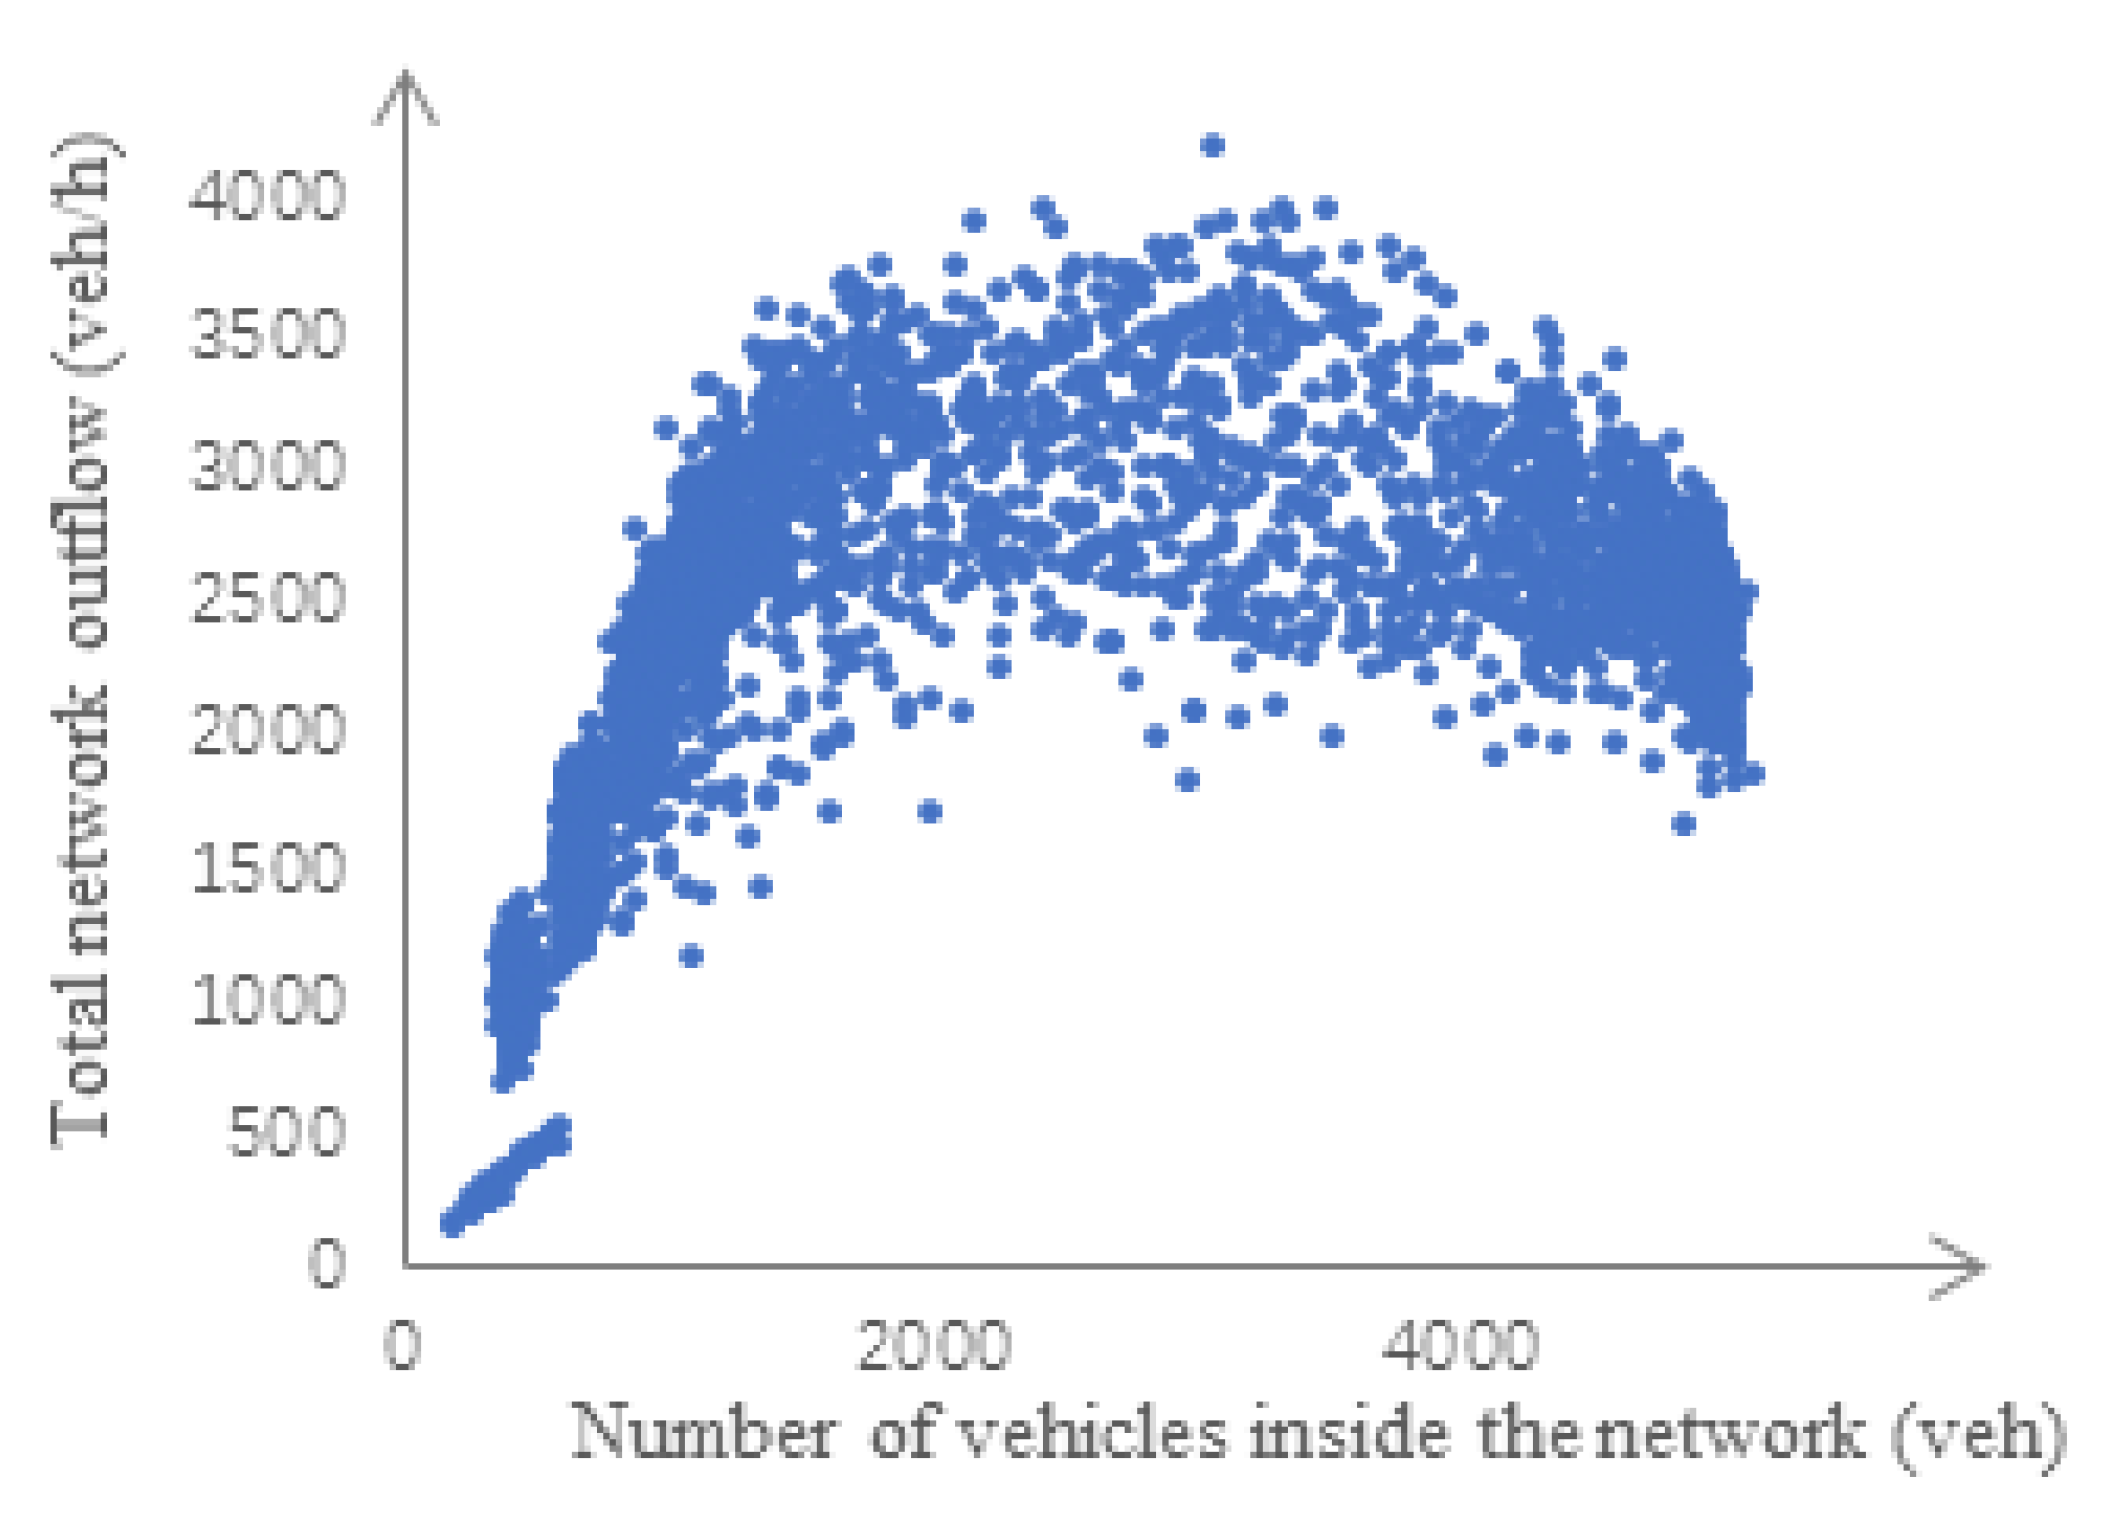
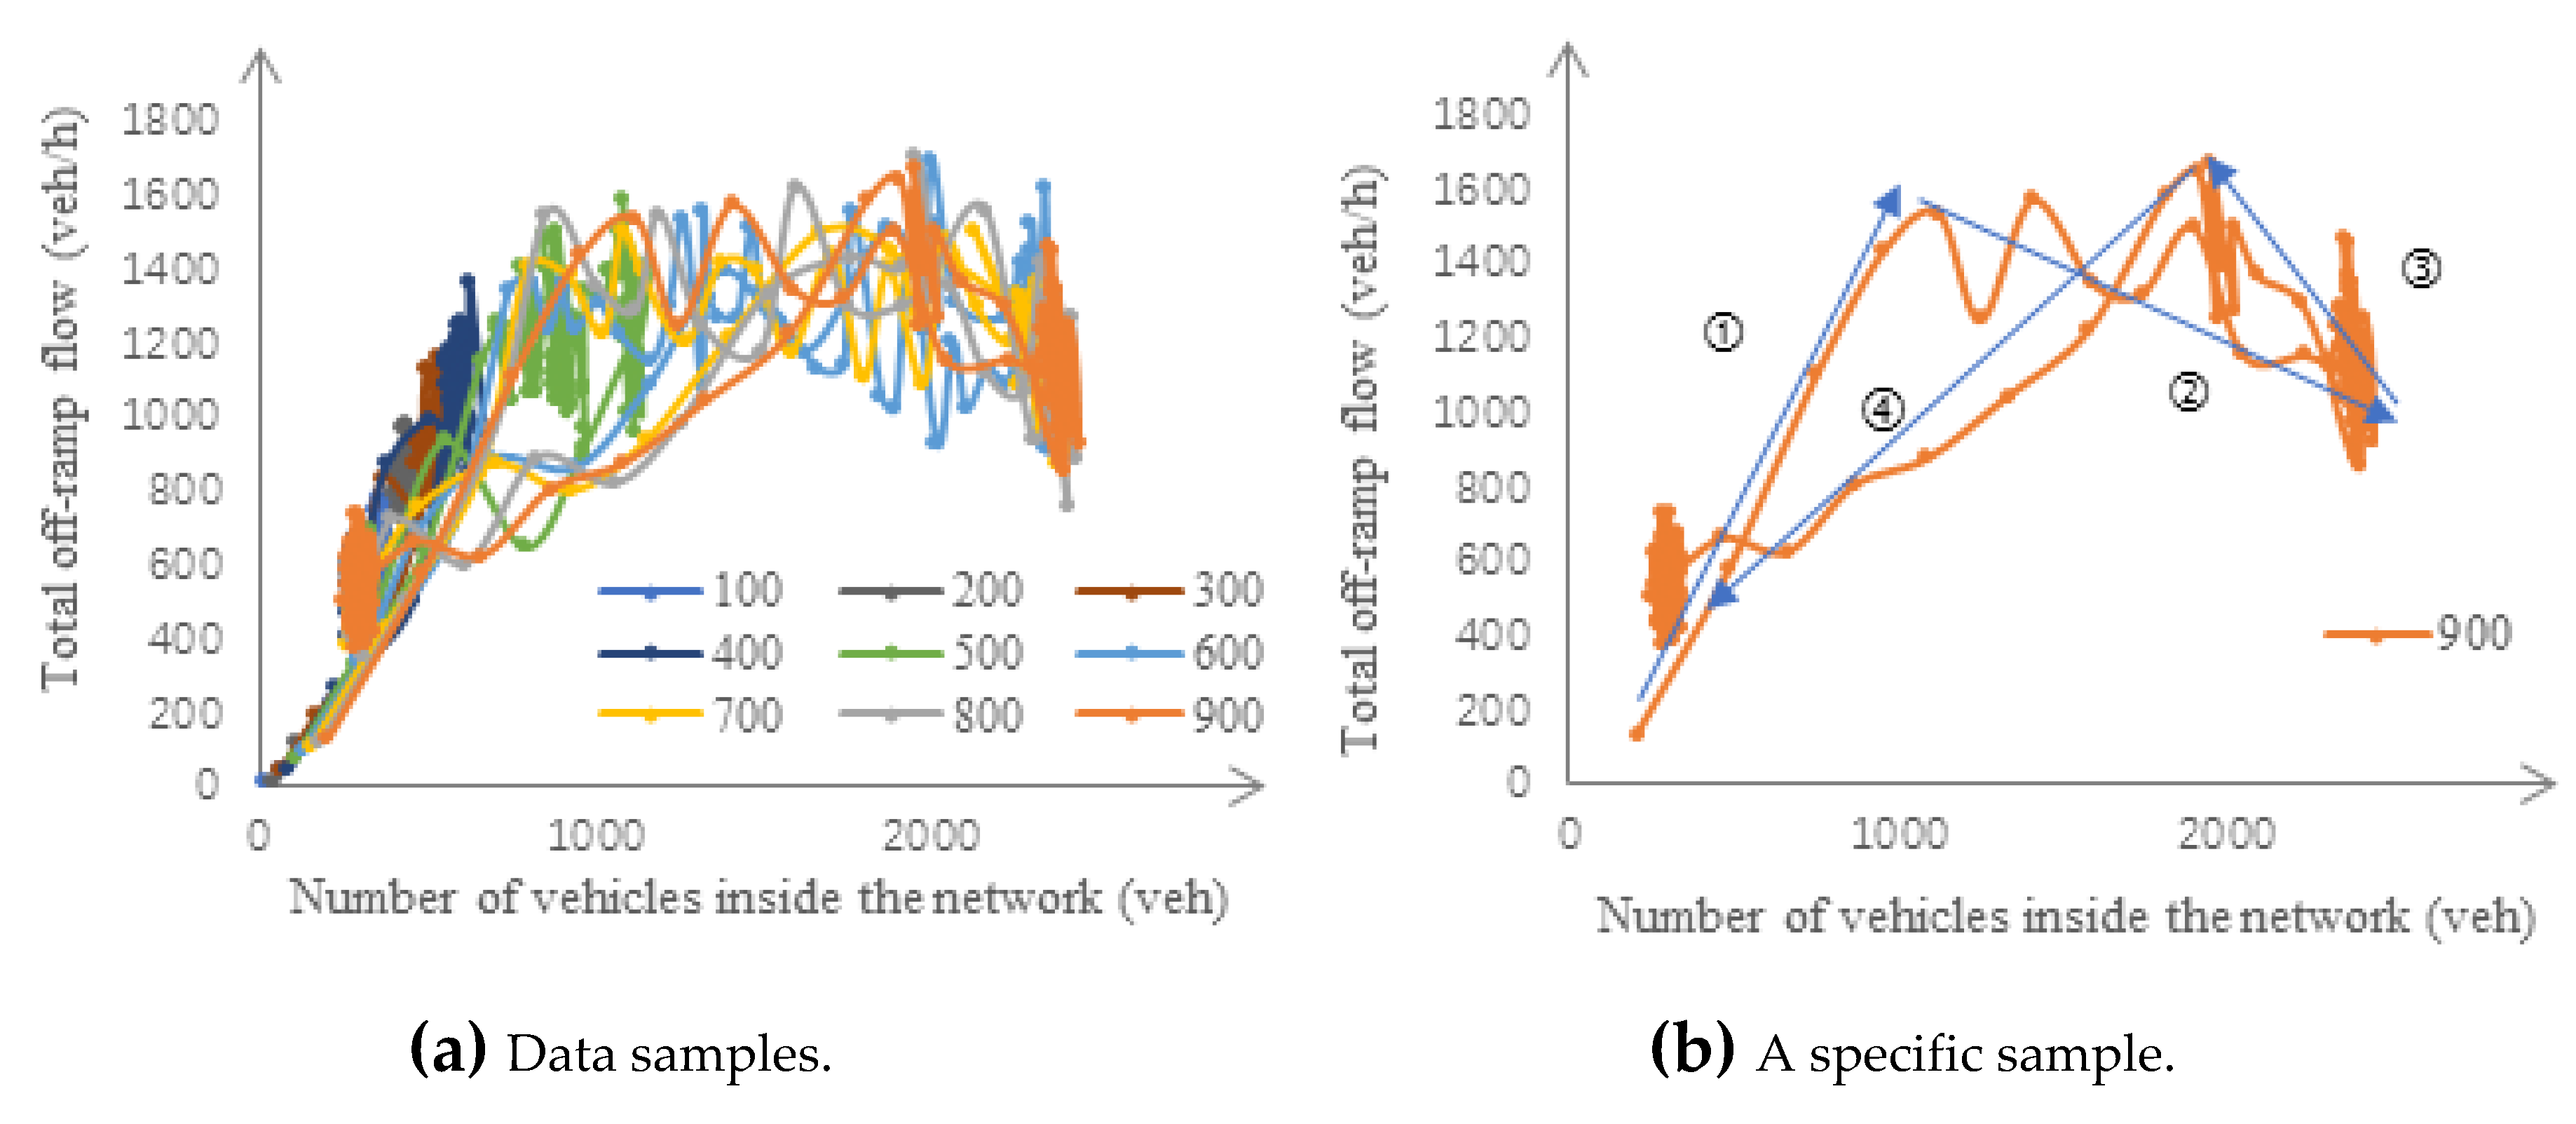
The idea of applying macroscopic fundamental diagrams (MFDs) to address the overall traffic conditions of a road network was conceived a long time ago, but only in recent years has some strong evidence for implementing MFD in urban networks been found. To further illustrate the off-ramp blockage effect, MFDs in the accident-induced bottleneck case are plotted in Figure 18 using macroscopic simulation data, where the x-axis addresses the total number of vehicles within the freeway stretch and the y-axis the total outflow of the freeway stretch (the sum of the total off-ramp flow and the mainstream exit flow). The data points are created using all available demands. A sample of Figure 18 with an upstream demand equal to 4000 veh/h is displayed in Figure 19a, where legends refer to the on-ramp demands. To highlight the off-ramp blockage effect, the y-axis of Figure 19a addresses only the total off-ramp flow, and a sample of Figure 19a is displayed in Figure 19b, showing that traffic state transition has four phases: ① before congestion sets in; ② after congestion sets in; ③ when congestion is dissolving with decreasing demands; ④ when congestion is dissolved. The total off-ramp flow keeps decreasing after congestion sets in until the total demand drop substantially. Note in particular that the total off-ramp flow in phase ③ clearly gets higher than that in phase ②. This demonstrates the off-ramp blockage effect from another point of view. Figure 20 and Figure 21 present the corresponding results based on microscopic simulation, with similar conclusions reached.

4. Conclusions

This paper addresses off-ramp blockage on freeways, a traffic phenomenon that was empirically known but lacked in-depth analytical studies. This paper reports on the theoretical exploration of the mechanism of off-ramp blockage along with comprehensive simulation evaluation. The following conclusions have been obtained regarding shockwave propagation and off-ramp blockage:
(1)
Provided that on-ramp inflows and off-ramp exiting rates do not change under congestion, the shockwave keeps spilling back if and only if it arises at the downstream bottleneck as shown in Figure 3 (Lemma 2 and Corollary 1).
(2)
Considering that on-ramp inflows may drop and off-ramp exiting rates may increase under congestion, the shockwave keeps propagating upstream only if some additional conditions are satisfied (Theorem 1).
(3)
In consideration of the same condition as (2), the occurrence of off-ramp blockage depends on a special condition (Theorem 2).
(4)
On top of (3), assuming that off-ramp exiting rates do not change under congestion, then off-ramp blockages happens unconditionally (Corollary 3).
Finally, via traffic simulation, some general relations between the total demand, total network inflow, total off-ramp flow, and the number of vehicles within a freeway system are demonstrated, which are consistent with the theoretical results.
Due to the complexity involved with mathematical modelling, a static and algebraic approach based on the first-order LWR model is applied for this work, which may not capture all dynamic details of traffic flow behavior. In addition, only a linear highway with a number of on/off-ramp pairs is considered for this work, and more efforts may be needed for the extension of the results to a freeway network case. Lastly, although the paper considers that for a freeway stretch under severe and lasting congestion, on-ramp demands may drop and off-ramp turning rates may increase, the paper assumes that the demands and turning rates do not change upstream of any shockwave front. This may not fully reflect the reality, and especially in the connected vehicle era, vehicles upstream of an activated bottleneck can learn what will be happening far earlier than “hitting” the queue tail, and some of these vehicles may choose other routes and consequently affect the upcoming demands and turning rates.

Author Contributions

Conceptualization, J.G. and Y.W.; methodology, J.G., X.C., Y.P. and Y.W.; software, Y.P., X.C. and J.G.; validation, J.G., X.C., Y.P. and Y.W.; writing—original draft preparation, Y.W.; writing—review and editing, J.G. and P.Z.; supervision, Y.W.; funding acquisition, Y.W., J.G. and P.Z. The first three authors contributed to this work equally.

Funding

This research was funded by the National Key Research and Development Program of China, grant number 2018YFB1600500; 2017YFE9134700, the National Natural Science Foundation of China, grant number 71771200, the Opening Foundation of Key Laboratory of Road and Traffic Engineering of the Ministry of Education, and the Pujiang Program of Shanghai.

Acknowledgments

This research was inspired by Markos Papageorgiou’s works. Section 2.4 of this paper was added with reference to suggestions given by Hillel Bar-Gera at Ben-Gurion University of the Negev, Israel and Felipe Augusto de Souza at Argonne National Laboratory, USA.

Conflicts of Interest

The authors declare no conflict of interest.

Appendix A

Based on the LWR theory, as long as flow on the congestion-free side of the shockwave remains greater than that on the congestion side, the shockwave keeps propagating upstream. In this proof, this is referred to as the Basic Condition of Shockwave Propagation (BCSP). Lemma 2 is proved in three steps using mathematical induction based on Figure 3, with the focus on the satisfaction of BCSP continuously backward along the stretch.
In the first step, we prove that, if the bottleneck congestion is triggered at location Zn, the shockwave can propagate to location Zn − 1 with the BCSP satisfied there (i.e., with momentum of going further upstream). In the second step, we prove that once the shockwave is created and the conditions given by the lemma are satisfied, the BCSP must be satisfied at any location Zm (m = 1, 2, …, n). In the third step, we prove that if the shockwave has reached location Zm (m = n, n − 1, …, 1), it can certainly spill back to location Zm − 1 (m = n, n − 1, …, 2) with the BCSP satisfied as well.
Since only a single shockwave is considered in Figure 3, which is initiated at the downstream bottleneck, throughout the proof, the flow arriving at the shockwave from upstream can always be determined via Equations (1)–(7) based on Figure 2, while the flow immediately downstream of the shockwave can be determined via Equations (8)–(16) based on Figure 3.
Step 1: Since the shockwave is created at location Zn, we must have:
Q Z n > Q Z n = C
As previously defined, Q Z n and Q Z n represent the flow directly upstream and downstream of the shockwave, respectively. When the shockwave spills back to location Yn,
Q Y n = C q n   ( q n = q n       as   given   by   the   lemma )
and by Equation (6):
Q Y n = Q Z n q n
Thus,
Q Y n > Q Y n
Furthermore,
Q X n = Q Y n 1 α n
Q X n = Q Y n 1 α n   ( α n = α n       as   given   by   the   lemma )
and hence
Q X n > Q X n
Since Zn − 1 and Xn address the same location, Condition (A7) can be re-written as:
Q Z n 1 > Q Z n 1
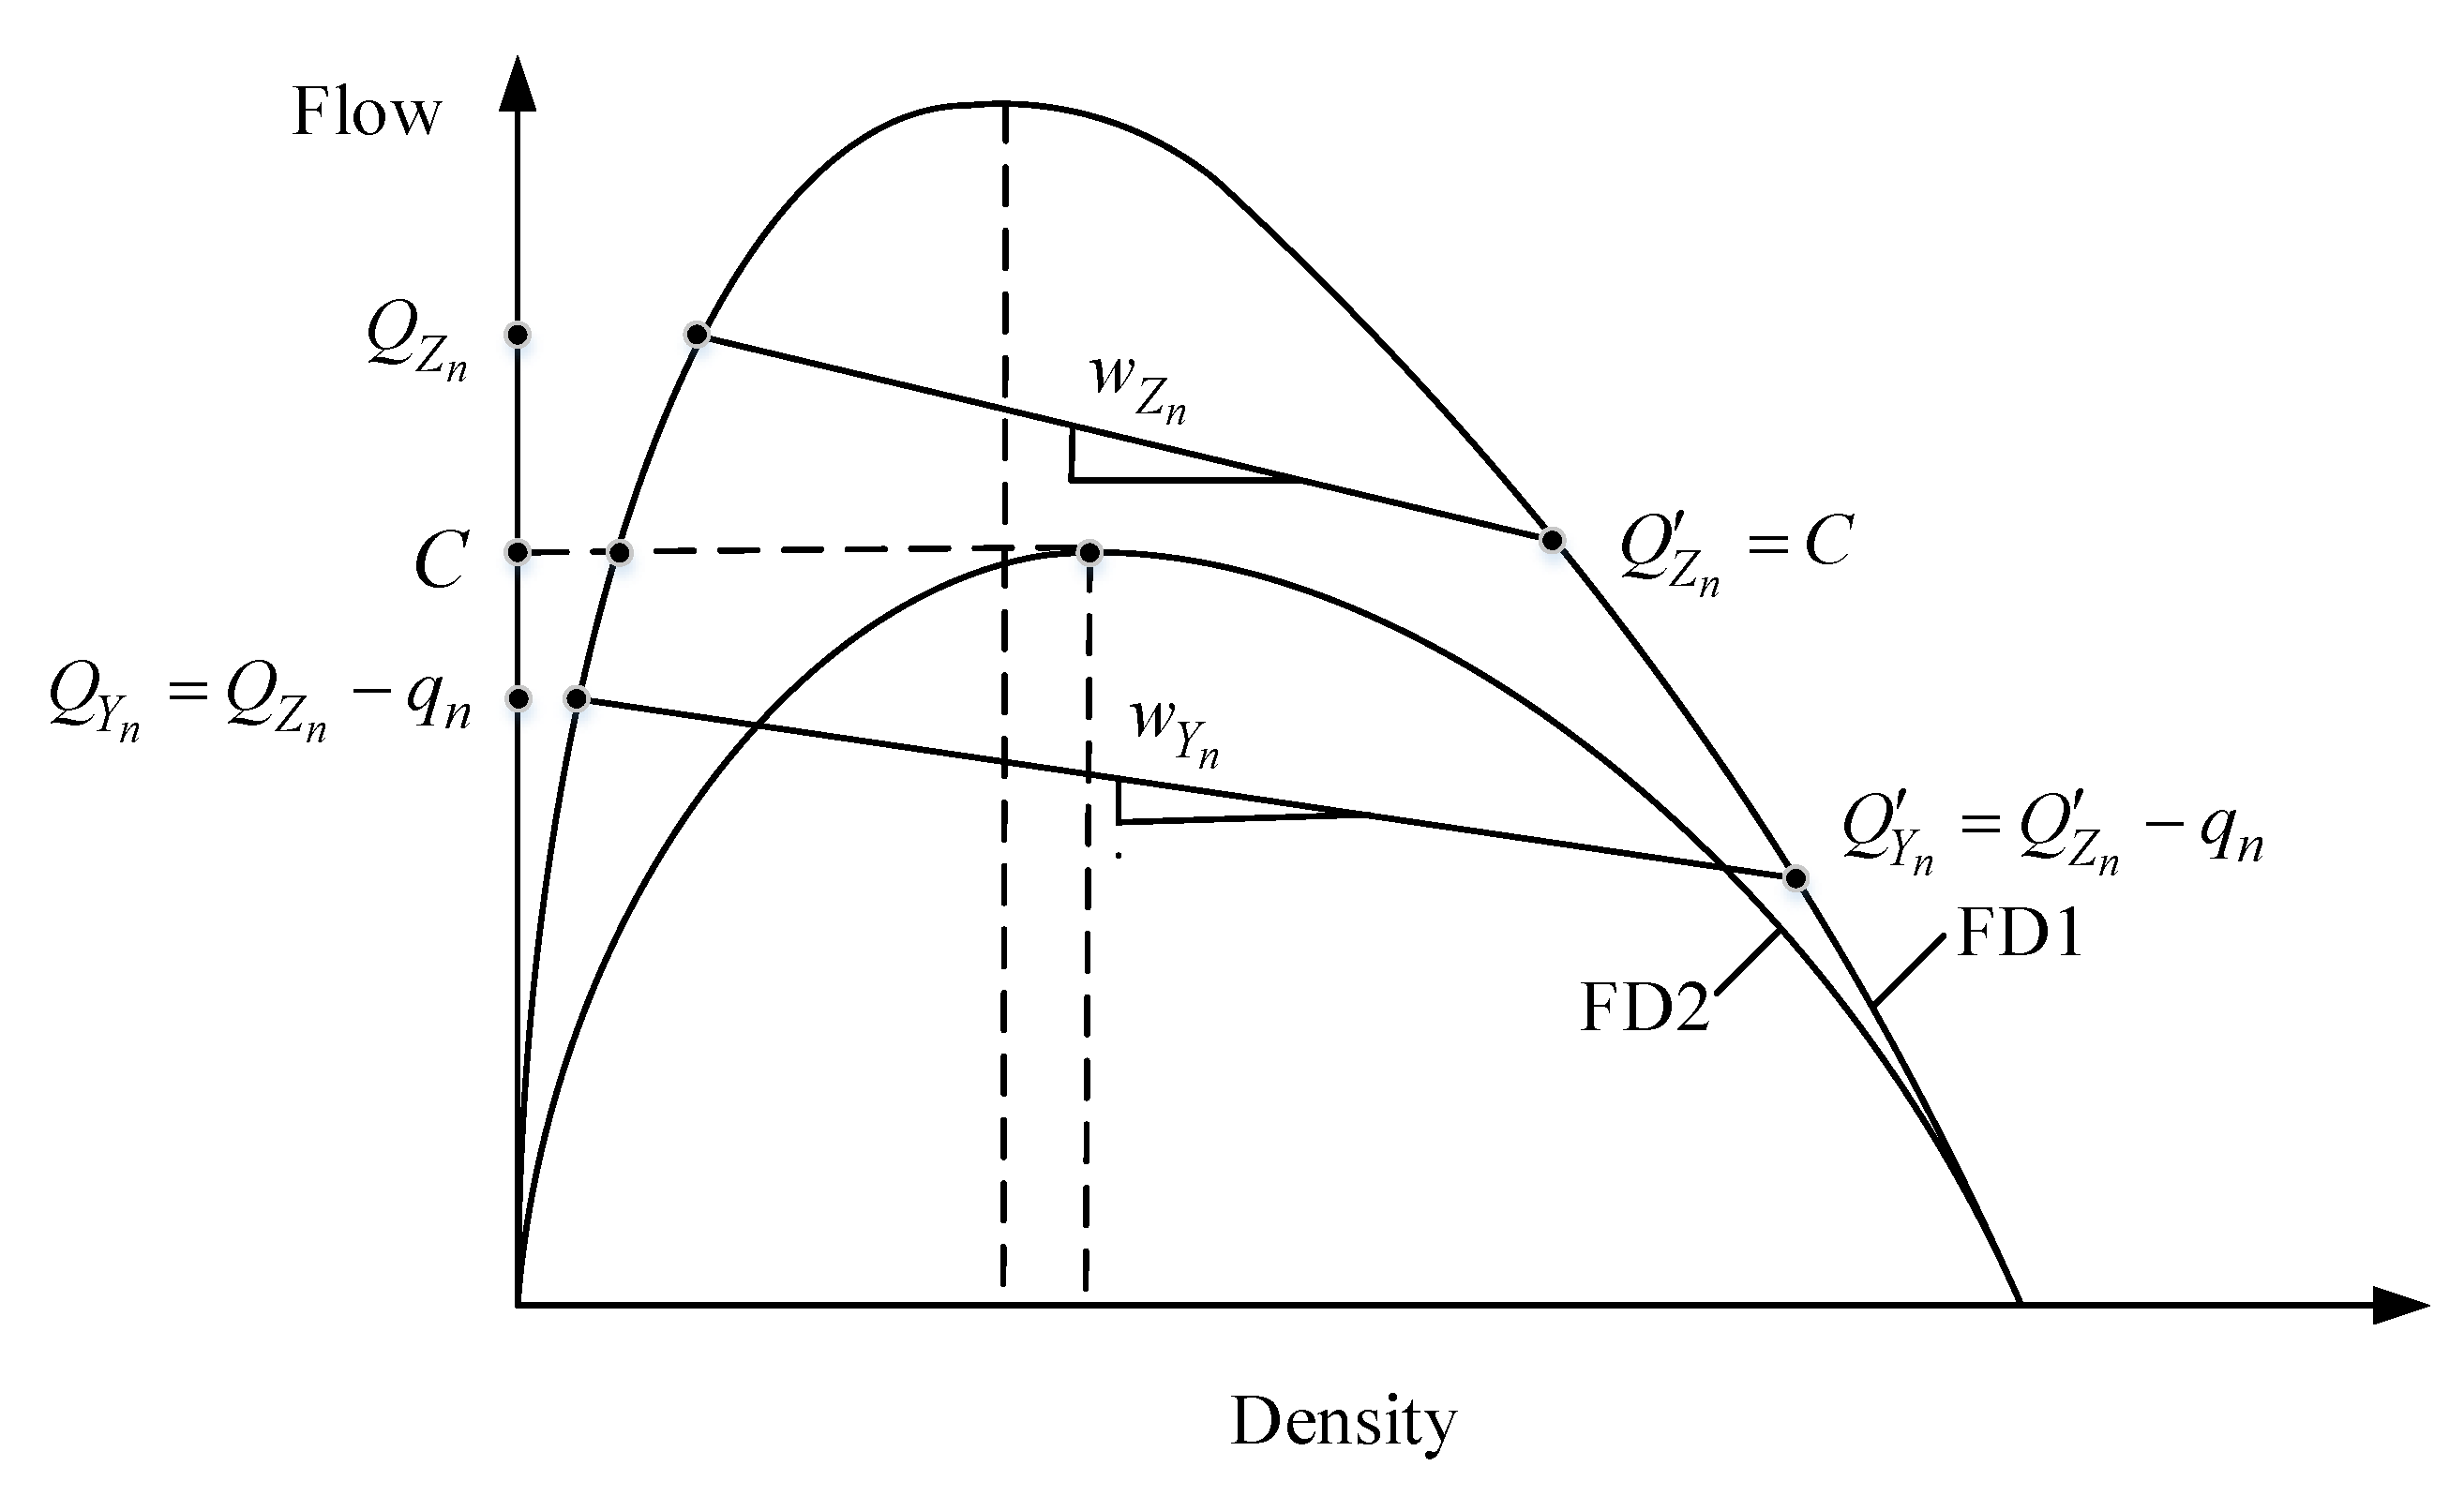
Thus, with Conditions (A1), (A4), and (A7) or (A8), we have completed the proof of Step 1. A simple illustration of Conditions (A1) and (A4) is presented in Figure A1.
Figure A1. An illustration of shockwave propagation from a downstream bottleneck (FD1 and FD2: the fundamental diagrams of the normal and bottleneck sections of the freeway stretch, respectively).
Sustainability 11 04991 g0a1
Step 2: In this step, we want to prove that Q Z m > Q Z m (m = n − 1, …, 1). Note that Zm and Xm + 1 are the same location, so it suffices to prove that Q Z m > Q X m + 1 . Based on Equations (5), (7), and (14), the relation Q Z m > Q X m + 1 can be explicitly written as:
q i = 1 m + 1 ( 1 α i ) + i = 1 m q i j = i + 1 m + 1 ( 1 α j ) 1 α m + 1 > C q n i = m + 1 n 1 q i j = i + 1 n ( 1 α j ) i = m + 1 n ( 1 α i )
where again the conditions qm’ = qm and αm’ = αm (m = 1, 2, …, n) are considered. With a little manipulation, it is clear to see that Condition (A9) is in fact equivalent to Condition (17), and therefore holds.
Step 3: Next, we want to prove that if the shockwave has reached location Zm (m = n – 1, …, 1), it can certainly spill back to location Zm – 1 (m = n, n – 1, …, 2) with the BCSP satisfied there. Using Q Z m > Q X m + 1 that was just proved, it is seen with Equations (5)–(7) that Q Z m 1 = Q Z m q m 1 α m , and with Equations (15) and (16) that Q X m = Q X m + 1 q m 1 α m . Obviously, Q Z m 1 > Q x m . Since Xm and Zm – 1 address the same location, Q Z m 1 > Q Z m 1 .
Thus, with Steps 1–3, we have proved Lemma 2 using mathematical induction.

Appendix B

By Equation (14) and Figure 3, we have:
Q 2 = C [ q n + i = 1 n 1 q i j = i + 1 n ( 1 α j ) ] i = 1 n ( 1 α i ) + i = 1 n q i C
Based on Lemma 1 and Figure 1,
Q 1 = q + i = 1 n q i q i = 1 n ( 1 α i ) [ q n + i = 1 n 1 q i j = i + 1 n ( 1 α j ) ]
Then, we need to check under what conditions we have: Q2 < Q1, i.e., Q 2 Q 1 < 1 .
Q 2 Q 1 = C [ q n + i = 1 n 1 q i j = i + 1 n ( 1 α j ) ] i = 1 n ( 1 α i ) + i = 1 n q i C q + i = 1 n q i q i = 1 n ( 1 α i ) [ q n + i = 1 n 1 q i j = i + 1 n ( 1 α j ) ]
= Q 21 Q 1  
where
Q 21 =   C [ 1 i = 1 n ( 1 α i ) ] [ q n + i = 1 n 1 q i j = i + 1 n ( 1 α j ) ] + i = 1 n ( 1 α i ) i = 1 n q i
Q 1 =   q i = 1 n ( 1 α i ) [ 1 i = 1 n ( 1 α i ) ] + i = 1 n ( 1 α i ) i = 1 n q i i = 1 n ( 1 α i ) [ q n + i = 1 n 1 q i j = i + 1 n ( 1 α j ) ]
It is seen from Condition (20) that 0 < C [ q n + i = 1 n 1 q i j = i + 1 n ( 1 α j ) ] < q i = 1 n ( 1 α i ) . Substituting this into the first term of Q1’ in Equation (A13), we have: Q1’ > Q11, where
Q 11 = C [ 1 i = 1 n ( 1 α i ) ] [ q n + i = 1 n 1 q i j = i + 1 n ( 1 α j ) ] + [ q n + i = 1 n 1 q i j = i + 1 n ( 1 α j ) ] i = 1 n ( 1 α i ) + i = 1 n ( 1 α i ) i = 1 n q i i = 1 n ( 1 α i ) [ q n + i = 1 n 1 q i j = i + 1 n ( 1 α j ) ]
As such,
Q 2 Q 1 < Q 21 Q 11
Considering the condition α i α i (i = 1, 2, …, n) and replacing i = 1 n ( 1 α i ) in the third term on the right-hand side of Equation (A14) with i = 1 n ( 1 α i ) , we have,
Q 11 C [ 1 i = 1 n ( 1 α i ) ] [ q n + i = 1 n 1 q i j = i + 1 n ( 1 α j ) ] + i = 1 n ( 1 α i ) { [ q n + i = 1 n 1 q i j = i + 1 n ( 1 α j ) ] + i = 1 n q i [ q n + i = 1 n 1 q i j = i + 1 n ( 1 α j ) ] } = C [ q n + i = 1 n 1 q i j = i + 1 n ( 1 α j ) ] C i = 1 n ( 1 α i ) + i = 1 n ( 1 α i ) { q n q n + i = 1 n q i + i = 1 n 1 q i j = i + 1 n ( 1 α j ) i = 1 n 1 q i j = i + 1 n ( 1 α j ) } = X Y 1 + Z 1 i = 1 n ( 1 α i )
where,
X = C [ q n + i = 1 n 1 q i j = i + 1 n ( 1 α j ) ]
Y 1 = C i = 1 n ( 1 α i )
Z 1 = q n q n + i = 1 n q i + i = 1 n 1 q i j = i + 1 n ( 1 α j ) i = 1 n 1 q i j = i + 1 n ( 1 α j )
In addition, following the definition with Equation (A13), Q21 can be re-written as:
Q 21 = C [ q n + i = 1 n 1 q i j = i + 1 n ( 1 α j ) ] C i = 1 n ( 1 α i ) + i = 1 n ( 1 α i ) i = 1 n q i
Like Equation (A16), we can also write Q21 in a compact form as:
Q 21 = X Y 2 + Z 2 i = 1 n ( 1 α i ' )
where X is already defined with Equation (A16), and
Y 2 = C i = 1 n ( 1 α i )
Z 2 = i = 1 n q i
Based on Conditions (A15)–(A17), we have:
0 < Q 2 Q 1 < Q 21 Q 11 X Y 2 + Z 2 i = 1 n ( 1 α i ) X Y 1 + Z 1 i = 1 n ( 1 α i )
Therefore, Q2 < Q1 if
X Y 2 + Z 2 i = 1 n ( 1 α i ) X Y 1 + Z 1 i = 1 n ( 1 α i )
that is,
Y 2 Y 1 + ( Z 1 Z 2 ) i = 1 n ( 1 α i ) > 0
By the definition of the symbols, Condition (A20) can be expanded to be exactly Condition (21). As such, we have proved Theorem 2.

References

  1. European Environment Agency. Towards a Resource-Efficient Transport System; European Environment Agency: Copenhagen, Denmark, 2010. [Google Scholar]
  2. United States Environmental Protection Agency. Inventory of U.S. Greenhouse Gas Emissions and Sinks: 1990–2010; Tech. Rep. EPA 430-R-12-001; United States Environmental Protection Agency: Washington, DC, USA, 2012.
  3. EU Energy and Transport in Figures–Statistical Pocketbook 2010; EU: Brussels, Belgium, 2010.
  4. Schrank, D.; Lomax, T. Annual Urban Mobility Report; Tech. Rep. 10-09-019; Texas A&M Transportation Institute: College Station, TX, USA, 2011. [Google Scholar]
  5. Keep Europe Moving—Sustainable Mobility for Our Continent; Tech. Rep. COM/2006/0314; European Commission: Brussels, Belgium, June 2006.
  6. Guerrini, F. Traffic Congestion Costs Americans $124 Billion A Year, Report Says. Forbes, 14 October 2014. [Google Scholar]
  7. Daganzo, C.F. The nature of freeway gridlock and how to prevent it. In Proceedings of the 13th International Symposium on Transportation and Traffic Theory, Lyon, France, 24–26 July 1996; Lesort, J.B., Ed.; Pergamon-Elsevier: Tarrytown, NY, USA, 1996; pp. 629–646. [Google Scholar]
  8. Papageorgiou, M. Reduction of Total Time Spent in A Freeway System by On-Ramp Metering; Internal Report; Dynamic Systems and Simulation La: Chania, Greece, 1997. [Google Scholar]
  9. Daganzo, F. Improving City Mobility through Gridlock Control: An Approach and Some Ideas; UCB-ITS-VWP-2005-1; UC Berkeley Center for Future Urban Transport Working Paper; UC Berkeley: Berkeley, CA, USA, 2005. [Google Scholar]
  10. Geroliminis, N.; Daganzo, C.F. Existence of urban-scale macroscopic fundamental diagrams: Some experimental findings. Transp. Res. Part B Methodol. 2008, 42, 759–770. [Google Scholar] [CrossRef] [Green Version]
  11. Haddad, J.; Ramezani, M.; Geroliminis, N. Cooperative traffic control of a mixed network with two urban regions and a freeway. Transp. Res. Part B Methodol. 2012, 54, 17–36. [Google Scholar] [CrossRef]
  12. Arnott, R. A bathtub model of downtown traffic congestion. J. Urban Econ. 2013, 76, 110–121. [Google Scholar] [CrossRef] [Green Version]
  13. Ros, G.B.; Knoop, V.L.; van Arem, B.; Hoogendoorn, S.P. Mainstream Traffic Flow Control at Sags. Transport. Res. Rec. J. Transp. Res. Board 2014, 2470, 57–64. [Google Scholar] [CrossRef] [Green Version]
  14. Papageorgiou, M.; Papamichail, I. High-Level Proof-of-Concept for the Application of the HERO Coordinated Ramp Metering Scheme to a Field Test at A10; Dynamic Systems and Simulations Laboratory, Technical Systems and Simulations Laboratory, Technical University of Crete: Chania, Greece, 2009. [Google Scholar]
  15. Newell, G.F. Delays caused by a queue at a freeway exit ramp. Transp. Res. Part B Methodol. 1999, 33, 337–350. [Google Scholar] [CrossRef]
  16. Spiliopouloua, A.; Kontorinakia, M.; Papageorgioua, M.; Kopelias, P. Macroscopic traffic flow model validation at congested freeway off-ramp areas. Transport. Res. Part C Emerg. Technol. 2014, 41, 18–29. [Google Scholar] [CrossRef]
  17. Zhao, J.; Liu, Y. Integrated signal optimization and non-traditional lane assignment for urban freeway off-ramp congestion mitigation. Transp. Res. Part C Emerg. Technol. 2016, 73, 219–238. [Google Scholar] [CrossRef]
  18. Iordanidou, G.; Roncoli, C.; Papamichail, I.; Papageorgiou, M. Feedback-Based Mainstream Traffic Flow Control for Multiple Bottlenecks on Motorways. IEEE Trans. Intell. Transp. Syst. 2015, 16, 610–621. [Google Scholar]
  19. Pang, Y. Off-Ramp Blockage on Freeways. Master’s Thesis, School of Civil Engineering and Architecture, Zhejiang University, Zhejiang, China, 2017. [Google Scholar]
  20. Gomes, G.; Horowitz, R. Optimal freeway ramp metering using the asymmetric cell transmission model. Transp. Res. Part C Emerg. Technol. 2006, 14, 244–262. [Google Scholar] [CrossRef]
  21. Dabiri, A.; Kulcsar, B. Distributed Ramp Metering-A Constrained Discharge Flow Maximization Approach. IEEE Trans. Intell. Transp. Syst. 2017, 18, 2525–2538. [Google Scholar] [CrossRef]
  22. Ferrara, A.; Sacone, S.; Siri, S. An overview of traffic control schemes for freeway systems. In Freeway Traffic Modelling and Control; Springer: New York, NY, USA, 2018. [Google Scholar]
  23. Newell, G.F. A simplified theory of kinematic waves in highway traffic. I: General theory. II: Queueing at freeway bottlenecks. III: Multi-destination flows. Transp. Res. Part B Methodol. 1993, 27, 281–313. [Google Scholar] [CrossRef]
  24. Cassidy, M.J.; Bertini, R.L. Some traffic features at freeway bottlenecks. Transp. Res. Part B Methodol. 1999, 33, 25–42. [Google Scholar] [CrossRef] [Green Version]
  25. Messmer, A.; Papageorgiou, M. METANET: A macroscopic simulation program for motorway networks. Traffic Eng. Control 1990, 31, 466–470. [Google Scholar]
  26. Wang, Y.; Papageorgiou, M. Real-time freeway traffic state estimation based on extended Kalman filter: A general approach. Transp. Res. Part B Methodol. 2005, 39, 141–167. [Google Scholar] [CrossRef]
  27. VISSIM 5.20 User’s Manual; Planung Transprot Verkehr: Karlsruhe, Germany, 2009.
  28. Papageorgiou, M.; Kotsialos, A. Freeway ramp metering: An overview. IEEE Trans. Intell. Transp. Syst. 2002, 3, 271–281. [Google Scholar] [CrossRef]
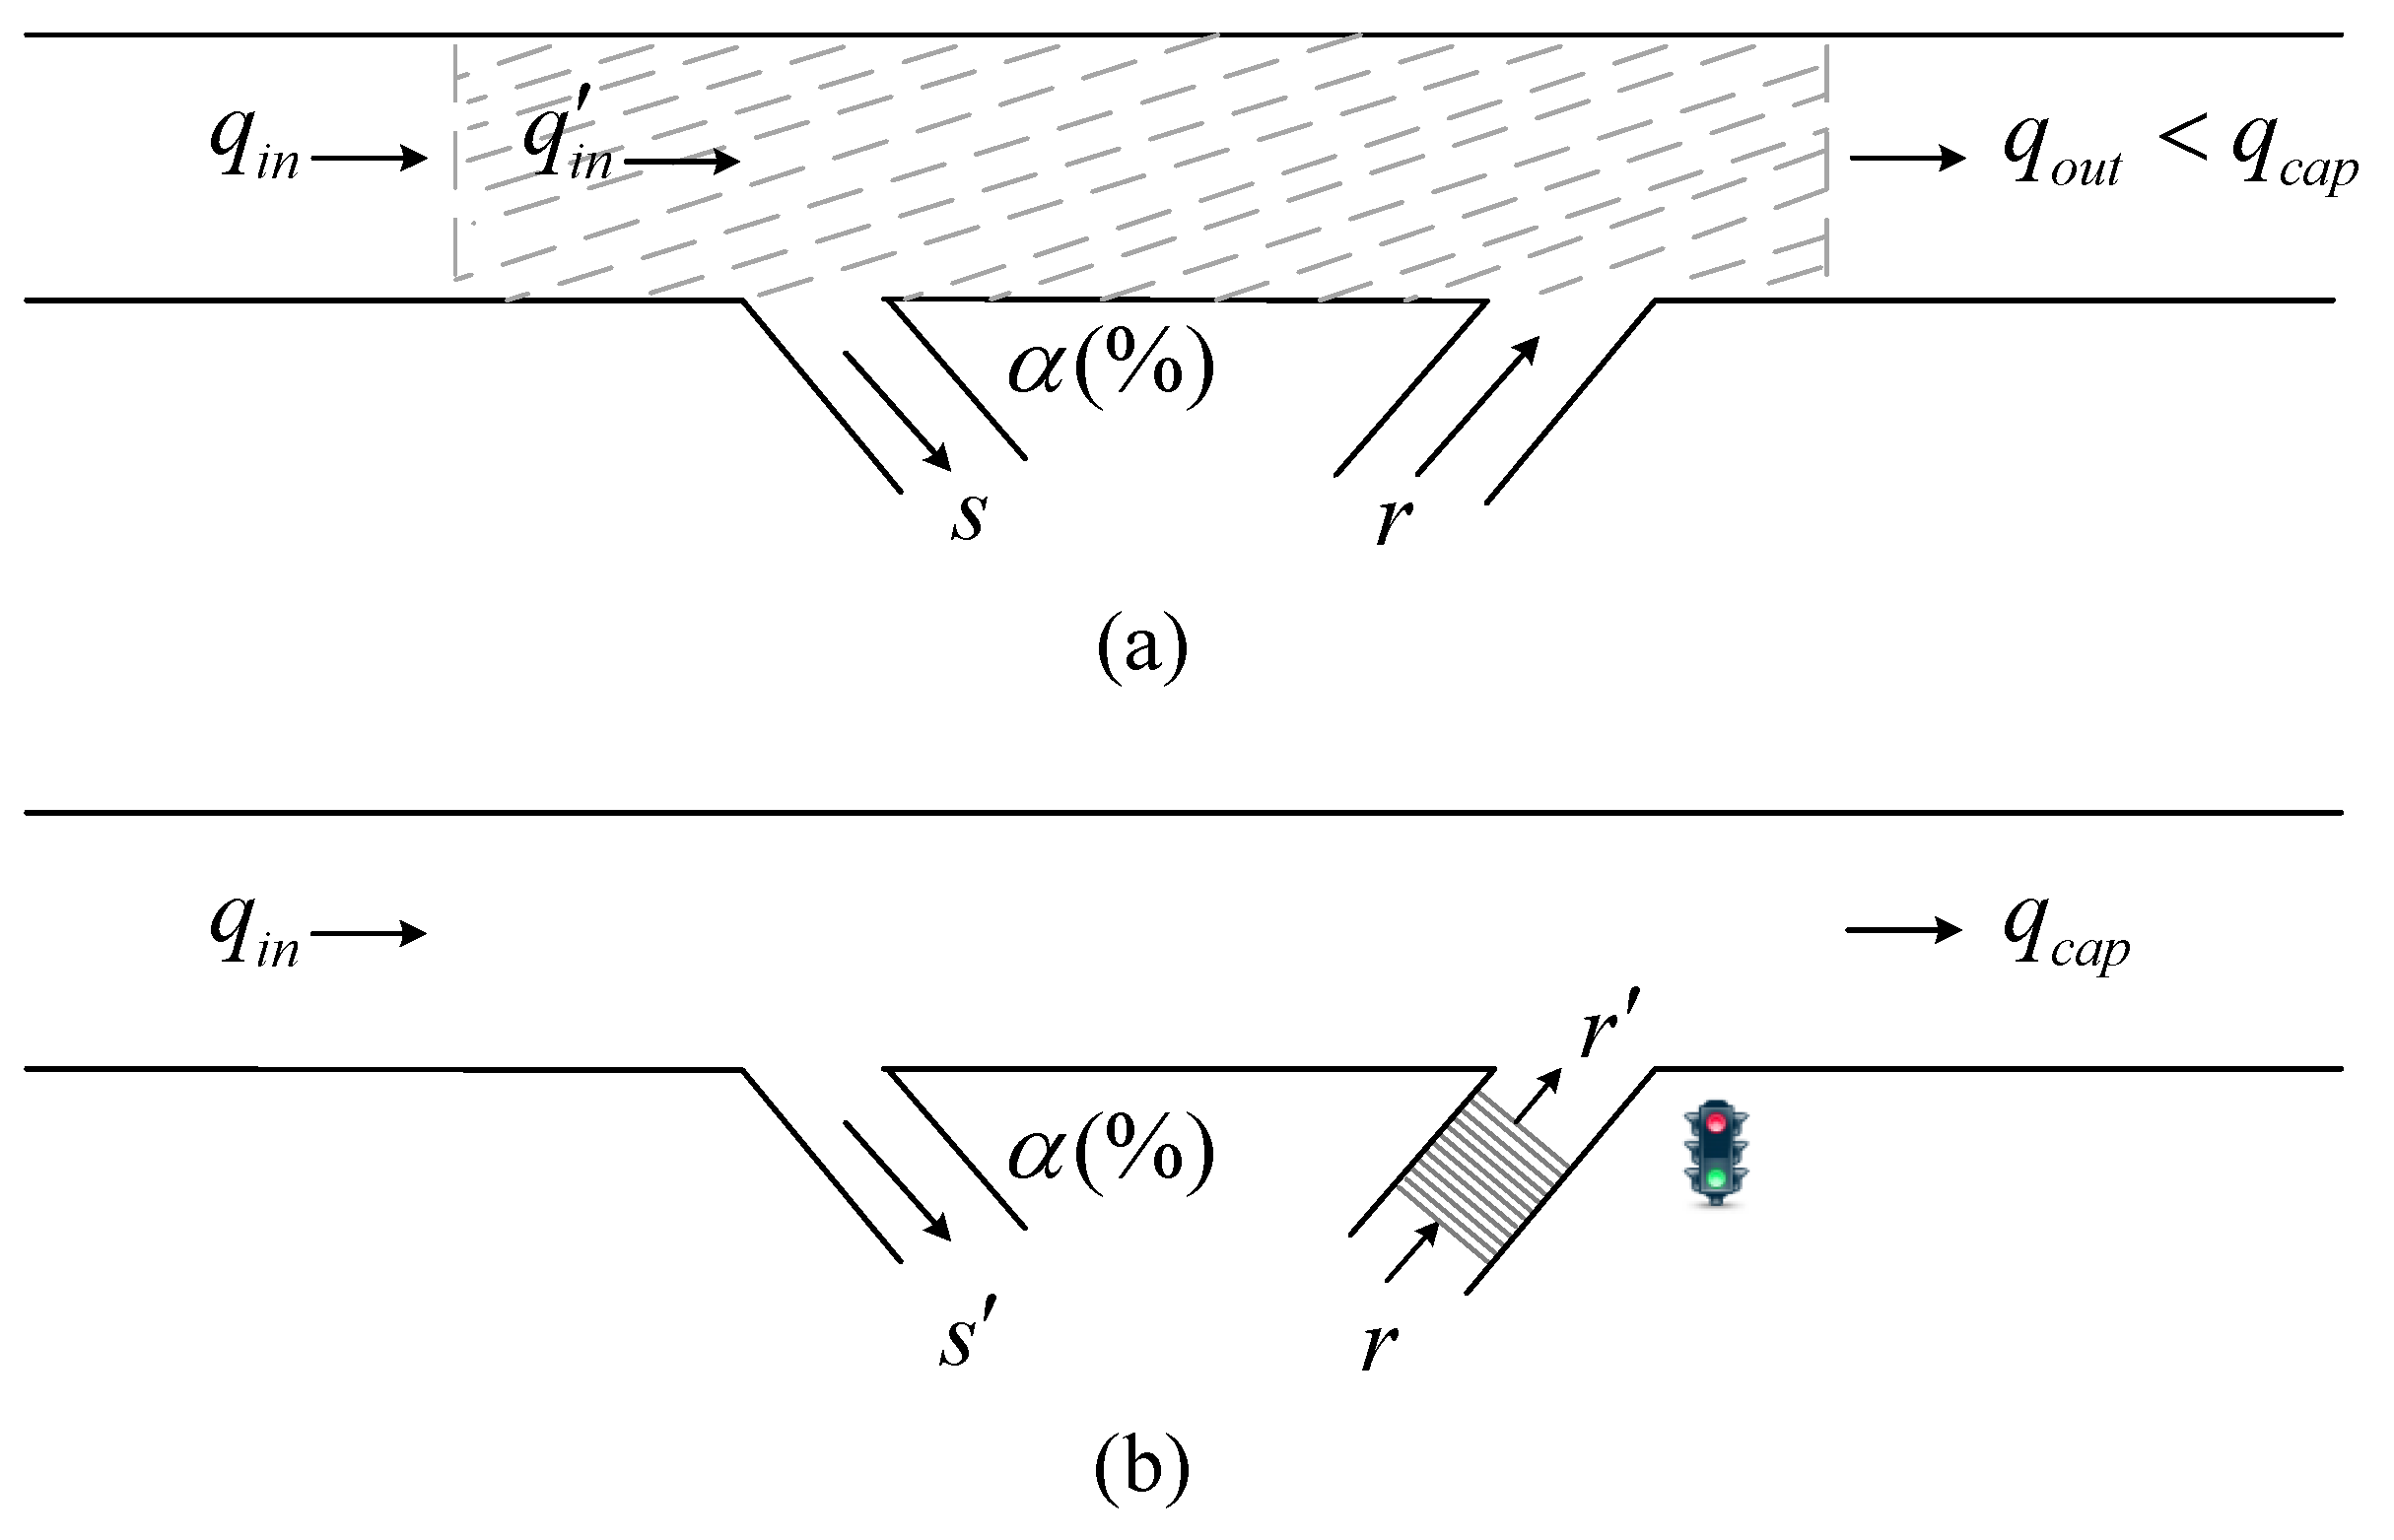
Figure 1. A freeway stretch with an off-ramp and an overloaded on-ramp: (a) no ramp metering; (b) ramp metering.
Sustainability 11 04991 g001
Figure 2. A freeway stretch with a number of on/off-ramp pairs.
Sustainability 11 04991 g002
Figure 3. The same freeway stretch as presented in Figure 2 except for a downstream bottleneck of capacity C.
Sustainability 11 04991 g003
Figure 4. The sensitivity of exiting rates to upstream demands.
Sustainability 11 04991 g004
Figure 5. The sensitivity of exiting rates to OD rates.
Sustainability 11 04991 g005
Figure 6. The layout of a simulated freeway stretch with an accident-induced bottleneck.
Sustainability 11 04991 g006
Figure 7. The mainstream demand.
Sustainability 11 04991 g007
Figure 8. On-ramp demand scenarios.
Sustainability 11 04991 g008
Figure 9. The relation of total off-ramp flows and on-ramp demands.
Sustainability 11 04991 g009
Figure 10. Simulation results for an accident-induced bottleneck: (a,c,e) macroscopic; (b,d,f) microscopic.
Sustainability 11 04991 g010
Figure 11. The layout of a simulated freeway stretch with a ramp-merging bottleneck.
Sustainability 11 04991 g011
Figure 12. The demand scenario.
Sustainability 11 04991 g012
Figure 13. On-ramp demand scenarios.
Sustainability 11 04991 g013
Figure 14. The relation of total off-ramp flow and on-ramp demand based on macroscopic simulations: (a) Q1: without ramp metering; (b) Q2: with ramp metering.
Sustainability 11 04991 g014
Figure 15. Simulation results for a recurrent (ramp-merging) bottleneck: (a,c,e) without ramp metering; (b,d,f) with ramp metering.
Sustainability 11 04991 g015aSustainability 11 04991 g015b
Figure 16. The sensitivity of the off-ramp blockage effect to off-ramp exiting rates under the accident-induced congestion.
Sustainability 11 04991 g016
Figure 17. The sensitivity of off-ramp blockage effect to OD rates under non-recurrent congestion.
Sustainability 11 04991 g017
Figure 18. Macroscopic fundamental diagram under non-recurrent congestion based on macroscopic simulations.
Sustainability 11 04991 g018
Figure 19. Data samples from Figure 18.
Sustainability 11 04991 g019
Figure 20. Macroscopic fundamental diagram under non-recurrent congestion based on microscopic simulations.
Sustainability 11 04991 g020
Figure 21. Data samples from Figure 20.
Sustainability 11 04991 g021