Article

Assessment of Urban Green Space Based on Bio-Energy Landscape Connectivity: A Case Study on Tongzhou District in Beijing, China

School of Nature Conservation, Beijing Forestry University, No. 35 Qinghua East Road, Beijing 100083, China
*
Authors to whom correspondence should be addressed.
The authors contributed equally to this study.
Sustainability 2019, 11(18), 4943; https://doi.org/10.3390/su11184943
Submission received: 29 July 2019 / Revised: 1 September 2019 / Accepted: 5 September 2019 / Published: 10 September 2019
(This article belongs to the Section Sustainable Urban and Rural Development)

Abstract

:
Green infrastructure is one of the key components that provides critical ecosystems services in urban areas, such as regulating services (temperature regulation, noise reduction, air purification), and cultural services (recreation, aesthetic benefits), but due to rapid urbanization, many environmental impacts associated with the decline of green space have emerged and are rarely been evaluated integrally and promptly. The Chinese government is building a new city as the sub-center of the capital in Tongzhou District, Beijing, China. A series of policies have been implemented to increase the size of green urban areas. To support this land-use decision-making process and achieve a sustainable development strategy, accurate assessments of green space are required. In the current study, using land-use data and environmental parameters, we assessed the urban green space in the case study area. The bio-energy and its fluxes, landscape connectivity, as well as related ecosystem services were estimated using a novel approach, the PANDORA model. These results show that (1) in the highly urbanized area, green space is decreasing in reaction to urbanization, and landscape fragmentation is ubiquitous; (2) the river ecology network is a critical part for ecosystem services and landscape connectivity; and (3) the alternative non-green patches to be changed to urban, urban patches which can improve landscape quality the most by being changed to green, and conservation priority patches for biodiversity purposes of urban green were explicitly identified. Conclusively, our results depict the spatial distribution, fluxes, and evolution of bio-energy, as well as the conservation prioritization of green space. Our methods can be applied by urban planners and ecologists, which can help decision-makers achieve a sustainable development strategy in these rapidly urbanizing areas worldwide.

1. Introduction

Due to the increasing urbanization, as well as its direct and indirect impacts on biodiversity and ecosystem services, sustainable development strategy plays a decisive role in the urban areas around the world [1]. With the continued urban development, about 50% of the world’s population and approximately 76% in developed countries are urban dwellers [2,3]. Besides, it is predicted that by the end of the 21st century, 90% of the world’s population will live in cities [4,5]. Therefore, the ecological perspective of sustainable urban development is moving in the direction of a win-win strategy [6]. That is, we should simultaneously achieve ecosystem stability and human well-being in those places where most people live and can directly experience nature [7]. Some specific interventions are implemented in the urban ecosystem to achieve this win-win strategy, primarily through the optimized and reasonable assessment of green space [8,9].
Green infrastructure is one of the critical components that provides various urban ecosystem services [5,10,11]. According to the Common International Classification of Ecosystem Services [12], regulating/maintenance and cultural sections are both significant ecosystem services that urban green infrastructure provides, such as air filtering [13], microclimate regulation [14], pollution attenuation [15], rainwater retention [16], and recreation [17]. These ecosystem services of urban greening are beneficial to human health, economy, and social development [5]. To achieve these ecosystem services values, accurate assessment of green space is critical to sound decision making [18].
When estimating the sustainability of urban greening projects, their multiple impacts on finance, society, culture, and ecosystem services of concerned regions should be evaluated integrally and simulated. [19,20]. For example, the discrete linear programming model [19,20] based on multi-criteria decision analysis was used to identify the optimal location of an urban forestry project concerning these multiple effects. In many cases [18,21], however, some studies [3,21,22] simulated evaluate ecosystem services values of urban green space using data that are usually available to land managers (e.g., remote sensing images, digital elevation models). In addition, ecosystem services models empirically assess the relationship between land-use and ecosystem services values [23], such as the InVEST [24], SPAN [25], and MIMES models [26]. However, these approaches comprehensively focused on the characteristics of individual patches but ignored landscape connectivity and Bio-Energy interactions between adjacent patches that have recently gained more recognition as one of the most important indicators of many studies [18,23,27,28,29]. Thus, we used an optimized bio-energy model named PANDORA [28,29] based on graph theory to compensate for these limitations. Besides, PANDORA model is a spatial explicit approach for supporting biodiversity conservation prioritization of the urban green infrastructure [28], using data that are usually available to land managers (e.g., remote sensing images, digital elevation models, and soil maps).
In this study, to support the land-use decision-making process and achieve sustainable development strategy, we conducted an assessment of urban green space in Tongzhou District, Beijing, China. Based on land-use data, we simulated the bio-energy and its spatial interaction of green space by PANDORA model [28]. Moreover, to propose the priority areas of urban greening, a set of 835 non-urbanized areas (NUAs) were evaluated and compared on three scenarios traditionally recognized by urban landscape managers. The principal goals of the paper are: (1) to assess the spatial dynamics of bio-energy for greening space based on graph theory; (2) to detect the best land-use scale for urban planners among the three scenarios; (3) to identify the critical areas for urban green space from NUAs.

2. Materials and Methods
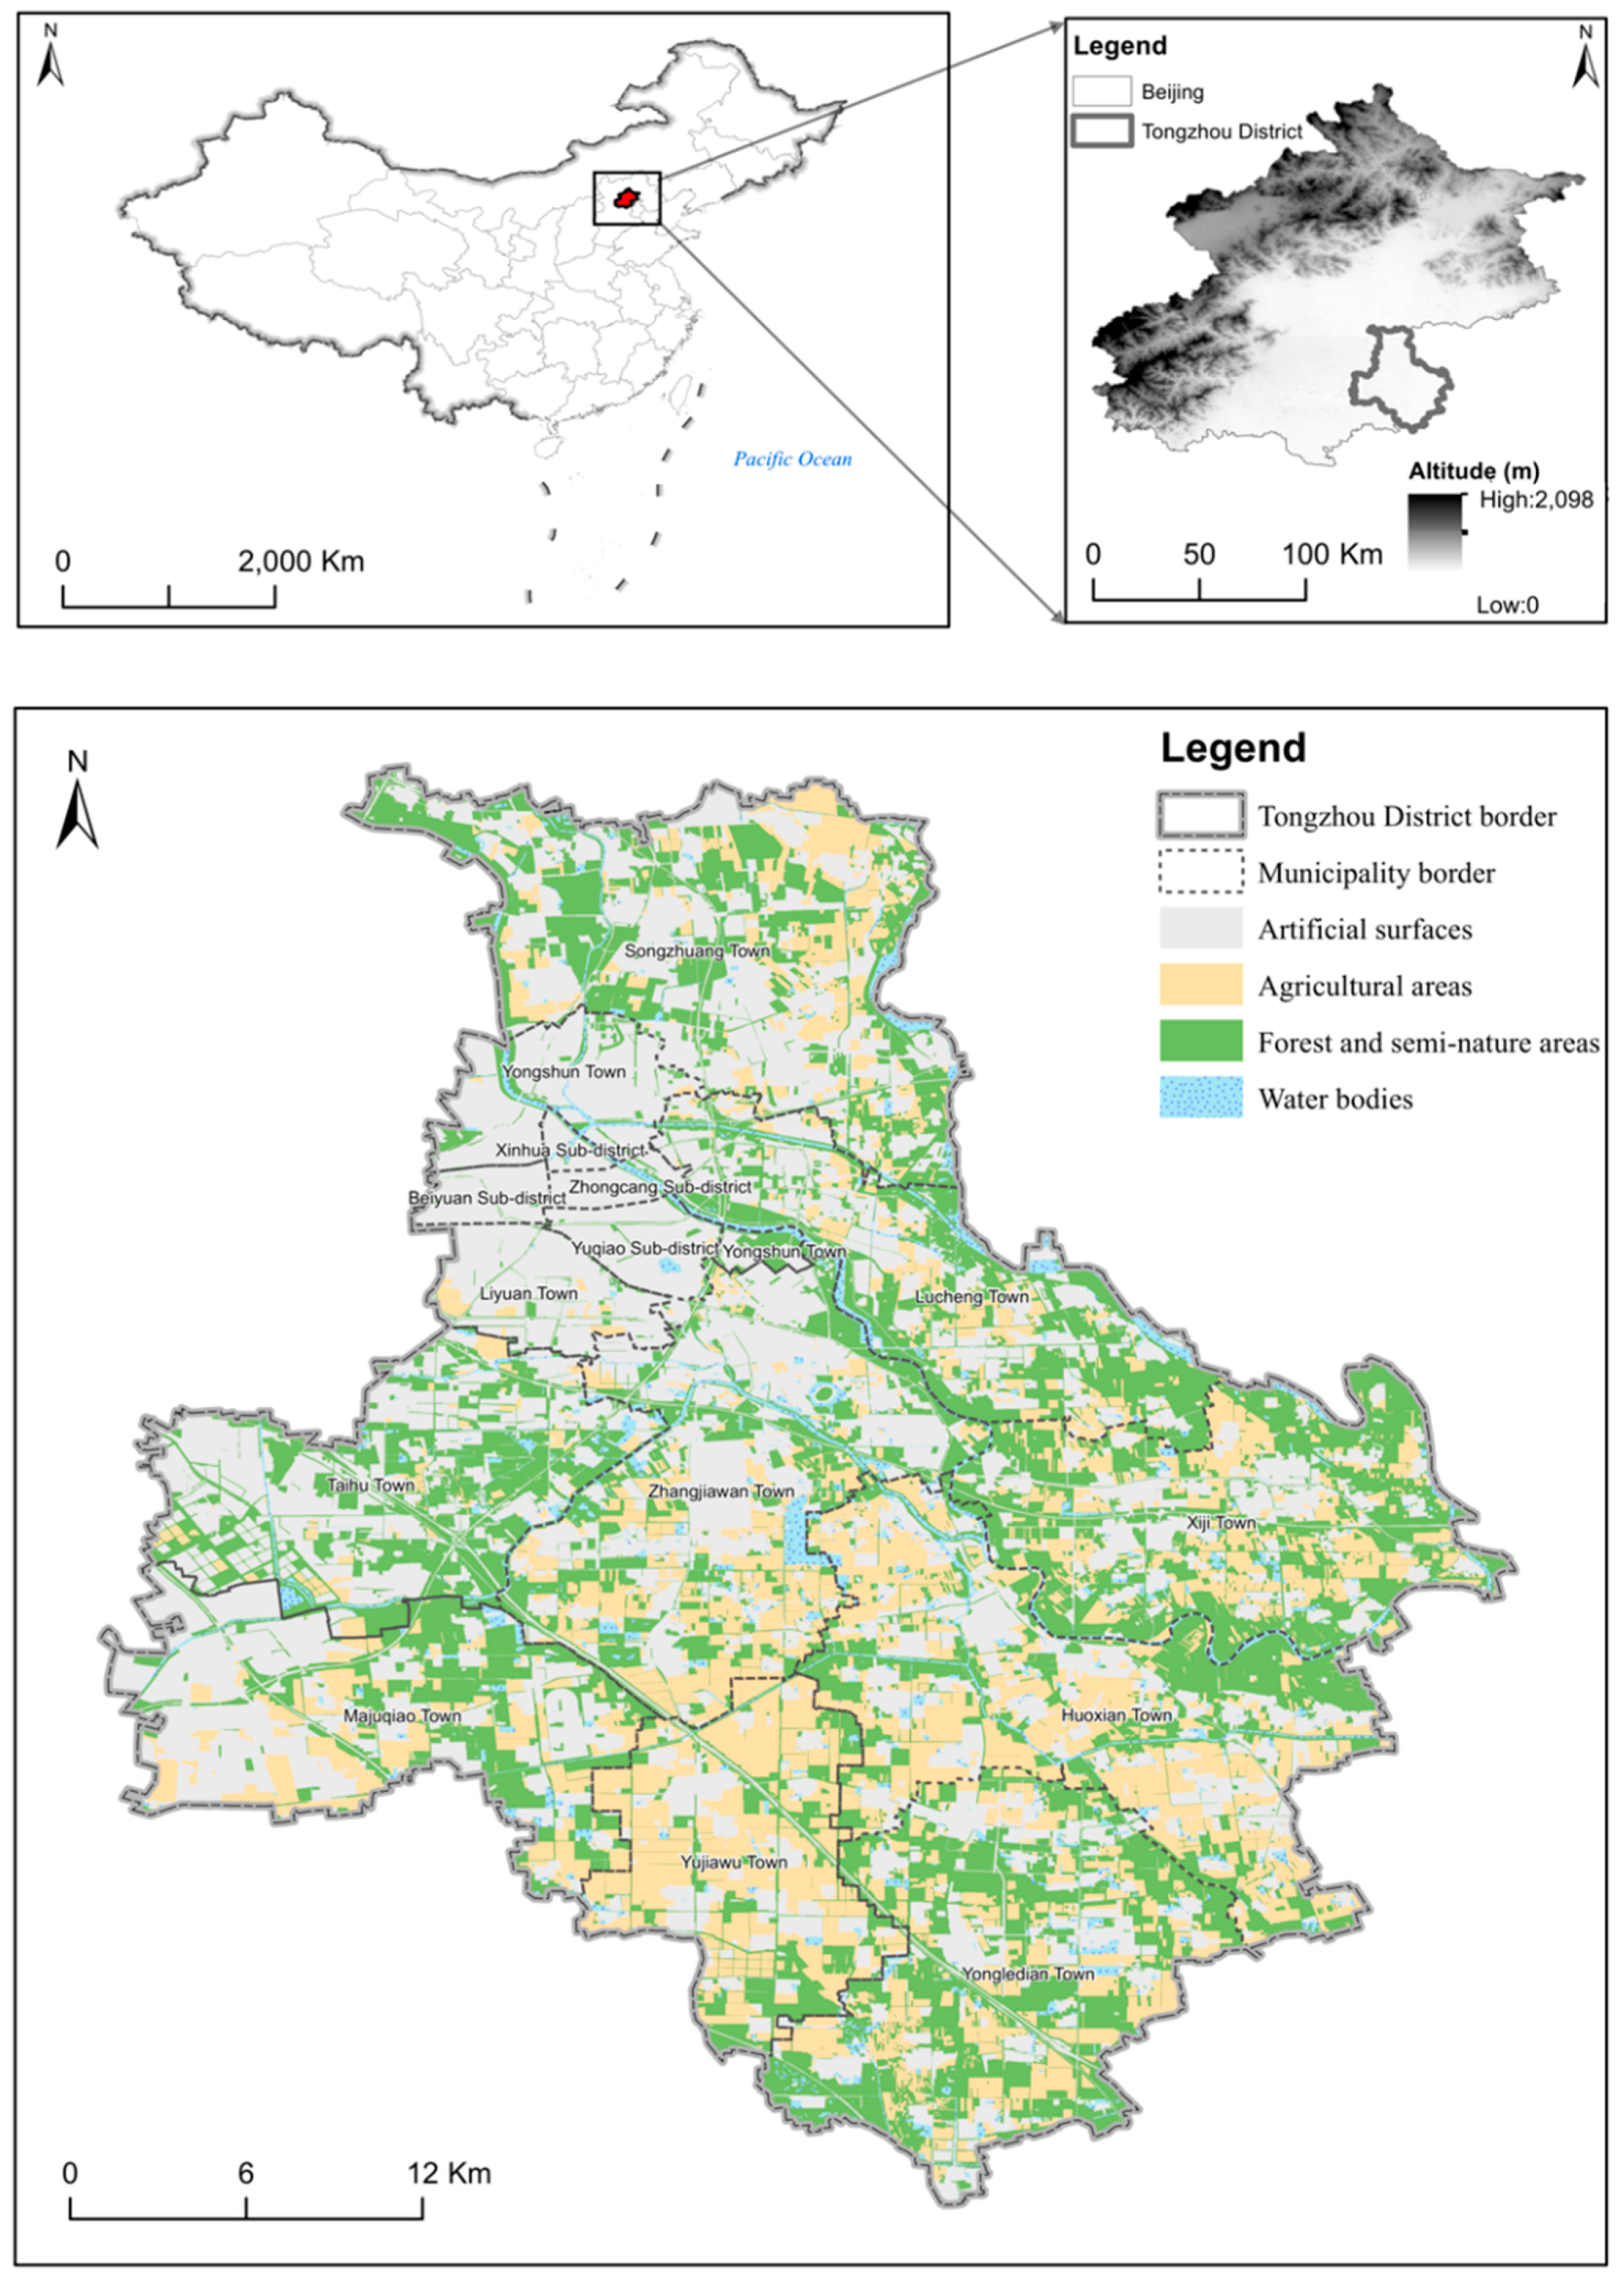
2.1. Study Area

The Tongzhou District (39°36′–40°02′ N, 116°31′–116°57′ E) is located at the southeast of Beijing, China (Figure 1), covering a total area of 906.05 km2. Beijing–Hangzhou Grand Canal, Chaobai River, and Liangshui River pass through the city [30]. Between 1964 and 2014, forest on both sides of these rivers was planted, with a total area of 21.64 km2. Furthermore, the Tongzhou District is the urban expansion area. According to the Urban Master Plan of Beijing (2016–2035) [31], Beijing, the capital of China, is developing a new city in the downtown of Tongzhou District as its sub-center [32]. Also, the area of urban greening was 26.9 km2 in the sub-center area in 2015, and the government will increase the green space to 41.0 km2 by 2035 [33].

2.2. Data Preparation

Multiple datasets were collected and compiled from diverse sources (Table 1). Forest location, forest types, forest conservation types, vegetation coverage, agricultural area location, and water body location were extracted from the Forest Inventory Database in 2015 for the Tongzhou District. The artificial surfaces land classes in 2015, such as buildings, roads, and railways, were obtained from a land-use map, which were interpreted from a series of Landsat Multispectral Scanner images and Landsat Thematic Mapper by Beijing Qianfan Shijing Technology Company (Beijing, China). The soil map was also extracted from the Forest Inventory Database. All administrative data, such as the boundaries of state, city, county (district), town (sub-district) and village, were provided by Beijing Municipal Bureau of Land and Resources Tongzhou Branch.
All available data were gathered into a land-use map through ArcGIS 10.2 for Desktop software (Environmental Systems Research Institute Inc., RedLands, USA) [34] (Figure 1). In accordance with Corine Land Cover Classification System, land-use types were reclassified into 13 categories: continuous and dense urban fabric, roads networks, airports, permanently irrigated arable land, nurseries in permanently irrigated land, broad-leaved forest, coniferous forest, mixed forest, natural grasslands, moors and heathlands, bare rocks, sparsely vegetated areas, as well as rivers and streams (Table 2).

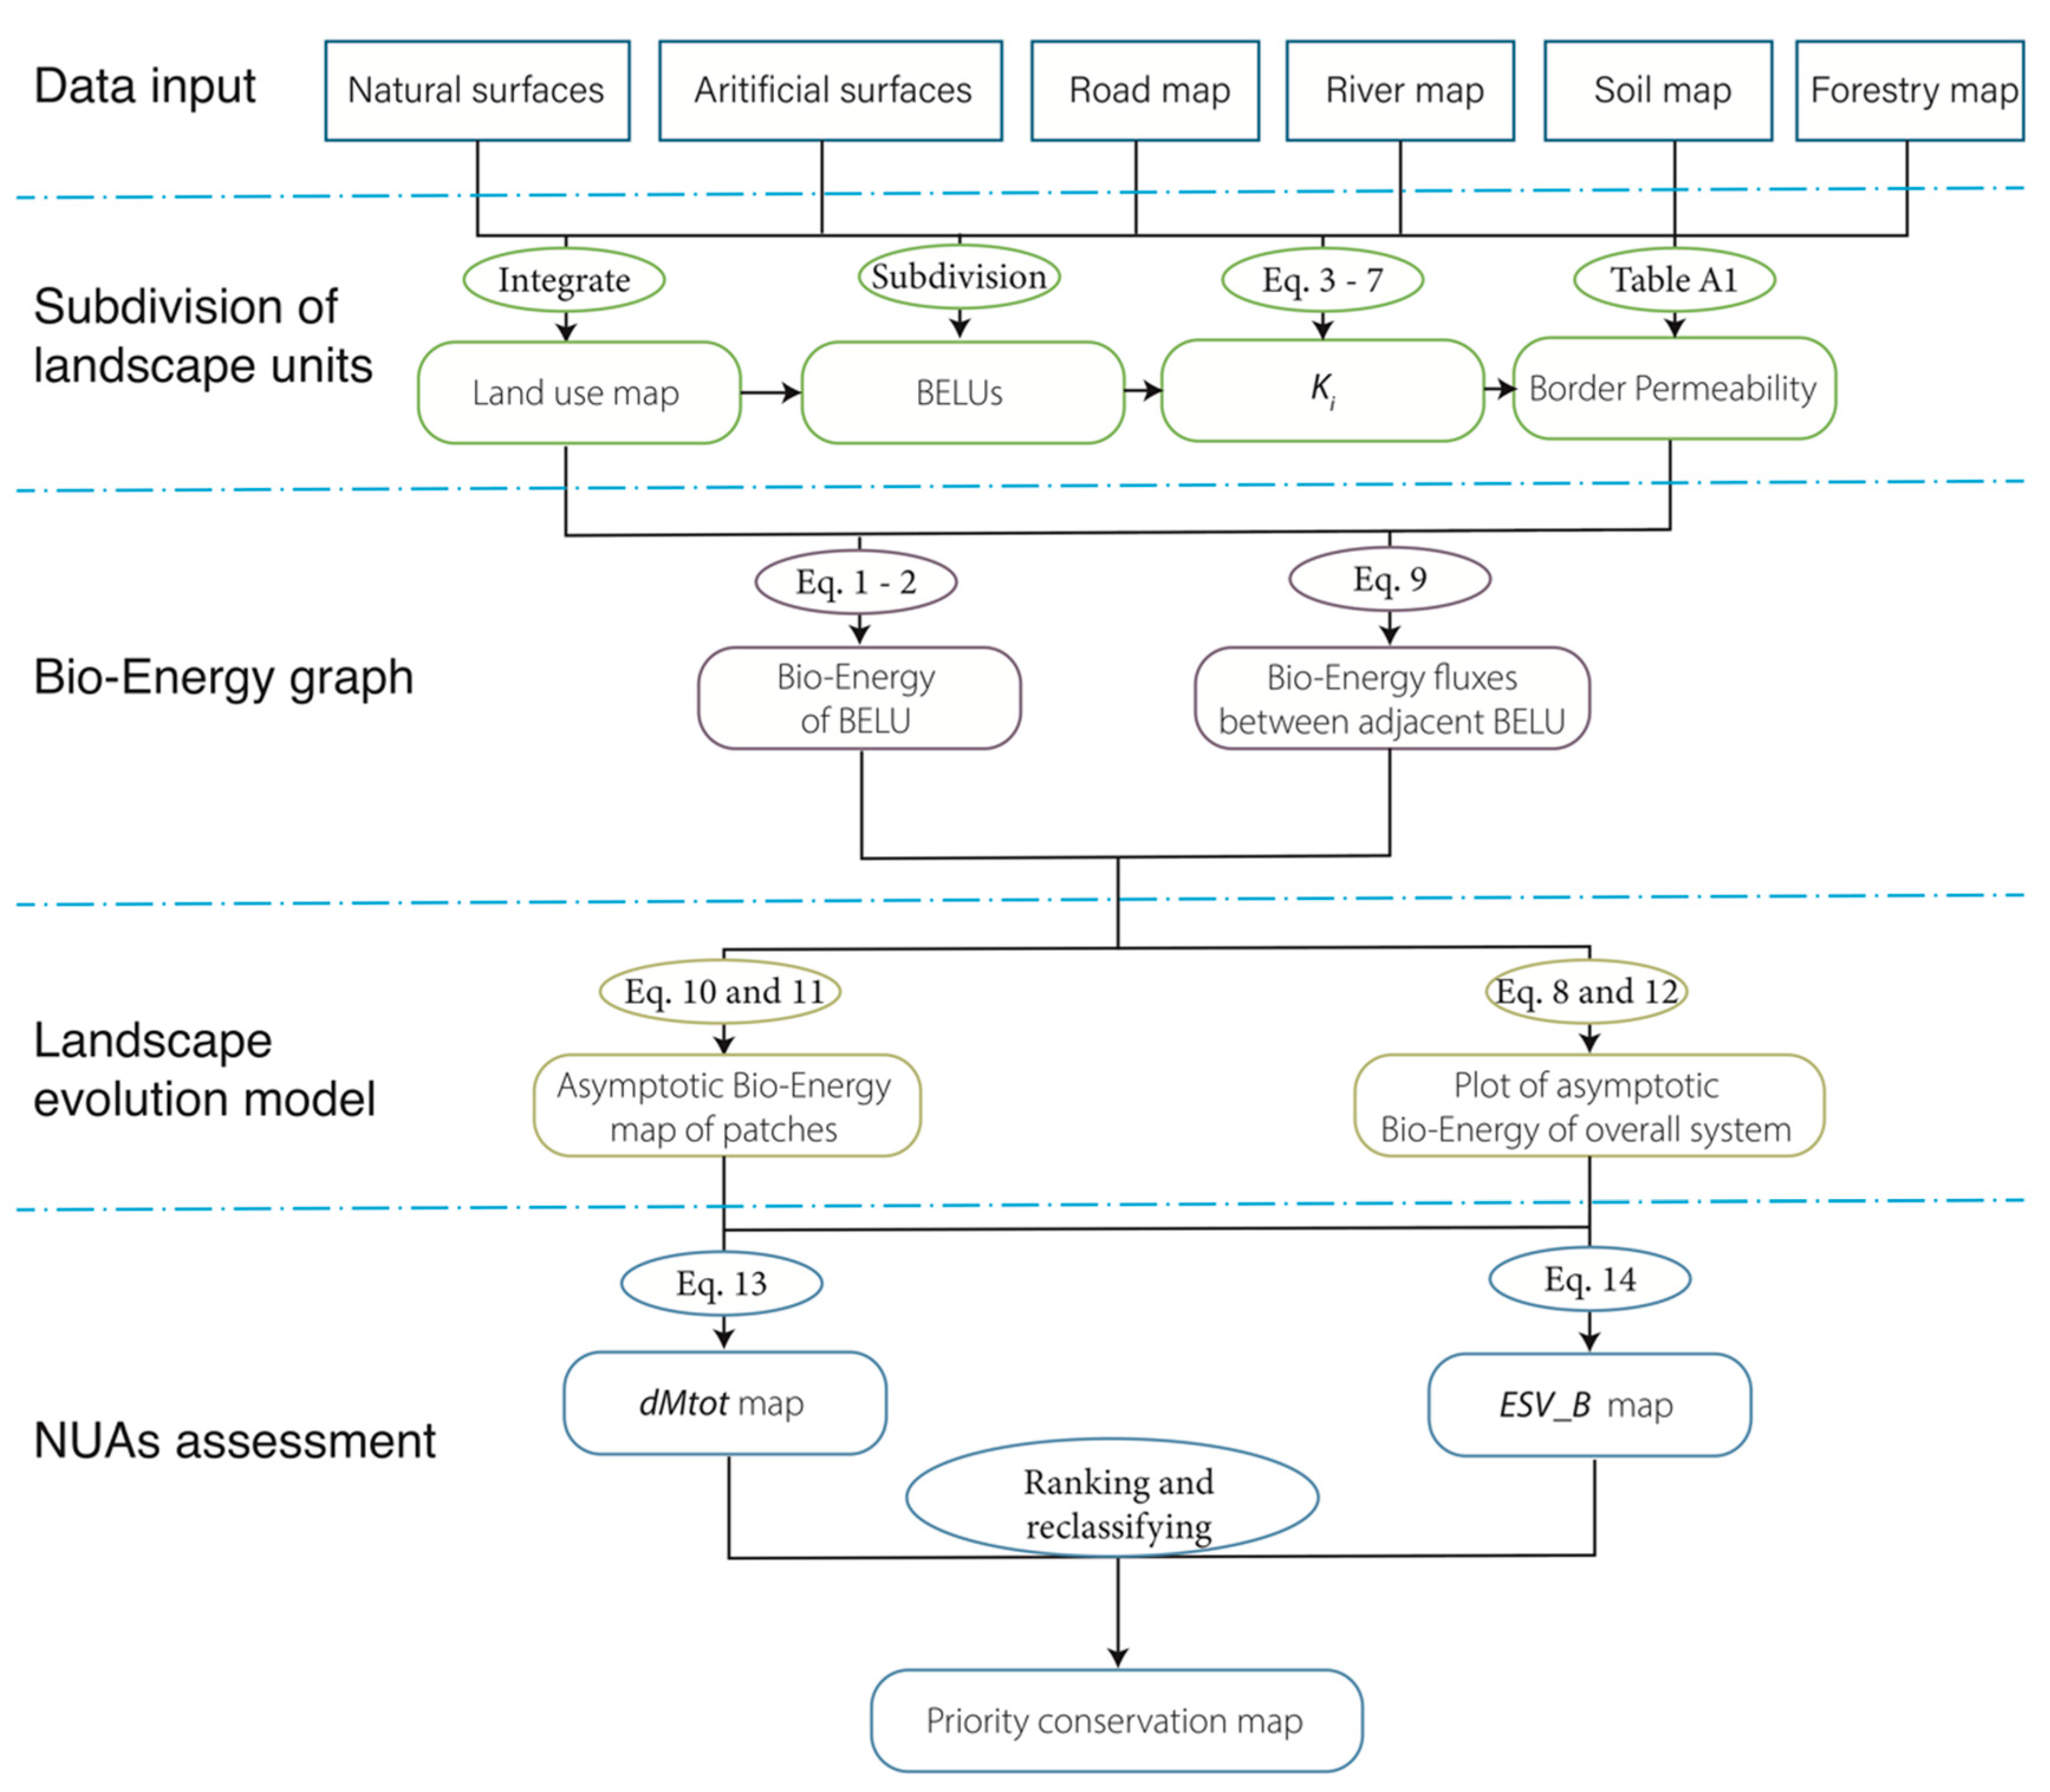
2.3. Overall Framework

The main goal of the study was to evaluate the green space of Tongzhou District. An open-source plugin, PANDORA 3.0 model [35], was used to accomplish the assessment. This model ran in QGIS 2.16.3 software [36]. In this way, four indicators describing the landscape connectivity and ecosystem services values of green space were assessed.
  • The bio-energy index (Mcal/year) describes the energy which an ecological system has to dissipate in the environment to maintain its level of metastability [37].
  • To identify the bio-energy landscape unit (BELU) level of landscape connectivity, the bio-energy fluxes (Mcal/year) exchanged among adjacent BELUs was calculated. A BELU is an higher hierarchical level than the landscape mosaic, defined as a portion of landscape with variable homogeneity characteristics surrounded by recognizable and significant barriers for bio-energy fluxes [28,37].
  • The dMtot index (%) indicates the connectivity importance of each patch. That is, a patch with a high dMtot value makes an enormous contribution of landscape connectivity to the overall ecosystem.
PANDORA is fundamentally a landscape evolution model based on a system of ordinary differential equations (ODEs) [18,37,38,39,40]. An algebraic hierarchy solution was applied to simulate the final asymptotic bio-energy. Areas of high asymptotic bio-energy values indicated the most important regions for landscape connectivity [18]. On the contrary, those having low asymptotic bio-energy contributed less landscape connectivity. The Supplementary Materials provides a complete description and specific parameters for PANDORA. Also, see Pelorosso et al. [18,28] for more details of the model.
The theoretical framework of our study (Figure 2) included four steps: (1) subdivision of landscape units; (2) bio-energy graph; (3) landscape evolution model; and (4) NUAs assessment at the patch scale.

2.4. Bio-Energy Graph

Subsequently, the bio-energy graph was illustrated in terms of bio-energy (see Equations (1) and (2), Supplementary Materials) and its fluxes index (see Equation (9), Supplementary Materials). The bio-energy graph consisted of nodes and arcs. Nodes were circles having dimensions proportional to the bio-energy of each BELU. The size of the circle was proportional to the bio-energy. Arcs were lines describing the fluxes of bio-energy between neighboring BELUs, whose thickness was proportional to the interaction of bio-energy. The bio-energy graph was available for graphically identifying the energy spatial distribution and fluxion of green space. Additionally, the final asymptotic values of each patch (see Equations (10) and (11), Supplementary Materials) were obtained to build an asymptotic bio-energy graph.

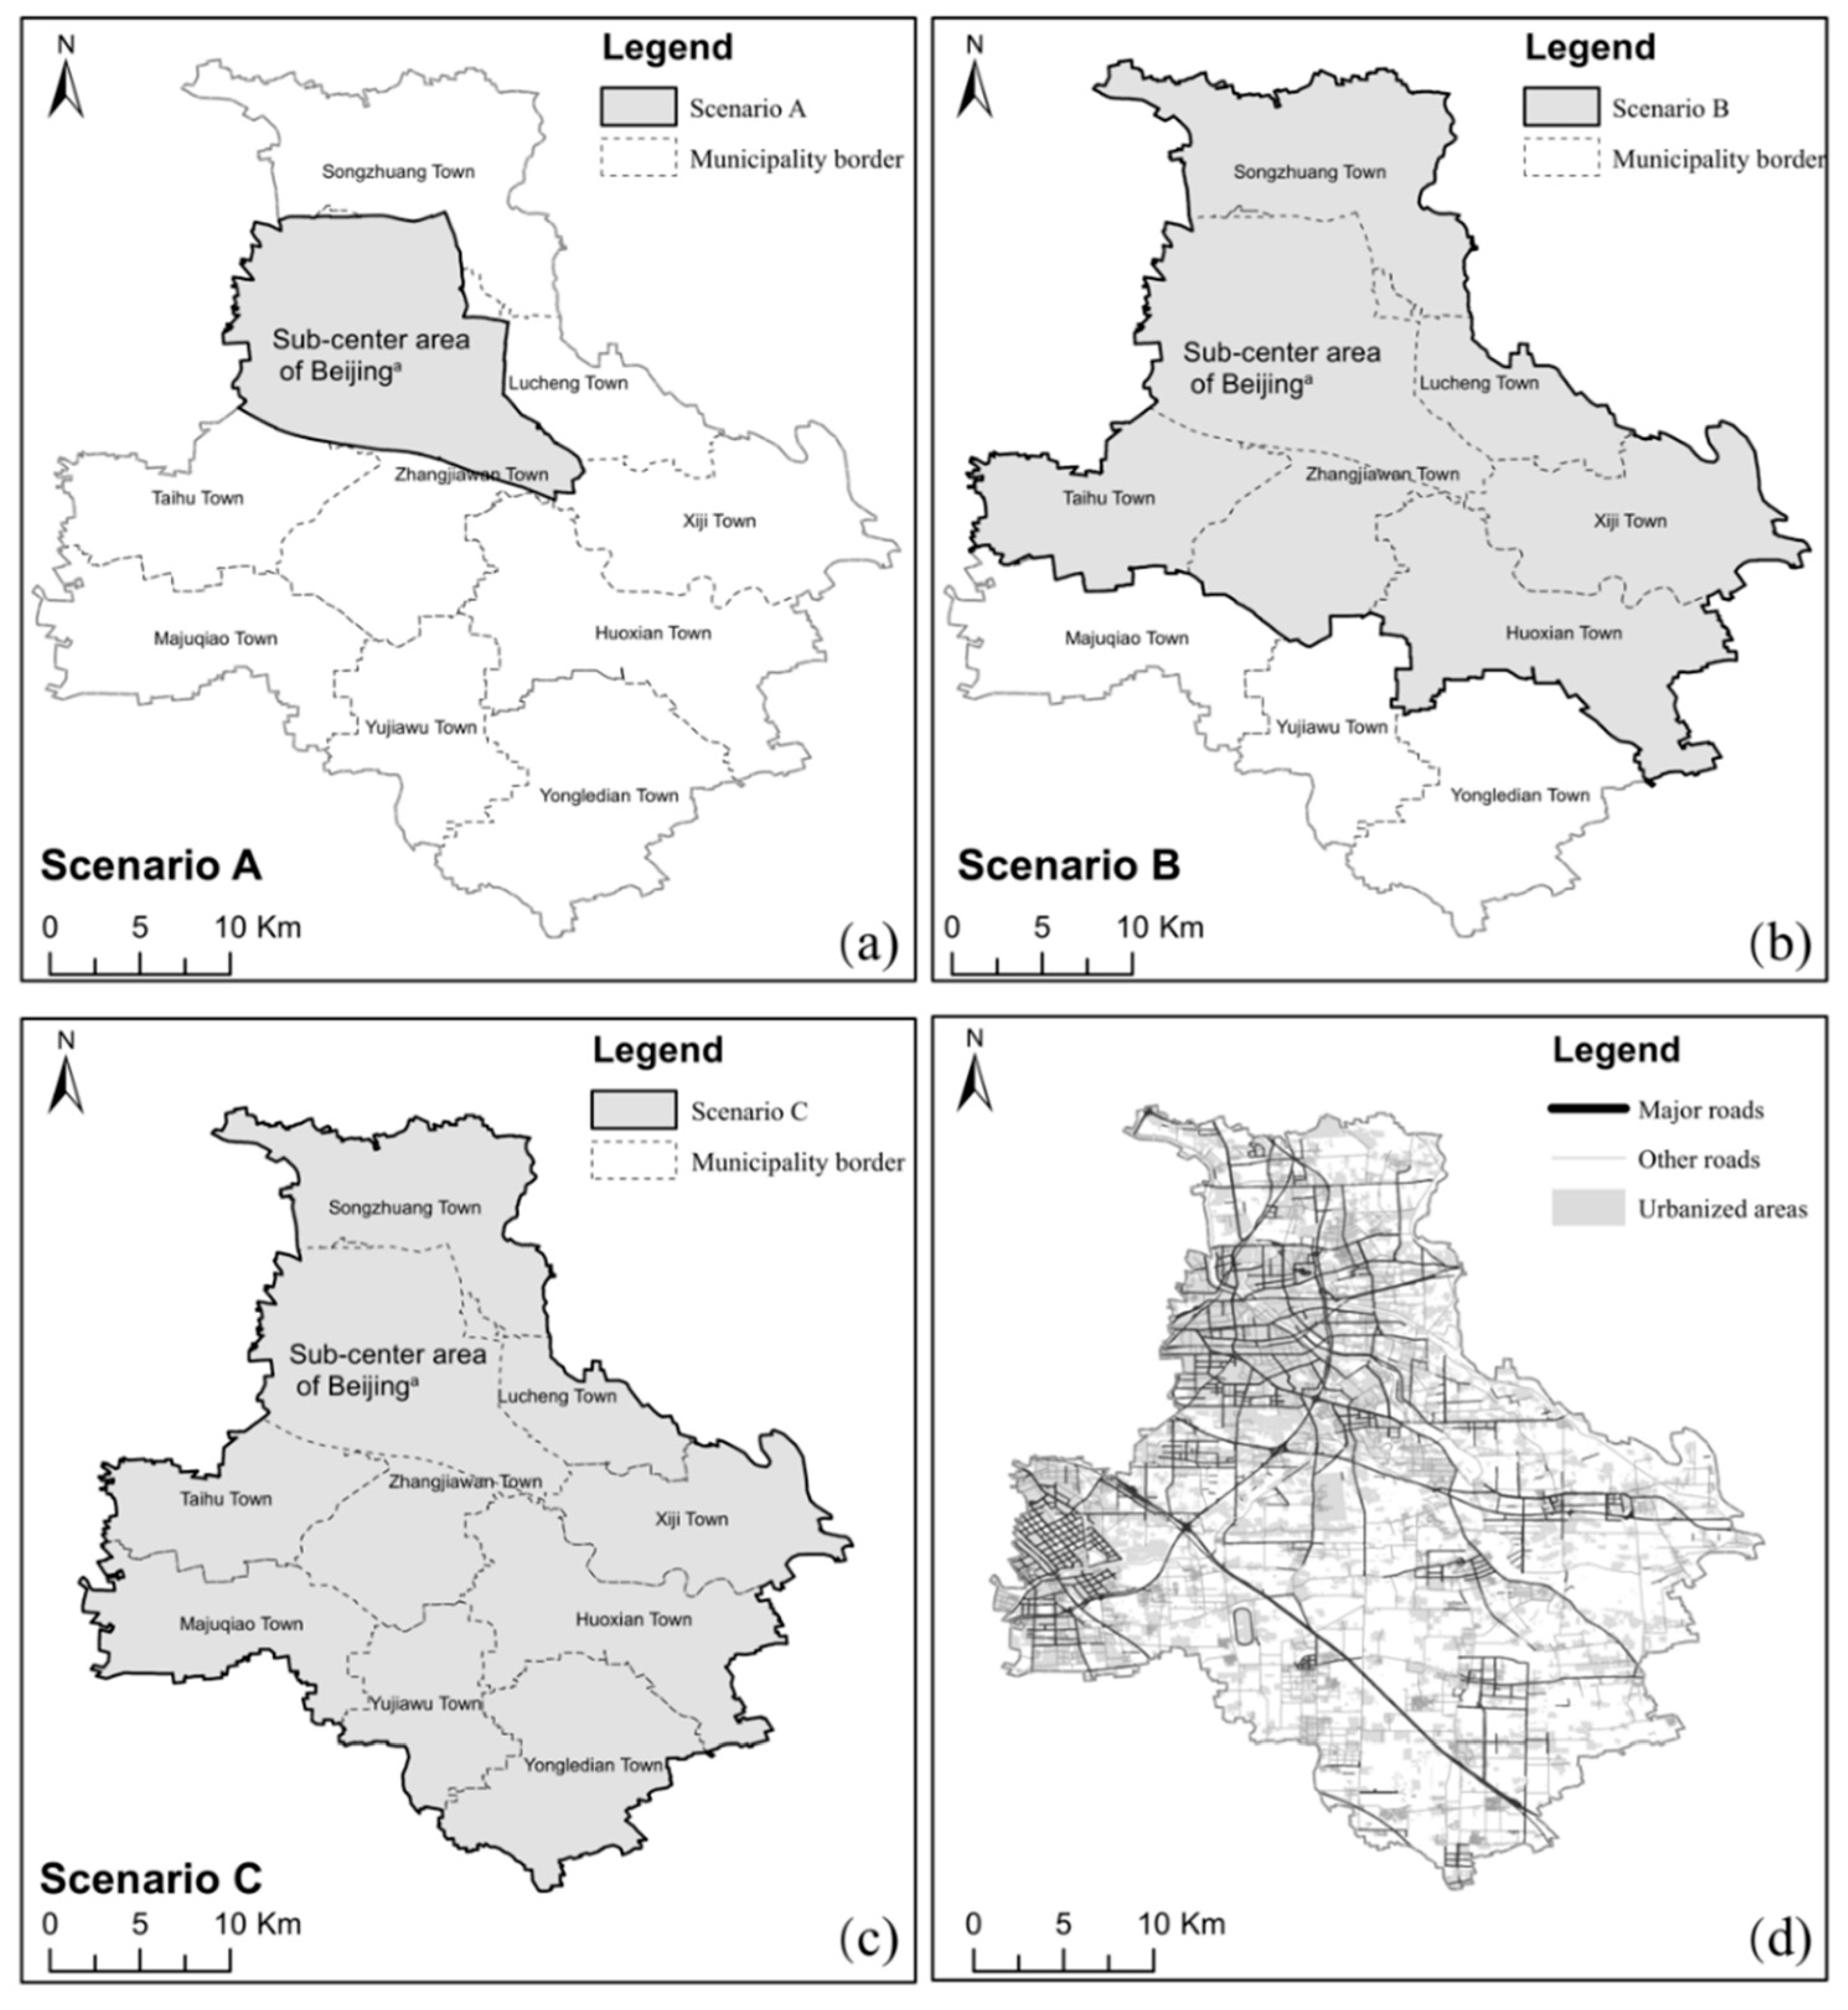
2.5. Alternative Scenarios Development

In order to detect the best land-use scale for urban planners, we conducted three alternative scenarios representing three expanding scales (Figure 3). Scenario A (Figure 3a) is the sub-center area of Beijing proposed by the Urban Master Plan of Beijing (2016–2035) [31], and we adjusted the eastern boundary to the border of BELUs. Scenario B (Figure 3b) is the aggregation of the sub-center district and its adjacent towns. Scenario C (Figure 3c) refers to the entire administrative area of Tongzhou District. Then a comparison between different scenarios based on Mastot value (see Equations (8) and (12) in Supplementary Materials for further details) was conducted. Mastot value was the total asymptotic bio-energy of the overall system. Therefore, the evolution of Mastot index described the overall ecological quality of landscape connectivity. These evolution processes were compared among the three scenarios to regard the best land-use solution to be chosen.

2.6. NUAs Assessment

For the purpose of prioritizing the conservation and restoration area, an assessment of 835 NUA patches was implemented. The 835 NUA patches were alternative areas for afforestation by the local government. Beijing Tongzhou Forestry Bureau provided the location of the NUAs. We ranked the dMtot (see Equation (13), Supplementary Materials) and ESV_B values (see Equation (14), Supplementary Materials) of the selected NUA patches. Then these patches were reclassified into three types in terms of conservation prioritization. First, the areas where both dMtot and ESV_B were zero, were called Low Priority Zones. Second, the patches with a zero dMtot index but a nonzero ESV_B index were defined as Medium Priority Zones. Third, the other regions where neither dMtot nor ESV_B was zero were named as High Priority Zones.

3. Results

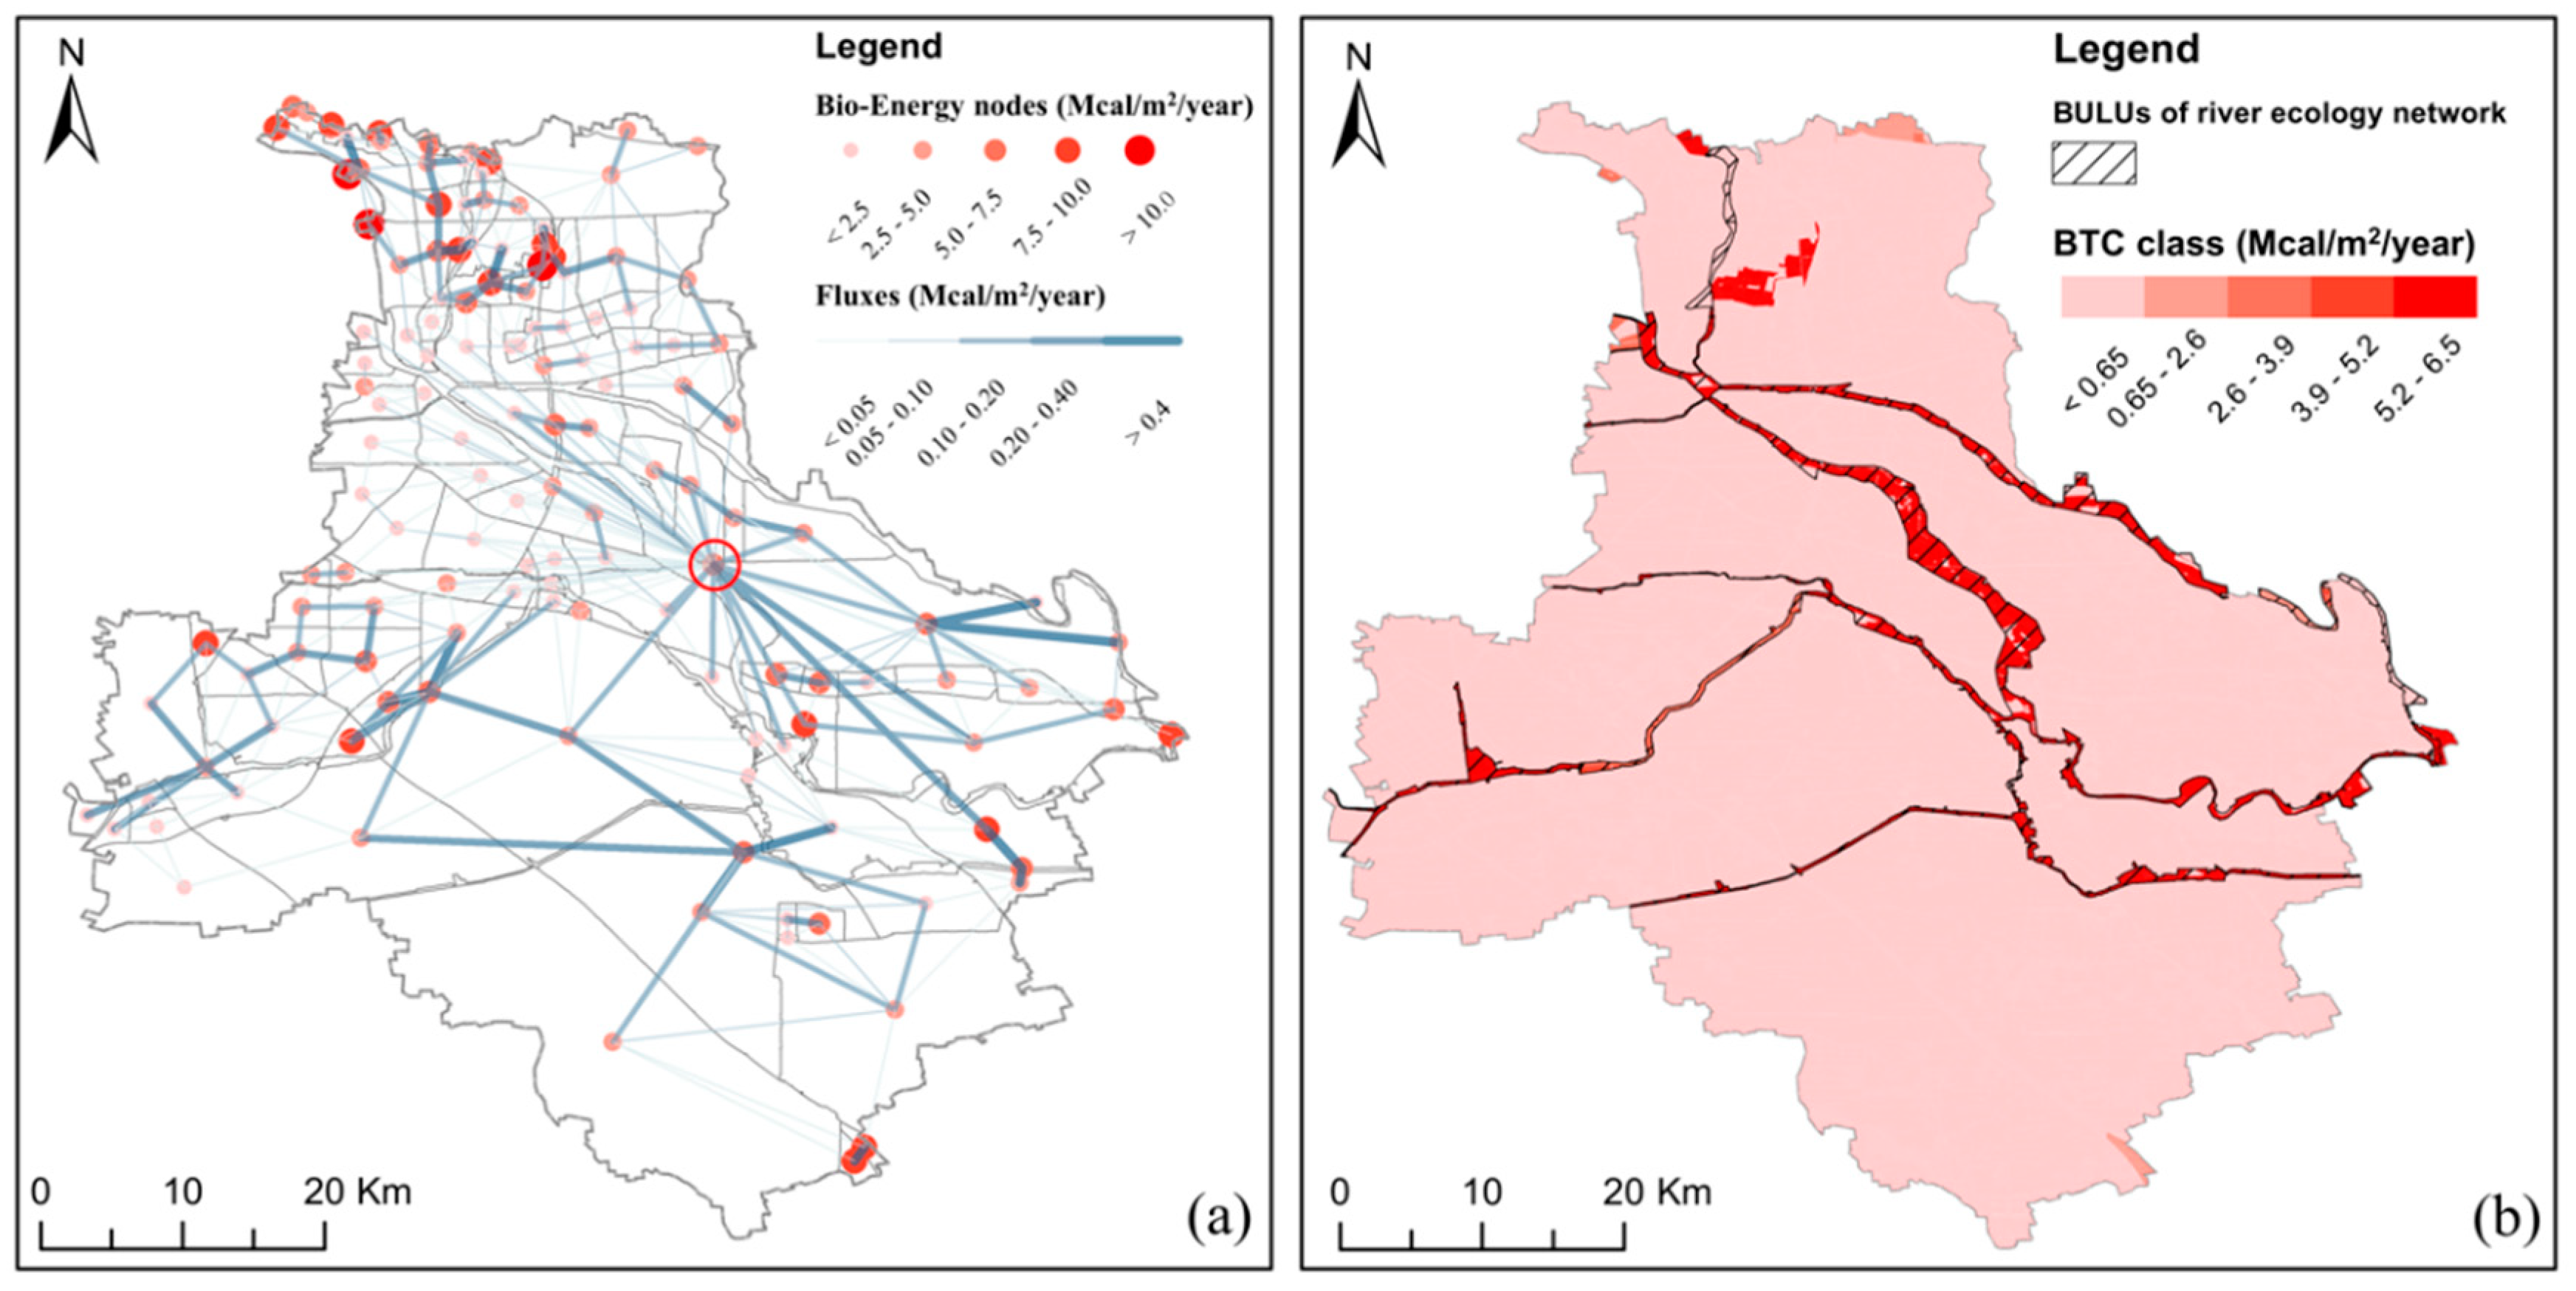
3.1. Spatial Dynamics of Bio-Energy

The bio-energy graph (Figure 4) shows the spatial dynamics of bio-energy obtained for the case study area. Nodes in Figure 4a display the normalized bio-energy of each BELU. Overall, the total bio-energy was 3.21 billion Mcal/year in 2015. Most of the high-level bio-energy BELUs (>10.0 Mcal/m2/year) were located in the northwest corner of the case study area, while the BELUs with lower bio-energy values were situated in the central areas (e.g., the sub-center area in Figure 3). Arcs in Figure 4a represent bio-energy exchange between neighboring BELUs. In general, 10.3% of the total bio-energy interacted between adjacent BELUs to maintain their landscape connectivity. The high-level bio-energy BELUs also represented high-levels of bio-energy flux. Meanwhile, the BELU 139 (marked by a red circle in Figure 4a) was the major part of the river ecology network, which associated with other 54 BELUs accounting for 42.9% of the total area. This result emphasized that BELUs of the river ecology network were more important for the landscape connectivity compared with other parts of the city ecosystem.
The result of asymptotic bio-energy values of patches is demonstrated in Figure 4b. Colors of the patches mean asymptotic values, and the more essential patches for landscape connectivity exhibit deeper color [28]. Most high asymptotic bio-energy areas (>5.2 Mcal/m2/year) were also concentrated in the river ecology network. The representation highlighted that BELUs of the river ecology network were bio-energy centers closely connecting with the remaining BELUs. Comparatively, the other areas with low asymptotic bio-energy values contributed less landscape connectivity to the whole ecosystem.
In summary, we depicted the spatial distribution, fluxes, and evolution of bio-energy, as well as landscape connectivity. The bio-energy and asymptotic bio-energy graph (Figure 4) both identified that the river ecology network was a significant location for landscape connectivity, which deserves priority conservation. In contrast, landscape fragmentation was ubiquitous in the low asymptotic bio-energy areas in response to urban sprawl.

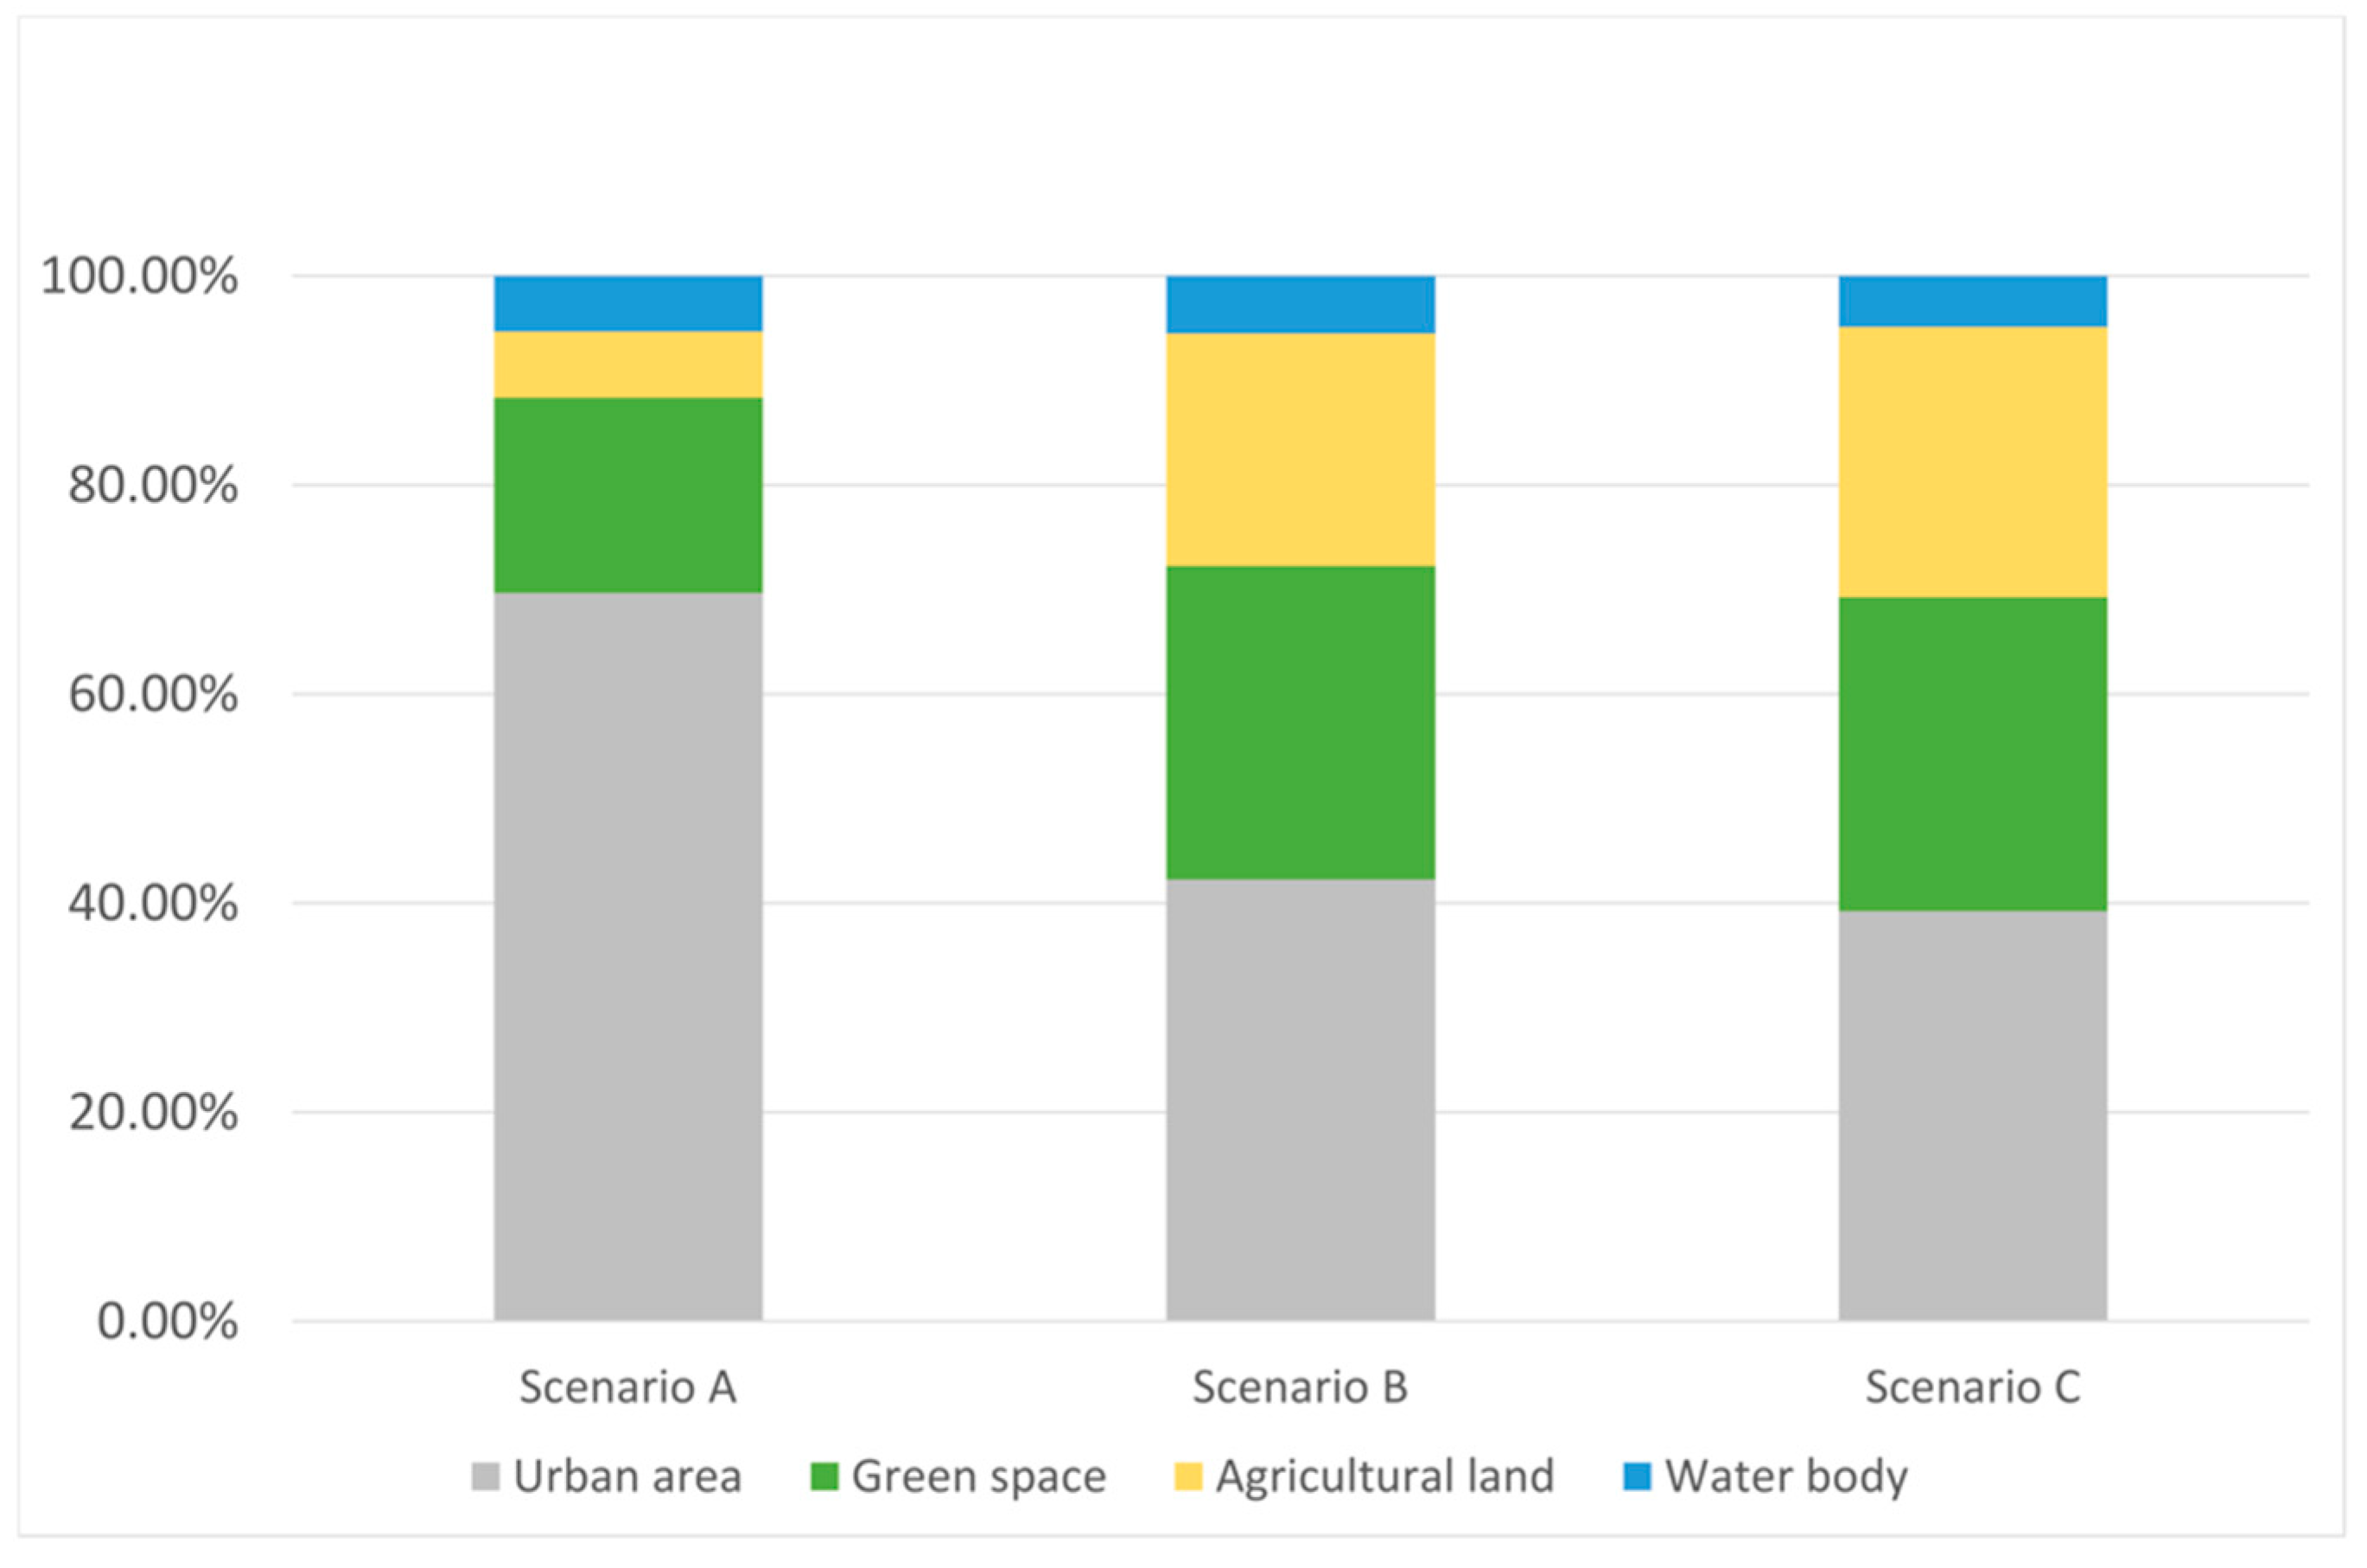
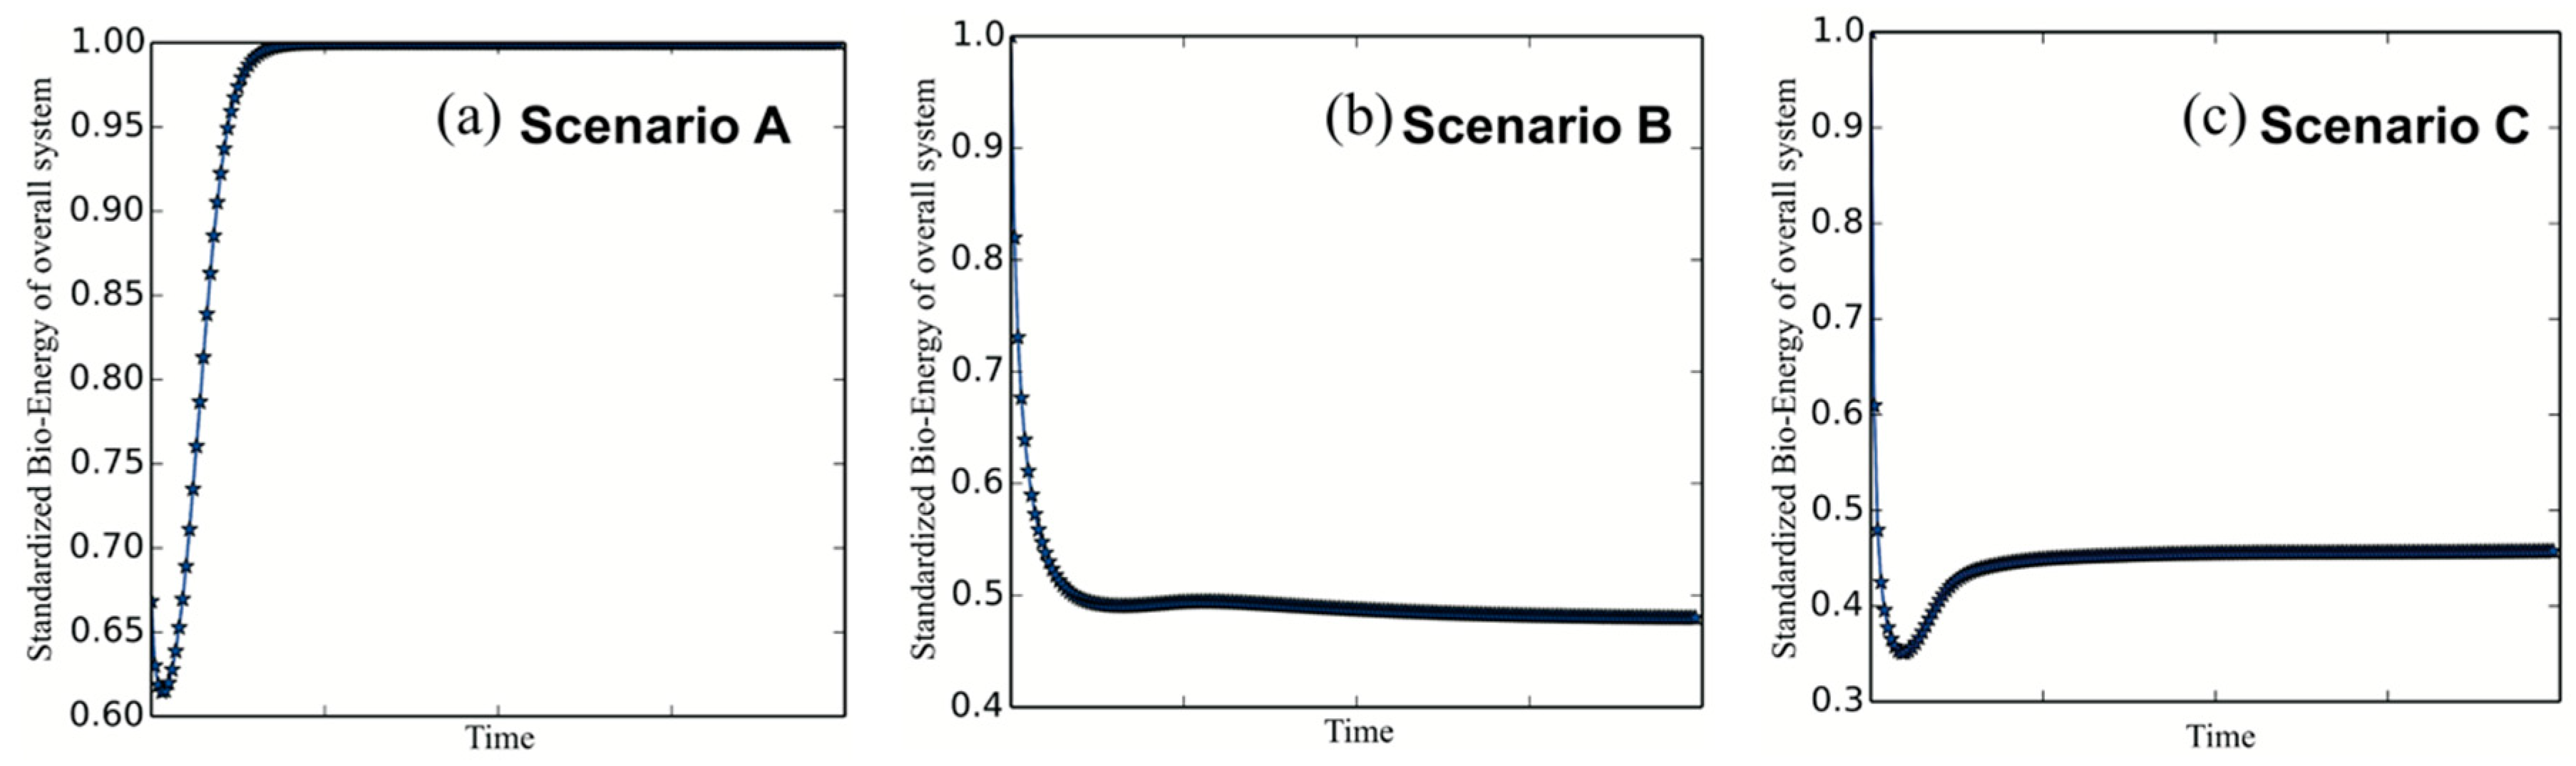
3.2. Detecting the Best Land-Use Scenarios

Land-use types and bio-energy evolution processes between three scenarios were compared to detect the best land-use scale. These three scenarios were adopted, representing three urban planning scales (Figure 3). Scenario A (Figure 3a) denoted a downtown scale with an area of 143.87 km2. Scenario B (Figure 3b) referred to an intermediate scale with an area of 647.99 km2. Scenario C (Figure 3c) stood for a landscape scale with an area of 906.5 km2. The expanding among Scenarios A to C expressed the urban sprawl process traditionally adopted by planning practice. Figure 5 shows the land-use variations in response to urbanization among three planning scales. The downtown Scenario A was the most urbanized area, which had a proportion of urban areas as high as 69.95% and the green space only accounting for 18.71%. In contrast, the urbanization ratios of Scenarios B and C were lower than that of Scenario A, and the proportions of green space of Scenarios B and C were higher than that of Scenario A. These spatial urban expansion processes between Scenario A to C indicated that green space decreased in reaction to urbanization.
However, the bio-energy evolution in terms of Mastot index (Figure 6) indicated a positive process trend for Scenario A, which had higher standardized Mastot values during the asymptotic process compared with Scenarios B and C. These results indicated that Scenario A had the best overall ecological quality of landscape connectivity. Comparatively, Scenario B had the worst evolution process with relatively low standardized Mastot values. Thus, though Scenario A was a high urbanization area, Scenario A had a better ecological quality of landscape connectivity than Scenarios B and C. Instead, Scenario B was identified to be a critical area for restoration. Some policies aimed at reasonably limiting urban sprawl should be conducted out of the sub-center area. Additionally, some conservation and restoration measures should be planned in the area of Scenario B to improve landscape connectivity.
In summary, we broadly detected the best land-use scale for planners among three urban sprawl scenarios. The comparison between different scenarios implied that rapid urbanization has caused green space decreasing. Furthermore, the downtown scale, Scenario A, was the best land-use scale. Some policies aimed at reasonable limiting urban sprawl and green space renewal projects should be conducted in the area out of Scenario A.

3.3. Identification and Priority Ranking of Critical Areas from NUAs

To identify the critical areas for prioritizing conservation and restoration, 835 alternative afforestation patches were selected and evaluated. NUAs assessment based on dMtot and ESV_B indexes is illustrated in Figure 7. With dMtot ranking (Figure 7a), the top ten patch numbers were 412, 27, 820, 176, 301, 331, 51, 270, 254, and 265. Almost all high dMtot level patches (deeper red in Figure 7a) concentratedly distributed on the banks of the Beijing–Hangzhou Grand Canal. While the patches numbered 412, 27, 820, 176, 419, 197, 560, 301, 331, and 243 were sequentially ranked as the top ten ESV_B values (Figure 7b). The patches of high ecosystem services values (deeper red in Figure 7b) were scattered on the southeast side Beijing–Hangzhou Grand Canal. These results indicated that the river ecological network was the critical area for landscape connectivity and ecosystem services due to its bio-physical characteristics.
Then we reclassified the 835 NUAs in terms of dMtot and ESV_B indexes into three types (Figure 8).
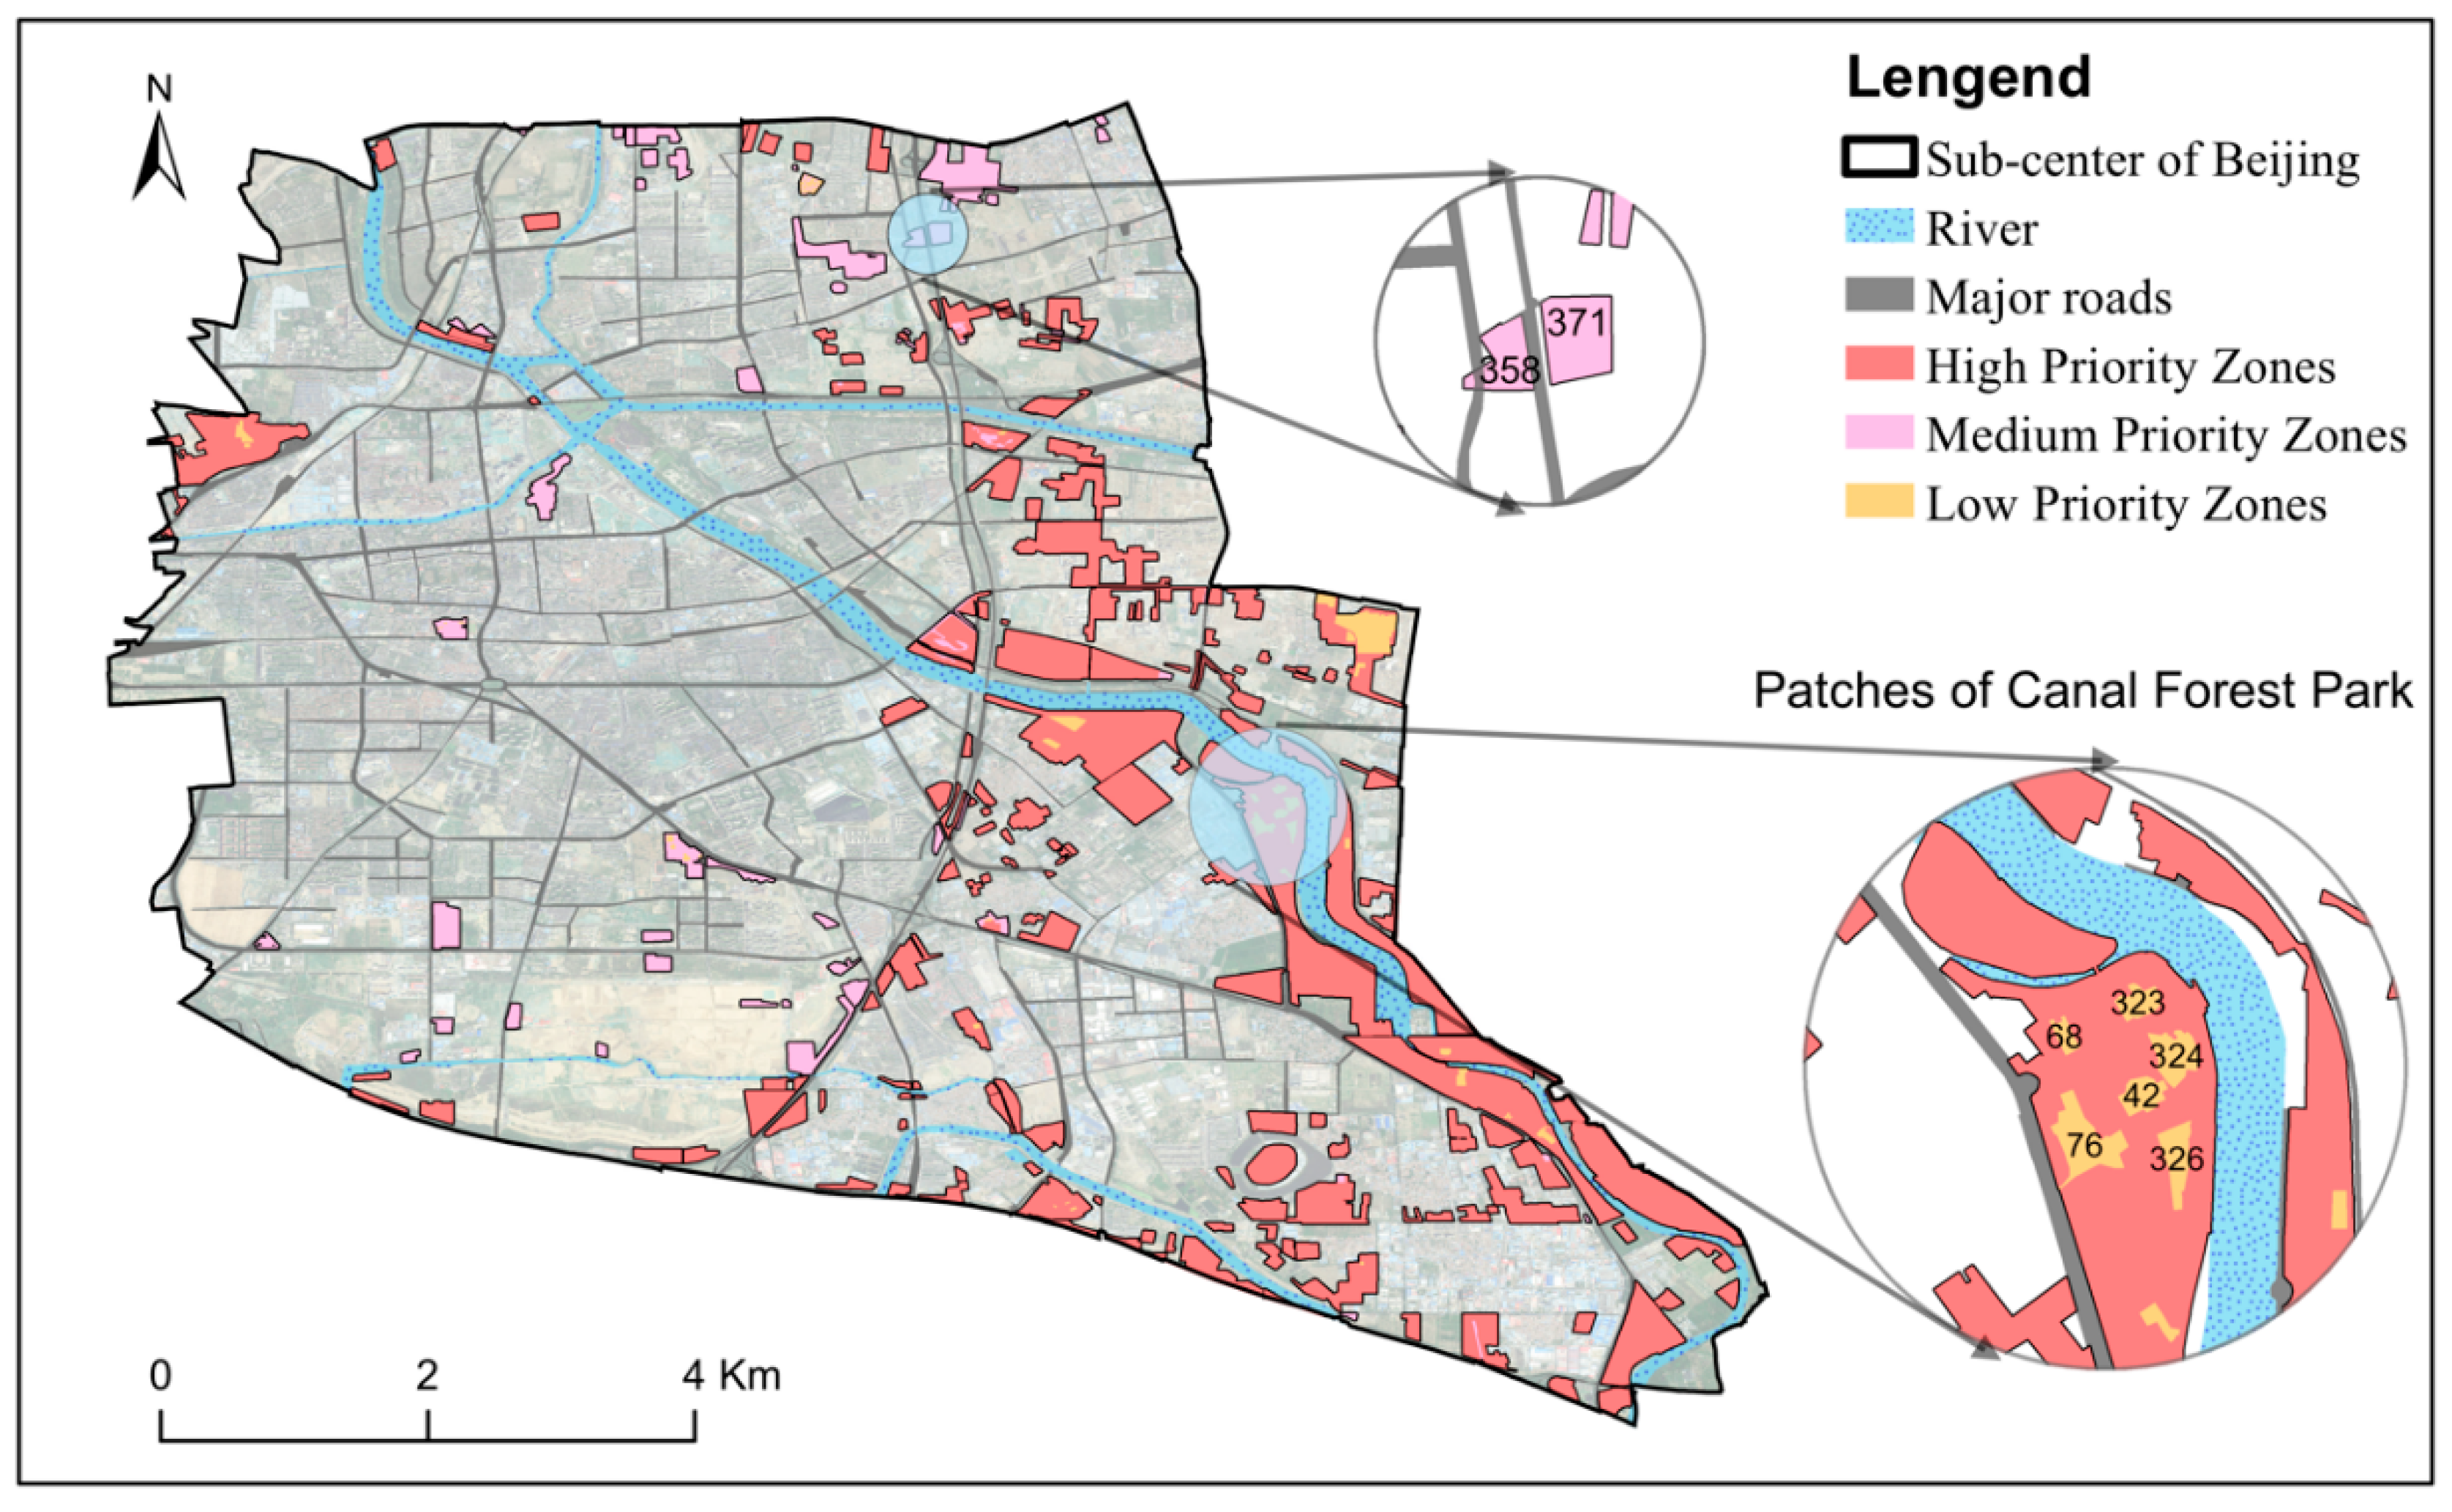
  • Low Priority Zones were the zero ESV_B areas. These zones consisted of artificial surface patches in NUAs. For example, the patches numbered 42, 68, 76, 323, 324, and 326 in Figure 8 are some buildings in a park. High Priority Zones surrounded most of the zones. Low Priority Zones should be reasonably utilized by inhabitants living around here. Current non-green patches to be alternatively changed to urban can be detected from these zones.
  • Medium Priority Zones with zero dMtot values but nonzero ESV_B values were caused by the isolation of urban fabric and major road networks. For instance, No. 358 and 311 patches in Figure 8 are cut off by the Sixth Ring Road thus lost the connectivity factor (dMtot index). Most districts of the zones were isolated patches. To increase landscape connectivity within Medium Priority Zones, we should add some new elements like ecological corridors to the zones in current urban patches surrounding these zones, which can best improve the landscape quality.
  • High Priority Zones were regions where green space was concentrated and contiguous. From a nature conservation and sustainability perspective, High Priority Zones were found to be the most important areas devoting to the overall city ecosystem. Some well-designed parks were included in the zones, such as Canal Forest Park in Figure 8. These zones were the priority protected districts for decision-makers. In the case of urbanization and related land-use change programs (e.g., road building, house construction) occurring in these zones, accurate environmental assessment should be implemented to avoid decreasing landscape connectivity.

4. Discussion

4.1. Impacts of Urbanization on Natural Ecosystems

4.1.1. Landscape Fragmentation Caused by Urbanization

Landscape fragmentation, one of the consequences of urban expansion [41], is due to the patches of lost landscape connectivity through the spread of artificial surfaces [42]. Landscape connectivity can be measured not only by the characteristics of the landscape (structural connectivity), but also by the organism mobility (functional connectivity) [43]. Lots of studies have figured out that urbanization has caused the results of landscape fragmentation functionally and structurally [44,45,46]. For instance, landscape fragmentation resulting from urban expansion took place in Haidian District, Beijing, China [21]. In the current study, our results suggest that landscape fragmentation (low asymptotic bio-energy patches in Figure 4b) is occurring in our case study area as a result of rapid urbanization. Although green space covered 29.2% of Tongzhou District (Table 2 and Figure 5), most patches presented relatively low structural landscape connectivity due to isolation by artificial surfaces.

4.1.2. Spatial Reduction of Green Space in Response to Urbanization

Many studies have demonstrated that green space always decreases in response to urbanization [47,48,49]. Here, green space generally belongs to a natural or semi-natural open space with considerable vegetation coverage [50], including woodland (forest), grassland, and farmland [51]. For example, many Chinese cities, such as Dalian [49,52], Kunming [47], and Jinghong [23], have suffered temporal and spatial patterns of green space reduction in response to urbanization. In our study, the spatial relationship between the urban area and green space is broadly consistent with these studies. Figure 5 shows the spatial reduction of green space in response to urbanization among three planning scales. Among Scenarios A to C, the highly urbanized Scenario A generally had lower levels of urban greening than Scenarios B and C. Meanwhile, the relatively large bio-energy nodes in Figure 4a were generally distributed outside the downtown area. These results both suggest that urban development may reduce green space.

4.2. The Importance of Green Space Beside the River Network

Rivers in urban areas play an essential role in ecosystem services of many city ecosystems [18,28,53,54]. In this paper, the estimation of asymptotic values for bio-energy (Figure 4b) suggests BELUs of the river ecology network are also the most important ecological belt in the ecosystem. In addition, High Priority Zones in Figure 8 are concentrated on the sides of the Beijing–Hangzhou Grand Canal. Thus, both the asymptotic bio-energy map and the prioritization conservation map reveal that the river ecology network is a critical part for ecosystem services and bio-energy landscape connectivity in the case study area. However, the area of green space in the river ecology network represents only 7.95% of the green space among the overall ecosystem. Thus, these critical areas deserve careful environmental assessment in case of urban development or relevant land-use change programs [18]. Moreover, an increase of landscape connectivity of other green spaces to the river ecology network should be designed for the future development of urban forestry projects.

4.3. Contributions to the Literature

The current study applied and improved a new method, the PANDORA model, to evaluate urban green space based on bio-energy landscape connectivity. We believe that the viewpoint of landscape connectivity can efficiently promote studies and projects related to urban planning and biodiversity conservation at different spatiotemporal scales. Although other methods, such as FRAGSTATS (University of Massachusetts Amherst, Amherst, USA) [55] and Conefor Sensinode software (University of Lleida, Lleida, Spain) [56], alternatively provide arithmetic for calculation of landscape connectivity, PANDORA model solves the problem of data scarcity, using data that are usually available to land managers (e.g., remote sensing images, digital elevation models). Compared with other ecosystem services models (e.g., the InVEST [24], SPAN [25], and MIMES models [26]), PANDORA focuses on bio-energy interactions and landscape connectivity between patches. Urban planners could recognize whether the landscape fragmentation resulting from urbanization could take place in their cities. Ecologists can apply the model to ecosystem services related to landscape connectivity for biodiversity conservation purposes in urban contexts [18].

5. Conclusions

In this paper, we used an innovative approach, the PANDORA model, to evaluate the green space of Tongzhou District based on bio-energy landscape connectivity. We have achieved three main scientific goals (see the last sentence of the Section 1). Conclusions obtained from the three scientific goals show that:
  • Landscape fragmentation is ubiquitous in the rapid urbanization areas resulting from the urban sprawl;
  • Rapid urbanization has reduced green spaces;
  • The river ecology network is a significant area for landscape connectivity;
  • Urban planners and biologists can apply our method to evaluate urban green space and identify conservation or restoration priority areas, and thus help decision-makers to achieve a sustainable development strategy in a rapidly urbanizing area.

Supplementary Materials

The following are available online at https://www.mdpi.com/2071-1050/11/18/4943/s1, Supplementary calculation of PANDORA model.

Author Contributions

The authors of K.W. and X.G. contributed equally to this study. Data curation, K.W. and X.G.; Formal analysis, K.W. and X.G.; Methodology, K.W. and X.L.; Project administration, K.W. and X.L.; Resources, K.L.; Software, X.G.; Supervision, K.L.; Writing—original draft, K.W.; Writing—review & editing, X.G.

Funding

This research was funded by RESEARCH AND DEMONSTRATION OF KEY TECHNOLOGIES FOR SYSTEM CONSTRUCTION OF THE CAPITAL NATIONAL PARK, grant number Z161100001116084, and NATIONAL NATURAL SCIENCE FOUNDATION OF CHINA, grant number 31972944.

Acknowledgments

Thanks to Guangming He of Michigan State University for scientific inputs. Thanks to Majda Aouititen of Beijing Forestry University for language polishing. Thanks to Beijing Tongzhou Forestry Bureau sharing for the forest resource inventory database.

Conflicts of Interest

The authors declare no conflict of interest.

References

  1. Rana, M.M.P. Urbanization and sustainability: Challenges and strategies for sustainable urban development in Bangladesh. Environ. Dev. Sustain. 2011, 13, 237–256. [Google Scholar] [CrossRef]
  2. Sandström, U.G. Green infrastructure planning in urban Sweden. Plan. Pract. Res. 2002, 17, 373–385. [Google Scholar] [CrossRef]
  3. Heymans, A.; Breadsell, J.; Morrison, G.M.; Byrne, J.J.; Eon, C. Ecological Urban Planning and Design: A Systematic Literature Review. Sustainability 2019, 11, 3723. [Google Scholar] [CrossRef]
  4. Champion, T.; Hugo, G.; Zlotnik, H. World Urbanization: Trends and Prospects. In New Forms of Urbanization; Routledge: Abingdon, UK, 2018; pp. 43–64. [Google Scholar]
  5. Wu, H.; Liu, L.; Yu, Y.; Peng, Z. Evaluation and planning of urban green space distribution based on mobile phone data and two-step floating catchment area method. Sustainability 2018, 10, 214. [Google Scholar] [CrossRef]
  6. Roppongi, H. Tokyo, Japan: Low-carbon policy for buildings. In Urbanization and Climate Co-Benefits: Implementation of Win-Win Interventions in Cities; CRC Press: Boca Raton, FL, USA, 2017; pp. 125–129. ISBN 9781317357711. [Google Scholar]
  7. Morley, P.M. Urban Forestry in North York. For. Chron. 2014, 64, 360–364. [Google Scholar] [CrossRef]
  8. Capotorti, G.; Mollo, B.; Zavattero, L.; Anzellotti, I.; Celesti-Grapow, L. Setting priorities for urban forest planning. A comprehensive response to ecological and social needs for the metropolitan area of Rome (Italy). Sustainability 2015, 7, 3958–3976. [Google Scholar] [CrossRef]
  9. Breuste, J.H. Decision making, planning and design for the conservation of indigenous vegetation within urban development. Landsc. Urban Plan. 2004, 68, 439–452. [Google Scholar] [CrossRef]
  10. Bolund, P.; Hunham, S. Ecosystem services in urban areas. Ecol. Econ. 1999, 29, 293–301. [Google Scholar] [CrossRef]
  11. Tratalos, J.; Fuller, R.A.; Warren, P.H.; Davies, R.G.; Gaston, K.J. Urban form, biodiversity potential and ecosystem services. Landsc. Urban Plan. 2007, 83, 308–317. [Google Scholar] [CrossRef]
  12. Haines-Young, R.; Potschin, M. Common International Classification of Ecosystem Services (CICES): Consultation on Version 4, August–December 2012; Report to the European Environment Agency; BSS/07/007; European Environment Agency: København, Denmark, 2013. Available online: www.cices.eu (accessed on 8 September 2019).
  13. Locosselli, G.M.; Camargo, E.P.; Moreira, T.C.L.; Todesco, E.; de Andrade, M.F.; André, C.D.S.; André, P.A.; Singer, J.M.; Ferreira, L.S.; Saldiva, P.H.N.; et al. Effects of climate and air pollution on the growth of urban trees. In Proceedings of the 10th World Dendro Conference, Thimphu, Bhutan, 2–22 June 2018; Elsevier: Amsterdam, The Netherlands, 2018; Volume 666, pp. 652–661. [Google Scholar]
  14. Li, X.; Zhou, W.; Ouyang, Z.; Xu, W.; Zheng, H. Spatial pattern of greenspace affects land surface temperature: Evidence from the heavily urbanized Beijing metropolitan area. China. Landsc. Ecol. 2012, 27, 887–898. [Google Scholar] [CrossRef]
  15. Islam, M.N.; Rahman, K.S.; Bahar, M.M.; Habib, M.A.; Ando, K.; Hattori, N. Pollution attenuation by roadside greenbelt in and around urban areas. Urban For. Urban Green. 2012, 11, 460–464. [Google Scholar] [CrossRef]
  16. Zhang, B.; di Xie, G.; Li, N.; Wang, S. Effect of urban green space changes on the role of rainwater runoff reduction in Beijing, China. Landsc. Urban Plan. 2015, 140, 8–16. [Google Scholar] [CrossRef]
  17. Kong, F.; Yin, H.; Nakagoshi, N. Using GIS and landscape metrics in the hedonic price modeling of the amenity value of urban green space: A case study in Jinan City, China. Landsc. Urban Plan. 2007, 79, 240–252. [Google Scholar] [CrossRef]
  18. Pelorosso, R.; Gobattoni, F.; Geri, F.; Monaco, R.; Leone, A. Evaluation of Ecosystem Services related to Bio-Energy Landscape Connectivity (BELC) for land use decision making across different planning scales. Ecol. Indic. 2016, 61, 114–129. [Google Scholar] [CrossRef]
  19. Nesticò, A.; Guarini, M.R.; Morano, P.; Sica, F. An economic analysis algorithm for urban forestry projects. Sustainability 2019, 11, 314. [Google Scholar] [CrossRef]
  20. Nesticò, A.; Sica, F. The sustainability of urban renewal projects: A model for economic multi-criteria analysis. J. Prop. Invest. Finance 2017, 35, 397–409. [Google Scholar] [CrossRef]
  21. Guo, S.; Saito, K.; Yin, W.; Su, C. Landscape connectivity as a tool in green space evaluation and optimization of the Haidan District, Beijing. Sustainability 2018, 10, 1979. [Google Scholar] [CrossRef]
  22. Kabisch, N.; Qureshi, S.; Haase, D. Human-environment interactions in urban green spaces—A systematic review of contemporary issues and prospects for future research. Environ. Impact Assess. Rev. 2015, 50, 25–34. [Google Scholar] [CrossRef]
  23. Cheng, F.; Liu, S.; Hou, X.; Zhang, Y.; Dong, S. Response of bioenergy landscape patterns and the provision of biodiversity ecosystem services associated with land-use changes in Jinghong County, Southwest China. Landsc. Ecol. 2018, 33, 783–798. [Google Scholar] [CrossRef]
  24. Daily, G.C.; Polasky, S.; Goldstein, J.; Kareiva, P.M.; Mooney, H.A.; Pejchar, L.; Ricketts, T.H.; Salzman, J.; Shallenberger, R. Ecosystem services in decision making: Time to deliver. Front. Ecol. Environ. 2009, 7, 21–28. [Google Scholar] [CrossRef]
  25. Bagstad, K.J.; Johnson, G.W.; Voigt, B.; Villa, F. Spatial dynamics of ecosystem service flows: A comprehensive approach to quantifying actual services. Ecosyst. Serv. 2013, 4, 117–125. [Google Scholar] [CrossRef]
  26. Boumans, R.; Altman, I.; Kaufman, L.; van den Belt, M. Multiscale Integrated Modeling of Ecosystems Services (MIMES): Simulating interactions of coupled human and natural systems. Ecosyst. Serv. 2015. [Google Scholar] [CrossRef]
  27. Ng, C.N.; Xie, Y.J.; Yu, X.J. Integrating landscape connectivity into the evaluation of ecosystem services for biodiversity conservation and its implications for landscape planning. Appl. Geogr. 2013, 42, 1–12. [Google Scholar] [CrossRef]
  28. Pelorosso, R.; Gobattoni, F.; Geri, F.; Leone, A. PANDORA 3.0 plugin: A new biodiversity ecosystem service assessment tool for urban green infrastructure connectivity planning. Ecosyst. Serv. 2017, 26, 476–482. [Google Scholar] [CrossRef]
  29. Pelorosso, R.; Gobattoni, F.; Geri, F.; Monaco, R.; Leone, A. Bio-Energy Connectivity and Ecosystem Services. An assessment by PANDORA3.0 model for land use decision making. J. Land Use Mobil. Environ. 2014. [Google Scholar] [CrossRef]
  30. Zhang, H.Z.; Li, H.; Wang, Z.; Zhou, L.D. Accumulation characteristics of copper and cadmium in greenhouse vegetable soils in Tongzhou district of Beijing. Procedia Environ. Sci. 2011, 10, 289–294. [Google Scholar] [CrossRef]
  31. Beijing Municipal Government. Urban Master Plan of Beijing (2016–2035); Beijing Municipal Government: Beijing, China, 2017; p. 86.
  32. Li, Y. Beijing’s future mapped out for two decades. China Daily, 18 October 2017; 14. [Google Scholar]
  33. Xin, W. Beijing to launch second phase of sub-center construction. China Daily, 14 January 2019. [Google Scholar]
  34. Manager, L. ArcGIS 10. 2 for Desktop; ESRI: Redlands, CA, USA, 2011. [Google Scholar]
  35. Pelorosso, R.; Gobattoni, F. PANDORA 3.0 Model Setup; PANDORA: Copenhagen, Denmark, 2016. [Google Scholar]
  36. QGIS Development Team. QGIS Geographic Information System; Open Source Geospatial Foundation Project; OSGeo: Chicago, IL, USA, 2013. [Google Scholar]
  37. Gobattoni, F.; Pelorosso, R.; Lauro, G.; Leone, A.; Monaco, R. A procedure for mathematical analysis of landscape evolution and equilibrium scenarios assessment. Landsc. Urban Plan. 2011, 103, 289–302. [Google Scholar] [CrossRef]
  38. Bultheel, A.; Cools, R.; Butcher, J.C. Numerical Methods for Ordinary Differential Equations: Early Days; John Wiley & Sons: Hoboken, NJ, USA, 2010; ISBN 1119121507. [Google Scholar]
  39. Gobattoni, F.; Groppi, M.; Monaco, R.; Pelorosso, R. New Developments and Results for Mathematical Models in Environment Evaluations. Acta Appl. Math. 2014, 132, 321–331. [Google Scholar] [CrossRef]
  40. Gobattoni, F.; Lauro, G.; Monaco, R.; Pelorosso, R. Mathematical models in landscape ecology: Stability analysis and numerical tests. Acta Appl. Math. 2013, 125, 173–192. [Google Scholar] [CrossRef]
  41. Tannier, C.; Foltête, J.C.; Girardet, X. Assessing the capacity of different urban forms to preserve the connectivity of ecological habitats. Landsc. Urban Plan. 2012, 105, 128–139. [Google Scholar] [CrossRef]
  42. Tischendorf, L.; Fahrig, L. How should we measure landscape connectivity? Landsc. Ecol. 2000, 15, 633–641. [Google Scholar] [CrossRef]
  43. Adriaensen, F.; Chardon, J.P.; De Blust, G.; Swinnen, E.; Villalba, S.; Gulinck, H.; Matthysen, E. The application of “least-cost” modelling as a functional landscape model. Landsc. Urban Plan. 2003, 64, 233–247. [Google Scholar] [CrossRef]
  44. Gao, J.; Li, S. Detecting spatially non-stationary and scale-dependent relationships between urban landscape fragmentation and related factors using Geographically Weighted Regression. Appl. Geogr. 2011, 31, 292–302. [Google Scholar] [CrossRef]
  45. Fan, C.; Myint, S. A comparison of spatial autocorrelation indices and landscape metrics in measuring urban landscape fragmentation. Landsc. Urban Plan. 2014, 121, 117–128. [Google Scholar] [CrossRef]
  46. Gandy, M. Landscapes of disaster: Water, modernity, and urban fragmentation in Mumbai. Environ. Plan. A 2008, 40, 108–130. [Google Scholar] [CrossRef]
  47. Zhou, X.; Wang, Y.C. Spatial-temporal dynamics of urban green space in response to rapid urbanization and greening policies. Landsc. Urban Plan. 2011, 100, 268–277. [Google Scholar] [CrossRef]
  48. Byomkesh, T.; Nakagoshi, N.; Dewan, A.M. Urbanization and green space dynamics in Greater Dhaka, Bangladesh. Landsc. Ecol. Eng. 2012, 8, 45–58. [Google Scholar] [CrossRef]
  49. Yang, J.; Sun, J.; Ge, Q.; Li, X. Assessing the impacts of urbanization-associated green space on urban land surface temperature: A case study of Dalian, China. Urban For. Urban Green. 2017, 22, 1–10. [Google Scholar] [CrossRef]
  50. Kabisch, N.; Haase, D. Green spaces of European cities revisited for 1990–2006. Landsc. Urban Plan. 2013, 110, 113–122. [Google Scholar] [CrossRef]
  51. Xu, L.; You, H.; Li, D.; Yu, K. Urban green spaces, their spatial pattern, and ecosystem service value: The case of Beijing. Habitat Int. 2016, 56, 84–95. [Google Scholar] [CrossRef]
  52. Yang, J.; Guan, Y.; Xia, J.C.; Jing, C.; Li, X. Spatiotemporal variation characteristics of green space ecosystem service value at urban fringes: A case study on Ganjingzi District in Dalian, China. Sci. Total Environ. 2018, 639, 1453–1461. [Google Scholar] [CrossRef] [PubMed]
  53. Everard, M.; Moggridge, H.L. Rediscovering the value of urban rivers. Urban Ecosyst. 2012, 15, 293–314. [Google Scholar] [CrossRef]
  54. Jane, S.; Taylor, M.P.; Patrick, M. Why rehabilitate urban river systems? Area 2015, 38, 312–325. [Google Scholar]
  55. McGarigal, K.; Marks, B.J. FRAGSTATS: Spatial pattern analysis program for quantifying landscape structure. Gen. Tech. Rep. US Dep. Agric. For. Serv. 1995, 351. [Google Scholar] [CrossRef]
  56. Saura, S.; Torné, J. Conefor Sensinode 2.2: A software package for quantifying the importance of habitat patches for landscape connectivity. Environ. Model. Softw. 2009, 24, 135–139. [Google Scholar] [CrossRef]
Figure 1. Location of the study area: Tongzhou District, Beijing, China.
Sustainability 11 04943 g001
Figure 2. The theoretical framework of our study. Equations (1) to (14) are in Supplementary Materials.
Sustainability 11 04943 g002
Figure 3. (ac) The three alternative scenarios. (d) Road networks and urbanized areas in our study. a We adjusted the eastern boundary of sub-center area of Beijing to the border of bio-energy landscape units (BELUs).
Sustainability 11 04943 g003
Figure 4. (a) Bio-energy graph. BELU 139 is marked by a red circle. (b) Asymptotic bio-energy graph.
Sustainability 11 04943 g004
Figure 5. Percentages of land-use types of the three scenarios.
Sustainability 11 04943 g005
Figure 6. The standardized bio-energy over simulation steps. (a) Scenario A. (b) Scenario B. (c) Scenario C.
Sustainability 11 04943 g006
Figure 7. Spatial visualization of non-urbanized areas (NUAs) based on (a) dMtot and (b) ESV_B. The number indicates the ID of a NUA patch.
Sustainability 11 04943 g007
Figure 8. Priority conservation map of urban green space among 835 NUAs. The number indicates the ID of a NUA patch.
Sustainability 11 04943 g008
Table 1. Data sources and descriptions.
DateData SourceData TypeDescription
Forest resource inventory databaseBeijing Tongzhou Forestry BureauPolygon shape fileForest location, forest types, forest conservation types (ranging from non-conservation (grade IV) to highest conservation (grade I)), vegetation coverage, forest origins, agricultural area location, water body location
Artificial surfaces land-use databaseBeijing Qianfan Shijing Technology CompanyPolygon shape fileBuilding types and location, road types and location, railway types and location
Soil mapBeijing Tongzhou Forestry BureauPolygon shape fileSoil types, textures, thickness
Administrative dataBeijing Municipal Bureau of Land and Resources Tongzhou BranchPolygon shape fileData of state, province, city, county (district), town (sub-district) and village
Table 2. Patch characterization of land-use map.
CORINE CODELand Cover TypeNumber of PatchesArea (m2)
1111Continuous and dense urban fabric4668324,150,637.51
1221Road networks125026,868,353.11
124Airport14,477,751.51
2121Permanently irrigated arable land3290207,319,363.56
2122Nurseries in permanently irrigated land50026,851,685.69
311Broad-leaved forest19,062204,586,571.14
312Coniferous forest519719,749,775.19
313Mixed forest121923,997,610.95
321Natural grasslands4418,793,494.75
322Moors and heathlands9615,696,854.04
332Bare rocks1917,271,856.32
333Sparsely vegetated areas1271,900,278.29
5111Rivers and streams143544,384,035.96

