Article

Land Use Transition and Its Influencing Factors in Poverty-Stricken Mountainous Areas of Sangzhi County, China

1
School of Geography and Planning, Sun Yat-Sen University, Guangzhou 510275, China
2
School of Civil Engineering and Architecture, Jishou University, Zhangjiajie 427000, China
3
School of Geography and Tourism, Guangdong University of Finance and Economics, Guangzhou 510320, China
*
Author to whom correspondence should be addressed.
Sustainability 2019, 11(18), 4915; https://doi.org/10.3390/su11184915
Submission received: 13 August 2019 / Revised: 3 September 2019 / Accepted: 6 September 2019 / Published: 9 September 2019

Abstract

:
Previous studies have rarely revealed the characteristics and influencing factors of land use transformation (LUT) in poverty-stricken areas, where multiple actions of cultivated land protection are undertaken. The land use conversion matrix and Spatial Durbin Model were used to analyze the characteristics and influence factors of LUT based on remote sensing interpretation data of Sangzhi County in 2010, 2015, and 2018. The results demonstrate the following: (1) From 2010–2018, cultivated land, forest land, waters, and urban and rural construction land in Sangzhi County increased by 4.91%, 0.03%, 58.99%, and 55.63%, respectively, and grassland decreased by 13.32%. (2) Terrain, territorial, and traffic conditions were common influence factors of the land use type conversion (i.e., forest land to cultivated land, grassland to forest land, cultivated land to forest land, grassland to cultivated land, and cultivated land to urban and rural construction land). The conversion of land use type has a negative effect on the land use type conversion of adjacent townships. Territorial and traffic conditions affect the land use type conversion of adjacent townships. The results illuminate LUT at the township scale in mountainous areas and are beneficial to promoting the sustainable use of land resources and poverty alleviation.

1. Introduction

Land use transformation refers to the transformation process of regional land use patterns that correspond to the transformation of economic and social development stages that occur during a particular period of time [1,2]. Many studies have extensively explored land use transformation. The main ideas of these studies can be ordered as follows: land use change→influence factors→environmental effects→policy response [3,4]. In the early relevant studies, the transformation of forest land attracted considerable attention. Studies have demonstrated that with the development of a social economy, a turning point occurs whereby continuous reduction switches to recovery, and this is termed forest transformation [5,6,7,8,9]. After World War II, the world economy entered a relatively stable period of development [10], with a rapid increase in urban population and an obvious change in global land use and land cover change. In particular, in the process of the rapid industrialization, urbanization, and agricultural modernization, the transformation of land use patterns was readily apparent.
Land possesses natural and social attributes, and the natural attributes of land affect the transformation of land use on a longer time scale [11]. Although the development of science and technology has weakened the restrictive nature of natural factors on human production activities, natural ecological factors such as temperature, precipitation, elevation, slope, and soil continue to restrict human land use. Studies have demonstrated that temperature and precipitation affect long-term land use, elevation and slope affect the process and characteristics of land cover change in mountainous areas, and soil affects the growth of vegetation [12,13,14,15,16,17,18]. Notably, in the process of rapid urbanization, the relationship between man and nature has been reshaped, and human production activities have greatly influenced land use transformation. Most studies have asserted that population growth, resident income, urbanization, industrialization, and other socioeconomic factors are the impetus for land use transformation [11,13,14,19,20,21,22,23,24,25]. Additionally, the production activities of individuals were closely related to the institutional arrangements at a given time and place [11,26,27,28]. Therefore, land use rights, cultivated land protection policies, land retirement programs and production subsidies, urban planning, and other land use systems and policies have an influential effect on the change in land use patterns [16,29,30].
Due to the self-organization and complexity of the land use system, the land use transformation characteristics and influence factors of different types of regions vary [11]. Land use change in economically developed cities [23,25,30,31] and suburbs with rapidly expanding urban land [19,24] is mainly driven by economic interests, and land use change demonstrates that the amount of urban construction land increases rapidly whilst the amount of cultivated land decreases rapidly. To pursue economic growth, land use change in underdeveloped areas [18,32] also demonstrates an increase in urban construction land, but on a smaller scale. The land use transformation of traditional agricultural areas (primary grain producing areas) [22,33] is mainly affected by food protection and economic growth, and both the growth rate of urban and rural construction land and the rate of decline of cultivated land in the process of land use transformation are significantly lower than those in the economically developed cities and suburbs with rapidly expanding urban land uses. In ecologically fragile areas [13,17], land use transformation is mainly affected by environmental protection and economic growth. Land use change demonstrates a slow increase in urban construction land and the gradual restoration of forest land.
These studies have enriched the theory of regional land use transformation, but few studies have revealed the characteristics and influencing factors of land use transformation in poverty-stricken mountainous areas, where more tasks have been taken for the protection of cultivated land. In addition, some researchers have used spatial econometric models such as the geographically weighted regression model (GWR), the spatial lag model (SLM) and the spatial error model (SEM) to reveal the influence factors of land use transformation [25,27,30,33]. However, only the spatial interaction of the lag factor of the interpreted variable on the adjacent area is considered, and the lag factor of the explanatory variable is not considered in these models. Since the spatial correlation of geographic phenomena exists not only in the observed values of the interpreted variables but also in the explanatory variables, if the spatial lag term of the explanatory variable is not considered, bias in the estimation may occur [34]. Taking Sangzhi County as an example, located in a poverty-stricken mountainous area, based on remote sensing interpretation data at the three time points of 2010, 2015, and 2018, this study used a land use conversion matrix and spatial Durbin model (SDM) to analyze the characteristics of land use transformation and its influence factors to enrich the study of land use transformation and propose policy recommendations for the sustainable use of land resources in mountainous areas. Compared with ecologically fragile areas, Sangzhi County not only endeavors to protect the regional ecological environment and fight poverty and create wealth, but also undertakes more tasks of protecting regional cultivated land. Thus, its characteristics and influencing factors of land use transformation may differ from other regions.
The remainder of this paper is arranged as follows: section two is the description of the research area and data sources, section three presents the application of the research methods and models, section four provides the analysis of results, and the final section draws conclusions and makes suggestions.

2. Research Areas and Data Sources
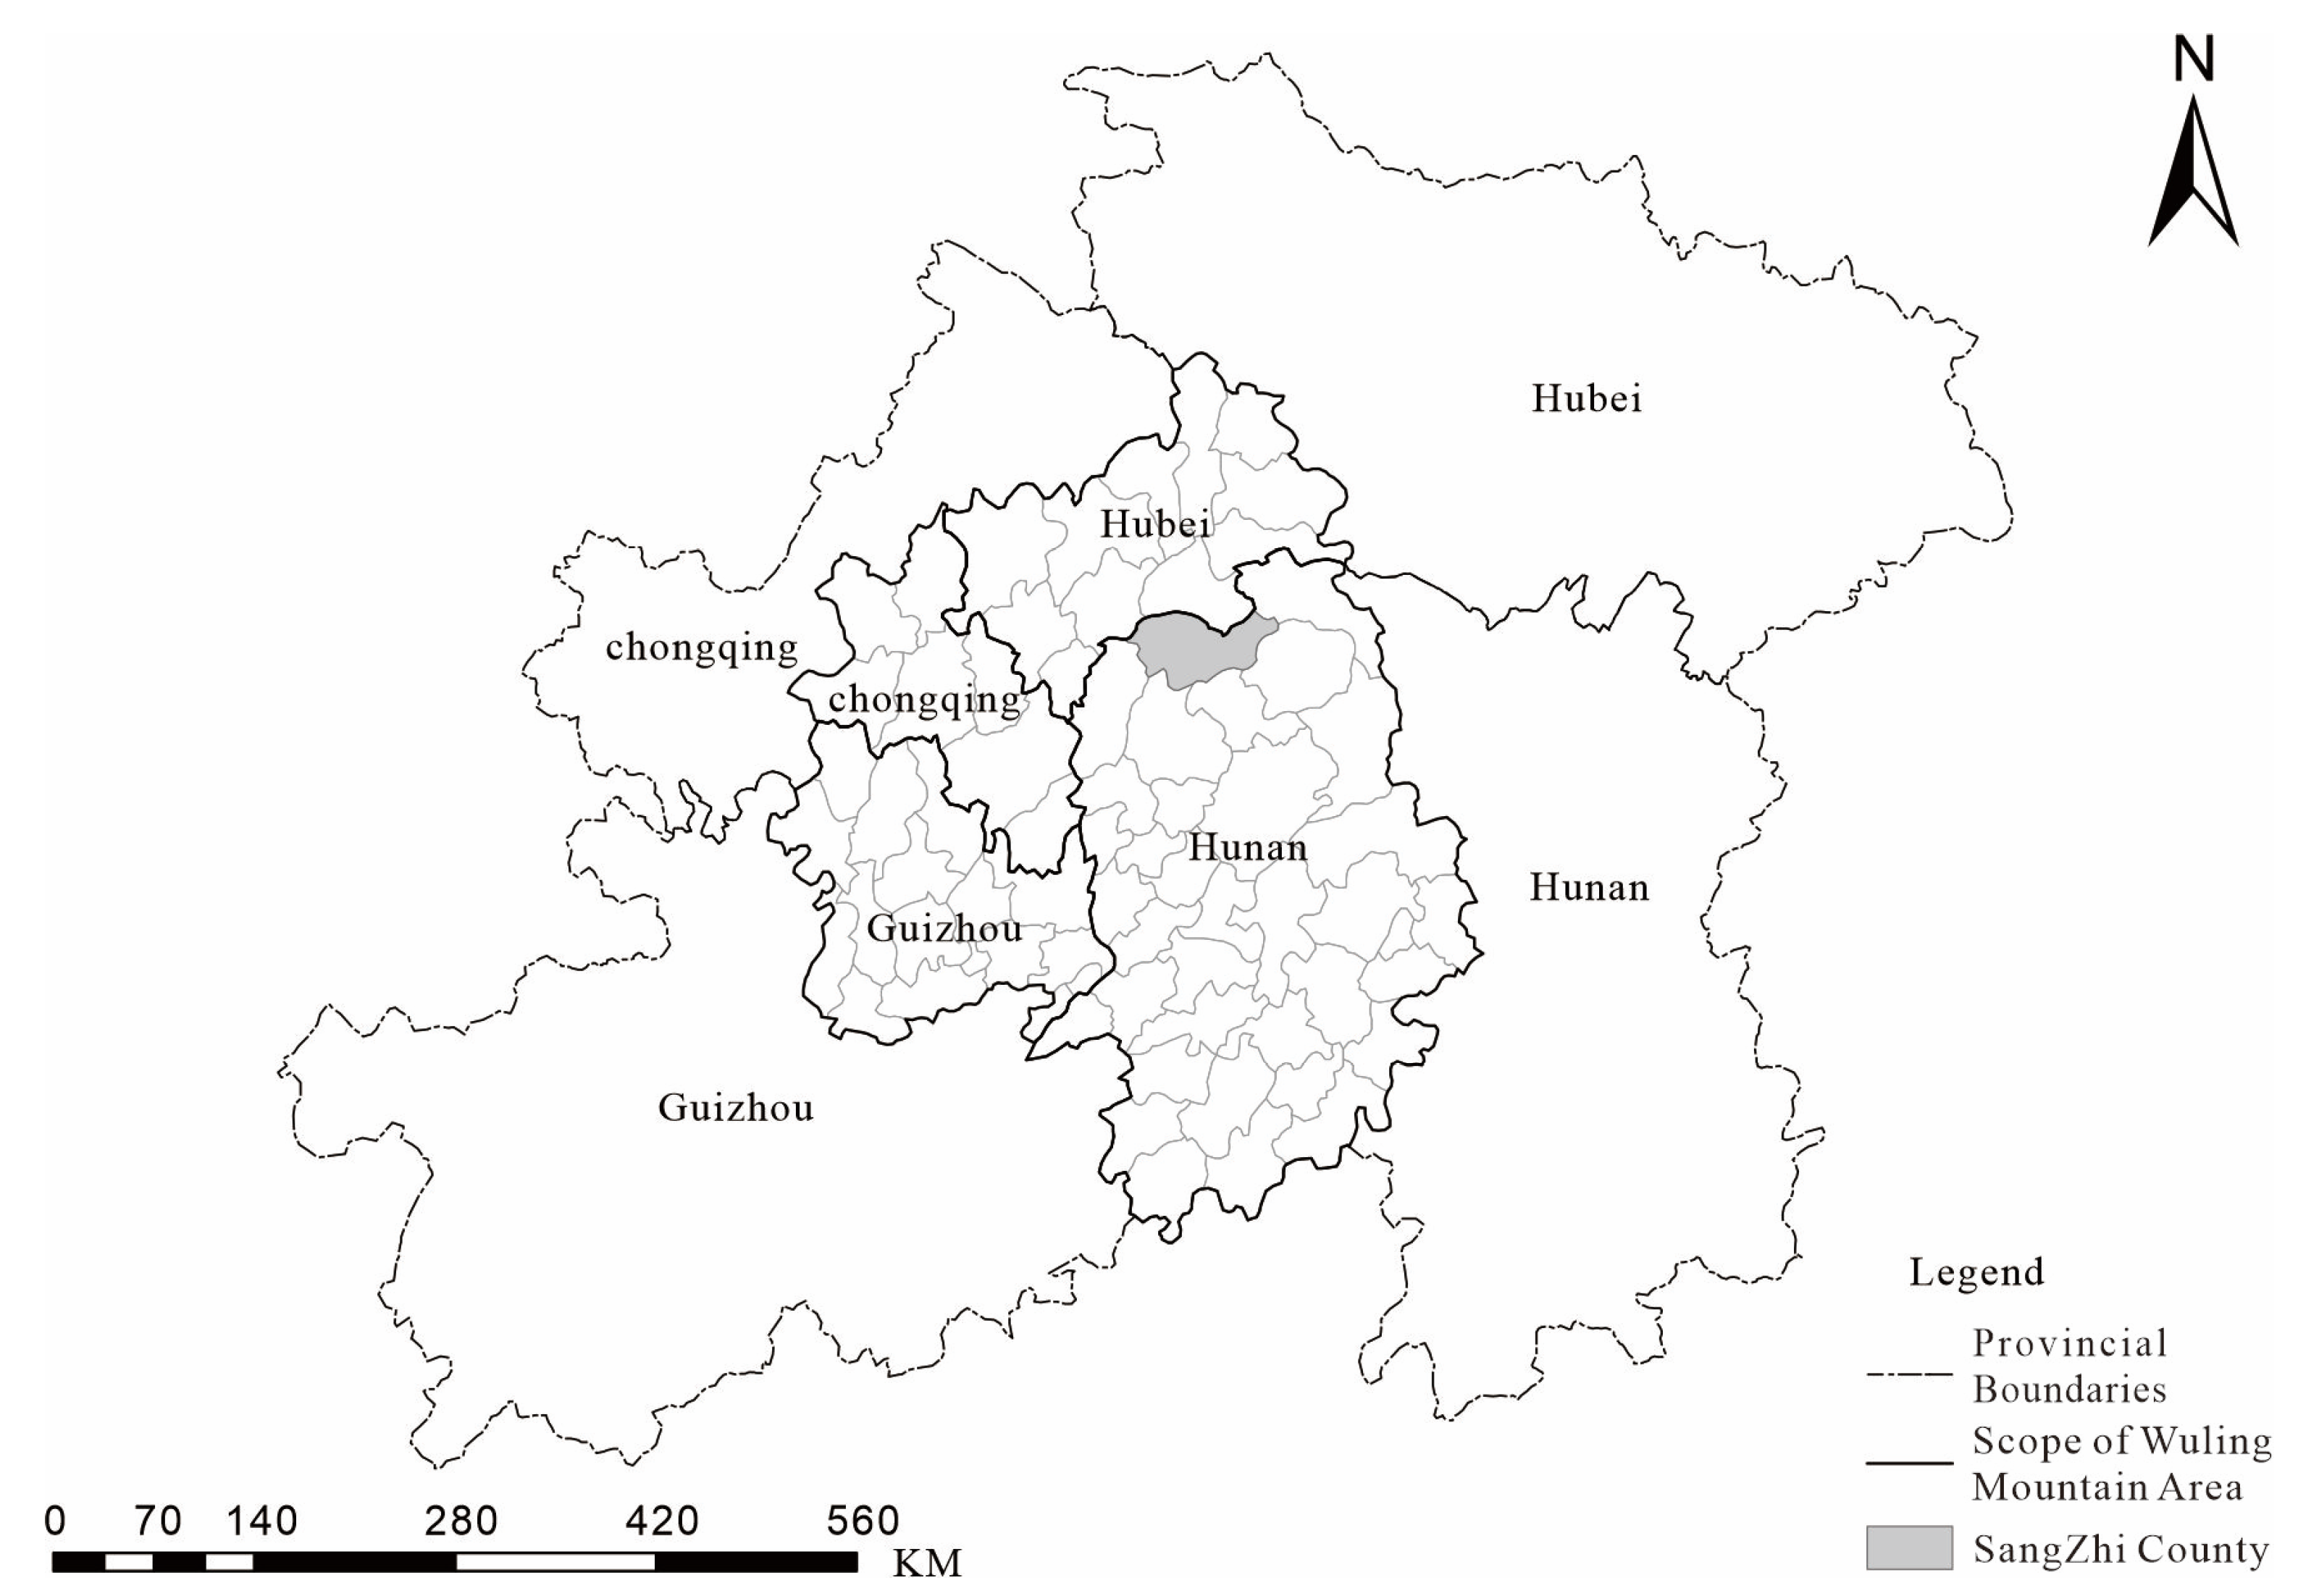
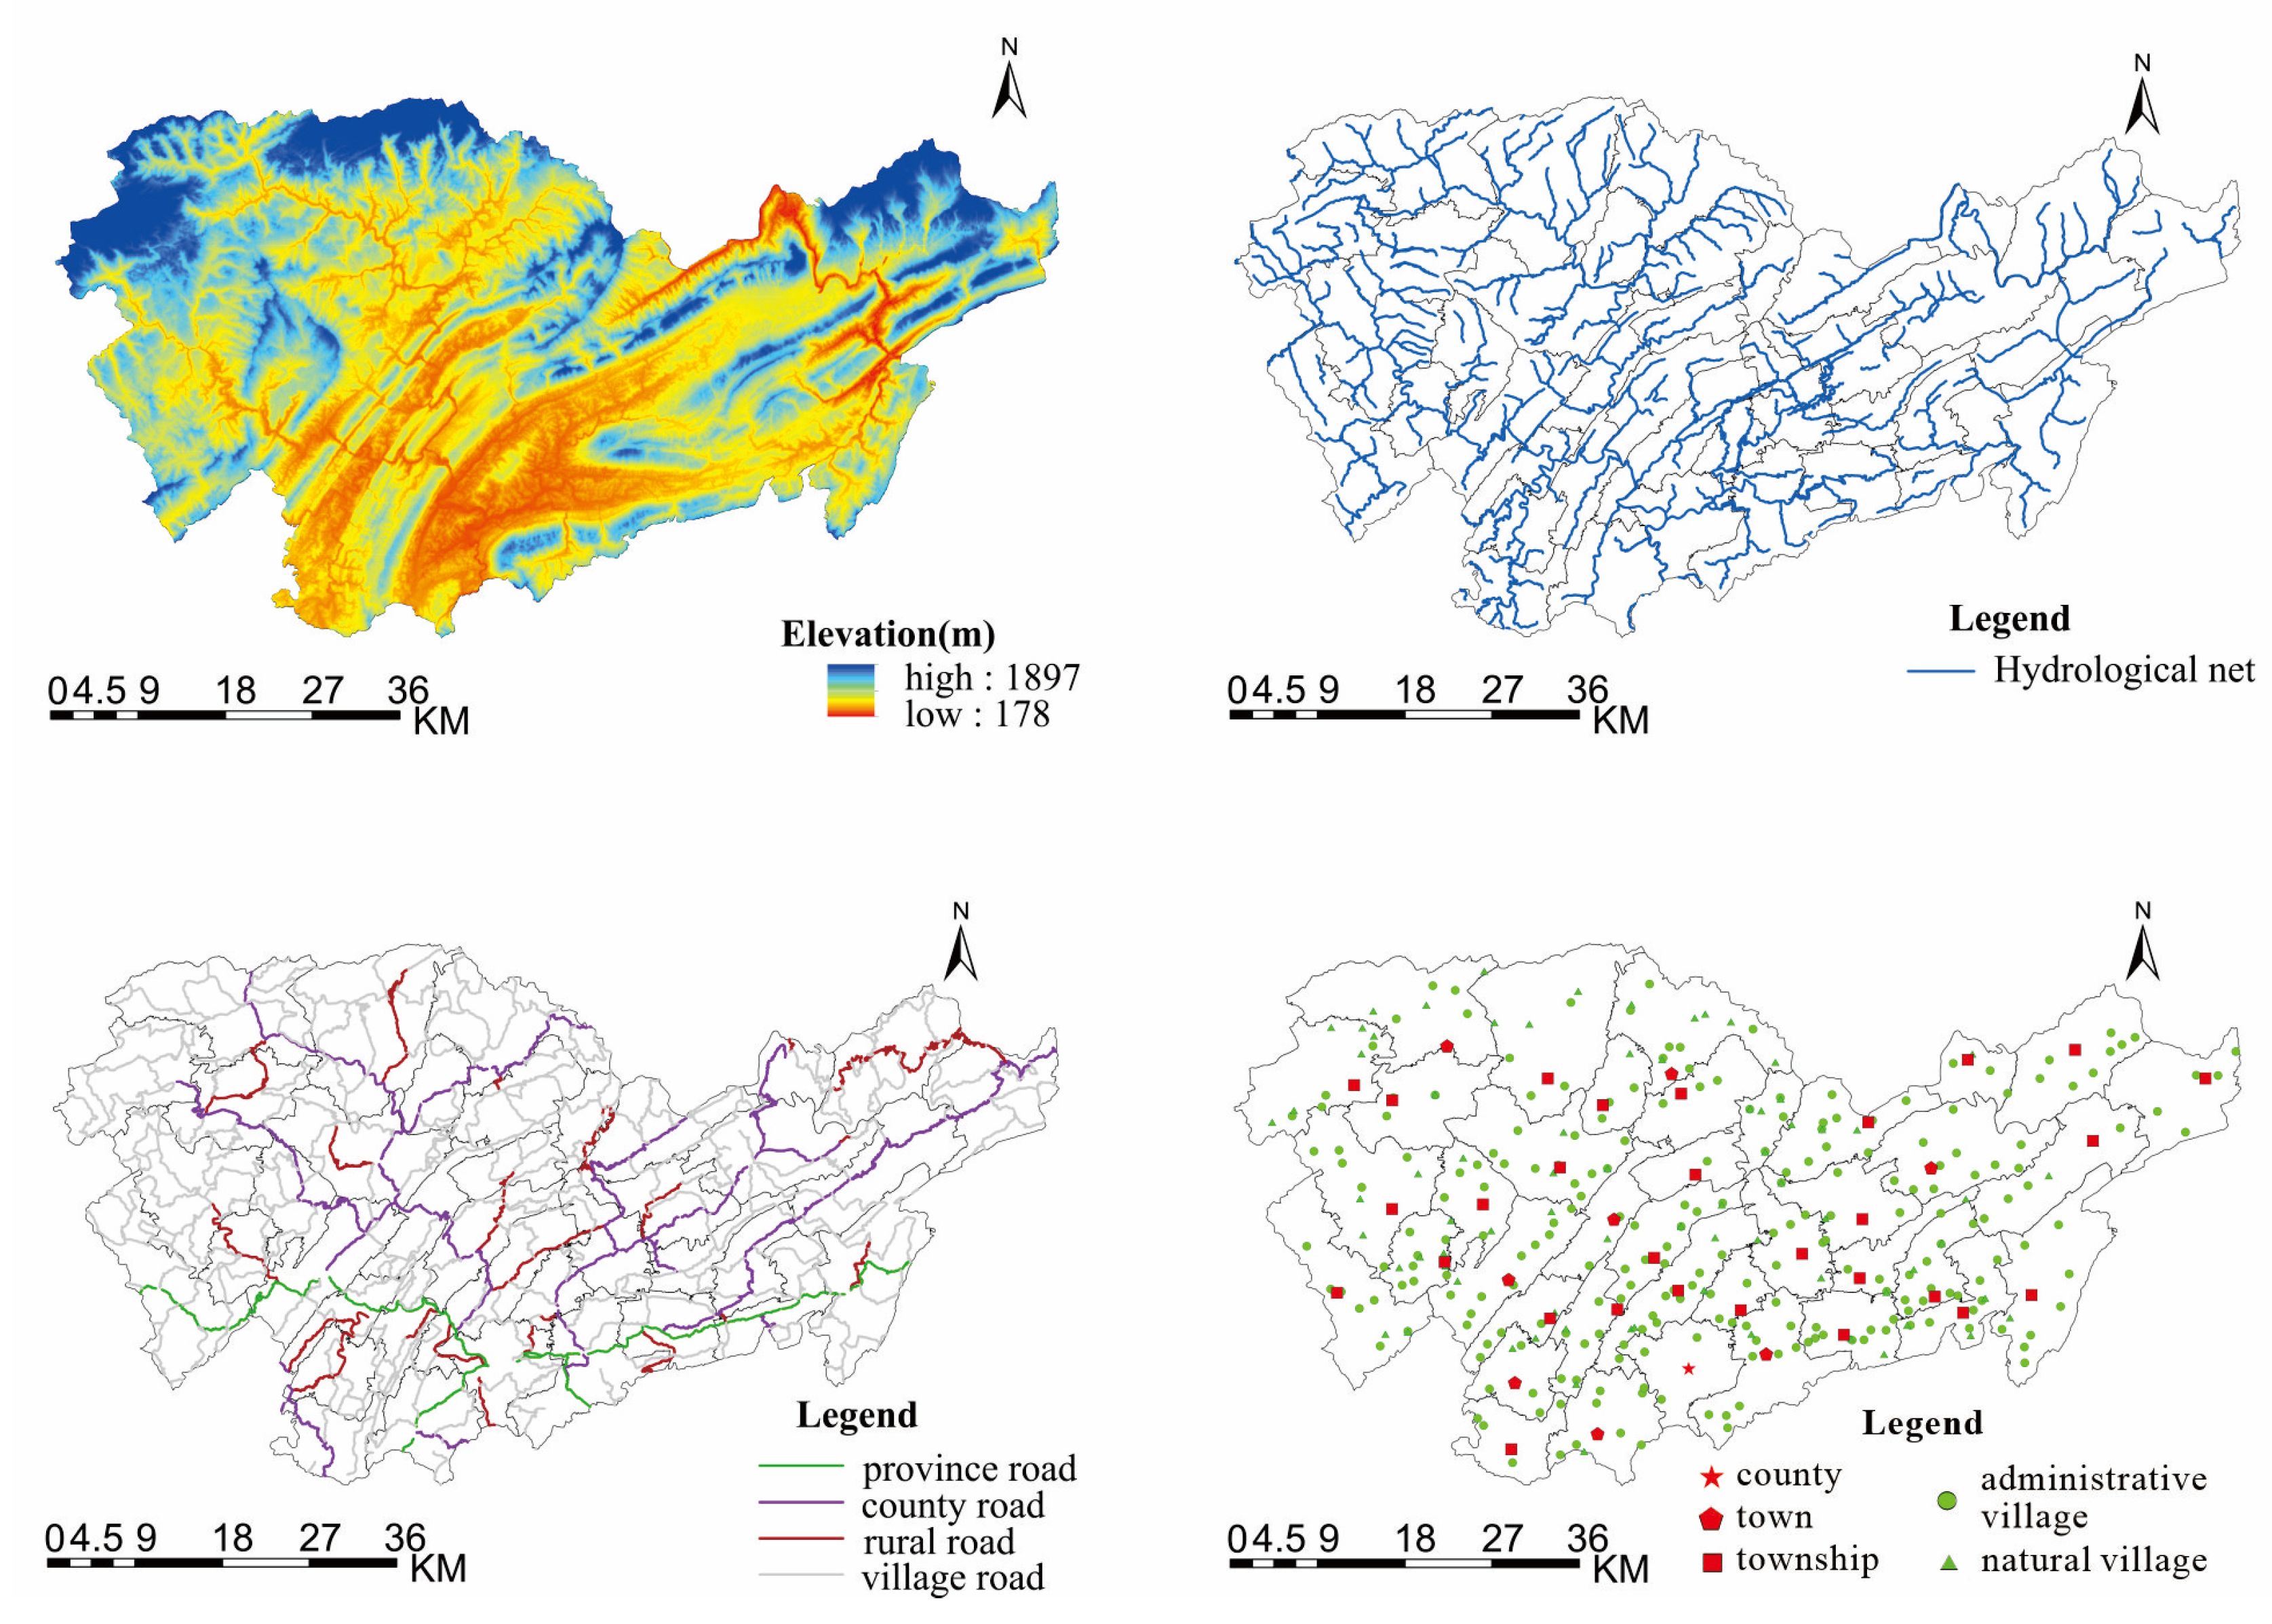
2.1. Research Area

The Wuling Mountainous Area has a fragile ecological environment, lagging infrastructure construction, and a population with extremely low incomes. In 2010, the per capita net income of farmers in the Wuling Mountains was €445.06 (¥3499), which was only 59.1% of the national average (Regional Development and Poverty Alleviation Plan of Wuling Mountain Area, 2011–2020). Sangzhi County is located in the northwestern part of Hunan Province in the Wuling Mountains (Figure 1). In 2017, the per capita net income of farmers in Sangzhi County was ¥7200, only 53.6% of the national average (Report on the Work of Sangzhi County Government, 2017). The number of permanent residents was 78,000 less than the registered population (Statistical Yearbook of Zhangjiajie City, 2018). Since some rural residents leave their hometown for work in cities, the phenomenon of cultivated land abandonment has become increasingly obvious (Figure 2). With respect to landform type, areas of mountainous, hilly, and plains land in Sangzhi County account for 83.1%, 13.9%, and 3% of the total area, respectively (City Master Plan of Sangzhi County, 2009–2030). According to the Land Use Change Survey Data of Sangzhi County, in 2017, cultivated land; garden land; grassland; town, village, industrial and mining land; transportation land; waters and water conservancy facilities land; and forest land accounted for 9.07%, 3.64%, 2.61%, 2.57%, 0.6%, 1.75%, and 78.24% of the total area, respectively. The cultivated land is mainly sloping farmland of relatively poor quality. The proportion of cultivated land with a slope greater than 15 degrees is 23.25%. The Land Use Master Plan of Sangzhi County (2006–2020), revised in 2016, increased the amount of cultivated land by 2876 hectares, the task of basic farmland protection by 233 hectares, and the task of land revitalization and supplementary farmland by 508.19 hectares. From 2006 to 2014, actual land revitalization and reclamation in Sangzhi County increased the area of cultivated land by 1623.75 hectares, achieving the original planning target of 114.65% and exceeding the original planning target of 207.48 hectares. In 2018, the reclaimed agricultural land in Sangzhi County was 368.13 hectares, of which 208.8 hectares was linked to the increase and decrease of urban and rural construction land (cheng xiang jian she yong di zeng jia gua gou) and 133 hectares was actually used in the province (Comprehensive Statistical Analysis Report on Land and Resources of Zhangjiajie City, 2018).

2.2. Data Sources

Since the introduction of the City Master Plan of Sangzhi County (2009–2030), the social economy has developed rapidly. From 2010 to 2018, the remote sensing images of Sangzhi County demonstrated that the area of construction land increased from 538.38 hectares to 1213.29 hectares, an increase of approximately 2.25-fold, and the change in land use pattern was obvious. Therefore, the remote sensing interpretation data of land use in Sangzhi County in 2010, 2015, and 2018 were obtained from the Resource and Environment Science Data Center of the Chinese Academy of Sciences (http://www.resdc.cn) [35]. The digital elevation model data were from the geospatial data cloud (http://www.gscloud.cn/) [36]. The data concerning provincial boundaries, county boundaries, government residences at all levels, and roads and rivers at all levels were obtained from the National Catalogue Service For Geographic Information (http://webmap.cn/main.do?method=index) of 1:250,000 National Basic Geographic Databases [37] (Figure 3). Thirty-eight township boundaries were from vector data obtained by the Sangzhi County Land and Resources Bureau (2017). Social and economic data were from the Zhangjiajie Statistical Yearbook (2010–2018), Land Use Master Plan of Sangzhi County (2006–2020) (2016 Revised Edition), City Master Plan of Sangzhi County (2009–2030), and the surveyed towns and villages.

3. Research Methods

3.1. Land Use Transfer Matrix

Land use change information mining and land use transformation feature extraction were studied by using a land use transfer matrix [17,19,33]. With the support of ArcGIS 10.2 software(ESRI, Redland, CA, USA) and based on the Landsat remote sensing image interpretation data of Sangzhi County in 2010, 2015, and 2018, land use types were classified into five categories—cultivated land, forest land, grassland, waters, and urban and rural construction land—and the grid size was 30 m × 30 m. On this basis, according to formulas (1) and (2), the percentage of net gains and losses in the conversion process of land use type "conversion reduction" or "conversion acquisition" in different periods was calculated.
P l o s s ( i ) , j = ( P j , i P i , j ) / ( P i P j ) × 100 , i j
P g a i n ( i ) , j = ( P j , i P i , j ) / ( P i P j ) × 100 , i j
where P l o s s ( i ) , j is the proportion of the net decrease in land use type row (i) in the conversion matrix from land use type of row (i) to land use type of row (j) (i.e., the contribution rate of change), P g a i n ( i ) , j is the proportion of the net increase of land use type row (i) in the conversion matrix from land use type of row (i) to land use type of row (j), and P i , j and P j , i are individual values in the conversion matrix table.

3.2. Selection and Quantification of Influence Factors for Land Use Transition

To comprehensively understand the relationship between the characteristics and influence factors of land use transformation in poverty-stricken mountainous areas, we systematically created an analytical framework to summarize the influence factors of land use transformation (Figure 4). According to the characteristics of regional factors in poverty-stricken mountainous areas and the sources and directions of land use change, the relationship between the characteristics and influence factors of land use change was established. The influence factors of natural and socioeconomic conditions were quantified and spatialized using ArcGIS 10.2 software (ESRI,Redland,CA,USA) (Figure 5). Statistical analysis of spatial econometrics was used to study the influence factors of natural and socioeconomic conditions. The institutional and policy factors were analyzed using qualitative methods. The spatial correlation analysis of spatial effects was accomplished using the SDM.

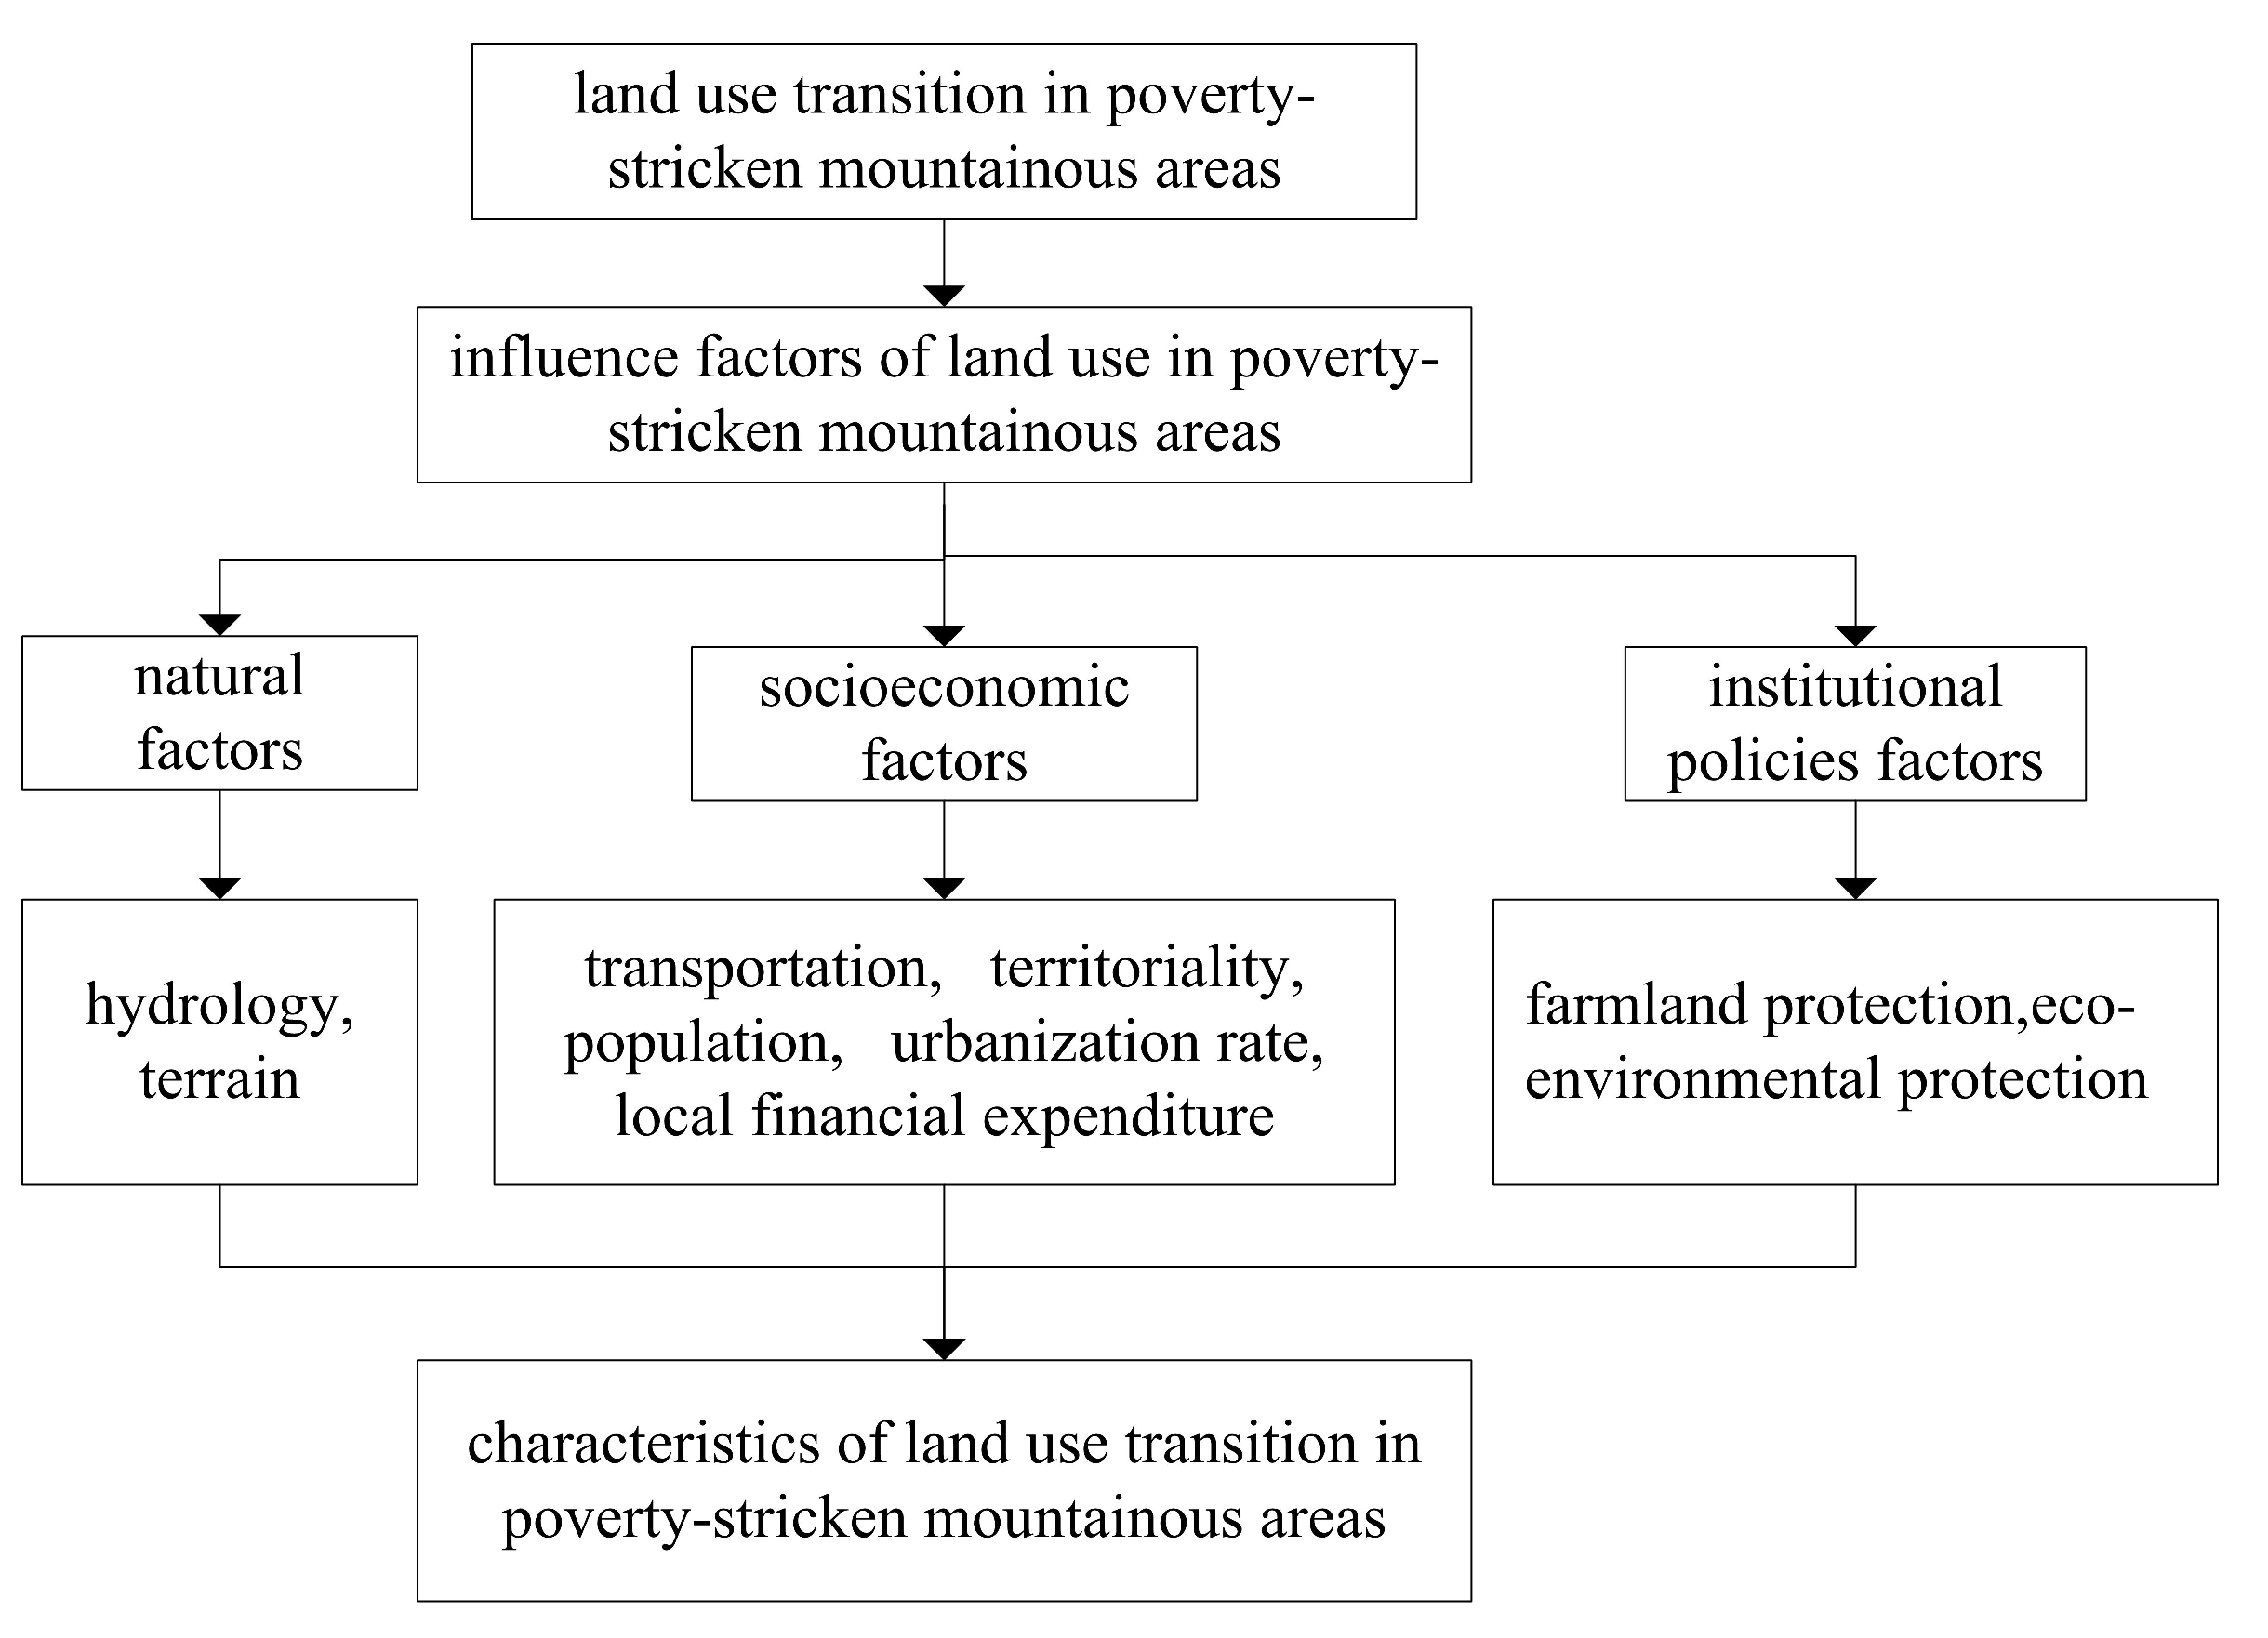
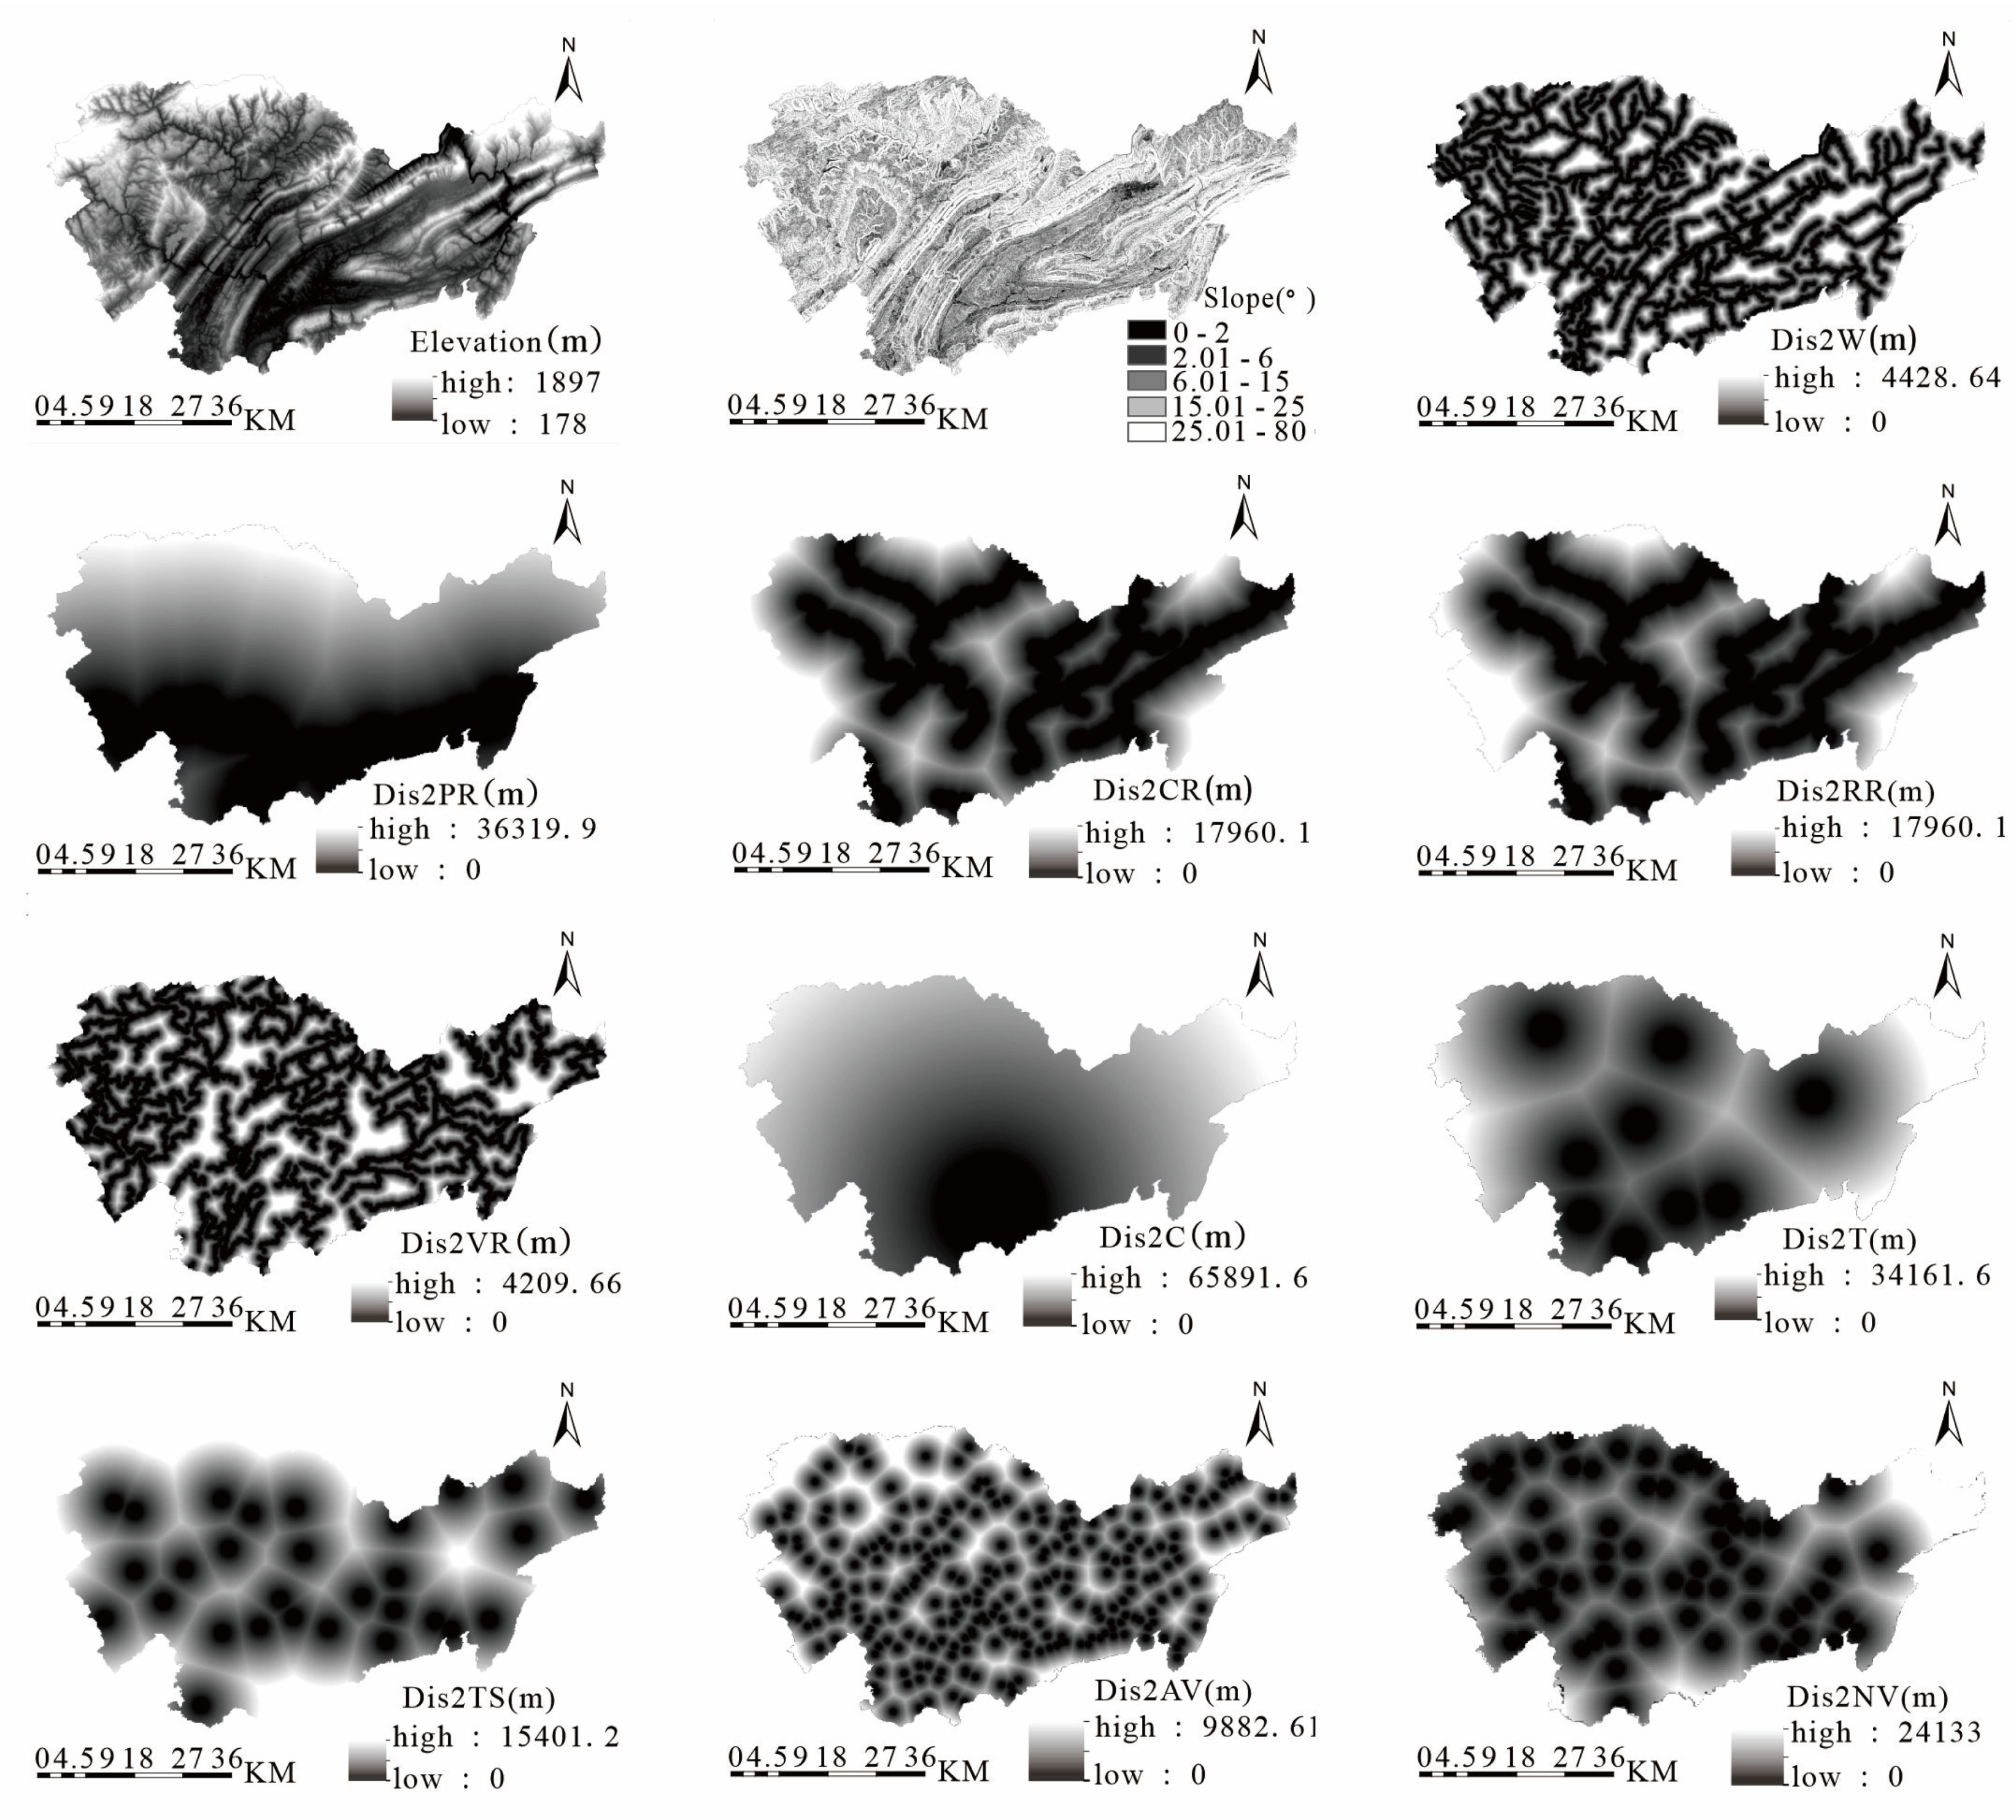
3.2.1. Influence Factors of Land Use Transition

(1) Constraints of natural conditions: Most studies have revealed the influencing factors of land use transformation in mountainous areas and have regarded natural conditions as the restricting factors of regional land use change [13,15,17]. Temperature and precipitation in climatic conditions affect the regional land use pattern by affecting the spatial and temporal distribution of regional water resources [12,13,14,17,18,38]. Human production and life require water resources; thus, hydrological conditions have a particular influence on land use [18,22,33]. Concerning topographic conditions, the higher the elevation, the greater the slope, the less the distribution of cultivated land and construction land; the influence of slopes on the distribution of cultivated land and construction land is more significant than that of elevation [17,27,31]. Soil types and organic matter content in soil conditions are critical factors that affect the distribution of cultivated land and grassland [12,15,16,18,22]. We assumed that natural conditions were the ecological environmental foundation of land use type conversion, which restricts the basic mode of land use in poverty-stricken mountainous areas. Considering that the climate conditions from 2010 to 2018 had little influence on the study area, and the soil conditions in the study area had few differences among townships, hydrological conditions (i.e., distance to rivers) and topographic conditions (i.e., elevation, slope) were used as constraints of land use transformation in Sangzhi County (Table 1).
(2) Socioeconomic influence factors: Among the social and economic factors, population and urbanization level are generally regarded as the most notable factors of land use change. In the process of urbanization, with the population agglomeration in cities and the continuous increase in urbanization level, cities must provide production and living facilities to satisfy the various needs of residents, and this is conducive to the expansion of the scale of nonagricultural land. Studies have demonstrated a significant positive relationship between population growth and urbanization level and urban construction land expansion [19,24]. The total population, urbanization rate, and other indicators are selected to quantify the effect of population and urbanization level on land use change [33]. Local financial expenditure reflects that local governments provide public goods and services closely related to local needs. Most scholars have observed a positive correlation between public financial expenditure and economic growth [39]. Li (2015) used the logarithm of public financial expenditure to measure the effect of urban hierarchy on urban land expansion. The results demonstrated that public financial expenditure is a notable factor influencing urban land expansion in China [40]. Territorial conditions and traffic conditions have a profound impact on land use scale, land use intensity, and land price. Relevant studies have used the distance to administrative centers at all levels and the distance to roads at all levels to indicate the impact of territorial and traffic conditions on land use change, respectively [18,22,23,25,31,33,41]. We expected that social and economic conditions significantly affect the change of urban and rural construction land and cultivated land in poverty-stricken mountainous areas. Therefore, we used the total population, urbanization rate, and local financial expenditure to represent the indicators of social and economic development and calculated the average change rate of the population, urbanization rate, and local financial expenditure. The distance to the center of the county, town, township, administrative village, and natural village was used to represent the territorial conditions, and the distance to provincial, county, rural, and village roads was used to represent the traffic conditions (Table 1).
(3) Land system and policy factors: Relevant studies have demonstrated that government departments mainly regulate the behavior of land use subjects through relevant laws or land use management policies [42]. For example, to ensure food security, the central government of China has formulated and implemented a strict protection system for basic farmland and requires that the same amount and quality of cultivated land be provided as mitigation after the occupation of cultivated land by nonagricultural industries. In addition, to ensure ecological security, the central government prioritizes the protection and management of forestry land and forest resources and strictly controls the occupancy of ecological public welfare forests and natural commodity forests through various activities. We expect that the land system and policy significantly affect the change of cultivated land and forest land in poverty-stricken mountainous areas.

3.2.2. Spatial Correlation

Spatial effects include spatial correlation and spatial heterogeneity. According to the first law of geography [43], close relationships are often observed among spatial units. This phenomenon is called spatial dependence or spatial autocorrelation. Spatial correlation can be divided into substantive spatial dependence and nuisance spatial dependence [44,45]. Spatial dependence exists not only in the observed value of the interpreted variables but also in the explanatory variables. If the spatial lag term of explanatory variables is not considered, the estimation may be biased [34]. Spatial spillover is a key form of spatial interaction, which is significant in the promotion of regional economic growth [46]. As a geographic phenomenon, the influence factors of land use transformation should fully consider spatial correlation. Based on the above analysis, we assumed that the land use type conversion in this region will affect the land use type conversion in adjacent areas, and the natural and socioeconomic conditions in this region will affect the land use type conversion in adjacent areas. Therefore, this study took full account of the spatial correlation between the interpreted variables and the explanatory variables and their spatial spillover effects on land use transformation using SDM.

3.3. Spatial Econometric Regression Analysis

The spatial correlation or spatial dependence of regional land use behavior is not only affected by land use behavior in neighboring areas, but also influenced by exogenous variables such as the explanatory variables that may be interdependent. Therefore, the use of the SDM is necessary, and this includes interpreted variables and explanatory variables with spatial lag. The model is a general form of the SLM and SEM. The specific form of the SDM is as follows:
Y i t = α + ρ j = 1 N W i j Y j t + β X i t + θ j = 1 N W i j X j t + ε i t
where W i j Y j t denotes the spillover effect of Y in adjacent areas on Y in this region, referring to the spillover effect of the interpreted variables; W i j X j t denotes the spillover effect of X in adjacent areas on Y in this region, referring to the spillover effect of explanatory variables; ρ measures the spatial external spillover effect of economic behavior in geographically adjacent areas; and β is the spatial regression coefficient of explanation. θ is the spatial regression coefficient of economic behavior in geographically adjacent areas. W i j is a spatial weight matrix. In this study, a binary adjacency matrix (contiguity weight) was used to reflect a neighboring geographical relationship.

4. Results

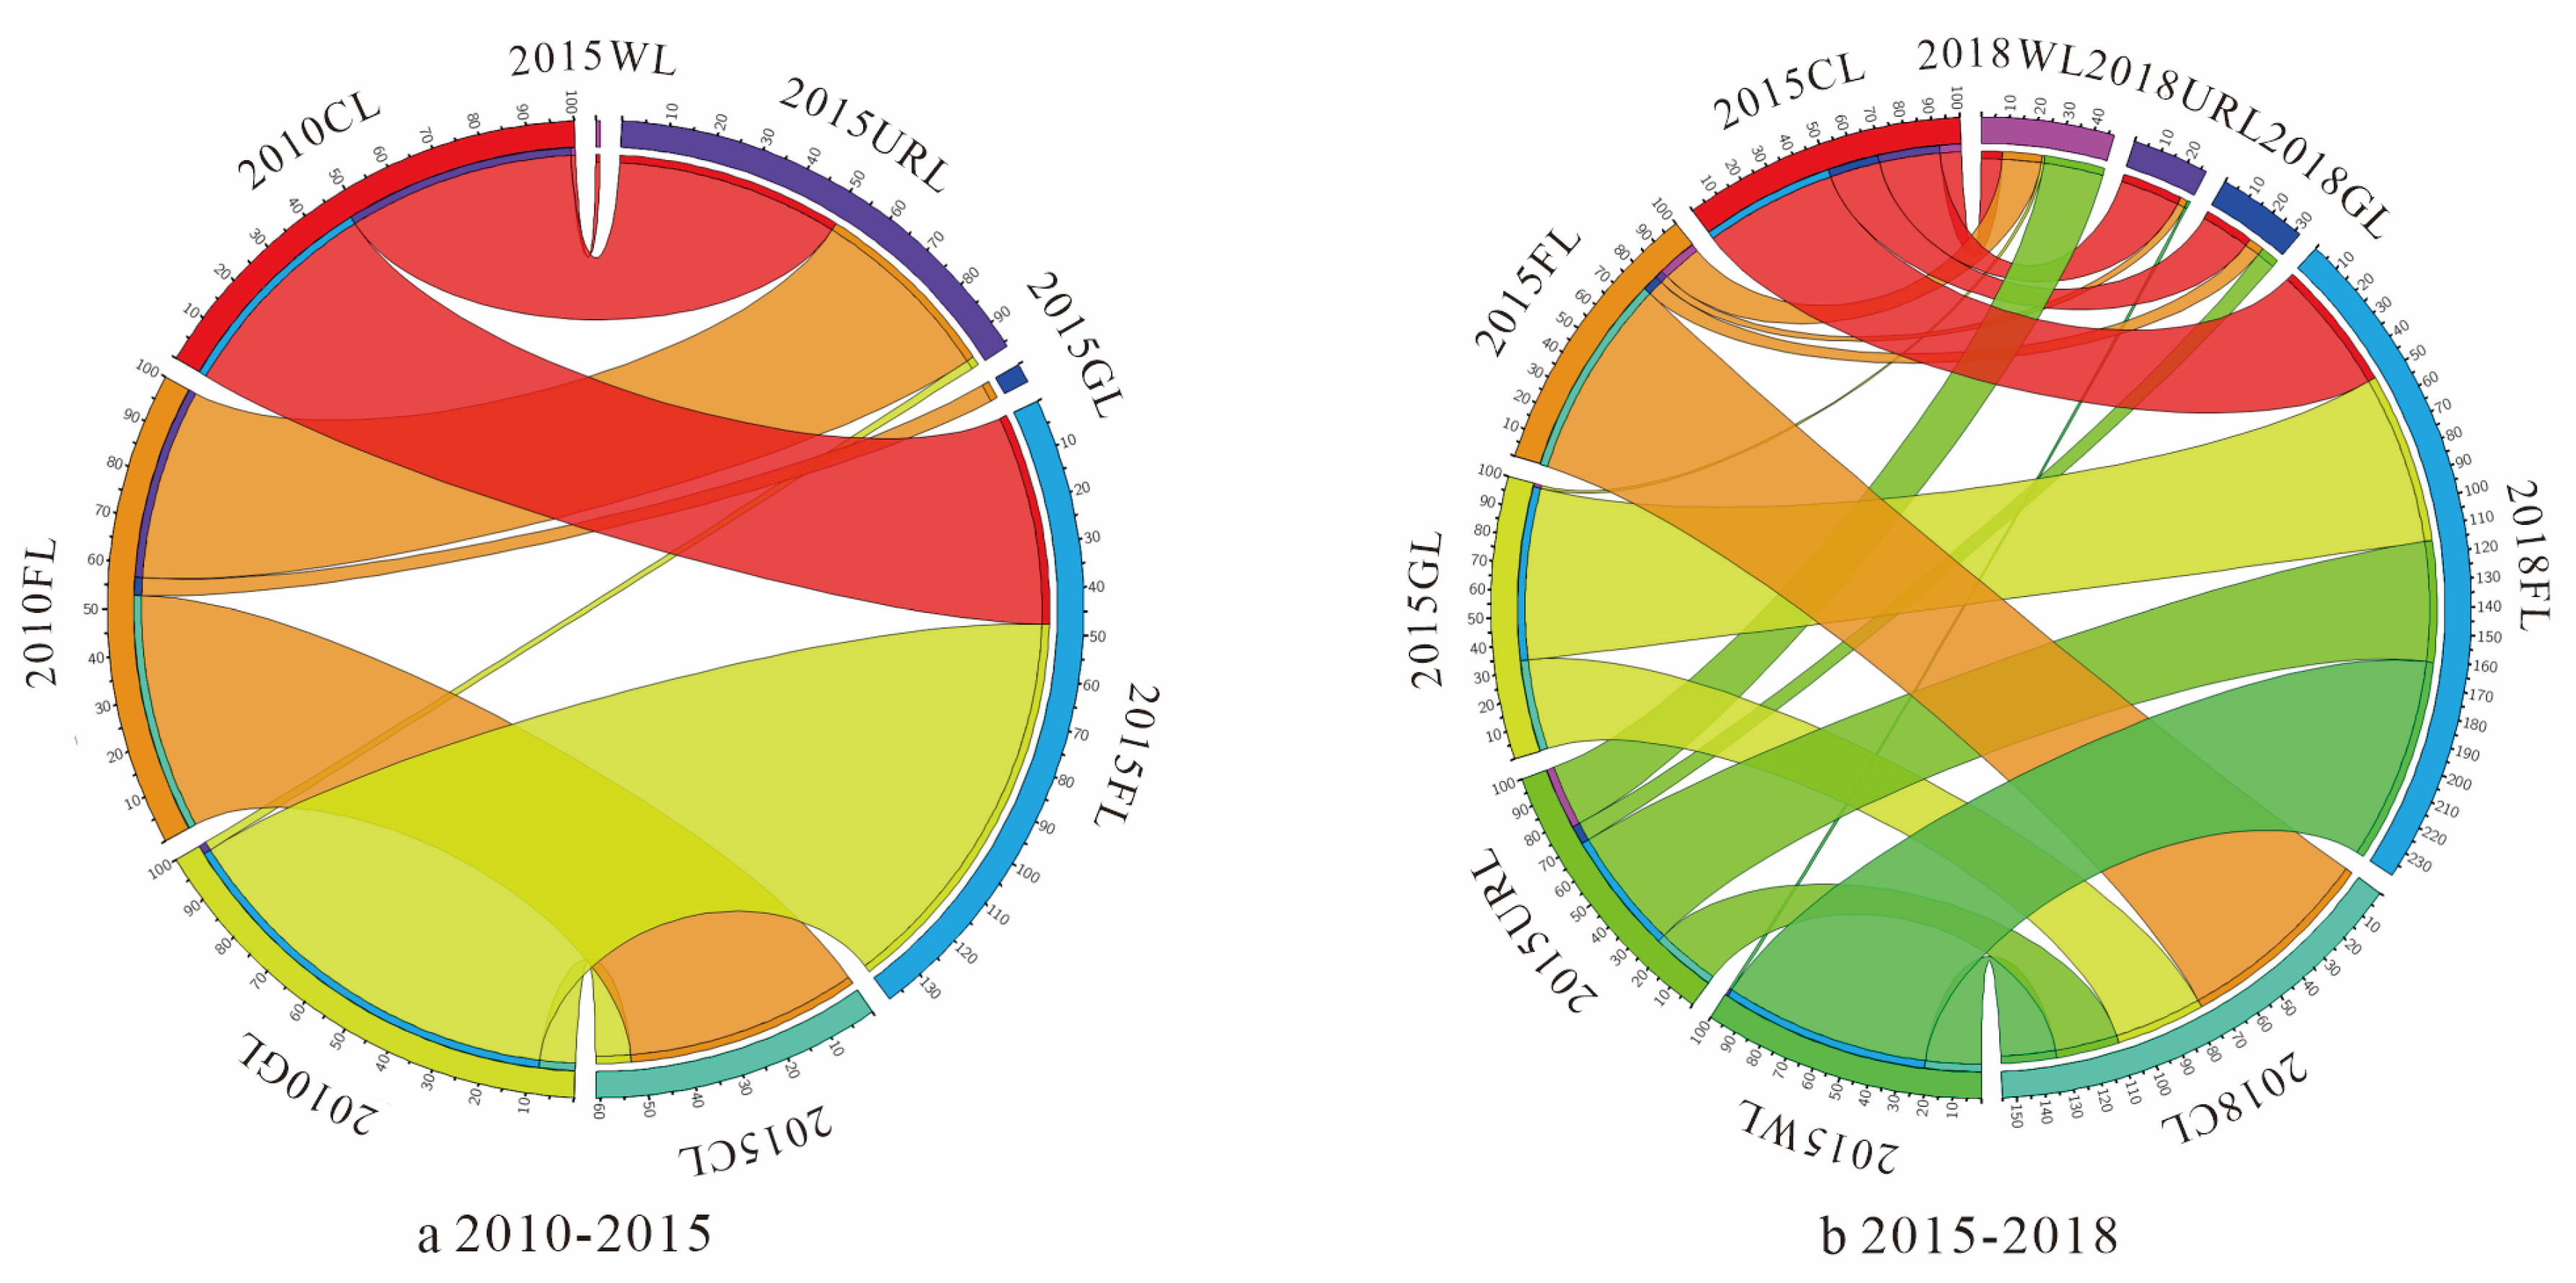
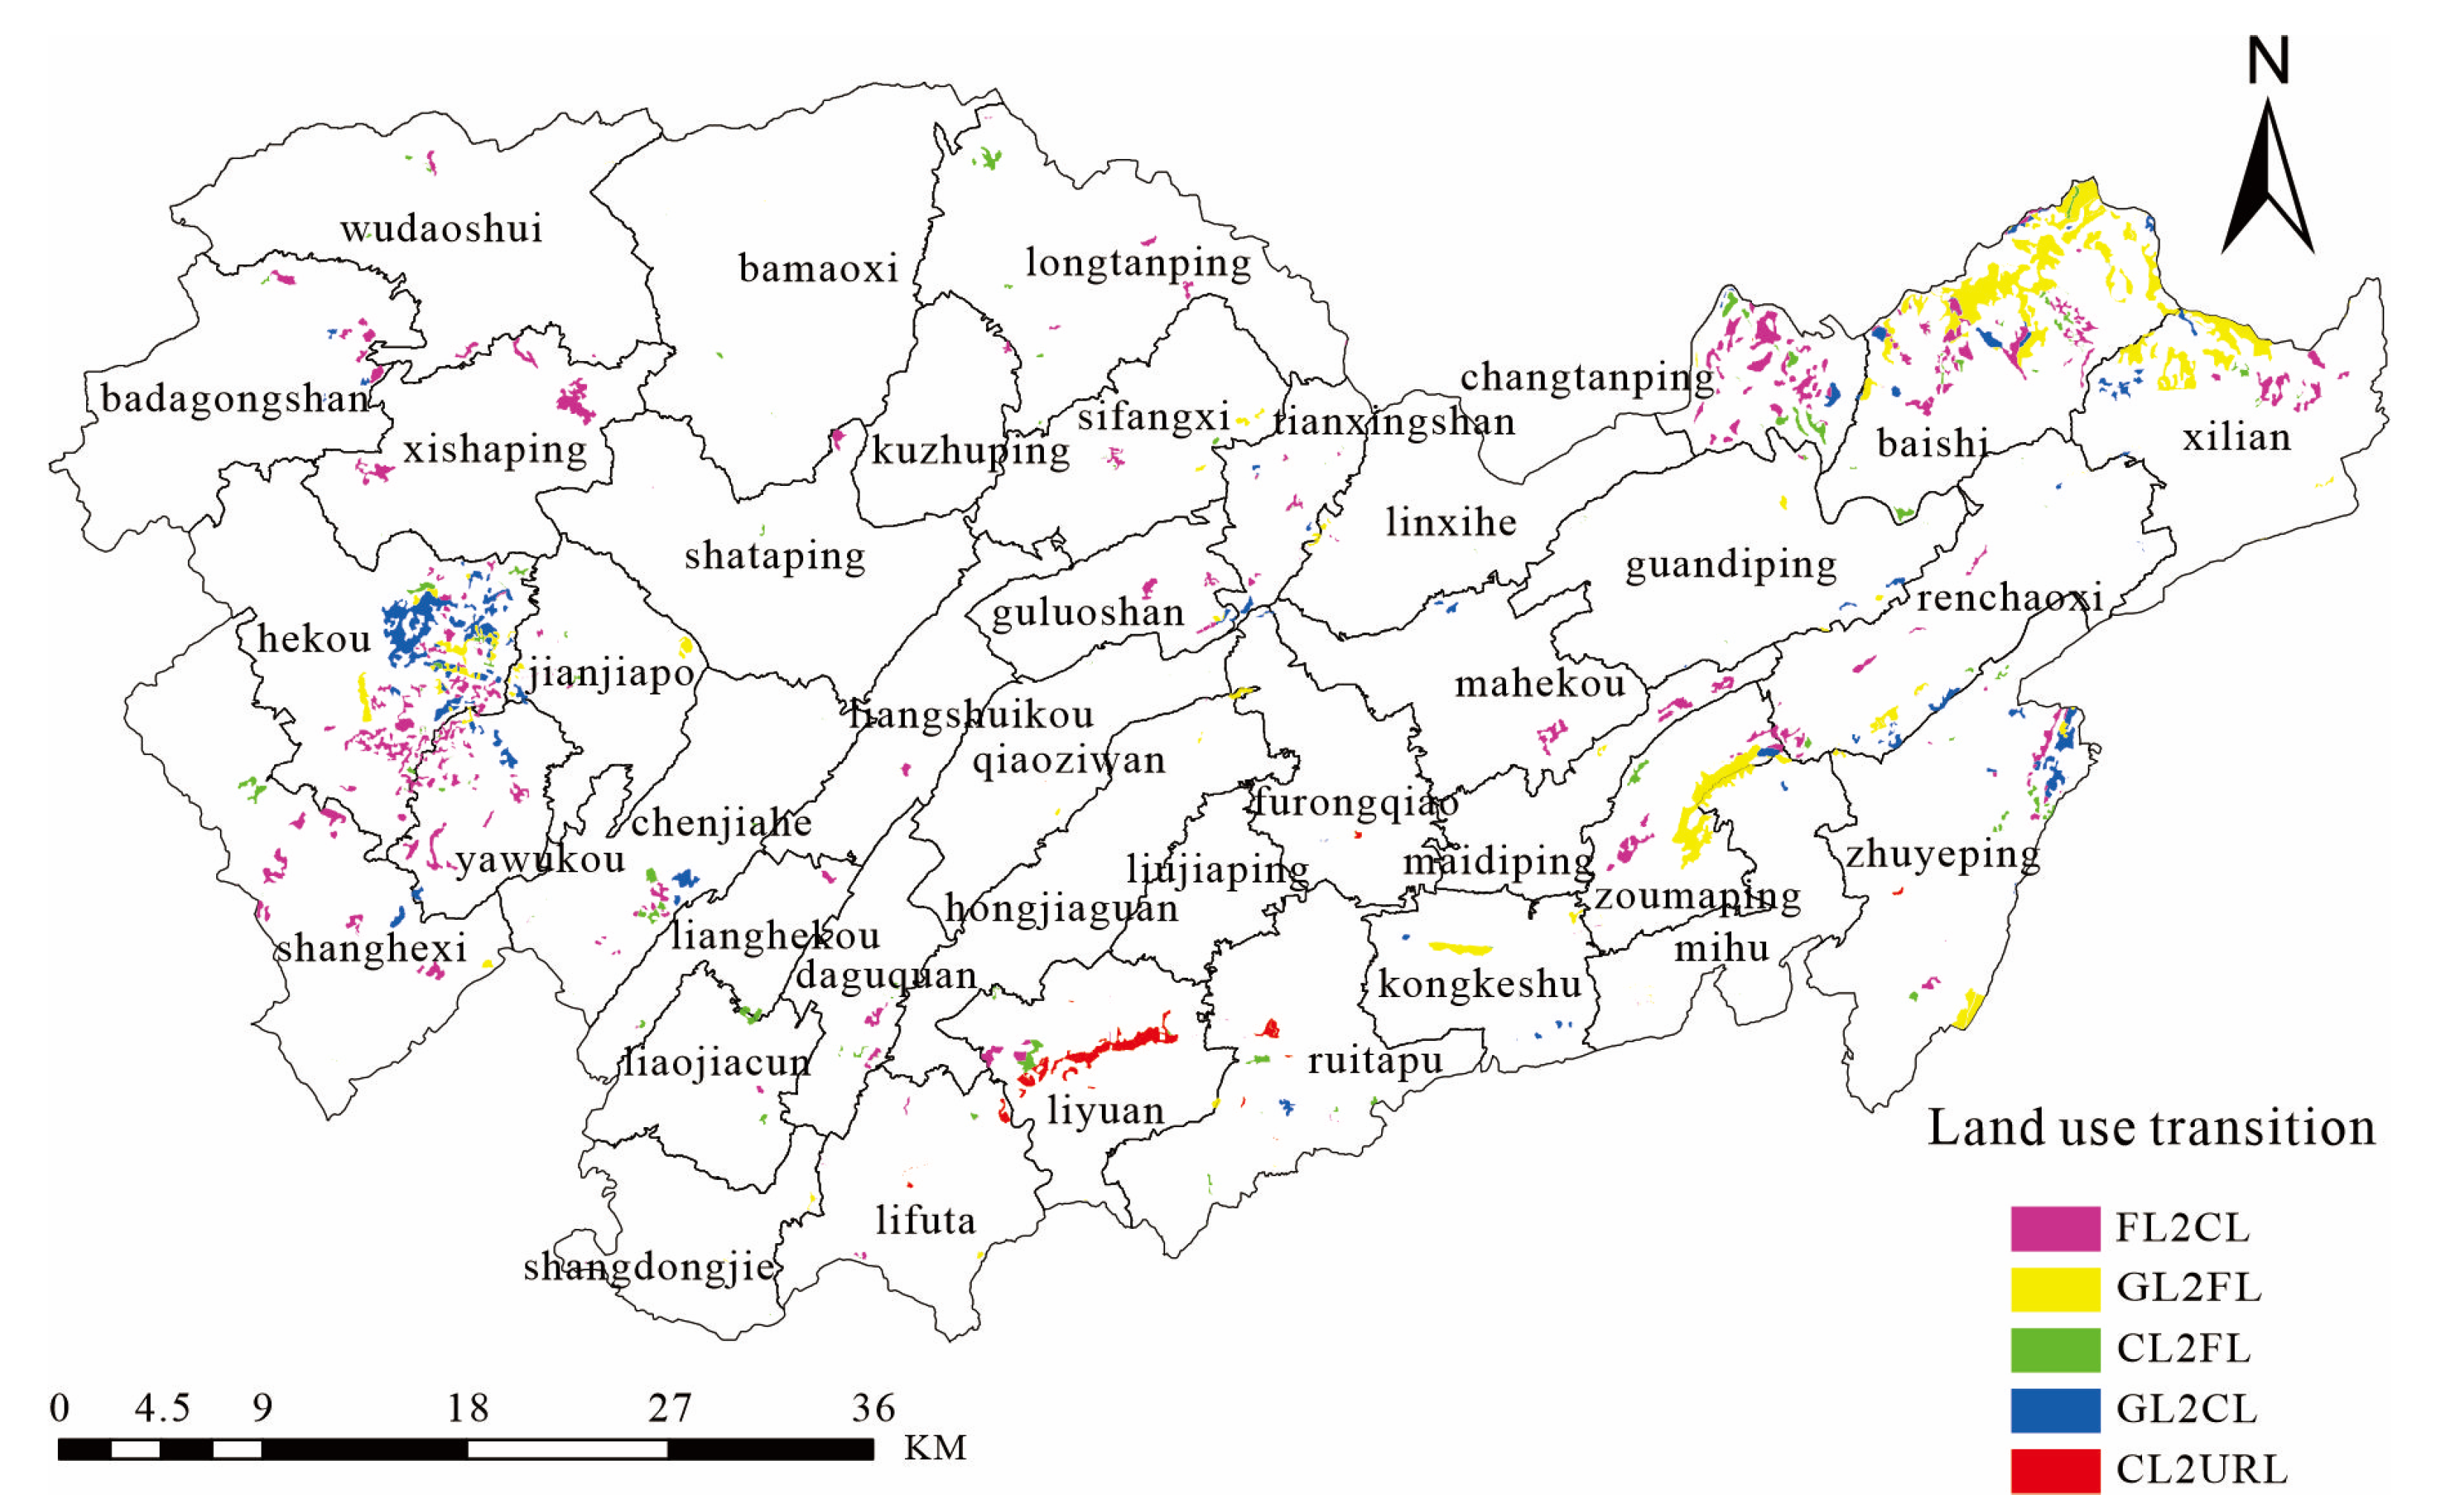
4.1. Characteristics of Land Use Transition in Sangzhi County

According to the analysis results of land use status and transformation at three time points in Sangzhi County, the main characteristics of land use transformation in Sangzhi County from 2010 to 2018 were as follows: cultivated land, forest land, and urban and rural construction land increased (Table 2). From 2010 to 2018, cultivated land, forest land, waters, and urban and rural construction land increased by 4.91%, 0.03%, 58.99%, and 55.63%, respectively. Grassland decreased by 13.32% (Table 3). This finding was consistent with the triple objectives of farmland protection, environmental protection and biodiversity conservation, and poverty alleviation in Sangzhi County. From 2010 to 2015, the main types of land use conversion in Sangzhi County were grassland to forest land (GL2FL), forest land to cultivated land (FL2CL), cultivated land to urban and rural construction land (CL2URL), cultivated land to forest land (CL2FL), and forest land to urban and rural construction land (FL2URL). From 2015 to 2018, the main types of land use conversion in Sangzhi County were FL2CL, GL2FL, CL2FL, grassland to cultivated land (GL2CL), and CL2URL, and the transformation range of land use in the first 5 years was less than that in the next 3 years (Figure 6). The main land use conversion types in Sangzhi County during 2010–2018 were the same as those in 2015–2018. According to the absolute scale and relative weight of land use conversion in the three periods, the five main land use conversion types were FL2CL, GL2FL, CL2FL, GL2CL, and CL2URL.
According to the transfer matrix of land use change and the main types of land use change, from 2010 to 2018, the cultivated land area of Sangzhi County did not decrease but increased significantly. On the one hand, the land occupied by urban and rural construction land in the central urban area of Sangzhi County should be balanced; on the other hand, the pilot plan of Linking County to increase and decrease urban and rural construction land, respectively, in Zhangjiajie City, Hunan Province, and Sangzhi County must complete the additional area of cultivated land supplementation in other areas of the Hunan Province, especially in the Chang-Zhu-Tan area. The increase in cultivated land area is mainly from the transfer of forest land and grassland. The conversion of FL2CL accounts for 76.02% of the total area of forest land conversion, and the conversion of grassland to cultivated land accounts for 31.25% of the total area of grassland conversion. The actual available reserve resources of cultivated land in Sangzhi County are limited. Forest land represents the largest area and the highest proportion of land use types. The appropriate reclamation of hilly and mountainous areas with slopes less than 25° is the main source of cultivated land. The conversion of grassland to cultivated land is because of the low cost of developing grassland into cultivated land.
The forest area of Sangzhi County increased slightly. The increase in forest land area is mainly due to the transfer of cultivated land and grassland. The conversion of CL2FL accounts for 49.71% of the total area of cultivated land conversion, and the conversion of GL2FL accounts for 67.21% of the total area of grassland conversion. With the strengthening of the national environmental protection and biodiversity conservation policy, the improvement in individuals’ ecological environmental consciousness, the influence of the policy of returning farmland to forests, and the policies protecting ecological public welfare forests and stopping logging in natural commercial forests, there are certain requirements for the amount of ecological forest land to be maintained in the region. The increase in forest land area is caused by the “forest shortage path” [9]. In addition, with the continuous development of the social economy and the continuous increase in individuals’ material level, the cultivated land located at the edge of the forest and unsuitable for cultivation is abandoned or planted with trees, and after a period of natural succession, it is transformed into forest land. The increase in forest land area is caused by the “economic growth path” [9].
The grassland area of Sangzhi County has decreased considerably, and the increase in the other four types of land use inevitably leads to a decrease in grassland area. The main source of increases and decreases of grassland area is its transformation into forest land and cultivated land. The decrease in grassland area is much larger than the increase in grassland area. The area of conversion of GL2FL and GL2CL accounts for 67.21% and 31.25% of the total area of grassland conversion, respectively. The conversion of FL2GL is mainly caused by deforestation, accounting for 4.56% of the total area of conversion of forest land, and the conversion of CL2GL is the result of the abandonment of farming by farmers, accounting for 17.19% of the total area of conversion of cultivated land.
The waters of Sangzhi County have increased considerably, which mainly occurred because of the transfer of forest land and cultivated land, accounting for 14.44% of the total area of forest land conversion and 7.19% of the total area of cultivated land conversion, respectively. The river system is affected by the seasonal variations in dry season and flood season. In the dry season, the land is considered shrub land and other land types, and in flood season, the same land is identified as waters. Agricultural restructuring may have a strong impact on the conversion of cultivated land to waters; i.e., in order to increase economic benefits, farming will be converted to aquaculture.
The area of urban and rural construction land has also increased considerably. The increase is mainly due to the transfer of cultivated land and forest land, which account for 25.92% of the total area of cultivated land conversion and 4.99% of the total area of forest land conversion, respectively. The soil and geology of cultivated land are relatively advantageous, and the territorial and traffic conditions are more convenient. Thus, the transformation into urban and rural construction land is easy. In addition, some of the increased rural construction land in mountainous areas is from forest land.
According to the spatial distribution (Figure 7), the conversion of FL2CL is mainly distributed in the west and northeast of Sangzhi County, involving 35 townships. The top five townships in the conversion area are Hekou, Yanwukou, Xishaping, Changtanping, and Baishi. The conversion of GL2FL is mainly distributed in the northeast and east of Sangzhi County, involving 26 townships. The top five townships in the conversion area are Baishi, Xilian, Renchaoxi, Mihu, and Zoumaping. The conversion of CL2FL is mainly distributed in the northeast and west of the Sangzhi County, involving 35 townships. The top five townships in the conversion area are Changtanping, Baishi, Zhuyeping, Hekou, and Liyuan. The conversion of GL2CL is mainly distributed in the west, east, and northeast of Sangzhi County, involving 19 townships. The top five townships in the conversion area are Hekou, Yanwukou, Zhuyeping, Baishi, and Renchaoxi. The conversion of CL2URL is mainly distributed in the county town and surrounding towns. The top five towns for conversion are Liyuan, Ruitapu, Lifuta, Zhuyeping, and Furongqiao.

4.2. Influence Factors of Land Use Transition in Sangzhi County

4.2.1. Spatial Correlation Test

Spatial autocorrelation analysis is the most common exploratory spatial data analysis method (ESDA). The commonly used measurement tools of ESDA include two types: global spatial autocorrelation statistics and local spatial autocorrelation statistics. Moran’s I is the most widely used global spatial autocorrelation index. The calculation formula is as follows:
I = n i = 1 n ( x i x ¯ ) × i = 1 n j = 1 n w i j ( x i x ¯ ) ( x j x ¯ ) i = 1 n j = 1 n w i j
Among these variables, n is the number of spatial units, xi is the observation value of spatial unit i, x j is the observation value of spatial unit j, x ¯ is the average of random number x, and w i j is the spatial weight matrix.
According to the formula calculation, the Moran indexes of FL2CL, GL2FL, and CL2URL in the data series of five main land use conversion types were 0.3199, 0.3382, and 0.0799, respectively, and all passed the significance level of 1%. The Moran indexes of converting CL2FL and GL2CL were 0.1298 and 0.0719, respectively, and these passed the significance level of 10%. Among the 15 explanatory variables, the Moran indexes of 11 influence factors ranged from 0.2066 to 0.7165, and all passed the significance level of 5%, except for four influence factors: Dis2TS, Dis2VR, Dis2RR, and Pfe. This finding demonstrates that interpreted variables and explanatory variables have obvious spatial correlations (Table 4).
Spatial correlation comes from three aspects: the lag factor of the interpreted variables, the lag factor of the explanatory variables, and the lag factor of the random interference term. Different lag factors correspond to different spatial regression models. Anselin (2006) proposed the relevant test methods, namely the Lagrange multiplier (LM) and robust Lagrange multiplier (R-LM) [45]. According to the results of the above spatial correlation test (Table 4), the SLM and the SEM were used to calculate the test statistics, and the corresponding probability was not ideal. Considering the possibility of the coexistence of two spatial correlations, the lag factor of the interpreted variables and the lag factor of the explanatory variables, we used the SDM to calculate the test statistics, and the corresponding probability was ideal (Table 5).

4.2.2. Influence Factors of Five Main Land Use Types Conversion

Spatial econometric regression analysis demonstrated differences in the influence factors of transformation of the five main land use types in Sangzhi County. The direction and intensity of the 15 explanatory variables differed. The conversion of FL2CL was mainly affected by cultivated land protection policy, the conversion of GL2FL was the result of a positive succession of ecosystem and ecological environmental protection, the conversion of CL2FL was affected by socioeconomic factors and ecological environmental protection policy, the conversion of GL2CL was mainly affected by cultivated land protection policy, and the conversion of CL2URL was mainly affected by social and economic factors. Among the 15 explanatory variables, terrain, territorial, and traffic conditions have significant effects on the conversion of five land use types, and Dis2T has an especially notable effect on the conversion of the other four land use types, except for the conversion of GL2FL. The interpreted variables play a critical negative role in land use conversion in adjacent townships. Among the 15 explanatory variables, territorial and traffic conditions affect the degree of land use conversion in adjacent areas (Table 6).
The analysis of the influence factors of five main land use types conversion is as follows:
1. Conversion of FL2CL
The conversion of FL2CL was significantly correlated with seven of the 15 explanatory variables. FL2CL was negatively correlated with Slope, Dis2NV, and Dis2TS at the 1% confidence level and with Dis2C and Pfe at the 5% confidence level. FL2CL was positively correlated with Dis2AV at the 1% confidence level and with Dis2T at the 5% confidence level (Table 6). These findings indicate that the conversion from FL2CL is most significantly affected by slope. Generally, land with a slope greater than 25° is not suitable for cultivated land. The distance from different administrative centers has different effects on the direction and intensity of the conversion of FL2CL. The demand for agricultural land by villages and townships is lower than that of administrative villages and towns. The farther away a location is from the center of villages and townships and the nearer a location is to the center of administrative villages and towns, the more forest land was converted into cultivated land. The demand for agricultural land in county towns is higher than that in ordinary townships and towns. The closer a location is to the county government center, the more forest land is converted into cultivated land. The structure of public financial expenditure affects the conversion of land use. The more public financial expenditure is spent on townships and towns, the less forest land is converted into cultivated land.
The conversion from FL2CL was negatively correlated at the 5% confidence level. Thus, conversion from FL2CL in this township has a significant negative effect on the adjacent townships. W*Slope, W*Dis2TS, and W*Pop were significantly negatively correlated at the 1% confidence level, and W*Dis2T was significantly negatively correlated at the 10% confidence level. Thus, Slope, Dis2TS, Pop, and Dis2T had negative effects on the conversion of FL2CL in adjacent townships. W*Dis2NV, W*Dis2RR, W*Dis2CR, and W*Dis2W were significantly positively correlated at the 1% confidence level, and W*Dis2AV and W*Dis2VR were significantly positively correlated at the 5% confidence level; thus, the explanatory variables, such as Dis2NV, Dis2AV, Dis2VR, Dis2RR, Dis2CR, andDis2W, had positive effects on the conversion of FL2CL in adjacent townships.
2. Conversion of GL2FL
The conversion of GL2FL was significantly correlated with three of the 15 explanatory variables. The conversion of GL2FL was positively correlated with Dis2PR at the 1% confidence level, positively correlated with Dis2NV at the 10% confidence level, and negatively correlated with Dis2C at the 5% confidence level. The provincial highways 228,230, and 305 are distributed in the south of Sangzhi County and exhibit an east–west alignment. Transportation along the provincial highway is convenient, with far less grassland on both sides of the provincial road than cultivated land and forest land. Therefore, the closer a location is to the provincial road, the less grassland is converted into forest land, and vice versa. The closer the proximity to the center of the natural village is and the farther away from the edge of the forest a location is, the less grassland is converted into forest land, and vice versa. The conversion of grassland to forest land is closely related to the market. Generally speaking, the closer to the county town, the more land demand there is for orchards, seedling bases and so on. Thus, the closer the location to the county government center is, the more grassland conversion to forest land occurs. The conversion of GL2FL has the least influencing factors among the five main land use conversion types.
W*GL2FL was negatively correlated at the 1% confidence level, indicating that the area of grassland converted to forest land in this township has a significant negative effect on the adjacent townships. W*Dis2PR was significantly negatively correlated at the 5% confidence level, W*Dis2NV was significantly positively correlated at the 1% confidence level, and W*Dis2C was significantly positively correlated at the 5% confidence level, which indicated that the explanatory variables such as Dis2PR, Dis2NV, and Dis2C had spatial spillover effects on the conversion of GL2FL in adjacent townships.
3. Conversion of CL2FL
The conversion of cultivated land to forest land was significantly correlated with eight of the 15 explanatory variables. Conversion of CL2FL was negatively correlated with Slope, Dis2TS, and Pfe at the 1% confidence level, negatively correlated with Dis2T at the 5% confidence level, negatively correlated with Dis2RR at the 10% confidence level, and positively correlated with Dis2AV, Dis2VR, and Dis2CR at the 1% confidence level. These findings indicate that the higher the slope is, the less the cultivated land is distributed and the less the cultivated land is converted into forest land. Towns with lower public financial expenditure are relatively underdeveloped in terms of social and economic conditions that encourage farmers to leave their hometown for work in cities more often rather than cultivating the land, which may be abandoned and undergo CL2FL conversion. A common practice is using land use conversion to convert cultivated land into forest land and then FL2URL. Therefore, the closer a location is to the township government center, the town government center, or a rural road, the greater the amount of cultivated land is converted to forest land. Because a cultivation radius is necessary, the nearer a location is to the administrative village center and the nearer to the village road, the less cultivated land is converted to forest land, and vice versa. Transportation along the county road is convenient, and the conversion of CL2FL occurs less; thus, the conversion of CL2FL is positively correlated with the distance to the county road.
W*CL2FL was negatively correlated with CL2FL at the 1% confidence level; thus, the area of cultivated land converted to forest land in this township has a significant negative effect on the adjacent townships. Ten explanatory variables had spatial spillover effects on the conversion of CL2FL in adjacent townships. CL2FL was negatively correlated with W*Slope, W*Dis2TS, and W*Pfe at the 1% confidence level, with W*Dis2T at the 5% confidence level, and with W*Dis2PR at the 10% confidence level. CL2FL was positively correlated with W*Dis2VR, W*Dis2CR, and W*Dis2W at the 1% confidence level, with W*Dis2AV at the 5% confidence level, and with W*Elevation at the 10% confidence level. Dis2PR, Dis2W, and Elevation had no significant effect on the conversion of CL2FL but had a spatial spillover effect on the conversion of adjacent townships. Dis2NV and Dis2RR did not have a spatial spillover effect on adjacent townships.
4. Conversion of GL2CL
The conversion of grassland to cultivated land was significantly correlated with eleven of the 15 explanatory variables and was negatively correlated with Slope and Dis2RR at the 1% confidence level, with Dis2W, Dis2VR, Dis2PR, Pop, Urb, and Pfe at the 5% confidence level, and with Elevation and Dis2CR at the 10% confidence level. The conversion of GL2CL was positively correlated with Dis2T at the 1% confidence level. Generally, land with a slope greater than 25° is not suitable for cultivated land. The higher the slope is, the higher the elevation is and the less the conversion of grassland to cultivated land occurs. The shorter the distance to waters is and the more convenient transportation is, the lower the cost of cultivated land development, revitalization, and reclamation are, and more grassland is cultivated in land conversion. In Sangzhi County, the towns have fewer grassland resources, and the farther away a location is from the town government center, the more grassland is cultivated in land conversion. The conversion of grassland to cultivated land is closely related to the development, revitalization, and reclamation of cultivated land, which mainly occur in some low hilly areas with more grassland resources, such as townships and towns with lower population density, a lower urbanization rate, a less developed economy, and lower public financial expenditure. The conversion of grassland to cultivated land is mainly distributed in the west, east, and northeast of Sangzhi County. The main townships in the top five areas are Hekou, Yanwukou, Zhuyeping, Baishi, and Renchaoxi.
W*GL2CL is negatively correlated with GL2CL at the 1% confidence level, indicating that the area of grassland converted to cultivated land in this township has a significant negative effect on the adjacent townships. Nine explanatory variables have spatial spillover effects on the conversion of grassland to cultivated land in adjacent townships. GL2CL was negatively correlated with W*Slope and W*Pop at the 1% confidence level, with W*Dis2NV and W*Dis2TS at the 5% confidence level, and with W*Elevation and W*Urb at the 10% confidence level. GL2CL was positively correlated with W*Dis2CR and W*Dis2PR at the 1% confidence level and with W*Dis2RR at the 5% confidence level. Dis2NV and Dis2TS have no significant effect on the conversion of grassland to cultivated land but have a spatial spillover effect on the conversion of grassland to cultivated land in adjacent townships. Dis2VR, Dis2W, and Pfe have no spatial spillover effect on adjacent townships.
5. Conversion of CL2URL
This change was negatively correlated with nine of the 15 influence factors and was negatively correlated with Dis2C at the 1% confidence level, with Elevation and Dis2W at the 5% confidence level, and with Dis2RR at the 10% confidence level. The conversion of CL2URL was positively correlated with Dis2AV and Pop at the 1% confidence level, with Dis2TS and Dis2T at the 5% confidence level, and with Dis2PR at the 10% confidence level. The closer a location is to the county government center, the greater the demand for construction land is and the more cultivated land is converted into construction land. Urban and rural construction land is concentrated in low-elevation areas. The higher the elevation is, the less cultivated land is converted to urban and rural construction land. The closer the location is to waters, the greater the convenience of using water for production and living and the more the cultivated land is converted to urban and rural construction land. The shorter the distance from rural roads is, the more convenient transportation is and the more the cultivated land is converted to urban and rural construction land. The conversion of CL2URL was mainly distributed in the county town and surrounding towns. Therefore, the farther away a location is from the administrative village center, the township government center, and the town government center, the more the cultivated land is converted into urban and rural construction land. An increase in population increases the demand for urban and rural construction land, which leads to the continuous transformation of cultivated land with better physical and geographical conditions into construction land. Population has a significant effect on the transformation of cultivated land into urban and rural construction land. Due to the basic farmland dominating both sides of the provincial highway, land use conversion is strictly controlled; the closer a location is to a provincial highway, the less the cultivated land is converted into urban and rural construction land.
W*CL2URL is negatively correlated with CL2URL at the 5% confidence level, indicating that the conversion of cultivated land into urban and rural construction land area has a significant negative effect on adjacent townships. Four explanatory variables have spatial spillover effects on the conversion of cultivated land from adjacent townships to urban and rural construction land. W*Dis2C, W*Dis2T, and W*Urb were significantly positively correlated with CL2URL at the 1% confidence level, and W*Dis2RR was negatively correlated with CL2URL at the 10% confidence level. Urb has no significant effect on the conversion of CL2URL but has a spatial spillover effect on the conversion of adjacent townships. Elevation, Dis2W, Dis2AV, Dis2T, Dis2PR, and Pop have no spatial spillover effect on adjacent townships.

5. Conclusion and Policy Recommendations

Based on Landsat remote sensing image interpretation data of Sangzhi County in poverty-stricken mountainous areas in 2010, 2015, and 2018, a land use conversion matrix and SDM were used to analyze the characteristics and influence factors of land use transformation in Sangzhi County. The study found that from 2010 to 2018, the area of cultivated land, forest land, urban and rural construction land, and waters increased and grassland area decreased significantly; the land use conversion types were mainly FL2CL, GL2FL, CL2FL, GL2CL, and CL2URL. Differences in the characteristics of land use transformation in different types of regions were observed. Compared with the land use in Maotiao River Basin [13] and Karst Mountains in Guizhou and Guangxi Province [17], which are located in ecologically fragile areas, Sangzhi County not only undertakes the task of regional environmental protection and biodiversity conservation, but also undertakes more tasks of cultivated land protection. The cultivated land area of Sangzhi County has increased significantly.
The analysis of the influence factors of land use transformation demonstrated that land use transformation is the result of the interaction of natural conditions, the social economy, land systems, and policies in a specific region, and spatial spillover effects are observed in the interpreted and explanatory variables. Terrain conditions, territorial conditions, and traffic conditions were the common factors of land use change identified in this study, and these factors are the same as those mentioned in the results of most scholars [18,22,23,25,31,33]. Land use transformation is affected by land use policy, especially the balance of cultivated land occupation and compensation, land revitalization and linking the increase and decrease of urban and rural construction land (cheng xiang jian sh eyong di zeng jia gua gou) positively promoting regional cultivated land protection [42]. In light of the spatial correlation between the interpreted variables and explanatory variables, scholars have contended that land use change in adjacent cities has a spillover effect when they studied the relationship between land use change and economic growth, but the external effect was negative [48]. Our study also demonstrated that the conversion of five major land use types had negative effects on land use type conversion in adjacent areas. Notably, this paper determined that territorial and traffic conditions have a spatial spillover effect on land use type conversion in adjacent areas, and the urbanization rate has a significant and positive spatial spillover effect on the conversion of cultivated land into urban and rural construction land in adjacent areas. These findings are conducive to deepening the understanding of the characteristics and influence factors of land use transformation in poverty-stricken mountainous areas and provide a scientific basis for the development of poverty-stricken mountainous areas and the formulation of land policy.
The characteristics of land use transformation in Sangzhi County, are closely related to regional cultivated land protection, regional ecological environmental protection, and poverty alleviation tasks. Sangzhi County is a poverty-stricken mountainous area which is undertaking more tasks of protecting cultivated land. The main sources of cultivated land in Sangzhi County are forest land and grassland. To ensure the target amount of cultivated land in the region and in the wider region, local mountainous areas must continuously develop, revitalize, and reclaim newly cultivated land. The trend of change between cultivated land and forest land in Sangzhi County may not be conducive to the positive succession of the ecological environment in poverty-stricken mountainous areas. To a certain extent, this practice causes soil erosion, reduces biodiversity, destroys the pattern of regional ecological security, and ultimately affects the sustainable development of the region. Therefore, Sangzhi County should accelerate the transformation of the management of land resources, especially cultivated land resources, from simple quantitative management to the comprehensive integrated management of total elements. When exploiting, revitalizing, and reclaiming cultivated land, the old areas, abandoned villages, and scattered, abandoned, idle, and inefficient rural construction land can be taken as the main sources in order to minimize the damage to forest land. Sangzhi County should coordinate various land policies and carefully delineate ecological protection zones [49]. In addition, by implementing the measures of merging villages and towns and improving rural traffic conditions [50], Sangzhi County can promote the adjustment and layout optimization of land use structures in towns and surrounding areas, improve the comprehensive benefits of land use [51]. Sangzhi County should encourage enterprises and villagers to participate in rural homestead consolidation in order to promote the smooth adjustment of rural land use structure. Poverty-stricken mountainous regions should have a clear functional orientation and establish a policy system coordinating land, population and industry to realize rural rejuvenation.

Author Contributions

Conceptualization, W.X.; Data curation, W.X.; Formal analysis, W.X.; Funding acquisition, C.Z.; Investigation, K.C. and J.W.; Methodology, W.X.; Writing—original draft, W.X.; Writing—review & editing, W.J. and C.Z. All authors read and approved the final manuscript.

Funding

This work was supported by the National Social Science Foundation of China (17BRK010).

Acknowledgments

The authors appreciate the insightful and constructive comments and suggestions of the editor and two anonymous reviewers. We also would like to thank Ming Li and Yunzhe Wang for their technical support.

Conflicts of Interest

The authors declare no conflict of interest.

References

  1. Grainger, A. National land use morphology: Patterns and possibilities. Geography 1995, 80, 235–245. [Google Scholar]
  2. Long, H.L. Land use transition: A new integrated approach of land use/cover change study. Geogr. Geoinf. Sci. 2003, 19, 87–90. [Google Scholar]
  3. Li, S.F.; Li, X.B. Progress and prospect on farmland abandonment. Acta Geogr. Sin. 2016, 71, 370–389. [Google Scholar]
  4. Zhang, B.L.; Gao, J.B.; Gao, Y.; Cai, W.M.; Zhang, F.R. Land use transition of mountainous rural areas in China. Acta Geogr. Sin. 2018, 73, 503–517. [Google Scholar]
  5. Mather, A.S. The forest transition. Area 1992, 24, 367–379. [Google Scholar]
  6. Mather, A.S. Recent Asian forest transitions in relation to forest-transition theory. Int. For. Rev. 2007, 9, 491–502. [Google Scholar]
  7. Grainger, A. The forest transition: An alternative approach. Area 1995, 27, 242–251. [Google Scholar]
  8. Barbier, E.B.; Burgess, J.C.; Grainger, A. The forest transition: Towards a more comprehensive theoretical framework. Land Use Policy 2010, 27, 98–107. [Google Scholar] [CrossRef]
  9. Lambin, E.F.; Meyfroidt, P. Land use transitions: Socio-ecological feedback versus socio-economic change. Land Use Policy 2010, 27, 108–118. [Google Scholar] [CrossRef]
  10. Jin, W.F.; Zhou, C.S.; Liu, T.; Zhang, G.J. Exploring the factors affecting regional land development patterns at different developmental stages: Evidence from 289 Chinese cities. Cities 2019, 91, 193–201. [Google Scholar]
  11. Shao, J.A.; Li, Y.B.; Wei, C.F.; Xie, D.T. The drivers of land use change at regional scale: Assessment and prospects. Adv. Earth Sci. 2007, 22, 798–808. [Google Scholar]
  12. Xie, H.L.; Li, B. Driving forces analysis of land- use pattern changes based on logistic regression model in the farming-pastoral zone: A case study of Ongiud Banner, Inner Mongolia. Geogr. Res. 2008, 27, 294–304. [Google Scholar]
  13. Peng, J.; Xu, Y.Q.; Cai, Y.L.; Xiao, H.L. Climatic and anthropogenic drivers of land use/cover change in fragile karst areas of southwest China since the early 1970s: A case study on the Maotiaohe watershed. Environ. Earth Sci. 2011, 64, 2107–2118. [Google Scholar] [CrossRef]
  14. Olaniyi, A.O.; Abdullah, A.M.; Ramli, M.F.; Alias, M.S. Assessment of drivers of coastal land use change in Malaysia. Ocean Coast. Manag. 2012, 67, 113–123. [Google Scholar] [CrossRef]
  15. Chi, V.K.; Rompaey, A.V.; Gerard, G.; Vanacker, V.; Schmook, B.; Hieu, N. Land Transitions in Northwest Vietnam: An Integrated Analysis of Biophysical and Socio-Cultural Factors. Hum. Ecol. 2013, 41, 37–50. [Google Scholar] [CrossRef]
  16. Sylvestera, K.M.; Brownb, D.G.; Deanec, G.D. Land transitions in the American plains: Multilevel modeling of drivers of grassland conversion (1956–2006). Agric. Ecosyst. Environ. 2013, 168, 7–15. [Google Scholar] [CrossRef]
  17. Chen, T.T.; Peng, L.; Liu, S.Q.; Wang, Q. Land cover change in different altitudes of Guizhou-Guangxi karst mountain area, China: Patterns and drivers. J. Mt. Sci. 2017, 14, 1873–1888. [Google Scholar] [CrossRef]
  18. Najmuddin, O.; Deng, X.Z.; Bhattacharya, R. The Dynamics of Land Use/Cover and the Statistical Assessment of Cropland Change Drivers in the Kabul River Basin. Sustainability 2018, 10, 423. [Google Scholar] [CrossRef]
  19. Long, H.L.; Tang, G.P.; Li, X.B. Socio-economic driving forces of land-use change in Kunshan, the Yangtze River Delta economic area of China. J. Environ. Manag. 2007, 83, 351–364. [Google Scholar] [CrossRef]
  20. Chen, J.F.; Wei, S.Q.; Chang, K.T.; Chang, K.T.; Tsaidet, B.W. A comparative case study of cultivated land changes in Fujian and Taiwan. Land Use Policy 2007, 24, 386–395. [Google Scholar] [CrossRef]
  21. Chen, C.C.; Xie, G.D.; Zhen, L.; Leng, Y.F. Long-term Dynamics of Cultivated Land Resources and Their Driving Forces of Guyuan City in Upper Reaches of Jinghe River. Chin. Geogr. Sci. 2008, 18, 033–040. [Google Scholar] [CrossRef]
  22. Chen, Z.; Lu, C.H.; Fan, L. Farmland changes and the driving forces in Yucheng, North China Plain. J. Geogr. Sci. 2012, 22, 563–573. [Google Scholar] [CrossRef] [Green Version]
  23. Li, X.M.; Zhou, W.Q.; Ouyang, Z.Y. Forty years of urban expansion in Beijing: What is the relative importance of physical, socioeconomic, and neighborhood factors? Appl. Geogr. 2013, 38, 1–10. [Google Scholar] [CrossRef]
  24. Yirsaw, E.; Wu, W.; Temesgen, H.; Bekele, B. Socioeconomic drivers of spatio-temporal land use/land cover changes in a rapidly urbanizing area. Appl. Ecol. Environ. Res. 2017, 15, 809–827. [Google Scholar] [CrossRef]
  25. Zhang, L.; Wei, Y.H.D.; Meng, R.M. Spatiotemporal Dynamics and Spatial Determinants of Urban Growth in Suzhou, China. Sustainability 2017, 9, 393. [Google Scholar] [CrossRef]
  26. Lin, G.C.S.; Ho, S.P.S. The state, land system, and land development processes in contemporary China. Ann. Assoc. Am. Geogr. 2005, 95, 411–436. [Google Scholar] [CrossRef]
  27. Li, T.T.; Long, H.L.; Liu, Y.Q.; Tu, S.S. Multi-scale analysis of rural housing land transition under China’s rapid urbanization: The case of Bohai Rim. Habitat Int. 2015, 48, 227–238. [Google Scholar] [CrossRef]
  28. Chen, C.; Gao, J.L.; Chen, J.L. Institutional changes, land use dynamics, and the transition of rural settlements in suburban China: A case study of Huishan District in Wuxi city. Habitat Int. 2017, 70, 24–33. [Google Scholar] [CrossRef]
  29. Cao, Y.G.; Bai, Z.K.; Zhou, W.; Wang, J. Forces driving changes in cultivated land and management countermeasures in the Three Gorges Reservoir Area, China. J. Mt. Sci. 2013, 10, 149–162. [Google Scholar] [CrossRef]
  30. Li, H.; Wei, Y.H.D.; Huang, Z.J. Urban Land Expansion and Spatial Dynamics in Globalizing Shanghai. Sustainability 2014, 6, 8856–8875. [Google Scholar] [CrossRef] [Green Version]
  31. Qin, W.S.; Zhang, Y.F.; Li, G.D. Driving mechanism of cultivated land transition in Yantai Proper, Shandong Province, China. Chin. Geogr. Sci. 2015, 25, 337–349. [Google Scholar] [CrossRef]
  32. Munthali, M.G.; Davis, N.; Adeola, A.M.; Botai, J.O.; Kamwi, J.M.; Chisale, H.L.W.; Orimoogunje, O.O.I. Local Perception of Drivers of Land-Use and Land-Cover Change Dynamics across Dedza District, Central Malawi Region. Sustainability 2019, 11, 832. [Google Scholar] [CrossRef]
  33. Liu, Y.Q.; Long, H.L. Land use transitions and their dynamic mechanism: The case of the Huang-Huai-Hai Plain. Acta Geogr. Sin. 2016, 26, 515–530. [Google Scholar] [CrossRef] [Green Version]
  34. Lesage, J.; Pace, R.K. Introduction to Spatial Econometrics; CRC Press Taylor & Francis Group: New York, NY, USA, 2009; pp. 45–75. [Google Scholar]
  35. Xu, X.L.; Liu, J.Y.; Zhang, S.W.; Li, R.D.; Yan, C.Z.; Wu, S.X. Remote Sensing Monitoring Data Set for Land Use and Cover in China(CNLUCC). Data Registration and Publishing System of Resource and Environment Science Data Center of Chinese Academy of Sciences. 2018. Available online: http://www.resdc.cn/ (accessed on 25 January 2019).
  36. GDEMV2 30M Resolution Digital Elevation Data. Available online: http://www.gscloud.cn/ (accessed on 10 January 2019).
  37. 1:20,000 National Basic Geographic Databases. Available online: http://webmap.cn/main.do?method=index (accessed on 14 January 2019).
  38. Chen, L.; Michishita, R.; Xu, B. Abrupt spatiotemporal land and water changes and their potential drivers in Poyang Lake, 2000–2012. ISPRS J. Photogramm. Remote Sens. 2014, 98, 85–93. [Google Scholar] [CrossRef]
  39. Ding, C.R.; Lichtenberg, E. Land and Urban Economic Growth in China. J. Reg. Sci. 2011, 51, 299–317. [Google Scholar] [CrossRef]
  40. Li, H.; Wei, Y.H.D.; Liao, H.F.F.; Huang, Z.J. Administrative hierarchy and urban land expansion in transitional China. Appl. Geogr. 2015, 56, 177–186. [Google Scholar] [CrossRef]
  41. Zitti, M.; Ferrara, C.; Perini, L.; Carlucci, M.; Salvati, L. Long-Term Urban Growth and Land Use Efficiency in Southern Europe: Implications for Sustainable Land Management. Sustainability 2015, 7, 3359–3385. [Google Scholar] [CrossRef] [Green Version]
  42. Long, H.L.; Qu, Y. Land use transitions and land management: A mutual feedback perspective. Land Use Policy 2018, 74, 111–120. [Google Scholar] [CrossRef]
  43. Tobler, W.R. A computer movie simulating urban growth in the Detroit region. Econ. Geogr. 1970, 46, 234–240. [Google Scholar] [CrossRef]
  44. Anselin, L.; Rey, S.J. Properties of tests for spatial dependence in linear regression models. Geogr. Anal. 1991, 23, 112–131. [Google Scholar] [CrossRef]
  45. Anselin, L.; Syabri, I.; Kho, Y. GeoDa: An introduction to spatial data analysis. Geogr. Anal. 2006, 38, 5–22. [Google Scholar] [CrossRef]
  46. Grossman, G.M.; Helpman, E. Trade, knowledge spillovers, and growth. Eur. Econ. Rev. 1991, 35, 517–526. [Google Scholar] [CrossRef] [Green Version]
  47. Krzywinski, M.; Schein, J.; Birol, I.; Connors, J.; Gascoyne, R.; Horsman, D.; Jones, S.J.; Marra, M.A. Circos: An Information Aesthetic for Comparative Genomics. Genome Res. 2009, 19, 1639–1645. Available online: http://circos.ca/ (accessed on 31 March 2019). [CrossRef]
  48. He, C.F.; Huang, Z.J.; Wang, R. Land use change and economic growth in urban China: A structural equation analysis. Urban Stud. 2014, 51, 2880–2898. [Google Scholar] [CrossRef]
  49. Wang, Y.; Bilsborrow, R.E.; Zhang, Q.; Li, J.F.; Song, C.H. Effects of payment for ecosystem services and agricultural subsidy programs on rural household land use decisions in China: Synergy or trade-off? Land Use Policy 2019, 81, 785–801. [Google Scholar] [CrossRef]
  50. Meijers, E.; van der Wouw, D. Struggles and strategies of rural regions in the age of the ‘urban triumph’. J. Rural Stud. 2019, 66, 21–29. [Google Scholar] [CrossRef]
  51. Jin, W.F.; Zhou, C.S.; Luo, L.J. Impact of Land Input on Economic Growth at Different Stages of Development in Chinese Cities and Regions. Sustainability 2018, 10, 2847. [Google Scholar] [CrossRef]
Figure 1. Sangzhi County in Wuling Mountain Area.
Sustainability 11 04915 g001
Figure 2. Survey photos of abandoned cultivated land in Sangzhi County.
Sustainability 11 04915 g002
Figure 3. Basic data.
Sustainability 11 04915 g003
Figure 4. Analysis framework of influence factors of land use transition in poverty-stricken mountainous areas.
Sustainability 11 04915 g004
Figure 5. Quantitative spatial distribution of influence factors of land use transition in Sangzhi County.
Sustainability 11 04915 g005
Figure 6. Chord diagram of land use type transfer in two periods. Note: CL denotes cultivated land, FL denotes forest land, GL denotes grassland, WL denotes waters, and URL denotes urban and rural construction land. The data demonstrate that the proportion of the area transferred from one type of land in the initial stage to the other in the final stage accounted for the transfer area of this type of land in that period. For a detailed explanation of chord diagrams, refer to the following site: http://circos.ca/ [47].
Sustainability 11 04915 g006
Figure 7. Spatial distribution of land use transition in Sangzhi County from 2010 to 2018.
Sustainability 11 04915 g007
Table 1. Index system for the quantitative analysis of land use transition.
Variable CategoryVariableDescriptionUnit
Interpreted VariablesFL2CLConversion of forest land to cultivated landha
GL2FLConversion of grassland to forest landha
CL2FLConversion of cultivated land to forest landha
GL2CLConversion of grassland to cultivated landha
CL2URLConversion of cultivated land to urban and rural construction landha
TerrainElevationAverage elevationm
SlopeSlope elevation°
HydrologyDis2WShortest distance to riversm
Territoriality Dis2NVShortest distance to natural village centerm
Dis2AVShortest distance to administrative village centerm
Dis2TSShortest distance to township governmentm
Dis2TShortest distance to town governmentm
Dis2CShortest distance to county governmentm
TransportationDis2VRShortest distance to village roadsm
Dis2RRShortest distance to rural roadsm
Dis2CRShortest distance to county roadsm
Dis2PRShortest distance to province roadsm
PopulationPopAverage population growth rate%
UrbanizationUrbAverage urbanization rate%
Public Finance ExpenditurePfeAverage change rate of public finance expenditure%
Table 2. Land use change transfer matrix (ha) of Sangzhi County, 2010–2018.
Land Use Types in 2010Land Use Types in 2018
CLFLGLWLURLTotal
CL65,154.15869.49300.6125.73453.3366,903.3
WL3474.45232,277.76208.26659.79228.06236,848.32
GL1688.223630.5136,209.0763.9919.3541,611.14
WL33.03122.5801029.421.081186.11
URL 5.6712.511.896.84511.47538.38
Total70,355.52236,912.8536,719.821885.771213.29347,087.25
Note: CL denotes cultivated land, FL denotes forest land, GL denotes grassland, WL denotes waters, and URL denotes urban and rural construction land.
Table 3. Internal conversion of land use types in Sangzhi County from 2010 to 2018.
Land Use TypesIncrease or Decrease Rate During the Period (%)Conversion Type 1Contribution Rate (%)Conversion Type 2Contribution Rate (%)Conversion Type3Contribution Rate (%)Conversion Type 4Contribution Rate (%)
CL4.91FL49.71URL25.92GL17.19WL7.19
FL0.03CL76.02WL14.44URL4.99GL4.56
GL−13.32FL67.21CL31.25WL1.18URL0.36
WL58.99FL78.23CL21.08GL0.00URL0.00
URL55.63FL46.49WL25.42CL21.07GL7.02
Table 4. Results of spatial relevance test for variables.
Interpreted VariablesFL2CLGL2FLCL2FLGL2CLCL2URL
Moran’s I0.3199 ***0.3382 ***0.1298 *0.0719*0.0799 ***
Explanatory variableElevationSlopeDis2TDis2NVDis2AV
Moran’s I0.4335 ***0.4264 ***0.4359 ***0.3548 ***0.4166 ***
Explanatory variableDis2TSDis2CDis2VRDis2RRDis2CR
Moran’s I−0.00350.7864 ***−0.07180.05450.2115 **
Explanatory variableDis2PRDis2WPopUrbPfe
Moran’s I0.7165 ***0.344 ***20.2066 **0.2379 ***− 0.0346
Note: *: Significant correlation under 10% confidence level; **: Significant correlation under 5% confidence level; ***: Significant under 1% confidence level. Other is no significant correlation.
Table 5. Spatial correlation test of land use transformation in mountainous areas of Sangzhi County.
Spatial Correlation TestFL2CLGL2FLCL2FLGL2CLCL2URL
Lagrange Multiplier (LM) (lag)1.94198.5341 ***2.8996 *8.1287 ***1.0126
Robust LM (lag)3.7125 *0.10170.20494.1211 **5.6459 **
LM (error)7.9309 ***8.4945 ***3.6613 *6.1463 **2.4101
Robust LM (error)9.7014 ***0.06210.96662.13887.0433 ***
Notes: *: Significant correlation under 10% confidence level; **: Significant correlation under 5% confidence level; ***: Significant under 1% confidence level. Other is no significant correlation.
Table 6. Spatial regression analysis of land use transformation and influence factors in Sangzhi County.
FL2CLGL2FLCL2FLGL2CLCL2URL
Elevation0.0476 0.0488 0.0371 −0.1695 *−0.3205 **
Slope−0.0059 ***−0.0011 −0.0057 ***−0.0164 ***−0.0001
Dis2W−0.1454 −1.0088 1.1832 −21.3594 **−44.0126 **
Dis2NV−0.6978 ***0.7107 *−0.3031 −0.7905 0.9176
Dis2AV7.4135 ***0.8827 6.9958 ***5.8137 29.4551 ***
Dis2TS−1.2612 ***−0.9608 −1.5503 ***1.1374 4.1304**
Dis2T0.4210 **0.1686 −0.4249 **1.2603 ***1.5212 **
Dis2C−0.3519 **−0.8019 **0.0665 0.4279 −4.5495 ***
Dis2VR−2.7261 3.4871 6.9422 ***−10.4978 **−9.2845
Dis2RR−0.0985 0.3209 −0.3905 *−1.4146 ***−1.6866 *
Dis2CR0.2713 0.8735 1.2779 ***−1.1452 *0.5424
Dis2PR0.0439 1.1331*** −0.1351 −0.9277 **1.2321*
Pop−0.0543 0.0361 0.0204 −0.3423 **0.9919 ***
Urb−0.1540 −0.3914 −0.1587 −0.8173 **0.9419
Pfe−0.0293 **−0.0308 −0.0723 ***−0.0564 **−0.0076
W*Elevation0.1169 −0.0244 0.2417 *−0.5038 *−0.3180
W*Slope−0.0186 ***0.0011 −0.0210 ***−0.0418 ***−0.0001
W*Dis2W54.5218 ***8.8070 59.6920*** 36.7964 35.7646
W*Dis2NV1.6318 ***4.4328 ***0.5211 −2.2738 **1.7365
W*Dis2AV 9.8095 **4.8530 12.4066 **−5.1335 4.8154
W*Dis2TS−6.6493 ***−3.2487 −6.8396 ***−7.2986 **0.0664
W*Dis2T−0.6960 *−0.3980 −1.1312** −0.0538 3.5310 ***
W*Dis2C0.0194 1.1678 **0.3324 0.3538 4.2506 ***
W*Dis2VR14.7821**−7.2570 26.1450 ***11.4441 −9.0691
W*Dis2RR3.1223 ***0.9218 −1.2920 4.5040 **−6.6422 *
W*Dis2CR4.5908 ***−1.9423 2.3060 ***6.2409 ***3.3055
W*Dis2PR−0.1445 −1.7685 **−0.6851 *2.1973 ***−1.9666
W*Pop−0.4651 ***−0.0960 −0.2640 −0.9986 ***0.2222
W*Urb0.3763 0.2915 0.2569 −1.9004 *5.2210 ***
W*Pfe−0.0295 0.0111 −0.1735*** −0.0157 −0.2006
W*FL2CL−0.4374 **----
W*GL2FL-−0.6532 ***---
W*CL2FL--−0.7494 ***--
W*GL2CL---−0.7408 ***-
W*CL2URL----−0.5047 **
R-squared 0.9340 0.9067 0.8855 0.8691 0.8766
Log likelihood124.0870 96.6056 115.9320 90.0028 65.7257
Akaike info criterion−184.1740 −129.2110 −167.8630 −116.0060 −67.4515
Schwarz criterion−130.9400 −75.9773 −114.6290 −62.7717 −14.2175
Notes: *: Significant correlation under 10% confidence level; **: Significant correlation under 5% confidence level; ***: Significant under 1% confidence level. Other is no significant correlation.

