Article

Return on Education in Two Major Vietnamese Cities

1
College of Business Administration, Kookmin University, Seoul 02707, Korea
2
School of Business Administration, Chung-Ang University, 84 Heukseok-ro, Dongjak-gu, Seoul 06974, Korea
3
Siemens Healthineers, Dong Da District, Hanoi 153213, Vietnam
*
Author to whom correspondence should be addressed.
Sustainability 2019, 11(18), 4903; https://doi.org/10.3390/su11184903
Submission received: 1 August 2019 / Revised: 27 August 2019 / Accepted: 4 September 2019 / Published: 7 September 2019

Abstract

:
To maintain its sustainable productivity growth, Vietnam needs to upgrade its education system. Although studies have examined the return on schooling in Vietnam, none have focused on Hanoi (the capital) or Ho Chi Minh (the biggest economy), which differ markedly from the rest of the country in terms of their levels of education and development. We address this gap in the literature using an extended version of the classic Mincerian human capital equation and data from the latest Vietnam Household Living Standard Survey (2016). The Heckman two-stage method is used to address selection bias. In the two cities, there is no wage premium for people with a general education. Thus, workers need to earn at least a vocational degree to increase their wages significantly over those of people with a general education. In general, Ho Chi Minh offers higher salaries (4.45%) and tends to reward experience, whereas Hanoi pays more for an additional year of education (1.95%). Therefore, Vietnam should promote vocational education and develop a more open, flexible system that is less dependent on credential hiring, especially in the public sector. Lastly, we highlight the need to study returns on sustainable education in specific economic regions in Vietnam.

1. Introduction

According to a McKinsey report [1], in the coming years, Vietnam will need to improve its overall labor productivity growth by more than 50 percent if the economy is to meet the government’s target of 7 to 8 percent annual growth by 2020. Failing this, the country’s growth is likely to decline to between 4.5 and 5 percent. For the past few decades, the Southeast Asian country has enjoyed significant benefits from structural transformation (in particular, the labor force’s transition away from agriculture). However, McKinsey [1] also points out that this instrument of economic growth will soon lose its effectiveness. As such, Vietnam needs to find other ways of increasing its productivity performance.
Like many developing countries, Vietnam has prioritized its education system as a means of providing skilled workers. In particular, the return on schooling as a central policy parameter has been studied and estimated by several researchers, especially since the market reforms in the 1990s [2]. This study also aims to identify the wage earnings attributable to education in Vietnam. However, we focus on the country’s two most significant economic hubs (Hanoi and Ho Chi Minh City (HCMC)) using data from the 2016 Vietnam Household Living Standard Survey.
Previous studies on the return on education in Vietnam have all focused on the country level. Although this is often the case for studies of this kind, several studies have investigated individuals’ income heterogeneity, rather than regional disparities, including studies on Sweden [3], China [4], Brazil [5], and Poland [6]. These studies are based on the theory of new economic geography, which suggests that regional competitiveness is closely related to economic geography and the regional economy. Their empirical findings all confirm differences in the returns on education between regions within the same country. What causes these differences? According to Roback [7,8], who studies data from the 98 largest US cities, persistent regional wage differences can be explained largely by local attributes, particularly quality of life and amenities (e.g., infrastructure, pollution levels, and climate and other natural endowments). Furthermore, Hanushek and Kim [9] assert that the “quality” of the labor force can explain differential economic growth within regions. Conducted at the country level for 150 nations, the latter study uses cognitive skills in mathematics and science (through comparative tests for children) as a measure of labor quality, emphasizing the importance of investing in education and training. Finally, with the rise of creativity as a fundamental economic force, vibrant communities built on a “people climate” have become locations that attract companies and better quality labor. This is especially true of the “creative class”, a new socioeconomic class identified by American economist Richard Florida that can spur regional economic growth through innovation [10].
Hanoi and HCMC are often compared in a similar way to Beijing and Shanghai, Madrid and Barcelona, and Sydney and Melbourne [11]. Undoubtedly, both have been driving forces behind the dramatic economic growth in Vietnam. In addition, the two cities have the highest concentration of colleges and universities in terms of both number and quality [12] and are the leading destinations for migrant workers. Owing to their significant roles in the development of Vietnam, the two cities have been studied separately and compared with the rest of the country. However, until 40 years ago, the country was divided into Northern Vietnam (with Hanoi as its capital) and Southern Vietnam (with HCMC, Saigon at the time, as its capital). Thus, each city possesses its own characteristics, culture, and business environment, all of which can potentially influence the labor market.
As a result, estimating and understanding the differences in the return on schooling in Hanoi and HCMC requires understanding the circumstances in each case, which might differ from the overall picture of the country. 
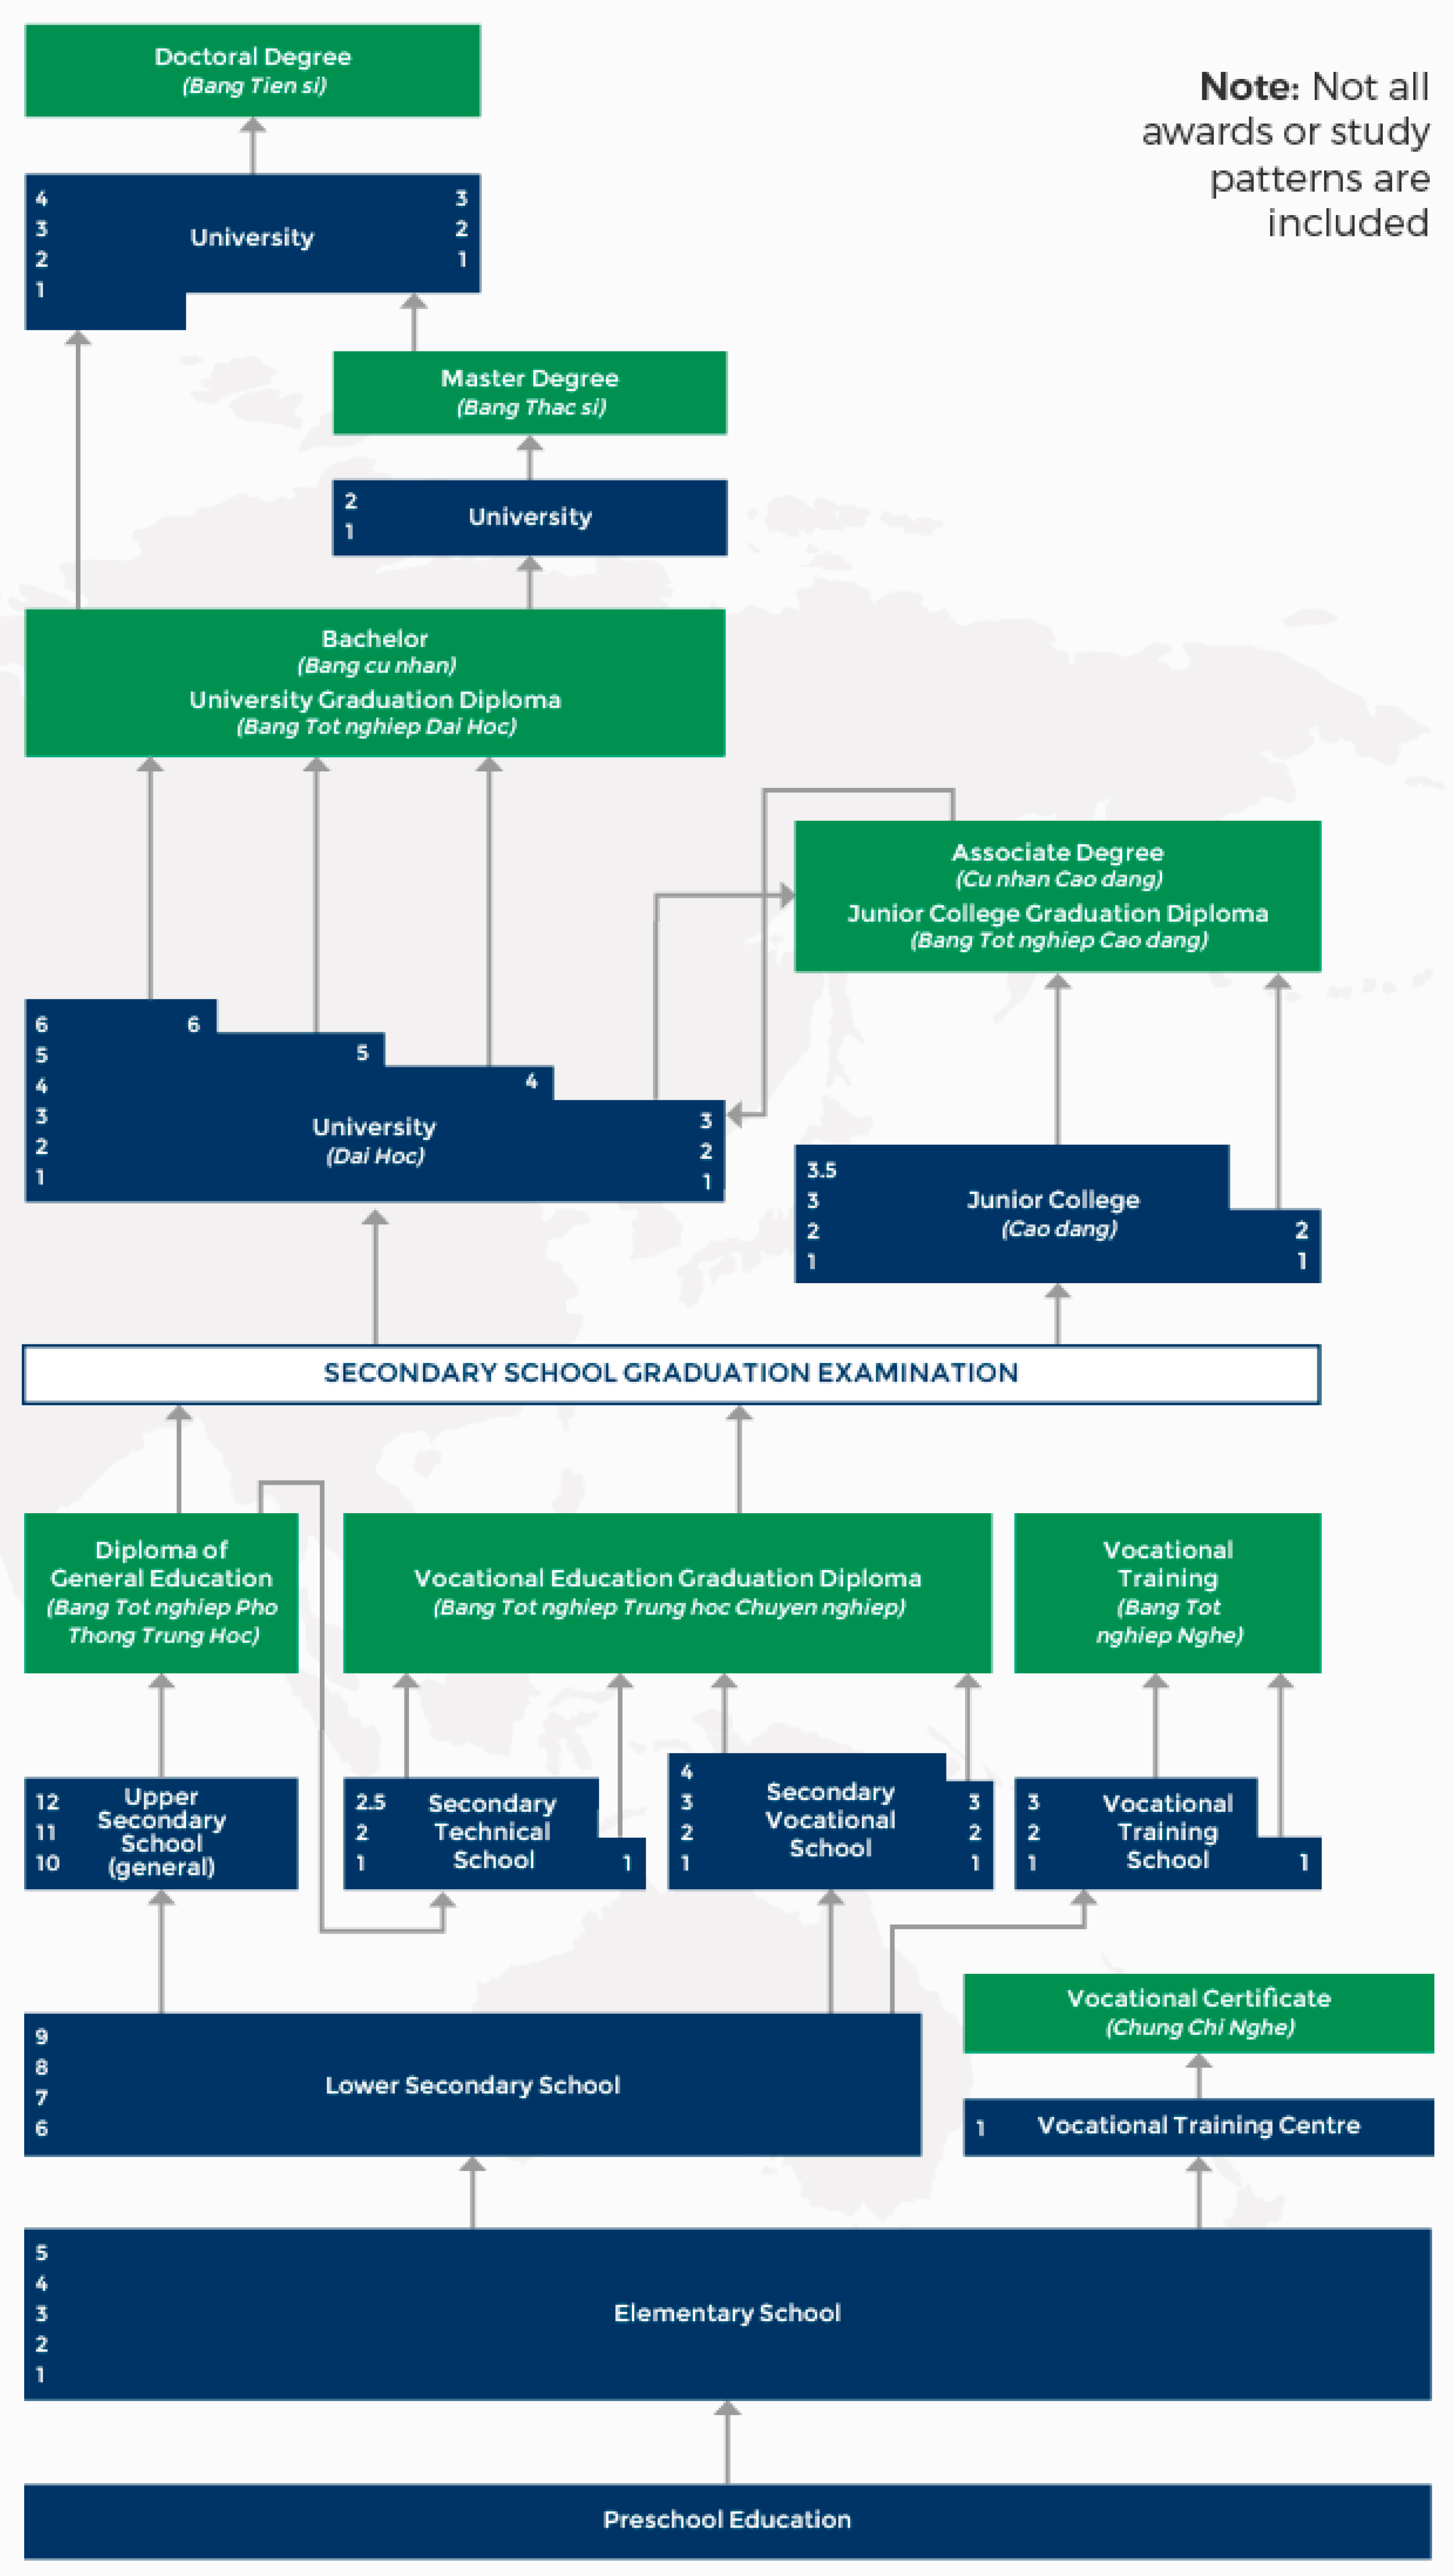
Figure A1 describes the overall education system in Vietnam. Moreover, as in many developing countries, there is much provincial variation, even within the same region. Hence, it is important that we focus on the provincial level [13]. Therefore, the second purpose of this study is to suggest ways in which to provide a better framework for education, training, and labor in each city.
Our empirical results reveal that Vietnam should promote vocational education and develop a more open, flexible system that is less dependent on credential hiring, especially in the public sector, to achieve sustainable productivity and economic growth. This finding is consistent with that of a study documenting the importance of higher education to economic growth in China [14]. Given these findings, we argue that to maintain its sustainable productivity growth, Vietnam needs to upgrade its education system. We also point out a flaw in Vietnam’s labor market efficiency, which stems from the country’s cultural roots, overemphasizing education and credentials. This emphasis is somewhat old-fashioned, given the rise of the creative industry and the freelance generation. Furthermore, it is severely inefficient, given the low quality of education in Vietnam. This issue is sensitive because, for a long time, an important topic of discussion among Vietnamese people (that has never officially been studied or documented) is that Vietnamese society (i.e., Northern Vietnam, or Hanoi, more so than Southern Vietnam, or HCMC) remains overly conservative, status-driven, and inflexible. In the public sector, the capacity limitations, lack of effort toward making changes, and conservative thinking with regard to labor recruitment are even more emphasized. (We implicitly assume that the location choice between Hanoi and HCMC is largely exogenous, because the two cities are characterized differently in Vietnam. For example, Hanoi is the center of politics in the nation, whereas HCMC is an economic hub. Hence, as in the model of Lucas [15] on economic development, we regard Hanoi and HCMC as two individual economies).

1.1. Hanoi and HCMC: The Tale of Two Cities

For the past century, Vietnam has witnessed a tale of two cities. Hanoi is the capital and a long-time political, economic, and cultural center, whereas HCMC is the largest city in terms of population and is the leading economic, social, and technological hub of the country. In terms of economic significance, the two cities are by far the largest contributors to the state budget revenue, with HCMC contributing 15.32 billion $ in 2017, outperforming all other cities and provinces in the country [16]. As a developing economy with a rapid urbanization rate, Vietnam also suffers from a widening gap between urban and rural poverty. Large hubs, such as Hanoi and HCMC, that offer better wages, education, and overall lifestyle attract a significant number of migrants who have moved away from their rural homes to the cities. According to the 2015 National Internal Migration Survey, migrants account for 16.3% and 20.7% of those aged 15–59 living in Hanoi and HCMC, respectively, which are both higher than the national average. Most migrants seek employment, with the majority of the rest migrating for education. Migrants also tend to marry later and have a higher level of education (professional/technical qualifications or college/university) than non-migrants. These factors all have a considerable impact on education, health care services, and employment in migrant destinations, especially in regions with a high level of young migrants, such as the Red River Delta and Hanoi.
After the fall of Saigon in 1975, Vietnam was formally reunified. Peace was restored, and the country began to develop. Nevertheless, differences in natural endowments and history have helped establish certain distinguishing characteristics (even stereotypes) of Northerners and Southerners, represented by Hanoi and HCMC, respectively. Hanoi is the capital and has a long history, rich culture, and extreme cold and hot seasons. As such, it is somewhat more traditional, cultured, formal, and introverted. In contrast, the younger HCMC is an international port with a tendency toward openness and has a more favorable climate. Hence, it is much more dynamic, vibrant, and casual. These differences in history and culture have shaped a contrasting mindset in Vietnam’s two largest cities when it comes to business. Home to the ruling elite for many years, Hanoi has a hierarchical society in which strong political connections tend to carry much weight [17]. Owing to its development path and position as the capital, Hanoi also has more state-owned enterprises (SOEs), which might reinforce this tendency. In contrast, HCMC has always been a welcoming destination for traders and entrepreneurs. Therefore, it tends to be more “fluid, multicultural, and outward-looking” than the capital [17]. An online article on start-ups in Hanoi and HCMC sums up the business subcultures in the two cities: Hanoi has more qualified engineers who, in general, are also more talented; HCMC has better business-minded entrepreneurs [18]. As a result, for the past decade, Hanoi has been trying to refresh and rebrand its image as a more open, nurturing place for talent. However, differences remain. Taken together, we predict that Hanoi is more rewarding for people who have a better education. In contrast, the flexible and fast-moving culture in HCMC might be more responsive to factors other than qualifications, such as experience. Therefore, we explore the return on schooling in these two cities, comparing them with each other and with the country as a whole, based on the findings of previous studies.

1.2. Scope and Structure

We use data from the Vietnam Household Living Standard Survey conducted by the General Statistics Office of Vietnam to estimate the return on schooling in Hanoi and HCMC. Note that other unobservable factors, such as the role of labor unions, efficiency wage, school quality, and so on, are beyond the scope of this study.
The remainder of the paper proceeds as follows. Section 2 reviews the literature on human capital theory and discusses returns on schooling from both an international perspective and in relation to Vietnam. Section 3 discusses our data and methodology, and Section 4 presents our descriptive and econometric findings. Lastly, Section 5 concludes the paper.

2. Literature Review

Many studies have examined returns on schooling for various geographic locations and periods, finding a positive correlation between education and the level of success of individuals in the labor market. That is, better-educated people are more likely to find better jobs and enjoy higher wages and are less likely to suffer from unemployment [19]. Studies such as those of Psacharopoulos [20,21,22] show a relatively consistent pattern around the world over time. More recently, an ambitious study assembled empirical findings from 139 countries and 819 household surveys, all with comparable estimates, databases based on the same specifications, estimation procedures, and so on [23]. These results reinforce the findings of previous studies. That is, private returns on schooling are positive, in general, but decline as investment in education increases. In addition, women receive a greater reward for higher education than men do, and the estimated return on education seems to be higher in low- and middle-income countries. However, a study that targets developing countries [24] finds no evidence that the returns on schooling in these countries are systematically higher than those in developed economies. In contrast to the findings of older studies, recent studies find that, globally, private returns on tertiary education are now highest, followed by returns on primary and secondary schooling [25]. This is mostly because primary school attendance has become compulsory in many countries. These studies show that returns on schooling cannot be measured by a single parameter because they are influenced by various characteristics and background of an individual [19]. This point is discussed in greater detail in the following section.

2.1. Mincer Equation

How to accurately measure the causal effect of education on earnings is the source of much debate. Nevertheless, many studies on earnings attributable to education adopt Mincer’s classic earnings function [26], which models the natural logarithm of an individual’s earnings as a function of completed school years and experience, as follows:
Ln wi = α + βSi + β1Xi + β2Xi2 + ε,
where w denotes an individual’s earnings, S denotes an individual’s years of schooling, X denotes an individual’s years of experience, and ε is a disturbance term representing other unobserved factors that determine wages but cannot be measured.
The use of the log transformation serves several purposes. First, it allows us to interpret the result as a percentage term. Moreover, the distribution of log earnings is very close to a normal distribution and helps exclude negative earnings values (i.e., when individuals receive “income” in the form of a government subsidy and do not pay tax) [27]. However, this issue is not really a concern here. Furthermore, various studies use different earnings measures (annual, weekly, hourly).
The Mincer equation depicts a linear relationship between education and earnings; that is, each additional year spent in school increases wages in a linear, constant, and proportional manner throughout the year. However, this relationship does not always hold. In addition, this measure has flaws when adopted for countries where students can follow different school tracks and, thus, cannot be grouped into one years-of-schooling unit. For example, depending on their plans, students may attend a college or vocational school or might begin working after leaving high school [19]. As a result, more recent studies prefer to use dummy variables for the completed education level as an alternative measure of education. The reasoning behind this approach is called the “sheepskin effect” [28,29], which hypothesizes that obtaining a degree is more rewarding than spending the same amount of time at school without earning a certificate. Thus, surveys now ask for the degrees that people have acquired in addition to the number of years of school they have completed. Nevertheless, Harmon et al. [30] show that the assumption of a linear return on schooling, despite being a strong assumption, is “remarkably hard to reject.” Therefore, in this study, we use both methods to measure education in our regressions.
Lastly, a quadratic measure of experience is used to express the concave relationship between age and earnings. In other words, the benefits of education may vary with age groups. Typically, the benefits increase relatively quickly at the beginning of a person’s career, but then slow down, and even decrease as he/she approaches retirement [31]. Since it is difficult to obtain accurate information on a person’s relevant experience, most studies construct a “potential experience” variable (as proposed by Mincer). This variable is typically equal to an individual’s age minus the number of completed years of schooling minus six: X = A − S − 6 (assuming that he/she starts school at the age of six and begins to work immediately after graduation).
However, the Mincer equation has been criticized, particularly for its potential for bias. Nevertheless, the human-capital earnings function has provided a framework for most studies on returns on education, owing to its ease of use, simplicity, and intuitive appeal. In fact, several works [23,32] have examined the results from various studies, and note that the basic Mincerian model is more stable than may have been expected. Next, we discuss some of the most debated issues, followed by ways in which these limitations can be overcome within the constraints of this study.

2.2. Extended Mincer Equation

2.2.1. Ability Bias

One of the most discussed drawbacks of the Mincer equation is the extent to which schooling is endogenous, owing to people’s unobserved abilities [33]. Economists realized that ability and schooling are likely to be correlated (most likely positively), and if ability affects earnings, the estimated return on education will potentially be upward biased [34]. In other words, higher earnings might mistakenly be credited to a higher level of education when, in fact, they are the result of greater abilities. Individuals with superior abilities are more likely to do well in job interviews and, in general, perform better in their jobs (and, hence, have higher earning outcomes). However, this finding is not necessarily because they have a higher level of education.
Several approaches have been proposed to tackle this issue. One option is to include a proxy variable that represents inherent ability. For example, IQ test results [35,36,37] are thought to be strong predictors of education [32]. However, indicators of ability are, in general, not perfect, and are not always present in regular data sets. Another approach is to use data on twins and siblings [38,39,40,41] who share the same family conditions and, sometimes, abilities in order to eliminate any omitted-ability bias. After the bias is removed, the differences in earnings between the siblings and twins is then credited to education. Other studies use panel data or repeated observations over time [42,43] to eliminate unobserved abilities because the effects on the return on education of these latent variables are constant over time.
A final and quite popular method for dealing with ability bias is the use of instrumental variables (IV) for schooling. Following the requirement of IVs, a valid instrument should be correlated with the exogenous variable (education), but not with ability and, thus, not with earnings. Various studies have adopted IVs from the supply (institutional features) and demand sides. Examples of institutional features include proximity to the nearest high school/university [44,45,46], the minimum school leaving age [47,48], and school quality [49]. From the demand side, studies have used quarter of birth [50,51], family background, such as parents’/father’s education [52,53], and income as IVs. The IV method has limitations, especially the issue of weak instruments, which leads to an asymptotic bias toward the corresponding ordinary least squares (OLS) estimates [19]. Spence [54] points out that individuals’ latent abilities might already be reflected in their acquisition of an educational degree, because people with higher abilities know that earning a degree is an effective way to communicate or send a signal to potential employers. In other words, education can be interpreted as a means through which to enhance productivity or as an indication of existing inherent productivity. Spence also argues that firms tend to believe that credentials are positively correlated with better-quality candidates and rely on these credentials when making recruitment decisions [54].
Nonetheless, in their comprehensive reviews of the literature, Becker [55], Griliches [33], and Becker and Tomes [56] come to a similar conclusion that ability bias is overestimated. Furthermore, they find that these biases are small, with ability only explaining 1% of the returns on education [33]. According to Griliches [33], when schooling is treated symmetrically with ability measures, it may be subject to measurement error, and may also be correlated with the error term in the earnings function. Therefore, biases caused by unobserved-ability variables and measurement errors tend to cancel each other out. In the words of Heckman, Lochner, and Todd [57], the study of endogeneity in relation to returns on schooling “is far from settled”.

2.2.2. Selection Bias

The problem of selection bias in the Mincer model was first raised and discussed by James Heckman [58]. The argument here is quite simple. With this earnings equation, we can only capture representative information of the wage-earner population (a subset of the actual population under study), thus excluding those who are unpaid or unemployed. This causes a nonrandomly selected sample and, consequently, a downward bias in the OLS estimates when using the Mincer equation. Here, we employ the two-stage Heckman correction method to address the issue of selection bias. Statistical software packages such as Stata offer simple ways in which to execute this two-step estimator. The following is a brief explanation of the method.
First, we have the basic wage Equation:
Wi = Xiβ1 + u1i,
where W is an individual’s earnings, and Xi is a vector of her schooling, experience, gender, and so on, related to her productivity. We can only observe W when the person enters the waged labor market. When individuals do not enter the labor market, it is likely that their offered wage is below their reservation wage.
We then have a second equation relating to employment, that is, the lowest rate at which an individual would be willing to accept a particular job offer:
E*i = Ziβ2 + u2i,
where Zi is a vector of explanatory variables (schooling, experience, gender, parents’ income, and/or education, which explain her constraint), and E*i = Wi − E’i is the difference between the wage and the reservation wage E’i. Equation (1) can be a probit-type selection model describing whether a person will decide to work. If the wage is below the reservation wage, she chooses not to work. We observe only an indicator variable for employment, defined as E = 1 if E*i > 0, and E = 0 otherwise.
Furthermore, we assume that the error terms u1i and u2i are normally distributed with mean zero and are positively correlated. Here, (u1i, u2i) are independent of both sets of explanatory variables X and Y:
u1i~NID (0, δ2) and u2i~N (0,1)
cov(u1i, u2i) = ρ12,
where ρ12 is the correlation coefficient.
Heckman’s two-step model first estimates a so-called inverse Mills ratio (or Heckman’s lambda) using the following probit model:
λi = ϕ(Ziβ2)/Φ(Ziβ2),
where ϕ denotes the standard normal density distribution, and Φ is a normal cumulative distribution function. In the second step, λi is used in the original wage Equation (1a), as follows:
Wi = Xiβ1 + δ12λi + ηi.
As long as u2i is normally distributed and ηi is uncorrelated with (or independent of) λi, the Heckman model is consistent [59].
One of most challenging tasks when employing the Heckman two-step model is to find a good identification strategy. All explanatory variables used to predict the likelihood of employment are based on human capital theory. Weakly identified variables can worsen the results or show misleading results when attempting to correct the sample selection bias, producing large distortions.
Finally, other factors in addition to latent abilities might affect a person’s earnings, such as gender, marital status, job industry, and job sector, among others [60,61]. Therefore, the original Mincer equation is extended here as follows:
Ln wi = α + β1Zi + β2Xi + β3Xi2 + ε
where Ln w is an individual’s log monthly/hourly wage, Z is an education-level dummy, X denotes age/potential experience, and ε represents other control variables.
The regression is also run using the Heckman correction model, using appropriate IVs to check for selection bias (see the Methodology section).

2.3. Studies on the Return on Education in Vietnam

The return on schooling has been a topic of interest for researchers in Vietnam, with most results showing a positive relationship between education and earnings, although with different magnitudes.
Most prior studies that describe the benefits of a return on an investment in education have been based on the USA. For example, McMahon [62] offers new estimates of the social rates of return for a high school education and for a four-year college education for males and females in the United States, using microeconomic data from US Census Bureau surveys for the period 1967 to 1988. These are compared with real rates of return on investments in plant and equipment and in housing since 1947. The results reveal a significant decline in the returns on a junior high school education for those who leave (from 21 to 7%), steady rates of return on a high school education, averaging 12%, and real rates of return at the college level, rising gently to 12–14% levels in the late 1980s, with a dip in the mid-1970s. The rates of return on housing, including capital gains, were only 5% during the same period, compared with 15% for investments in plant and equipment. In addition, Psacharopoulos [63] provides a broad overview of human capital theory and presents highlights of the most recent evidence on private and social returns on education. A distinction is made between narrow social returns, as traditionally estimated in the economics of education literature, and wide social returns, which include externalities. The distributive implications of several education finance policies are discussed. We conclude that the policies most conducive to social welfare are those that prioritize investment at the lower levels of education, including preschool, and the acquisition of general, rather than occupation-specific, skills.
A few studies focus on the period after the Doi Moi (English: Renovation) economic reforms initiated in 1986, which aimed to abolish the command economy and create a “socialist-oriented market economy”. In particular, Moock, Patrinos, and Venkataraman [64], using earnings data from 1992 to 1993, estimate that the rates of return were relatively low compared with those of other developing countries during that time. The returns on primary and university education averaged 13% and 11%, respectively, but were only 4% to 5% at the secondary and vocational levels. Gallup [65] reports similar results, stating that the payoff for one additional year in school, which doubled from 1993 to 1998, was still low at 5%.
However, Liu [66] observes a considerable shift in demand toward more educated workers between 1992 and 1998, when the earnings of people with a tertiary education increased significantly in comparison with workers with a below-primary education. In a more recent work, using updated data from for the period 1998–2014, Doan, Tran, and Le [67] estimate a greater increase during this same period than do Glewwe and Patrinos [68], Gallup, [65] and Moock, Patrinos, and Venkataraman [64]. The authors also conclude that returns continued to increase until 2008, after which they appeared to decrease between 2008 and 2014, which they credited to the rapid expansion of education and the slow-down of economic growth and transformation.
Furthermore, one of the most common findings in these works is higher returns on education for female than for male workers in the labor market (similar results have been found in other countries). Studies on wage inequality [65,69,70] all find a sharp reduction in gender pay gap disparities for the wage-employed population associated with the Doi Moi reform. However, using the decomposition method, these studies find that the convergence of the Vietnamese gender gap in the 1990s hid an adverse change in discrimination. As in China, women still faced substantial wage discrimination owing to employers’ preferences and the competitiveness of female employees [69].
As a transitional economy, Vietnam has a somewhat distorted labor market. Using data from 1993 to 2008, Phan and Coxhead [71] explore a more interesting dimension of inequality: Households with and without access to jobs in the state sector. Economic policies biased toward SOEs have yielded certain privileges for public servants. State-sector jobs provide stable incomes, promotions, and overall longevity and are also, in general, less demanding in terms of time and productivity. This leads to fierce competition for bureaucrat positions despite the relatively low salaries. In addition, because the number of available positions is limited, organizations tend to favor people with connections based on family ties. As a result, according to Phan and Coxhead [71], households with these types of “relationships” (or quan he) tend to invest more in education for their children. In contrast, families who have little incentive to study or obtain credentials encourage their offspring to opt out of school early and sometimes use that investment money as a bribe for a job [67]. This phenomenon has caused severe corruption in the Vietnamese labor market, popularized in the term “Con ong chau cha” (similar to the idiom “born with a silver spoon in the mouth”), which refers to people who are hired and promoted based on their parents’/grandparents’ connections. However, since the economic reform, Vietnam has tried to privatize SOEs, promote private firms in specific industries, and attract foreign investment. Therefore, the situation may have changed since then.
Lastly, other studies have adopted different methods, such as ethnic inequality [72] or returns on private versus public schooling systems [68]. However, thus far, no studies have focused on regional differences or analyzed the two biggest cities separately, although Gallup [65] does estimate that workers in Hanoi and HCMC received a substantial (50% higher) wage premium over the rest of the country in the period between 1993 and 1998.
Studies on the return on education in Vietnam often face difficulties related to data availability and sufficiency. Most research on this topic uses data from the Vietnam Household Living Standard Survey conducted by the Vietnam General Statistics Office, which, until 2002, was criticized for employing relatively small samples. Moock, Patrinos, and Venkataraman [64] recognize the limitation in their analysis that they could only include wage-earners, even though 80% of the Vietnamese labor force was self-employed at the time. Moreover, most studies, except for a few recent works [67,73], do not consider proxies for individual ability or the motivation provided by family resources, even though investment in education in Vietnam faces a high liquidity constraint [68,74]. Some acknowledge, but do not include selection bias in their analyses [64,70].
This study, despite overcoming several of the limitations of previous studies, deals with similar shortcomings related to the data. In the next section, we discuss our data set and methodology.

3. Data and Methodology

3.1. Data

The Vietnam Household Living Standards Survey (VHLSS) (before that, the Vietnam Living Standard Survey (VLSS)) was one of the two most important household surveys developed in Vietnam during the 1990s. The first two VLSSs were implemented in 1992–1993 and 1997–1998, with technical assistance from the World Bank and funds from the United Nations Development Program and Swedish International Development Cooperation Agency. Despite being of a high quality and covering a wide variety of topics, the survey has been criticized for its relatively small samples and implementation frequency of every five years, which many believe is too low for obtaining up-to-date information for social monitoring. As a result, the Vietnam General Statistics Office developed a strategy for the second wave of this survey that would span 10 years (2000–2010). They combined this with a large, but similar survey (Multi-purpose Household Survey) conducted once every two years, and a rotating module household survey. The new VHLSS, though simplified, still includes detailed sections on demographic characteristics, education, employment, income, expenditure, and so on, for the Vietnamese population. However, note that households from the original VLSS panel were not interviewed again.
This study uses the results from the latest VHLSS (2016) and, to the best of our knowledge, is the first to do so. The data set includes information on 2482 individuals from Hanoi and 2262 from HCMC (over the age of 15 years and currently part of the labor force). The data provide sufficient variables for analysis.

3.2. Methodology

As stated earlier, we use the following extended version of the Mincerian equation to estimate the causal effects of education and labor market outcomes in Hanoi and HCMC:
Ln wi = α + β1Zi + β2Xi + β3Xi2 + ε
where Ln w is the log of an individual’s earnings, Z is a dummy for the educational attainment level, X is his/her age, and ε is a vector of other control variables.

3.2.1. Dependent and Independent Variables

Income (or wage): In the traditional Mincerian framework [26], the dependent variable is either income or wage, where both are equally valid. Here, we calculate a person’s earnings as the average monthly wage plus the total bonus (if any) divided by 12 months. The monthly wage seems a more appropriate choice than the hourly wage because all salaries in Vietnam are negotiated and calculated on a monthly basis. All monetary amounts are expressed in Vietnamese dong (hereafter, VND).
Age versus potential experience: Most studies using the Mincerian equation construct a “potential experience” variable by subtracting the average years taken to obtain a degree and six (the age when a person typically starts receiving a formal education) from the individual’s age. This assumes that the person stays in school until she finishes her degree, which is not necessarily true for holders of postgraduate degrees in Vietnam. In Vietnam, people tend to keep working while obtaining a master’s degree or PhD (e.g., by taking classes at night, after work, and/or weekends). Sometimes, companies pay for their employees to obtain a degree, and allow a flexible schedule for them to study while working. The only time when a person most likely spends her entire time at graduate school is when she goes abroad. However, no information is available on this group; furthermore, this subpopulation accounts for a small portion of the overall labor force. Thus, using a potential experience variable, we might exclude two years of work experience for master’s degree holders and another three to four years for people who have a PhD. In addition, in the Vietnamese context, aside from work experience, “life experience”, relationships, and connections acquired through the labor market are almost as important. Therefore, we use Age as an independent variable. According to [29], who compile OLS estimates for various European countries, using “age” tends to produce the lowest returns.
We also use the square of a person’s age to capture the concave relationship between age and earnings, as explained in the previous section.
Educational level: Vietnam’s education is arranged on a national level by the Ministry of Education and Training following the typical education system, ranging from primary school to a doctoral degree (for more details, see Appendix A). Only the five years of primary education are mandatory, with very high literacy rates of 97.3% [75].
Vietnam also has a vocational system, consisting of elementary vocational school, middle-level vocational school, and professional school. This vocational track can start either after higher-secondary, lower-secondary, or even primary education, and lasts between six months and two to three years, depending on the courses and programs.
The VHLSS records an individual’s education level from “No qualification” to “Doctoral degree”, as well as his/her current grade (if any). It also provides separate information for those who have obtained a secondary, post-secondary, or vocational educations. Here, we use variables for both the highest educational level and estimated years of schooling in our regressions.
Estimated years of schooling is a convenient and effective variable for comparing the average rates of return on an additional school year between the two cities, as well as for describing other data. If a person earns both a higher education and a vocational degree, her years of schooling should be the sum of both degrees.
We also use the highest educational level obtained. When a person has both a regular and a vocational degree, there is no way to identify when and in what order the person obtained these credentials. However, for the sake of analysis, when a person has a secondary education (or lower) and vocational degree, then the vocational credentials are counted. Otherwise, if a person has both a vocational degree and tertiary education (college, university, and higher), the latter is listed as her educational level. This choice is based on an assumption of which credentials might be more relevant when applying for a job. For example, if a person has a high-school degree and a vocational certificate, she would list both on her résumé. However, the vocational education is likely to be more related to the job and, hence, has more value to the employer. Conversely, whereas a vocational degree might be useful on a person’s résumé, if the person takes extra time to earn a higher education, it is likely that she wants to find a better job, which she would not get with vocational credentials only.

3.2.2. Control Variables

Gender, Ethnicity, Migrant (whether the person was born in another province), and Area (urban/rural) are factors that might affect an individual’s earnings and, thus, are included as control variables.
For an employer, Economic sector, Firm type, and Job level (occupation category) are constructed as employment variables. The VHLSS categorizes participants into 99 economic sectors, which we group into larger sectors for analytical convenience. Firm type includes dummies for public firms, private firms, individual households, and foreign direct investment (FDI).
Occupation category is divided into eight categories, from low-skilled workers to leaders/managers. Different job levels might have different attitudes toward credentials. For example, becoming a director has many requirements in terms of experience and skill sets, but education is less relevant if the person has a good work record. However, at lower/entry-level positions, companies tend to consider a person’s educational level when making an assessment. Thus, we exclude skilled laborers in agriculture, forestry, and fisheries (owing to very few observations in Hanoi and HCMC) and members of the army (owing to sensitive issues) in the occupation category. (The World Bank Survey Manual describes how to sort observations into occupation categories: http://microdata.worldbank.org/index.php/catalog/2729/download/39053. Note that the General Statistics Office does not provide online instructions for the survey).
Both firm type and job level help us include the informal job sector (for the ILO guidelines on the statistical definition of informal employment, see http://ilo.org/wcmsp5/groups/public/---dgreports/--stat/documents/normativeinstrument/wcms_087622.pdf. However, note that Vietnam, to some extent, has its own definition of this sector) in the data set. They also help us overcome the limitation faced by several previous works that were forced to exclude this subpopulation owing to the nature of the survey. Indeed, the informal economy is an important sector for a developing country such as Vietnam [64,76], and studies have shown evidence of an education premium for highly skilled workers in the informal sector [77]. With the new VHLSS survey, the informal sector is now covered (or partly covered) under individual household businesses (in the firm-type category) and low-skilled workers/manual labor (job-level category). For a detailed list of the variables and their category values, please see Appendix B.

3.2.3. Bias Issues

In their study exploring different sets of exogenous instruments on both the supply and the demand side to explain the variation in schooling in Vietnam, Arcand, d’Hombres, and Gyselinck [78] conclude that only parental education (along with an HT matrix of instruments) satisfies the necessary requirements. Unfortunately, the way that the VHLSS is designed does not allow us to capture such information. In particular, the survey is conducted at the household level, interviewing the household head. Therefore, there is no way to obtain education information for people who do not live with their parents. Furthermore, some people live in one household (e.g., a son/daughter in law or cousins), but their parents, who influence their education choices, live in a different home. Therefore, constructing a parental education variable diminishes the sample size dramatically. Attempts to extract similar family background information, such as parents’ income, job sector (private/public), and so on, face the same problem. Moreover, fixed effects using panel data are not practical because the VHLSS does not survey the same sample over time. Therefore, the returns on schooling in this study are assumed to be unaffected by unobservable individual abilities. This is one of the limitations of using the VHLSS data.
With regard to the explanatory variables used for the selection equation in the Heckman correction model, we use household size, a dummy variable indicating whether a person is the household head, marital status, and household non-wage income as IVs. The rationale for these choices is that, although they affect a person’s decision on when to enter the workforce in Vietnam, employers are unlikely to consider these facts when hiring someone. A variable for the number of children might potentially be a more effective variable than marital status. However, this information is not available owing to the survey structure, as explained earlier. In addition, Doan, Tran, and Le [67] use household non-wage income as an IV, reasoning that families with this type of additional income (from a family business, agriculture activities, loan interests, etc.) will have higher reservation wages and are less likely to send their members outside to work. Angrist and Pischke, and Hung [79,80] argue that control variables for economic sector, firm type, job level and occupational category do not provide well-behaved characteristics in a typical OLS regression model as each of the variables are themselves potentially affected by education and are not merely capturing unobserved correlates of education and earnings. This causes a non-randomly selected sample and, consequently, a downward bias in the OLS estimates. In addition to the basic Mincer approach, this motivates us to utilize the two-stage Heckman correction method to address the issue.
The International Labor Organization (ILO, Geneva, Switzerland) has a detailed definition of different employment statuses (resolution on the statistics of the economically active population, employment, unemployment, and underemployment, adopted by the Thirteenth International Conference of Labour Statisticians: http://www.ilo.org/wcmsp5/groups/public/---dgreports/---stat/documents/normativeinstrument/wcms_087481.pdf), including unemployment. Here, we adopt a relaxed understanding of the unemployed as those who answered (1) “Cannot find job”, (2) “No need to work”, (3) “Family reasons”, or (4) “Health reasons” to the question “Reason for not working in the past 30 days”.
The basic Mincer equation is run first, and it is then run again using the personal characteristics and other control variables. Finally, a regression using the Heckman correction model is reported alongside the Mincer OLS results. All models are tested using estat vif to check for variance inflation factors (VIFs) of the independent variables, and all pass the test. A survey (sampling/probability) weight variable is included in all regressions, indicating how representative the observations are of the number of people in Hanoi and HCMC (selection probabilities).
In the next section, we present our descriptive and regression results.

4. Empirical Findings

4.1. Descriptive Findings

Table 1 provides an overview of Hanoi and HCMC in terms of their demographic and employment characteristics.
The two cities have almost the same average age (37) and share of women in the labor force (45.37% vs. 46.7%), which are slightly lower than the country average (for the labor force at 15 years of age and above). However, workers in Hanoi are much less likely to live in an urban area (51.5% vs. 83.1%), even though this number is still significantly higher than the national average (32.1%; [16] (all data cited are taken from or calculated based on numbers published on the General Statistics Office of Vietnam’s website: http://www.gso.gov.vn/Default_en.aspx?tabid=766)). This may partly explain why a notably higher number of people in Hanoi are married, in addition to the fact that the capital is more traditional and slow-paced than HCMC, because people tend to settle down earlier. Differences in the demographics are also evident in the percentage of ethnic minorities and people born in a different province (the term “migrant” is used rather loosely because some people were born in another area but spent most of their lives in their respective city and/or hold Hanoi/HCMC’s “hokou”). This finding reflects the fact that HCMC has a relatively more diverse labor market than that of the capital, with more laborers who belong to ethnic minorities and/or are migrants. In addition, from the data, we find that Hanoi only attracts workers from 31 other provinces, mostly from the Northern and Central regions. However, HCMC attracts people from most of the country (52/58 provinces) for work.
As expected, Hanoi has more educated people who participate in the workforce, particularly those with higher education (41.48% vs. 31.5%) and vocational education (18.6% vs. 13.36%) (note that some people might have both). After converting to years of schooling, Hanoi also has a higher average (12.5 vs. 10.65).
Again, it is not surprising that the capital has a considerably larger labor force working in the public sector (28.32% vs. 18.18%). However, the sector that recruits the most workers in both Hanoi and HCMC is the private sector (34.69% and 49.27%, respectively). We can also argue that the overwhelming number of private firms in HCMC partly reflects the fact that the city has a more encouraging and nurturing business environment for entrepreneurs who wish to open and pursue their own enterprises.
Lastly, Vietnam’s labor market is characterized by a very low level of unemployment (1.87% in the third quarter of 2017; [15]). Since Vietnam is a developing country, the majority of the population cannot afford not to work, and will accept any kind of job, even those with low incomes and unstable and poor working conditions. In addition, remarkably, people who graduated from college or above are a dominant share (75.1%) of unemployed young labor (15–24 years of age) [16]. However, the situations are a bit different in Hanoi and HCMC. First, the unemployment rates are higher, around 2% according to the data. The two cities also appear to be more effective in absorbing higher-educated individuals when most of their young laborers without a job are upper-higher secondary graduates (college graduates also account for a considerable number of the unemployed youth but are still much fewer than the country average).

4.1.1. Education

According to the General Statistics Office [16], only 11.7% of the Vietnamese workforce obtained a college, graduate, or higher degree, and 8.9% received short- to long-term vocational training. However, in Hanoi, one-third of the workforce have a university degree, and only 1.49% have no qualification at all.
Table 2 shows educational level attainment in Hanoi and HCMC, in total and by gender. In line with previous discussions, Hanoi has a generally more educated workforce than HCMC, in which over 20% of the labor force has no qualification or has only a primary education. Interestingly, the gap between men and women who have a tertiary education is very small in both cities, with slightly more female workers than male workers falling within this category. Substantially more men, especially in HCMC, obtain vocational training, perhaps reflecting the fact that the courses/programs offered at vocational school are not as accessible to women.
Furthermore, Figure 1 and Figure 2 display the distribution of education by types of firm ownership in Hanoi and HCMC, respectively. Both show a relatively similar pattern. The public sector absorbs the most educated labor, whereas people with no or a general education are more likely to accept a job in either a household business or a private firm. However, it seems that in HCMC, people with a lower level of education have a greater chance of finding work across all firm types, because their distribution across different types of ownership is less extreme.
Then, despite Hanoi having an overall higher number of qualified workers, HCMC has the most competitive labor market. According to a report from Vietnamworks (the biggest recruiting firm in Vietnam), job competition in HCMC is 48:1 (for all job sectors), whereas in Hanoi, it is 39:1 [81]. This difference is not necessarily due to the size of the population, because many provinces with far fewer residents (e.g., Binh Duong or Da Nang) have the same, or even higher “competitiveness” rates.

4.1.2. Earnings

Finally, we consider the incomes of the workforces in Hanoi and HCMC in greater detail.
The two cities have comparable monthly average incomes of VND 7,025,960 in Hanoi and VND 7,211,55 in HCMC (see Table 2). Furthermore, Figure 3 and Figure 4 show that income increases with the educational level. This relationship also appears to be concave, because the wage gaps tend to be larger at the higher end of the educational distribution, particularly at the university level. A notable case is that of PhD holders in HCMC, who earn less than those with a master’s or even a university degree. However, the number of observations is too low to draw a meaningful conclusion. Male workers earn more than female workers do, regardless of the education attainment level. The average salary in HCMC is higher than that in Hanoi for all educational levels.
In terms of firm type, Figure 5 and Figure 6 display the income distribution across different ownerships in the two cities. The figures show that even though the public sector absorbs most of the highest-educated labor force, it cannot pay these workers as well as the private and FDI sectors do. Foreign companies reward their better educated employees particularly well.
Figure 7 shows the average monthly income in both cities by job sector. In general, jobs in information and communication, finance, banking, and international organizations/agencies (e.g., nonprofit organizations) are the best paid. In addition, although 41.9% of the Vietnamese workforce is still currently engaged in various agricultural activities, the sector is essentially not represented in Hanoi and HCMC. The sectors that employ the most workers are the manufacturing, construction, and motorcycle-related sectors.
Lastly, some interesting findings cannot be discussed in detail. For example, migrant workers tend to be better educated, are more likely to work in a foreign firm, and are paid more than local laborers, on average. This difference is because both Hanoi and HCMC are big cities with especially competitive working environments. Therefore, it is possible that only the “best” migrant workers can survive in these cities. Even then, they might still need to work harder than locals do to compete for jobs owing to migrant discrimination, their lack of connections, or their city household registration.

4.2. Returns on Education in Vietnam: Hanoi and HCMC

4.2.1. General Situation in Hanoi and HCMC

Table A2 (see Appendix C) shows the regression results for the whole data set using city and educational-level dummy variables. The regressions are run at three levels: (1) The basic Mincer model; (2) the model including personal characteristics variables; and (3) the model with all control variables. The R-squared values are higher in models (2) and (3), suggesting that these variables explain the earnings variation. The Heckman selection model includes both employed and unemployed people in the sample to adjust the endogenous choice of employment. Once we correct the selection bias at the first stage, we estimate the relationship between labor-related characteristics and the return on education for employed people at the second stage. This inherently leads to a larger sample for the Heckman model. In general, HCMC offers a higher monthly salary (4.45%) than the capital does. Most independent variables show relatively similar patterns to those of previous studies based on a national-level data set. However, the most notable finding is that general education (primary, secondary, and high schools) might not provide a wage premium (the coefficients are nonsignificant) to employees in these two cities. This finding contrasts with results from previous studies using nationwide data, which show that all educational levels offer such incentives. Specifically, an additional year spent in elementary vocational school offers a 2.47% wage premium. The same values are 1.85% for higher vocational/professional school, 2.29% for three-year college, 3.78% for university, 4.47 for an MA/MSc, and 5.56% for a PhD. Accordingly, after general education, higher credentials (except for three-year college) mean a greater payoff in the labor force. In terms of the year of measurement, the rate of return on education is 18% for every year of schooling (regression results are not reported here). This return is higher than the global average of 10% for private returns, including the costs incurred for attending school [23]. Though unreported for brevity, to compare the regression coefficients between Hanoi and HCMC we conduct a seemingly unrelated regression (SUR) analysis. Using a SUR estimation also allows us to statistically compare the coefficients in the equation system. The results show that the positive relationship between age and the return on education is more pronounced in HCMC, whereas the positive relationship between years of schooling and the return on education is more pronounced in Hanoi. In particular, the F-statistics comparing the coefficients on Age and yearofschooling in each equation show that they are statistically different, corroborating our findings in the individual regressions. In addition, we find that our results are robust when alternatively using years of working experience instead of years of schooling.

4.2.2. Wage Premium for Education and Experience

The focus of this study is presented in the regressions in Table A3 and Table A4 (see Appendix C), where the year of schooling and age variables interact with the city dummy. We perform these regressions to determine whether one city offers a higher wage premium for an additional year of schooling and experience than the other city does.
From regression (3) in Table A3, we can see that Hanoi offers a wage premium of 1.95% for an additional school year compared with HCMC, even when controlling for variables related to individual characteristics and employment information. To check whether this is due to the PhD holders in Hanoi skewing the results, we run a separate regression (3 *) for people with a university degree and below. Using this subgroup, Hanoi still offers a wage premium of 1.75% over HCMC.
One of the reasons for this premium return on schooling in Hanoi is the higher number of SOEs. Vietnamese state-owned firms do not have the soft or hard infrastructure to hire people based on multiple criteria. Instead, they rely heavily on credentials not just when recruiting but also when standardizing and categorizing their officers. As a check, we run a regression and find that, based on this data set, SOEs offer over 4% for an additional year of schooling. For the other firm types (private, individual business household, and FDI), this value is less than 1%. Still, because the regressions already include a dummy variable for firm type, the 1.95% premium might be explained by other reasons. For example, it may arise because the capital is still somewhat more conservative and places greater significance on education, as discussed in the Introduction. Another problem with SOEs is that they pay less than the other types of ownership do, including individual household businesses (see Table A2), implying that the formulated wage scale in the public sector is overestimating the actual value of education. With almost one-third of its firms in the public sector, Hanoi faces a bigger challenge in reforming ownership and management incentives to improve the overall efficiency and productivity of its businesses.
Table A3 goes through the same process but uses an interaction between the age (proxy for experience) and city dummies. Again, the results confirm our prediction that HCMC is more rewarding of experience, although the number is quite small (0.66%). Note that with the Vietnamese currency, salaries almost always run into the millions. Hence, although these differences seem small in magnitude, they do hold a certain level of significance. Our empirical findings are robust to multicollinearity issues because our results do not change when various control variables are removed. As argued earlier, HCMC is more dynamic and diverse in terms of its business environment, labor structure, and industry structure. Therefore, it is understandable that it places less emphasis on education, and more on aspects such as experience than Hanoi does.

4.2.3. Heckman Correction Bias Model

Finally, regression (4) in Table A2, Table A3 and Table A4 are run using the Heckman correction model to address the sample selection bias issue, using four explanatory variables in the selection equation: the number of people in the household, a dummy indicating whether the person is the household head, a dummy indicating whether the person is married, and non-wage household income (based on the first-step estimation result in the Heckman correction model, we find that the inverse Mills’ ratio is 231.983, which is statistically significant at the 1% level. This corroborates the validity of the selection model in Table 3). Selection bias may occur in our empirical setting because the likelihood of employment is associated with inclusion in our sample. To deal with this selection bias, we employ a Heckman selection model including both employed and unemployed people in the sample to adjust the endogenous choice of employment. Once we correct for this selection bias in the first stage, we estimate the relationship between labor-related characteristics and the return on education for employed people in the second stage. In addition, we find that marital status does not have a significant impact in the regression models. For the non-wage income issue, non-wage income does not include governmental aid in Vietnam. Furthermore, non-wage income is not small enough to spare household members from working. Therefore, we believe that the potential reverse causality issue due to the non-wage income portion is not material.
In general, the Heckman model shows that the Mincerian Equation (even with all control variables) constantly overestimates the return on education in the two cities. However, the size of the bias is not large. Figure 8 shows the differences in the returns on education for each educational level with and without a correction for selection bias. Table 3 provides the coefficients and their respective standard errors. Though unreported, to take the heterogenous abilities of individuals into account, we also consider a fixed-effect panel regression model, controlling for individuals’ attributes that may affect the return on education. The results reveal that the baseline relationships between the key explanatory variables and the return on education are still pronounced, even after controlling for individuals’ heterogenous abilities. In addition, we conduct two sets of endogeneity tests for the schooling proxy variable in the regression analyses. In particular, we employ the Cragg–Donald Wald F test and the Hansen J-statistic from the over-identification test. The Cragg–Donald Wald F statistic is 48.69 for the regression in Table 3, and is significant at a level better than one percent, suggesting that the unobservable schooling variable is strongly correlated with the instrumented regressor. In addition, the Hansen over-identification test fails to reject the null that our instruments are exogenous because the statistic is 1.82, with a p-value of 0.17. Hence, we believe that the schooling proxy variable we adopt in this study is immune to the endogeneity issue.
In terms of the wage premium difference between the two cities for an additional year of school and experience, Hanoi still pays 1.5% (OLS: 1.95%) more for education, and HCMC still pays 0.632% more for experience (OLS: 0.656%). These biases are less than 10% in most cases, which is consistent with the results of previous studies [71,80].

5. Conclusions

The main conclusions from this empirical analysis are that the labor markets in Hanoi and HCMC are quite different to those described in previous studies that use country-level data; in addition, differences exist between these two cities as well.
As the two biggest economic hubs in Northern and Southern Vietnam, Hanoi and HCMC have a more sophisticated and competitive labor force than that of the rest of the country. General education no longer pays a premium; instead, workers need to have at least a vocational degree to significantly increase their wages. This is contradicted by the current problems experienced by vocational schools that are struggling to draw sufficient students (owing to problems related to quality, and the common perception that such schools are only for children who cannot pursue a “proper” education), some of which have been forced to close down. Thus, additional career orientation activities need to be implemented at the secondary education level. This will encourage students to at least earn a vocational education before entering the labor market, because the demand for such skills is significant in these two cities.
With regard to the differences between the cities themselves, our statistical results show that, in general, HCMC offers higher salaries. Furthermore, the capital pays more for education, whereas the younger city is more rewarding toward experiences (although the gap is not large). We obtain these results after controlling for multiple variables, including employment ownership type, which is one of the factors that can explain these differences. Recall that Hanoi has traditionally emphasized education and status, which in this case, might have overestimated the market value of education. If this is true, there is no doubt that it has contributed to the existing social phenomena (and corruption issues) of people “buying” credentials and exchanging bribes for awards, titles to get jobs, and higher salaries. Furthermore, it hinders Hanoi from hiring the “best” people, especially in areas when hands-on experience is more important than a degree, such as the creative sectors. As the number of (large) state-owned and equitisatized (Vietnamese English term: An SOE that has been converted to a public limited company or to a corporation) firms has increased, the reality is that degrees are being used more than ever as tools for promotion. This is happening everywhere in the country, including HCMC, although our statistical results indicate that Hanoi has the bigger problem of the two.
Hanoi may be able to look to HCMC to find solutions to their problems. HCMC has become an economic leader of the country by successfully building and developing an environment that fosters entrepreneurs and business-minded people. These start-ups and private firms make the city a diverse, flexible, open place for skilled (but not necessarily the best educated) workers to prosper. As of 2016, HCMC accounts for one-third (200,000 of 600,000) of the operating firms in the country. There is also a noticeable trend of well-educated, capable, and enterprising workers moving from Hanoi to HCMC, because the later can offer better job opportunities and a better business and working environment. With a population of 90 million people, Vietnam in general, and Hanoi in particular, has much room to expand. The capital possesses the infrastructure, educated workforce, and political advantages, but needs a more open, tolerant, and pro-business mindset.
Hanoi can use of its large pool of highly educated workers to develop more knowledge-intensive activities. HCMC can achieve further growth (perhaps at the robust growth rate of leading cities in China) by improving the quality of general and nonformal education to meet labor’s diverse learning needs. The younger city has received increasing pressure to invest more in infrastructure and education. On the other hand, these two cities are compatible and should explore synergistic opportunities. How well Hanoi and HCMC learn to cooperate will contribute significantly to the development of the cities and the country.
In conclusion, this study revisited the linkage between educational attainment and labor market outcomes in Vietnam, although on a specific geographical scale, and takes a relatively different direction. This study provides a starting point to showcase the need to study returns on education in a smaller setting, whether at the city/province or regional levels. Since Vietnam is a developing economy with a high level of economic, developmental, and educational heterogeneity, studies targeting certain geographical locations can offer specific implications and solutions for policymakers.
Unfortunately, we were not able to address the ability-bias issue, as discussed earlier. Furthermore, in terms of ability measurement, we could not incorporate cognitive skills (critical thinking, problem-solving) or behavioral skills (teamwork, communication) into the analysis. These skills are lacking in the labor force but have been becoming increasingly important to employers in Vietnam. For example, the World Bank conducted research in 2014 titled, “Skilling up Vietnam” to address this issue. However, such complex variables are not included in the VHLSS data set.
In addition, the Heckman correction model can use more appropriate instruments, such as the number of children (especially under age six). Furthermore, we would like to test the chosen IVs for invalid/weak instruments and discuss the issue of education quality in Vietnam.

Author Contributions

C.Y.C. designed the research. H.T. performed the research and analyzed the data. C.Y.C. and H.T. wrote the paper. All authors read and approved the final manuscript.

Funding

This work was supported by the research program of Kookmin University in Korea.

Acknowledgments

We would like to thank the editor and the three reviewers for their helpful comments and suggestions.

Conflicts of Interest

The authors declare no conflict of interest.

Appendix A. Vietnam’s Education System

Figure A1. Education System in Vietnam. Adapted from: https://wenr.wes.org/2017/11/education-in-vietnam.
Sustainability 11 04903 g0a1

Appendix B. Dummy Variables

Table A1. Variable Descripition.
VariableDescription
EducationLevelEquivalent years of schooling
1 = No qualification (Reference group)0
2 = Primary education5
3 = Lower secondary4
4 = Upper secondary3
5 = Elementary vocational0.5
6 = Middle vocational/Professional school1–2
7 = Three-year college3
8 = University4
9 = MA/MSc2
10 = PhD3
Gender1 = Female (Reference category)
2 = Male
Marital status1 = Married (Reference category)
2 = Not married
Ethnicity1 = Kinh (Reference category)
2 = Minor ethnicity
Area1 = Rural (Reference category)
2 = Urban
Firm type1 = Public (Reference category)
2 = Private
3 = Individual household business
4 = Foreign direct investment (FDI)
Job sector1 = Industry and trade (Reference category)
2 = Construction
3 = Service
Job level/occupation1 = Low-skilled workers (Reference category)
2 = Manual labor
3 = Assembly workers
4 = Skilled sales and service staff
5 = Office staff
6 = Middle-level experts
7 = High-level experts
8 = Leaders/managers

Appendix C. Dummy Variables

Table A2. Returns on education in Hanoi and HCM.
VARIABLES(1)(2)(3)(4)
Basic MincerWith Personal CharacteristicsAll Control VariablesHeckman Selection Model
Age0.0802 ***0.0796 ***0.0788 ***0.0724 ***
(0.00390)(0.00380)(0.00367)(0.00348)
Age2−0.00101 ***−0.00102 ***−0.000994 ***−0.000907 ***
(4.89e-05)(4.75e-05)(4.60e-05)(4.33e-05)
Hanoi−0.113 ***−0.0751 ***−0.0445 ***−0.0462 ***
(0.0145)(0.0154)(0.0150)(0.0143)
Primary0.02370.02570.00878−0.00204
(0.0424)(0.0414)(0.0402)(0.0383)
Lower secondary0.05060.04470.004540.000746
(0.0416)(0.0406)(0.0398)(0.0375)
Upper secondary0.165 ***0.154 ***0.09320.0665
(0.0417)(0.0409)(0.0406)(0.0384)
Elementary vocational0.322 ***0.263 ***0.195 ***0.175 ***
(0.0472)(0.0464)(0.0462)(0.0438)
Higher vocational/Professional school0.259 ***0.242 ***0.159 ***0.129 ***
(0.0447)(0.0439)(0.0452)(0.0428)
Three-year college0.364 ***0.352 ***0.204 ***0.154 ***
(0.0483)(0.0474)(0.0500)(0.0476)
University0.605 ***0.576 ***0.352 ***0.293 ***
(0.0403)(0.0403)(0.0470)(0.0446)
MA/MSc0.840 ***0.788 ***0.581 ***0.492 ***
(0.0569)(0.0566)(0.0610)(0.0594)
PhD1.167 ***1.062 ***0.877 ***0.722 ***
(0.104)(0.102)(0.101)(0.103)
Male 0.217 ***0.214 ***0.210 ***
(0.0138)(0.0134)(0.0129)
Minor ethnicity 0.03360.02720.0410
(0.0333)(0.0322)(0.0301)
Migrant 0.0868 ***0.0633 ***0.0565***
(0.0165)(0.0157)(0.0155)
Urban 0.0635 ***0.0638 ***0.0434 ***
(0.0169)(0.0165)(0.0158)
Private 0.231 ***0.205 ***
(0.0186)(0.0177)
Individual household 0.112 ***0.108 ***
(0.0240)(0.0224)
FDI 0.354 ***0.336 ***
(0.0273)(0.0265)
Manual labor 0.120 ***0.112 ***
(0.0272)(0.0251)
Assembly workers 0.142 ***0.148 ***
(0.0292)(0.0276)
Skilled sales and service staff 0.0837 ***0.0747 ***
(0.0294)(0.0274)
Office staff 0.06080.135 ***
(0.0376)(0.0349)
Middle-level expert 0.256 ***0.242 ***
(0.0366)(0.0345)
High-level expert 0.337 ***0.343 ***
(0.0371)(0.0351)
Leader/manager 0.687 ***0.629 ***
(0.0523)(0.0500)
Construction 0.0559 ***0.0533 **
(0.0215)(0.0208)
Service 0.02670.0155
(0.0178)(0.0169)
Household size −0.0833 ***
(0.0116)
Head household dummy −0.149 ***
(0.0402)
Marriage −0.0261
(0.0388)
Non-wage income 2.18e-06 ***
(1.32e-07)
Intercept6.906 ***6.759 ***6.479 ***0.868 ***
(0.0828)(0.0812)(0.0839)(0.0564)
Observations4706470646065551
R-squared0.2800.3210.3930.373
Standard errors are in parentheses. *** p < 0.01, ** p < 0.05.
Table A3. Returns on education in Hanoi and HCM: Wage premium for years of schooling.
VARIABLES(1)(2)(3)(3) *(4)
Basic MincerWith Personal CharacteristicsAll Control VariablesAll Control Variables (Uni and Below)Heckman Selection Model
Age0.0377 ***0.0340 ***0.0367 ***0.0367 ***0.0335 ***
(0.00201)(0.00192)(0.00184)(0.00185)(0.00173)
Age2−0.000808 ***−0.000758 ***−0.000792 ***−0.000792 ***−0.000710 ***
(4.21e-05)(4.03e-05)(3.87e-05)(3.87e-05)(3.57e-05)
Hanoi−0.475 ***−0.339 ***−0.269 ***−0.241 ***−0.212 ***
(0.0457)(0.0448)(0.0433)(0.0446)(0.0389)
yearofschooling0.0463 ***0.0375 ***0.0137 ***0.0120 ***0.0106 ***
(0.00235)(0.00229)(0.00263)(0.00264)(0.00254)
Hanoi#c.yearofschooling0.0276 ***0.0226 ***0.0195 ***0.0175 ***0.0150 ***
(0.00368)(0.00341)(0.00327)(0.00343)(0.00298)
Male 0.202 ***0.213 ***0.213 ***0.209 ***
(0.0143)(0.0135)(0.0136)(0.0130)
Minor ethnicity 0.0679 **0.0536 *0.0585 *0.0603 **
(0.0339)(0.0321)(0.0320)(0.0301)
Migrant 0.0942 ***0.0618 ***0.0621 ***0.0571 ***
(0.0170)(0.0159)(0.0161)(0.0157)
Urban 0.0908 ***0.0692***0.0676 ***0.0495 ***
(0.0177)(0.0169)(0.0168)(0.0161)
Private 0.244 ***0.255 ***0.218 ***
(0.0189)(0.0192)(0.0180)
Individual household 0.143 ***0.146 ***0.130 ***
(0.0244)(0.0245)(0.0228)
FDI 0.371 ***0.386 ***0.347 ***
(0.0277)(0.0281)(0.0269)
Manual labor 0.109 ***0.114 ***0.104 ***
(0.0274)(0.0272)(0.0253)
Assembly workers 0.124 ***0.129 ***0.140 ***
(0.0288)(0.0286)(0.0273)
Skilled sales and service staff 0.0617 **0.0647 **0.0565 **
(0.0295)(0.0293)(0.0277)
Office staff 0.0898 **0.0807 **0.172 ***
(0.0376)(0.0377)(0.0351)
Middle-level expert 0.301 ***0.319 ***0.281 ***
(0.0349)(0.0348)(0.0332)
High-level expert 0.513 ***0.516 ***0.499 ***
(0.0323)(0.0322)(0.0307)
Leader/manager 0.763 ***0.745 ***0.692 ***
(0.0507)(0.0531)(0.0487)
Construction 0.0455 **0.0548 **0.0418 **
(0.0217)(0.0217)(0.0210)
Service 0.01170.00606−0.00216
(0.0179)(0.0181)(0.0170)
Household size −0.0833 ***−0.0768 ***
(0.0116)(0.0115)
Head household dummy −0.149 ***−0.175 ***
(0.0402)(0.0396)
Marriage -0.02610.0598264
(0.0388)(0.0385)
Non-wage income 2.18e-06 ***2.21e-06 ***
(1.32e-07)(1.31e-07)
Intercept7.868 ***7.736 ***7.569 ***7.572 ***0.842 ***
(0.0348)(0.0353)(0.0449)(0.0451)(0.0534)
Observations47434743464044825585
R-squared0.2260.2670.3750.3610.384
Standard errors are in parentheses. *** p < 0.01, ** p < 0.05, * p < 0.1.
Table A4. Returns on education in Hanoi and HCM: Wage premium for experience.
VARIABLES(1)(2)(3)(4)
Basic MincerWith Personal CharacteristicsAll Control VariablesHeckman Selection Model
Age0.0405 ***0.0379 ***0.0397 ***0.0364 ***
(0.00207)(0.00202)(0.00193)(0.00185)
Age2−0.000779 ***−0.000759 ***−0.000789 ***0.0364 ***
(4.13e-05)(4.02e-05)(3.87e-05)(0.00185)
Hanoi#c.age−0.00746 ***−0.00774 ***−0.00656 ***−0.00632 ***
(0.00116)(0.00113)(0.00106)(0.000984)
Year of schooling0.0530 ***0.0467 ***0.0208 ***0.0172 ***
(0.00188)(0.00201)(0.00250)(0.00235)
Hanoi−0.0192−0.0806−0.0937−0.0859
(0.0264)(0.0263)(0.0246)(0.0235)
Male 0.204 ***0.215 ***0.210 ***
(0.0143)(0.0135)(0.0129)
Minor ethnicity 0.0622 *0.04920.0551 *
(0.0339)(0.0321)(0.0301)
Migrant 0.105 ***0.0716 ***0.0619 ***
(0.0170)(0.0158)(0.0157)
Urban 0.104 ***0.0796 ***0.0585 ***
(0.0174)(0.0167)(0.0159)
Private 0.234 ***0.209 ***
(0.0188)(0.0179)
Individual household 0.129 ***0.121 ***
(0.0243)(0.0226)
FDI 0.363 ***0.339 ***
(0.0277)(0.0268)
Manual labor 0.102 ***0.0992 ***
(0.0273)(0.0253)
Assembly workers 0.129 ***0.144 ***
(0.0288)(0.0272)
Skilled sales and service staff 0.0599 **0.0557 **
(0.0295)(0.0276)
Office staff 0.0893 **0.170 ***
(0.0376)(0.0351)
Middle-level expert 0.298 ***0.279 ***
(0.0349)(0.0332)
High-level expert 0.513***0.497 ***
(0.0323)(0.0306)
Leader/manager 0.781 ***0.699 ***
(0.0506)(0.0488)
Construction 0.0477 **0.0443 **
(0.0217)(0.0209)
Service 0.0103−0.00349
(0.0179)(0.0170)
Household size −0.0813 ***
(0.0116)
Head household dummy −0.168 ***
(0.0402)
Marriage −0.0531
(0.0385)
Non-wage income 0.001 ***
(0.001)
Intercept7.672 ***7.548 ***7.429 ***0.869 ***
(0.0353)(0.0353)(0.0464)(0.0565)
Observations4743474346405585
R-squared0.2230.2670.3750.381
Standard errors are in parentheses. *** p < 0.01, ** p < 0.05, * p < 0.1.

References

  1. McKinsey Global Institute. Sustaining Vietnam’s Growth: The Productivity Challenge; McKinsey Global Institute: Washington, DC, USA, 2012. [Google Scholar]
  2. Becker, G.S. Investment in Human Capital: A Theoretical Analysis. J. Political Econ. 1962, 70, 9–49. [Google Scholar] [CrossRef]
  3. Backman, M.; Bjerke, L. Returns to Higher Education—A Regional Perspective; Working Paper Series in Economics and Institutions of Innovation 171; Royal Institute of Technology, CESIS—Centre of Excellence for Science and Innovation Studies: Stockholm, Sweden, 2009. [Google Scholar]
  4. Hering, L.; Poncet, S. Market Access and Individual Wages: Evidence from China. Rev. Econ. Stat. 2010, 92, 145–159. [Google Scholar] [CrossRef]
  5. Fally, T.; Paillacar, R.; Terra, C. Economic geography and wages in Brazil: Evidence from micro-data. J. Dev. Econ. 2010, 91, 155–168. [Google Scholar] [CrossRef] [Green Version]
  6. Cieślik, A.; Rokicki, B. Individual wages and regional market potential. Econ. Transit. 2016, 24, 661–682. [Google Scholar] [CrossRef]
  7. Roback, J. Wages, Rents, and the Quality of Life. J. Political Econ. 1982, 90, 1257–1278. [Google Scholar] [CrossRef]
  8. Roback, J. Wages, rents, and amenities: Differences among workers and regions. Econ. Inq. 1988, 26, 23–41. [Google Scholar] [CrossRef]
  9. Hanushek, E.A.; Kim, D. Schooling, Labor Force Quality, and Economic Growth; Working Paper No. 5399; National Bureau of Economic Research: Cambridge, MA, USA, 1995; Available online: http://www.nber.org/papers/w5399 (accessed on 15 March 2018).
  10. Florida, R.L. The Rise of the Creative Class, Revisited; Basic Books: New York, NY, USA, 2012. [Google Scholar]
  11. The Nielsen Company. HCMC v Hanoi: Understanding Consumer Differences. Available online: http://www.nielsen.com/content/dam/corporate/t3/vietnam/reports/Nielsen%20Vietnam_%20HCMC%20v%20Hanoi%20consumer%20differences_June%202009_slide7edit.pdf (accessed on 20 April 2018).
  12. Nguyen, K.Q.; Nguyen, C.C. Education in Vietnam: Development History, Challenges and Solutions. An African Exploration of the East Asian Education Experience. Available online: http://documents.worldbank.org/curated/en/565731468314994155/An-African-exploration-of-the-East-Asian-education-experience (accessed on 12 May 2018).
  13. Dapice, D.O. Vietnam’s Economy: Success Story or Weird Dualism? A SWOT Analysis; Harvard University: Boston, MA, USA, 2003. [Google Scholar]
  14. Zhou, G.; Luo, S. Higher Education Input, Technological Innovation, and Economic Growth in China. Sustainability 2018, 10, 2615. [Google Scholar] [CrossRef]
  15. Lucas, R.E., Jr. On the mechanics of economic development. J. Monet. Econ. 1988, 22, 3–42. [Google Scholar] [CrossRef]
  16. General Statistics Office, Ministry of Planning and Investment. Report on Labour Force Survey: Quarter 3. 2017. Available online: http://www.gso.gov.vn/default_en.aspx?tabid=515&idmid=5&ItemID=18724 (accessed on 17 June 2018).
  17. Cooper, G. A Tale of Two Cities in Vietnam. Available online: https://www.duanemorris.com/articles/static/cooper_two_cities_law360_1016.pdf (accessed on 28 September 2016).
  18. Quek, C. Vietnam through the Eyes of Local Startups. Available online: https://www.techinasia.com/talk/vietnam-eyes-local-startups (accessed on 12 May 2018).
  19. Card, D. The Causal Effect of Education on Earnings. Handb. Labor Econ. 1999, 3, 1801–1863. [Google Scholar] [Green Version]
  20. Psacharopoulos, G. Returns to Education: A Further International Update and Implications. J. Hum. Resour. 1985, 20, 583–604. [Google Scholar] [CrossRef]
  21. Psacharopoulos, G. Returns to investment in education: A global update. World Dev. 1994, 22, 1325–1343. [Google Scholar] [CrossRef]
  22. Psacharopoulos, G.; Patrinos, H.A. Returns to Investment in Education: A Further Update (English); Policy, Research Working Paper Series No. WPS 2881; World Bank: Washington, DC, USA, 2002; Available online: http://documents.worldbank.org/curated/en/512891468739485757/Returns-to-investment-in-education-a-further-update (accessed on 12 March 2018).
  23. Montenegro, C.E.; Patrinos, H.A. Comparable Estimates of Returns to Schooling around the World (English); Policy Research working Paper No. WPS 7020; World Bank Group: Washington, DC, USA, 2014; Available online: http://documents.worldbank.org/curated/en/830831468147839247/Comparable-estimates-of-returns-to-schooling-around-the-world (accessed on 1 May 2018).
  24. Peet, E.D.; Fink, G.; Fawzi, W. Returns to education in developing countries: Evidence from the living standards and measurement study surveys. Econ. Educ. Rev. 2015, 49, 69–90. [Google Scholar] [CrossRef]
  25. Patrinos, H.A. Estimating the return to schooling using the Mincer equation. IZA World Labor 2016, 278. [Google Scholar] [CrossRef]
  26. Mincer, J. Schooling, Experience, and Earnings; National Bureau of Economic Research: New York, NY, USA, 1974. [Google Scholar]
  27. Friedman, M. Capitalism and Freedom; University of Chicago Press: Chicago, IL, USA, 1962; ISBN 0-226-26421-1. [Google Scholar]
  28. Hungerford, T.; Solon, G. Sheepskin Effects in the Returns to Education. Rev. Econ. Stat. 1987, 69, 175–177. [Google Scholar] [CrossRef]
  29. Belman, D.; Heywood, J. Sheepskin effects in the returns to education: An examination on women and minorities. Rev. Econ. Stat. 1991, 73, 720–724. [Google Scholar] [CrossRef]
  30. Harmon, C.; Oosterbeek, H.; Walker, I. The Returns to Education: A Review of Evidence, Issues and Deficiencies in the Literature; Centre for the Economics of Education, London School of Economics and Political Science: London, UK, 2000. [Google Scholar]
  31. Murphy, K.; Welch, F. Empirical age-earnings profiles. J. Labor Econ. 1990, 8, 202–229. [Google Scholar] [CrossRef]
  32. Card, D. Estimating the Return to Schooling: Progress on Some Persistent Econometric Problems. Econometrica 2001, 69, 1127–1160. [Google Scholar] [CrossRef] [Green Version]
  33. Griliches, Z. Estimating the Returns to Schooling: Some Econometric Problems. Econometrica 1977, 45, 1–22. [Google Scholar] [CrossRef]
  34. Lang, K. Ability Bias, Discount Rate Bias and the Return to Education; MPRA Paper 24651; University Library of Munich: Munich, Germany, 1993. [Google Scholar]
  35. Altonji, J.G.; Dunn, T.A. Using Siblings to Estimate the Effect of School Quality on Wages. Rev. Econ. Stat. 1996, 78, 665–671. [Google Scholar] [CrossRef]
  36. Belzil, C.; Hansen, J. Unobserved Ability and the Return to Schooling. Econometrica 2002, 70, 2075–2091. [Google Scholar] [CrossRef] [Green Version]
  37. Gensowski, M. Personality, IQ, and lifetime earnings. Labour Econ. 2018, 51, 170–183. [Google Scholar] [CrossRef] [Green Version]
  38. Ashenfelter, O.; Zimmerman, D.J. Estimates of the Returns to Schooling from Sibling Data: Fathers, Sons, and Brothers. Rev. Econ. Stat. 1997, 79, 1–9. [Google Scholar] [CrossRef]
  39. Ashenfelter, O.; Rouse, C. Income, Schooling, and Ability: Evidence from a New Sample of Identical Twins. Q. J. Econ. 1998, 113, 253–284. [Google Scholar] [CrossRef] [Green Version]
  40. Bronars, S.G.; Oettinger, G.S. Estimates of the return to schooling and ability: Evidence from sibling data. Labour Econ. 2006, 13, 19–34. [Google Scholar] [CrossRef]
  41. Arias, O.; Hallock, K.F.; Sosa-Escudero, W. Individual heterogeneity in the returns to schooling: Instrumental variables quantile regression using twins’ data. Empir. Econ. 2001, 26, 7–40. [Google Scholar] [CrossRef]
  42. Hausman, J.A.; Taylor, W.E. Panel Data and Unobservable Individual Effects. Econometrica 1981, 49, 1377–1398. [Google Scholar] [CrossRef]
  43. Chatelain, J.; Ralf, K. Inference on Time-Invariant Variables Using Panel Data: A Pre-Test Estimator with an Application to the Returns to Schooling; PSE Working Papers Hal-00492039; HAL: New York, 2010. [Google Scholar]
  44. Kane, T.J.; Rouse, C.E. Labor Market Returns to Two- and Four-year Colleges: Is a Credit a Credit and Do Degrees Matter; Working Paper No. 4268; NBER: Cambridge, MA, USA, 1993. [Google Scholar]
  45. Card, D. Using Geographic Variation in College Proximity to Estimate the Return to Schooling; Working Paper No. 4483; NBER: Cambridge, MA, USA, 1993. [Google Scholar]
  46. Conneely, K.; Uusitalo, R. Estimating Heterogeneous Treatment Effects in the Becker Schooling Model; Unpublished Discussion Paper; Princeton University Industrial Relations Section: Princeton, NJ, USA, 1997. [Google Scholar]
  47. Dickson, M.; Smith, S. What determines the return to education: An extra year or a hurdle cleared? Econ. Educ. Rev. 2011, 30, 1167–1176. [Google Scholar] [CrossRef] [Green Version]
  48. Harmon, C.; Walker, I. Estimates of the economic return to schooling for the United Kingdom. Am. Econ. Rev. 1995, 85, 1278–1286. [Google Scholar]
  49. Harmon, C.; Hogan, V.; Walker, I. Dispersion in the economic return to schooling. Labour Econ. 2003, 10, 205–214. [Google Scholar] [CrossRef] [Green Version]
  50. Angrist, J.D.; Keueger, A.B. Does Compulsory School Attendance Affect Schooling and Earnings? Q. J. Econ. 1991, 106, 979–1014. [Google Scholar] [CrossRef] [Green Version]
  51. Staiger, D.; Stock, J.H.; Watson, M.W. The NAIRU, Unemployment and Monetary Policy. J. Econ. Perspect. 1997, 11, 33–49. [Google Scholar] [CrossRef]
  52. Ichino, A.; Winter-Ebmer, R. Lower and Upper Bounds of Returns to Schooling: An Exercise in IV Estimation with Different Instruments. 1998. Available online: https://papers.ssrn.com/sol3/papers.cfm?abstract_id=141407 (accessed on 17 August 2018).
  53. Meghir, C.; Palme, M. Educational Reform, Ability, and Family Background. Am. Econ. Rev. 2005, 95, 414–424. [Google Scholar] [CrossRef]
  54. Spence, M. Job market signaling. Q. J. Econ. 1973, 87, 355–374. [Google Scholar] [CrossRef]
  55. Becker, G.S. Human Capital: A Theoretical and Empirical Analysis, with Special Reference to Education; Columbia University Press: New York, NY, USA, 1964. [Google Scholar]
  56. Becker, G.S.; Tomes, N. Human Capital and the Rise and Fall of Families. J. Labor Econ. 1986, 4, S1–S39. [Google Scholar] [CrossRef] [Green Version]
  57. Heckman, J.J.; Lochner, L.J.; Todd, P.E. Earnings Functions, Rates of Return and Treatment Effects: The Mincer Equation and Beyond; Working Paper No. 11544; NBER: Cambridge, MA, USA, 2005. [Google Scholar]
  58. Heckman, J.J. Sample Selection Bias as a Specification Error. Econometrica 1979, 47, 153–161. [Google Scholar] [CrossRef]
  59. Puhani, P. The Heckman Correction for Sample Selection and Its Critique. J. Econ. Surv. 2000, 14, 53–68. [Google Scholar] [CrossRef]
  60. Mann, P.S.; Kapoor, B.L. Earnings differentials between public, private and joint sectors in Punjab (India). J. Dev. Stud. 1988, 25, 97–111. [Google Scholar] [CrossRef]
  61. Lall, A.; Sakellariou, C. Evolution of Education Premiums in Cambodia: 1997–2007. Asian Econ. J. 2010, 24, 333–354. [Google Scholar] [CrossRef]
  62. McMahon, W.W. Relative returns to human and physical capital in the U.S. and efficient investment strategies. Econ. Educ. Rev. 1991, 10, 283–296. [Google Scholar] [CrossRef]
  63. Psacharopoulos, G. The value of investment in education: Theory, evidence, and policy. J. Educ. Financ. 2006, 32, 113–136. [Google Scholar]
  64. Moock, P.R.; Patrinos, H.A.; Venkataraman, M. Education and Earnings in a Transition Economy (Vietnam); World Bank Policy Research Working Paper No. 1920; The World Bank: Washington, DC, USA, 1998. [Google Scholar]
  65. Gallup, J.L. The Wage Labor Market and Inequality in Viet Nam in the 1990s (English); World Bank Policy Research Working Paper No. WPS 2896; The World Bank: Washington, DC, USA, 2002. [Google Scholar]
  66. Liu, A.Y.C. Changing wage structure and education in Vietnam, 1992–1998. Econ. Transit. 2006, 14, 681–706. [Google Scholar] [CrossRef]
  67. Doan, T.; Tran, Q.T.; Le, Q. Lost in Transition? Declining Returns to Education in Vietnam; Working Papers in Economics No.16/01; University of Waikato: Waikato, New Zealand, 2016. [Google Scholar]
  68. Glewwe, P.; Patrinos, H.A. The Role of the Private Sector in Education in Vietnam: Evidence from the Vietnam Living Standards Survey (English); Living Standards Measurement Study (LSMS) Working Paper, No. LSM 132; The World Bank: Washington, DC, USA, 1998. [Google Scholar]
  69. Liu, A.Y.C. Sectoral gender wage gap in Vietnam. Oxf. Dev. Stud. 2004, 32, 225–239. [Google Scholar] [CrossRef]
  70. Pham, T.-H.; Reilly, B. The gender pay gap in Vietnam, 1993–2002: A quantile regression approach. J. Asian Econ. 2007, 18, 775–808. [Google Scholar] [CrossRef]
  71. Phan, D.; Coxhead, I. Long-run costs of piecemeal reform: Wage inequality and returns to education in Vietnam. J. Comp. Econ. 2013, 41, 1106–1122. [Google Scholar] [CrossRef] [Green Version]
  72. Pham, H.T.; Reilly, B. Ethnic wage inequality in Vietnam. Int. J. Manpower 2009, 30, 192–219. [Google Scholar] [CrossRef] [Green Version]
  73. Doan, T.; Stevens, P. Labour Market Returns to Higher Education in Vietnam. SSRN J. 2011, 5, 1–21. [Google Scholar]
  74. Glewwe, P.; Jacoby, H.G. Economic growth and the demand for education: Is there a wealth effect? J. Dev. Econ. 2004, 74, 33–51. [Google Scholar] [CrossRef]
  75. Jones, P.W. World Bank Financing of Education: Lending, Learning and Development; Routledge: Abingdon-on-Thames, UK, 2007. [Google Scholar]
  76. Kazuhiro, Y. Urbanization, informal sector, and development. J. Dev. Econ. 2007, 84, 76–103. [Google Scholar]
  77. Arbex, M.; Galao, A.F.; Gomes, F. Heterogeneity in the Returns to Education and Informal Activities; Insper Working Paper; Insper Instituto de Ensino e Pesquisa: Sao Paulo, Brazil, 2007. [Google Scholar]
  78. Arcand, J.; D’Hombres, B.; Gyselinck, P. Instrument Choice and the Returns to Education: New Evidence from Vietnam; 2004; Unpublished Paper. [Google Scholar]
  79. Angrist, J.D.; Pischke, J.S. Mostly Harmless Econometrics: An Empiricist’s Companion; Princeton University Press: Princeton, NJ, USA, 2008. [Google Scholar]
  80. Hung, N.T. Understanding lifelong learning: A perspective on the world today and Vietnam. KEDI J. Educ. Policy 2007, 4, 9–16. [Google Scholar]
  81. Doan, T.; Gibson, J. Return to Schooling in Vietnam During Economic Transition: Does the Return Reach its Peak? MPRA: Munich, Germany, 2010. [Google Scholar]
Figure 1. Educational attainment in Hanoi by firm ownership.
Sustainability 11 04903 g001
Figure 2. Educational attainment in HCMC by firm ownership. Source: [16]; Author’s own calculations.
Sustainability 11 04903 g002
Figure 3. Average monthly income in Hanoi by education and gender (in thousand VND). Source: [16]; Author’s own calculations.
Sustainability 11 04903 g003
Figure 4. Average monthly income in HCMC by education and gender (in thousand VND). Source: [16]; Author’s own calculations.
Sustainability 11 04903 g004
Figure 5. Average monthly income in Hanoi by education and firm ownership (in thousand VND). Source: [16]; Author’s own calculations.
Sustainability 11 04903 g005
Figure 6. Average monthly income in HCMC by education and firm ownership (in thousand VND). Source: [16]; Author’s own calculations.
Sustainability 11 04903 g006
Figure 7. Average monthly income in Hanoi and HCMC by job sector (in thousand VND). Source: [16]; Author’s own calculations.
Sustainability 11 04903 g007
Figure 8. Return on schooling in Hanoi and HCMC by educational level, Mincer vs. Heckman (in percent).
Sustainability 11 04903 g008
Table 1. Variables used to describe Hanoi and HCMC (Numbers other than percentages are average values).
VariableHanoiHCMC
Age36.9736.79
Female45.37%46.7%
Ethnic minority2.01%7.96%
Urban area51.5%83.1%
Married76.87%62.72%
Migrant (born in another province)16%33%
Higher education share41.48%31.5%
Vocational education share18.6%13.36%
Years of schooling12.510.6
Monthly income (thousand VND)7025.967211.55
Public sector28.32%18.18%
Informal sector38.72%35.97%
Source: [16]; Author’s own calculations.
Table 2. Education attainment in Hanoi and HCMC, total and by gender (in %).
Educational LevelHanoiHCMC
TotalMaleFemaleTotalMaleFemale
No qualification1.4962.237.85.4256.243.8
Primary7.9457.942.116.452.947.1
Lower secondary14.8317.38
Upper secondary16.7316.67
Elementary vocational6.9761395.6963.836.2
Middle vocational3.997.44
Three-year college5.9748.451.94.8449.650.4
University30.1924.55
Master’s3.991.52
PhD0.930.09
Source: [16]; Author’s own calculations.
Table 3. Detailed comparison of the results from the Mincer and Heckman models.
OLSHeckman (First Step)Heckman (Second Step)
Elementary vocational0.195 ***0.092 **0.175 ***
(0.0462)(0.004)(0.0438)
Middle vocational/Professional school0.159 ***0.008 **0.129 ***
(0.0452)(0.034)(0.0428)
3-year college0.204 ***0.023 **0.154 ***
(0.0500)(0.031)(0.0476)
University0.352 ***0.082 **0.293 ***
(0.0470)(0.043)(0.0446)
Master’s0.581 *** 0.492 ***
(0.0610) (0.0594)
PhD0.877 *** 0.722 ***
(0.101) (0.103)
Intercept0.039 ***0.031 ***0.175 ***
(0.034)(0.012)(0.021)
R-squared0.2730.2890.364
Inverse Mill’s ratio 231.983 ***
Standard errors are in parentheses. *** p < 0.01, ** p < 0.05.

