Article

Coupling Influences of ENSO and PDO on the Inter-Decadal SST Variability of the ACC around the Western South Atlantic

1
Department of Earth Sciences, National Taiwan Normal University, Taipei 11677, Taiwan
2
Department of Marine Environment and Engineering, National Sun Yat-Sen University, Kaohsiung 80424, Taiwan
3
Taiwan Ocean Research Institute, National Applied Research Laboratories, Kaohsiung 80143, Taiwan
*
Authors to whom correspondence should be addressed.
These authors equally important as the first author.
Sustainability 2019, 11(18), 4853; https://doi.org/10.3390/su11184853
Submission received: 26 August 2019 / Revised: 31 August 2019 / Accepted: 1 September 2019 / Published: 5 September 2019

Abstract

:
The Antarctic Circumpolar Current (ACC) plays an important role in the climate as it balances heat energy and water mass between the Pacific and Atlantic Oceans through the Drake Passage. However, because the historical measurements and observations are extremely limited, the decadal and long-term variations of the ACC around the western South Atlantic Ocean are rarely studied. By analyzing reconstructed sea surface temperatures (SSTs) in a 147-year period (1870–2016), previous studies have shown that SST anomalies (SSTAs) around the Antarctic Peninsula and South America had the same phase change as the El Niño Southern Oscillation (ENSO). This study further showed that changes in SSTAs in the regions mentioned above were enlarged when the Pacific Decadal Oscillation (PDO) and the ENSO were in the same warm or cold phase, implying that changes in the SST of higher latitude oceans could be enhanced when the influence of the ENSO is considered along with the PDO.

1. Introduction

The Antarctic Circumpolar Current (ACC) accounts for the longest and strongest current in the world oceans. Its transports can reach ~140 Sv (1 Sv = 106 m3 s−1), and its length extends around the globe. It is a conduit connecting the three major Oceans, providing a direct passage exchanging heat, salt, and oceanic tracers. Through this way the ACC makes an enormous impact on Earth’s climate, atmospheric and oceanic circulations, seawater stratification and air–sea heat and mass exchanges [1]. One example is fluctuations in the ACC intensity of the western South Atlantic Ocean consequentially influence the sea surface temperature (SST) and marine ecosystems [2,3,4,5]. However, the South Atlantic Ocean is rarely sampled and studied tied to its inclement weather and rigorous environment in the area [6].
The Falkland Island and the South American Continent provide constrained landforms for the Falkland Current (hereafter FC) and the ACC (Figure 1). In the Southwestern Atlantic, the southward Brazil Current (BC) and the northward FC meet off the eastern South America and form the eastward extension, the South Atlantic Current (Figure 1) [7]. In the places that BC meets FC, the southward BC flows along the coast off the eastern South America, and carries warm water from the subtropical region to the South Atlantic gyre [8]. On the other hand, the northward FC transports cold water as it is a branch of the ACC [9]. The Brazil–Malvinas Confluence (BMC) is generated at around 38° S and extends poleward to around 45° S [10]. The BMC is a dynamically active region [11].
Previous studies documented that the climate modes such as the Southern Annular Mode (SAM) [13,14], the Pacific-South American pattern (PSA) [15] and the Antarctic Dipole (AD) [16] are associated with the variability of the ACC. For instance, Meredith and Hogg [14] found that the high eddy activity in the ACC was during the period 2000–2002, which has been attributed to the SAM related wind stress change during 1998. On the other hand, Verdy et al. [17] suggested that the SST variability in the ACC can be attributed to the surface forcing of the SAM and remote forcing of the El Niño Southern Oscillation (ENSO).
The South Atlantic Ocean obviously exhibits both inter-annual and multi-decadal variabilities [18,19,20,21,22,23,24,25]. It is well known that the Pacific climate experiences strong inter-annual variations due to the ENSO. This impact is not limited in the Northern Hemisphere, but extends as far as South America [26,27,28,29,30,31,32,33]. Additionally, recent studies have shown diagnostic evidence that the long-term natural variability can modulate the ENSO teleconnections [30,34,35,36,37,38]. The Pacific Decadal Oscillation (PDO) is one among them, which is the leading mode of the North Pacific Ocean SST anomaly (SSTA) [39]. Previous studies suggested that the decadal and long-term variabilities of hydrometeorological parameters around South America have shared many traits with the PDO [30,37,38,39,40,41,42]. For instance, Kayano et al. [41] examined the relationships of the inter-annual variations of the South American summer precipitation with the PDO. Their results demonstrated that the distinct strength of the ENSO teleconnections was closely correlated with the PDO index. In southeastern South America, Jacques-Coper and Brönnimann [42] analyzed the surface air temperature and found out that the temperature variation during summer had been influenced significantly by the PDO phases in their study region.
The relationship between changes in the physical properties of the ACC and low-frequency atmospheric variabilities has been seldom documented, due greatly to extremely limited measurements and observations in the area. Satellite measurements provide a great opportunity to extend the spatial and temporal coverage of oceanic parameters. Repeated measurements by satellites now allow to have an improvement in the definition of the timing and amplitude of the SST cycle in this region [43]. Combined with historical reanalysis and reconstructed satellite data, this study analyzed a long-term (147-year) SST time series in southern South America and explored their relationship with low-frequency climatic oscillations, especially the PDO modulation. Moreover, the ENSO-related SSTA patterns across South America were also investigated by taking the PDO phases into account.

2. Materials and Methods

The 147-year monthly SST data between 1870 and 2016 were provided by the HadISST (Hadley Centre’s global sea ice and sea surface temperature analysis datasets) (http://www.metoffice.gov.uk/hadobs/hadisst/index.html) with 1° × 1° spatial resolution [44]. The HadISST product is based on in situ observations of the Met Office Marine Data Bank (MDB), the Global Telecommunications System (GTS), and the International Comprehensive Ocean–Atmosphere Data Set (ICOADS). The product is reconstructed using the Reduced Space Optimal Interpolation (RSOI) and the additional quality control of gridded data [44]. Uncertainty of the HadISST data are about 0.1–0.15 °C (before 1900) and <0.1 °C (since 1900) [45]. In this study, each grid of the monthly SSTA was determined as a linear-detrended measured monthly data minus the climatological annual cycle among the study periods.
The EOF (Empirical orthogonal function) analysis has been applied to the SSTA to obtain the physically meaningful SSTA modes. These modes are obtained by solving the covariance matrix, followed by the eigenvalue and eigenvector problems: R C = C Λ , where the R is the covariance matrix of SSTA, Λ is a diagonal matrix including the eigenvalues, C is associated with eigenvectors (hereafter the spatial pattern). The principal component (PC, hereafter the time series) can be found by solving: α n = F × e i g v n , where α n is the time series of the n-th EOF mode, F is the SSTA, e i g v n is the spatial pattern of the n-th EOF mode. The percentage of variance explained is found by diag Λ / diag Λ , where diag( Λ ) is the diagonal value of Λ [46]. The significance test for the correlation is based on the t-test.
The PDO index was provided by the JISAO (Joint Institute for the Study of the Atmosphere and Oceans) (http://jisao.washington.edu/pdo/PDO.latest), defined as the first EOF mode of the North Pacific SSTA [39]. The inter-decadal trends of changes in the SSTA and PDO indices were determined using the Butterworth filter to remove signals at periods shorter than 10 years. The low-pass Butterworth filter was used to remove the interannual time scale signal. The filter has a flat frequency response in the passband [47].

3. Results

3.1. The Western South Atlantic Ocean Leading Modes

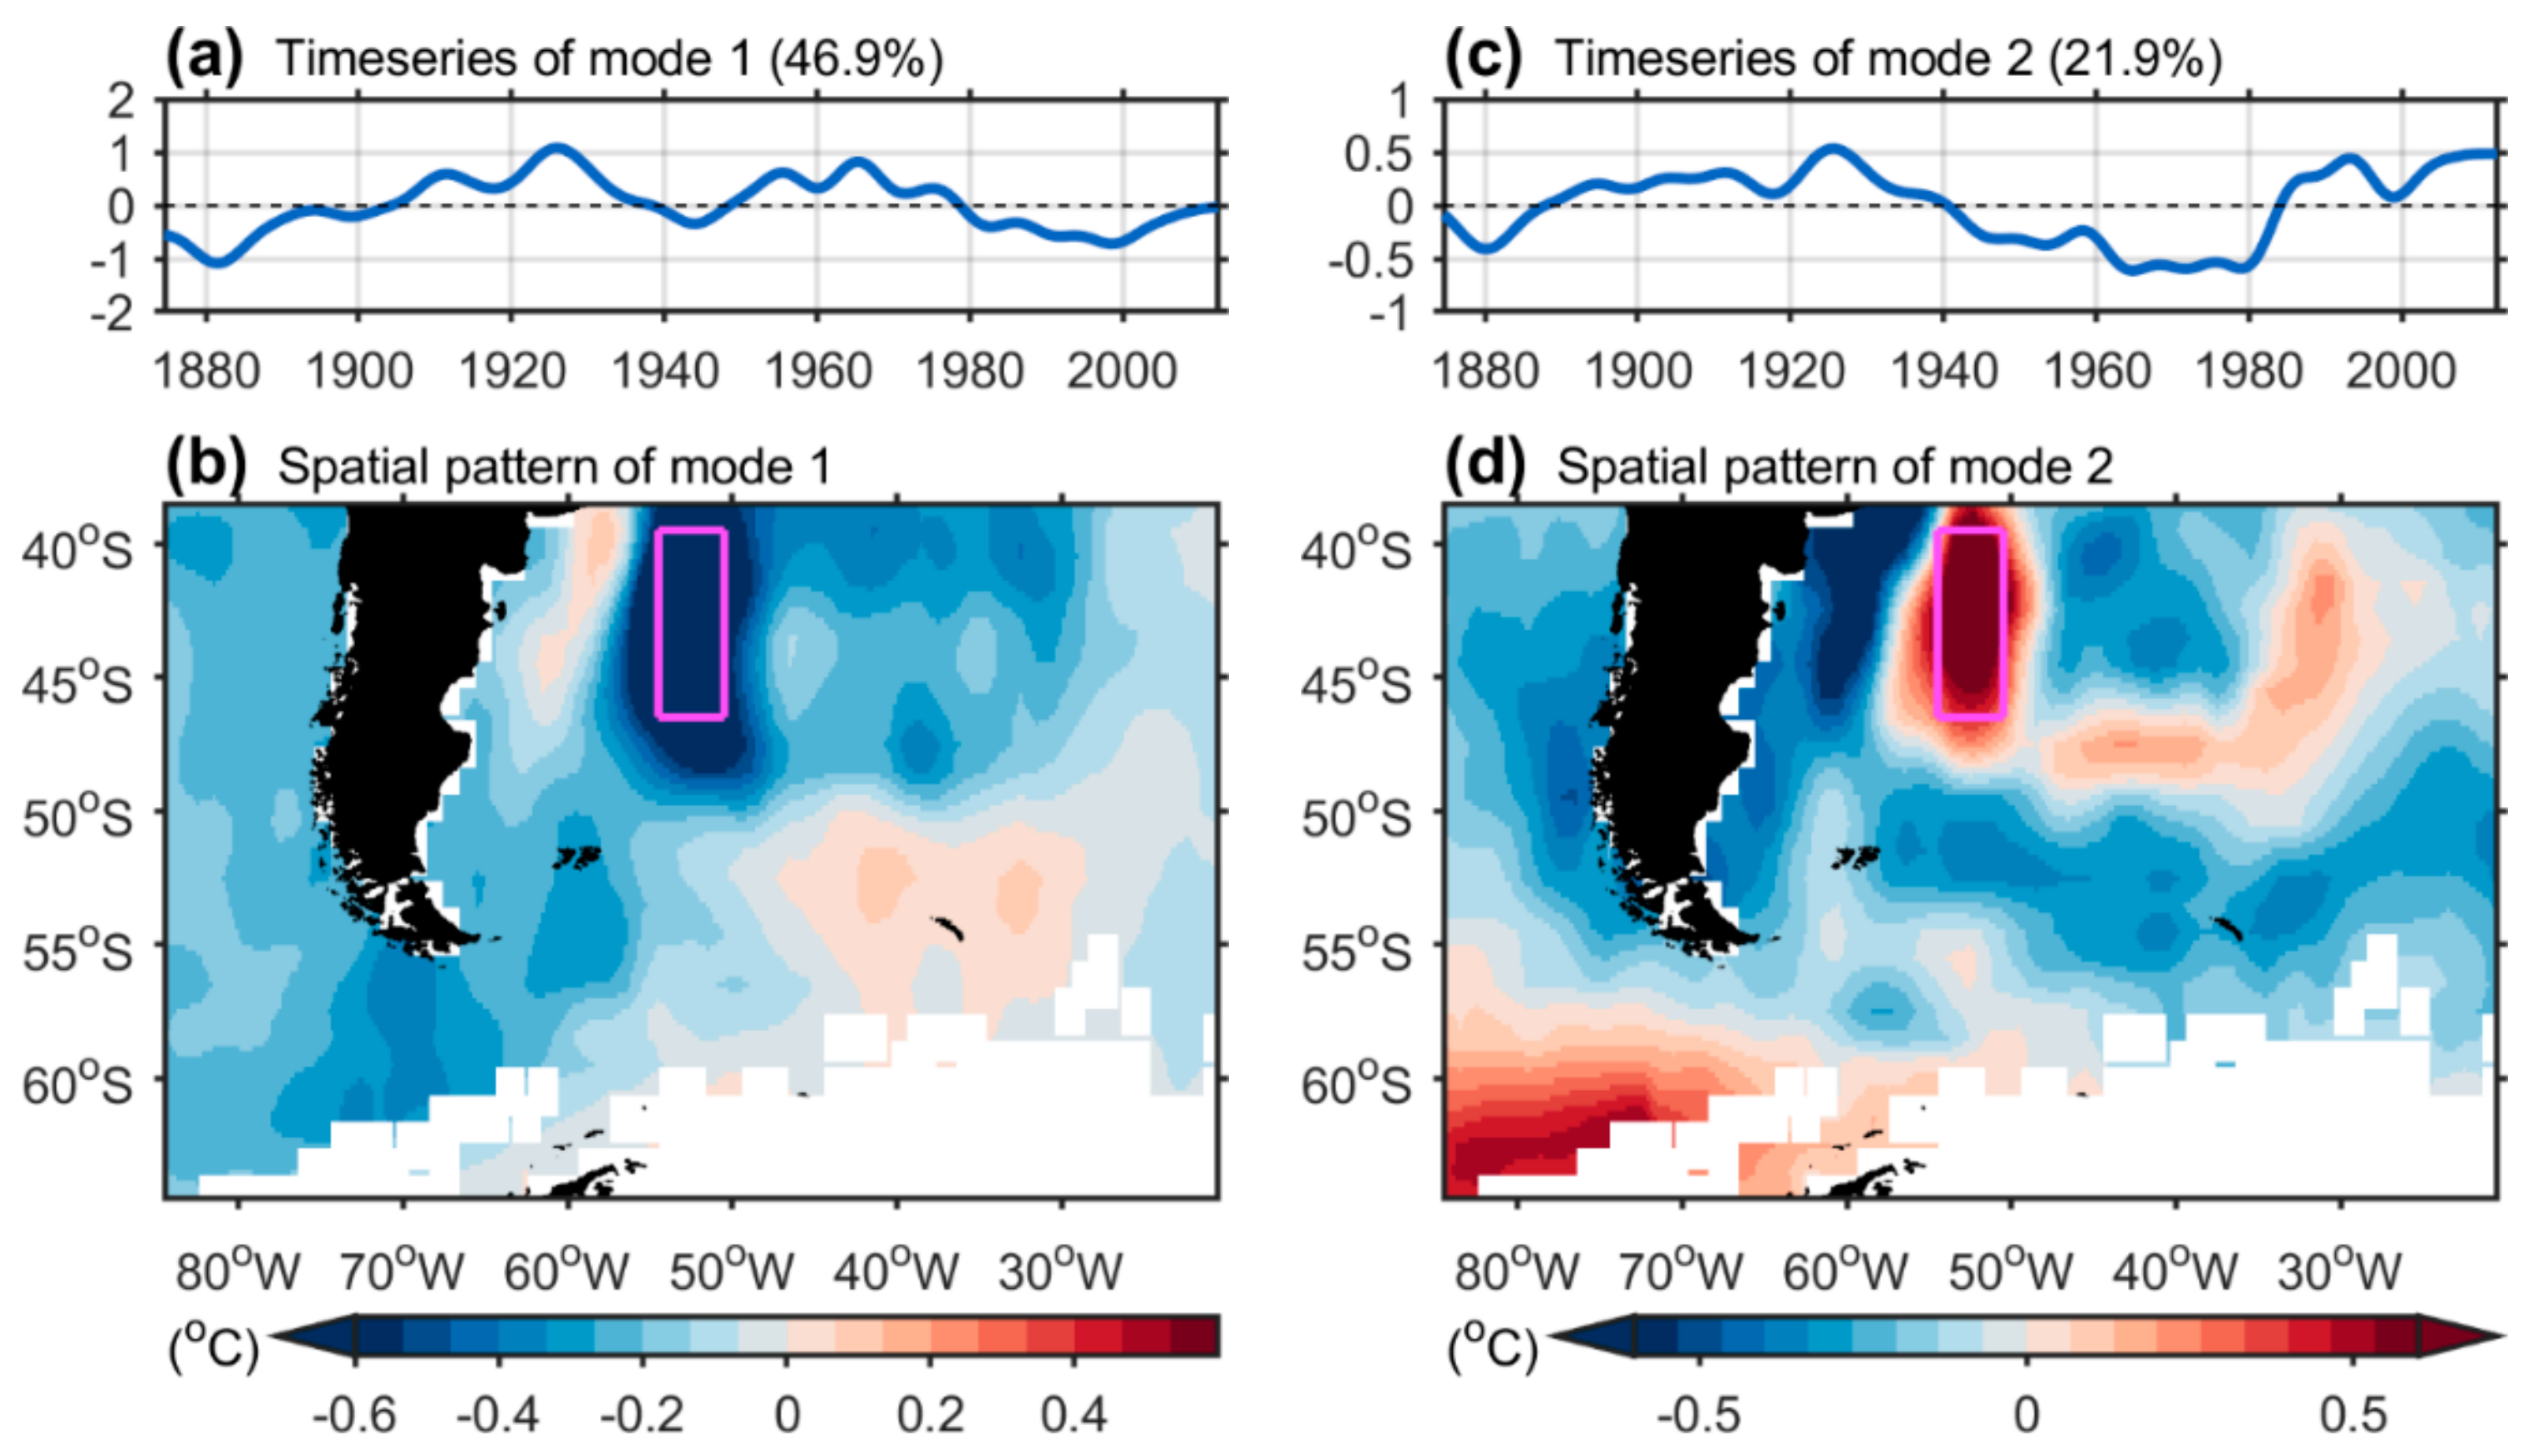
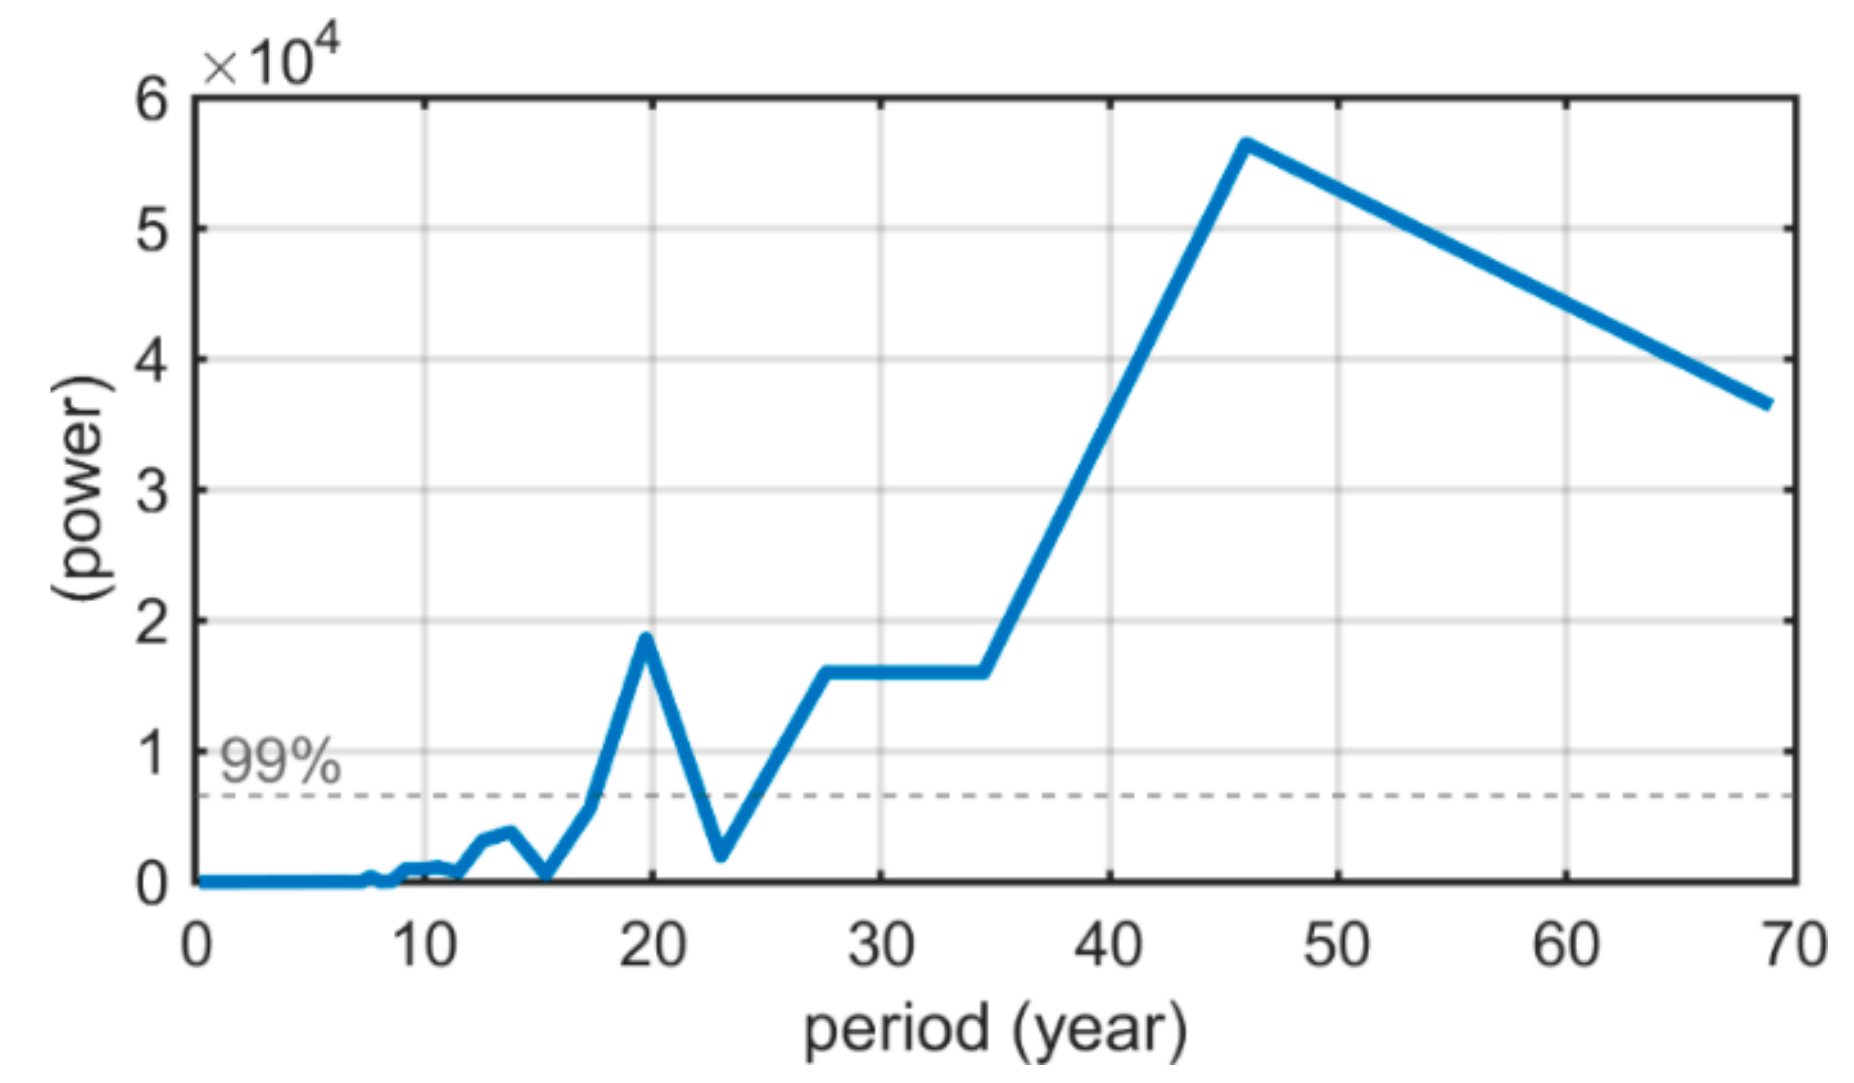
In order to emphasize the major inter-decadal SSTA variabilities in the southeastern Pacific and the southwestern Atlantic, the EOF analysis was applied to SSTAs in the study area after 108 months of low-pass filtering. Figure 2 shows the spatial distributions of the two leading EOF modes, as well as their time series. The 1st and 2nd modes account for 46.9% and 21.9% of the variance explained, respectively. Based on the criterion of North et al. [48], they were separated from the lower variance explained modes. By applying the FFT analysis to PC1, Figure 3 showed clear inter-decadal variations with cycles between 13 and 48 years. Having a similar study area, Venegas et al. [19] used the singular value decomposition (SVD) method to determine coupled atmosphere–ocean modes using the SST and sea level pressure (SLP) data during 1953–1992 in the South Atlantic Ocean. Our result matched their first mode, which had decadal variation periods of about 15–17 years. Additionally, the values agreed with the inter-decadal fluctuations of the PDO in periods of 15–25 years and 50–70 years [49].
Special distributions of the first two modes of the EOF analysis showed that there was a distinguished anomalous high SSTA region near the BMC region (38° S to 50° S and 48° W to 56° W). The distribution of the second mode of the SSTA showed that there was a significant low SSTA region located to the west of the high SSTA region, forming a clear west–east dipole structure. Kayano et al. [32] studied the relationships between the SST in the South Atlantic Ocean and the ENSO in the tropical Pacific during 1900–2006. Kayano et al. [32] showed that in the case of the EOF analysis (EOF2), only one region (35° S–50° S) (in their Figure 2) was found with significant loadings, which neither corresponded to any of the South Atlantic Ocean SVD modes nor represented a physical mode described by Venegas et al. [19]. Therefore, no further analysis or discussion was described in their study. However, looking at the areas that Kayano et al. [32] left undescribed, EOF1 and EOF2, in our case, showed a particular and interesting dipole-like pattern between 35° S and 50° S, which covers one of the most complicated areas of the world’s oceans, namely the BMC region. As mentioned above, through the analysis of the PC1 and PC2 time series, our results suggest that other low-frequency variabilities (for instance: Approximately 16 and >50 years) also existed in our research area.

3.2. Inter-Decadal Variation in the Brazil–Malvinas Confluence (BMC) Area

As mentioned above, our results showed a particular and interesting pattern between 38° S and 50° S. The first mode of the SSTA variability was located mainly in the BMC region—to simplify we defined the region as 39.5° S~46.5° S and 54.5° W~50.5° W. Furthermore, the average SSTA time series of the BMC region was determined as the BMC index of the temperature variability in the region.
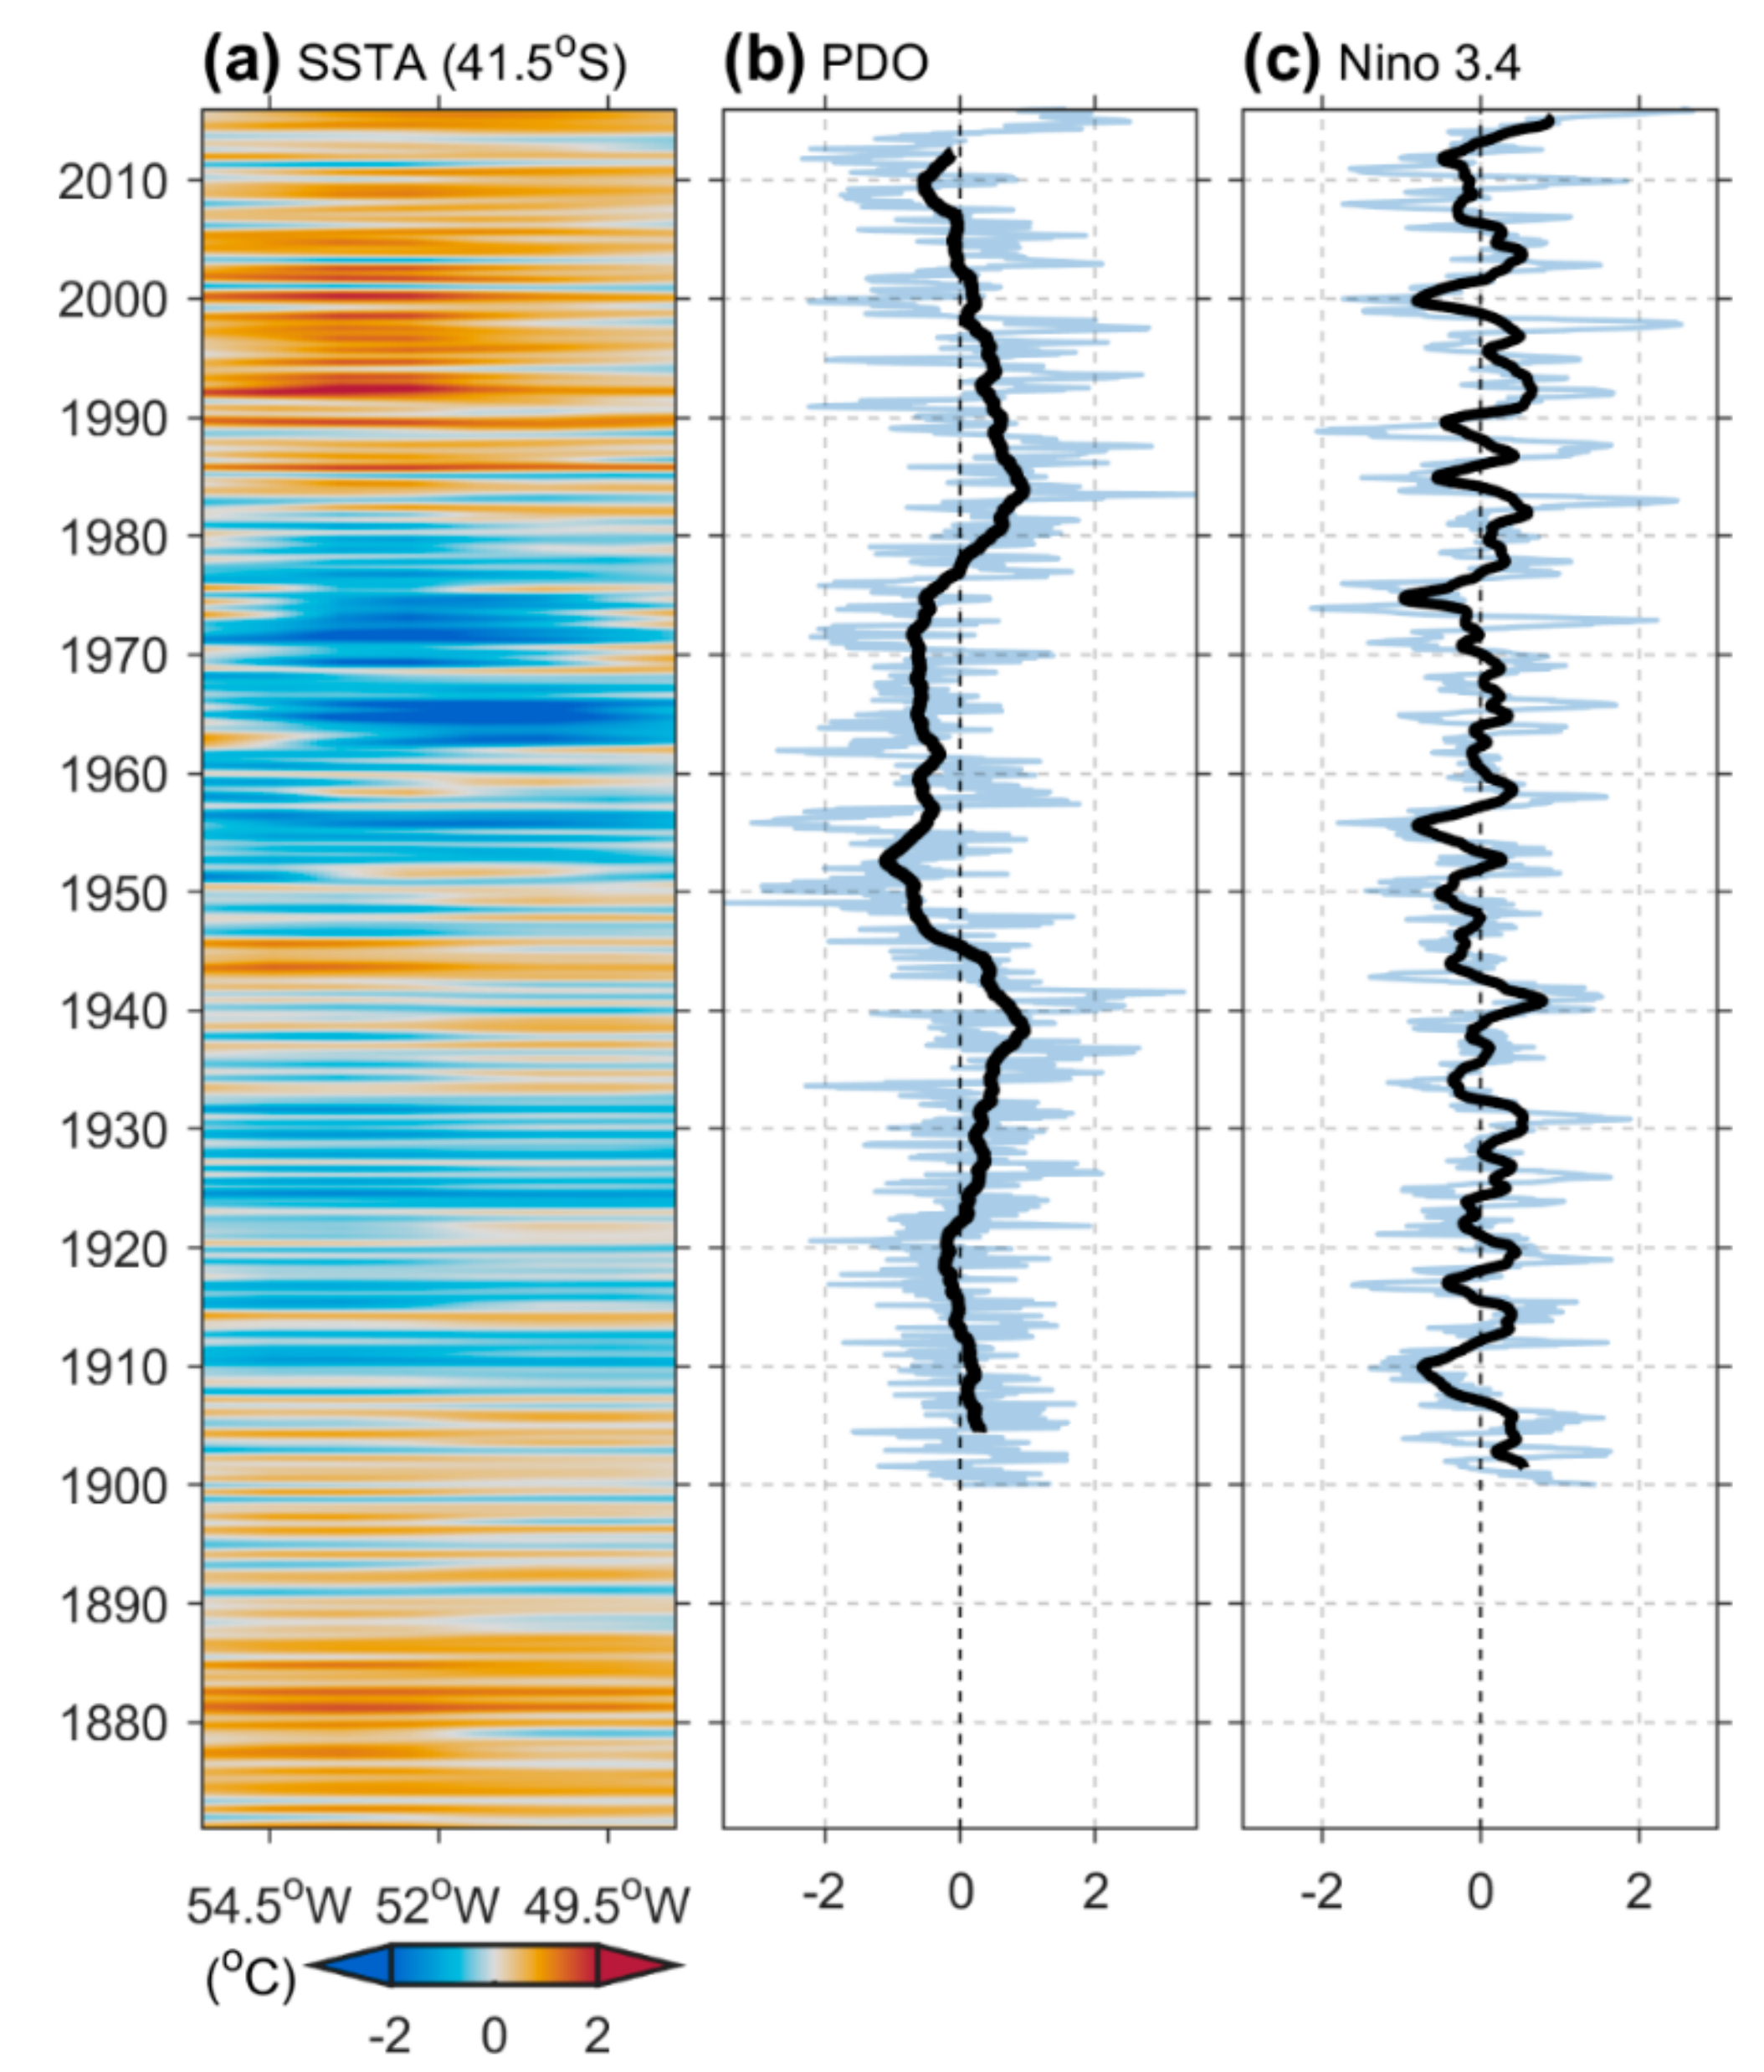
In order to emphasize the inter-annual to the long-term variability, the low-pass filter was applied in the time series of each grid. In this case, the time series datasets were acquired from the zonal region (along 41.5° S) that included the BMC region. Figure 4a shows the two significant phases: A cold phase occurred in two periods—from 1910 to 1930 and from 1950 to 1980—and a warm phase appeared in three periods—from 1870 to 1910, from 1930 to 1950, and from 1980 to the present. Comparing our results with both cold and warm PDO regimes (Figure 4b), the warm and cold cycles are similar to the PDO’s inter-decadal regime shift. In the subtropical and extratropical regions of the Chile, Kayano et al. [50] showed that there was a clear multi-decadal precipitation cycle between 40 and 60 years. Likely, this low-frequency variability was largely due to the modulations of the PDO.
To discuss the particular periods of this study with recent studies, Minobe [49] indicated that the most energetic PDO fluctuations were in two periodicities, which were between 15 and 25 years and 50 and 70 years. Using the SST and SLP data, Mantua et al. [39] found that the PDO reversals in the polarity of the oscillations had a period of around 50–70 years.

3.3. Relationships between PDO and SSTA

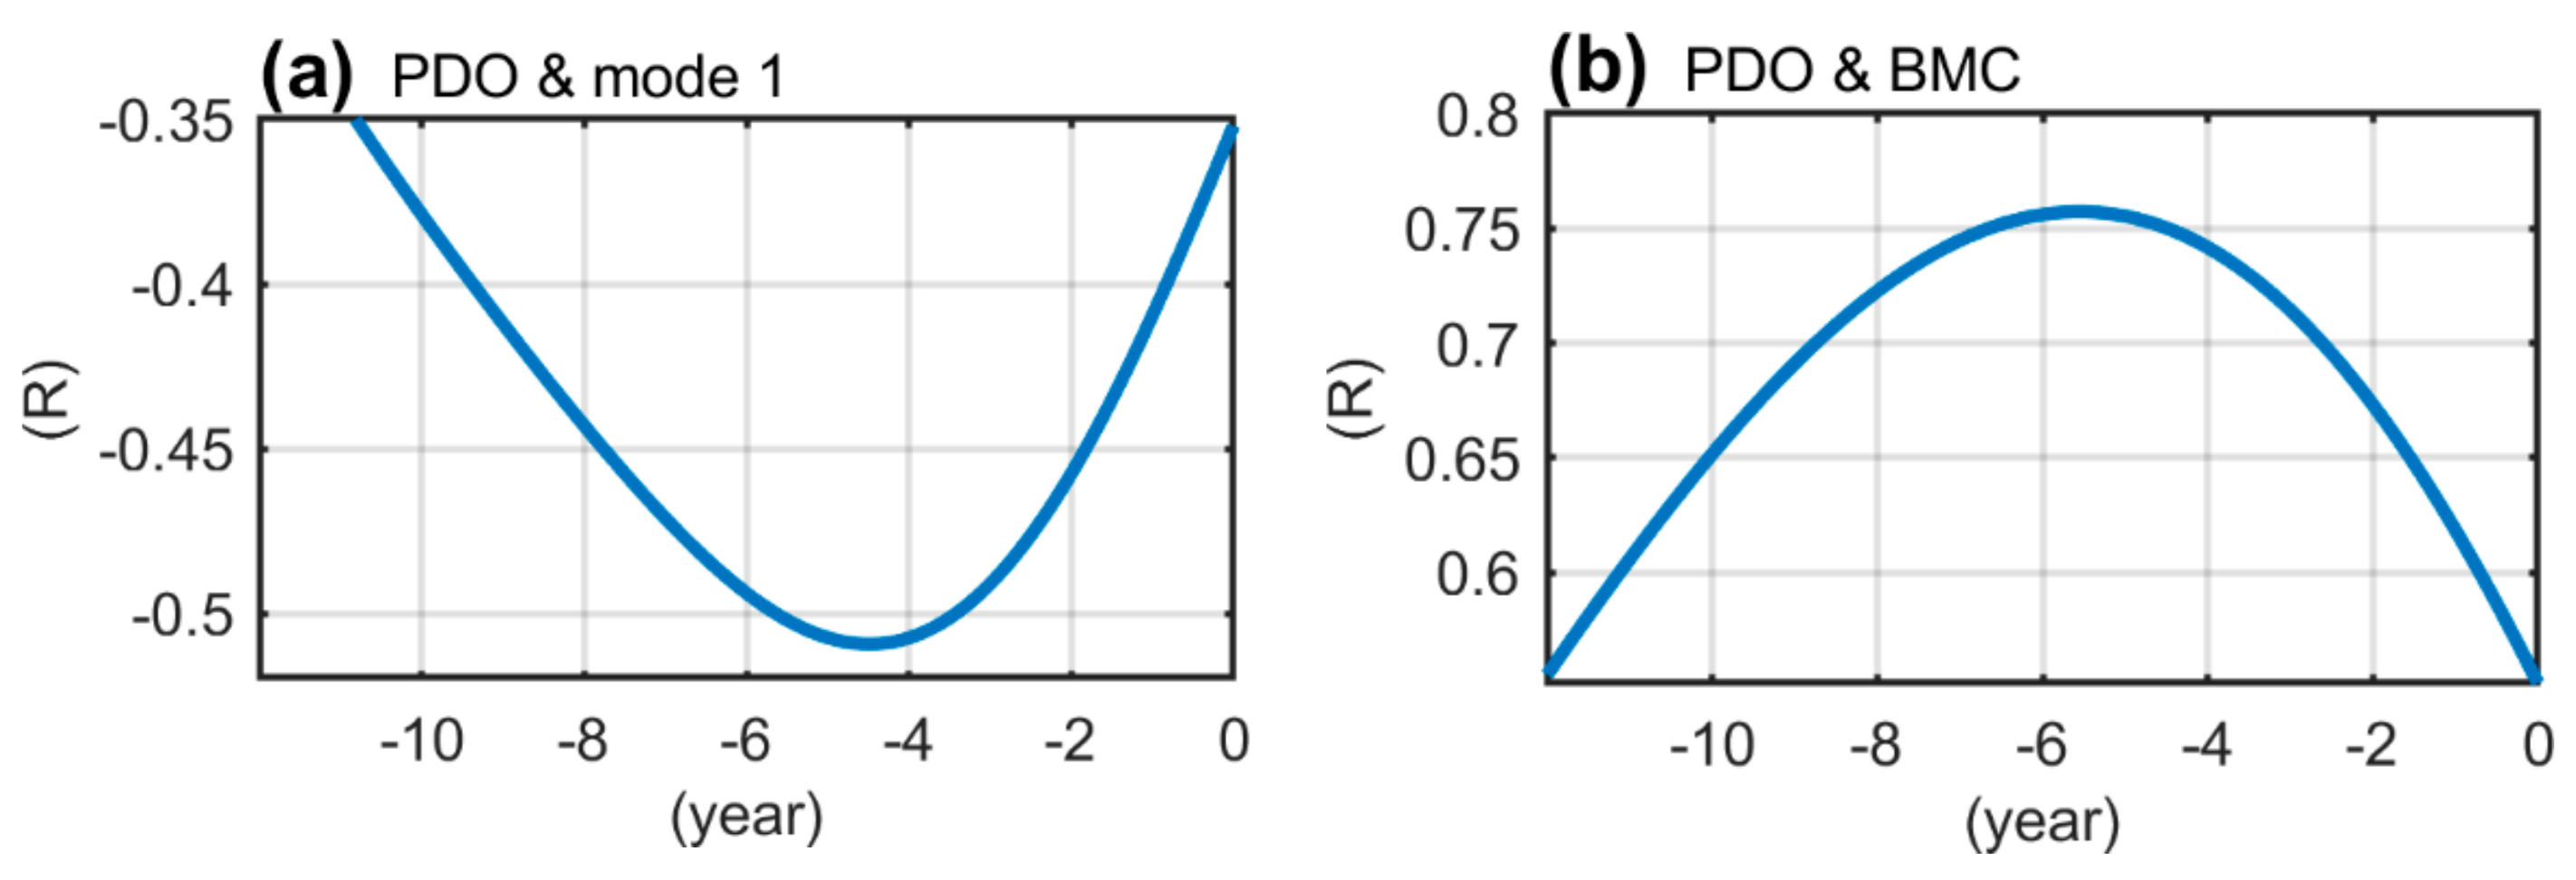
In order to examine the correlation between the SSTAs of this study and the PDO index, an EOF analysis with a nine-year low-pass filter was applied to determine the principal components (PCs). The duration of the time series used was adjusted to between 1900 and 2016, as the PDO index started from 1900. The first mode of the EOF analysis was then obtained, representing 49.9% of the variations. Figure 5a showed that the time series of the first mode had a high negative correlation with the PDO index (R = −0.5, n = 1294, above 99% confidence level). Furthermore, the inter-decadal variation of the SSTAs in our study area was closely related to the warm and cold phases of the PDO.
These results agree with previous studies. Kayano et al. [41] investigated the differences between the periods of 1948–1976 and 1977–2002, as well as the inter-annual correlations between the tropical SST and the South American precipitation. They suggested that the low-frequency periods corresponded to the cold and warm PDO phases. Additionally, Kayano et al. [32] showed the EOF results of the SSTA in tropical Pacific Oceans and the South Atlantic, and the corresponding PC time series were positively correlated with each other during 1975–2000. On the other hand, negative correlations were noticeable particularly during the 1920–1930 and 1940–1970 periods (in Figure 3).
In this study, additionally, the main oscillations of the first mode occurred around the BMC region (Figure 2), showing that the SSTA of the BMC region had significant inter-decadal oscillations (Figure 3). Furthermore, we analyzed the cross-correlation between the BMC and PDO indices during extreme events (indices that were greater or less than one standard deviation). The result showed that the BMC index had a strong positive correlation with the PDO index, the correlation coefficient was as high as 0.75 (n = 1294, above 99% confidence level) when the PDO index time series led by about five-years of the BMC index time series (Figure 5b). Such duration of five-years (Figure 5) was similar to the periodicity of a typical ENSO event (Figure 4c), implying that variations in the BMC index might reflect both the ENSO and PDO events.

3.4. Coupling Influences between PDO and ENSO

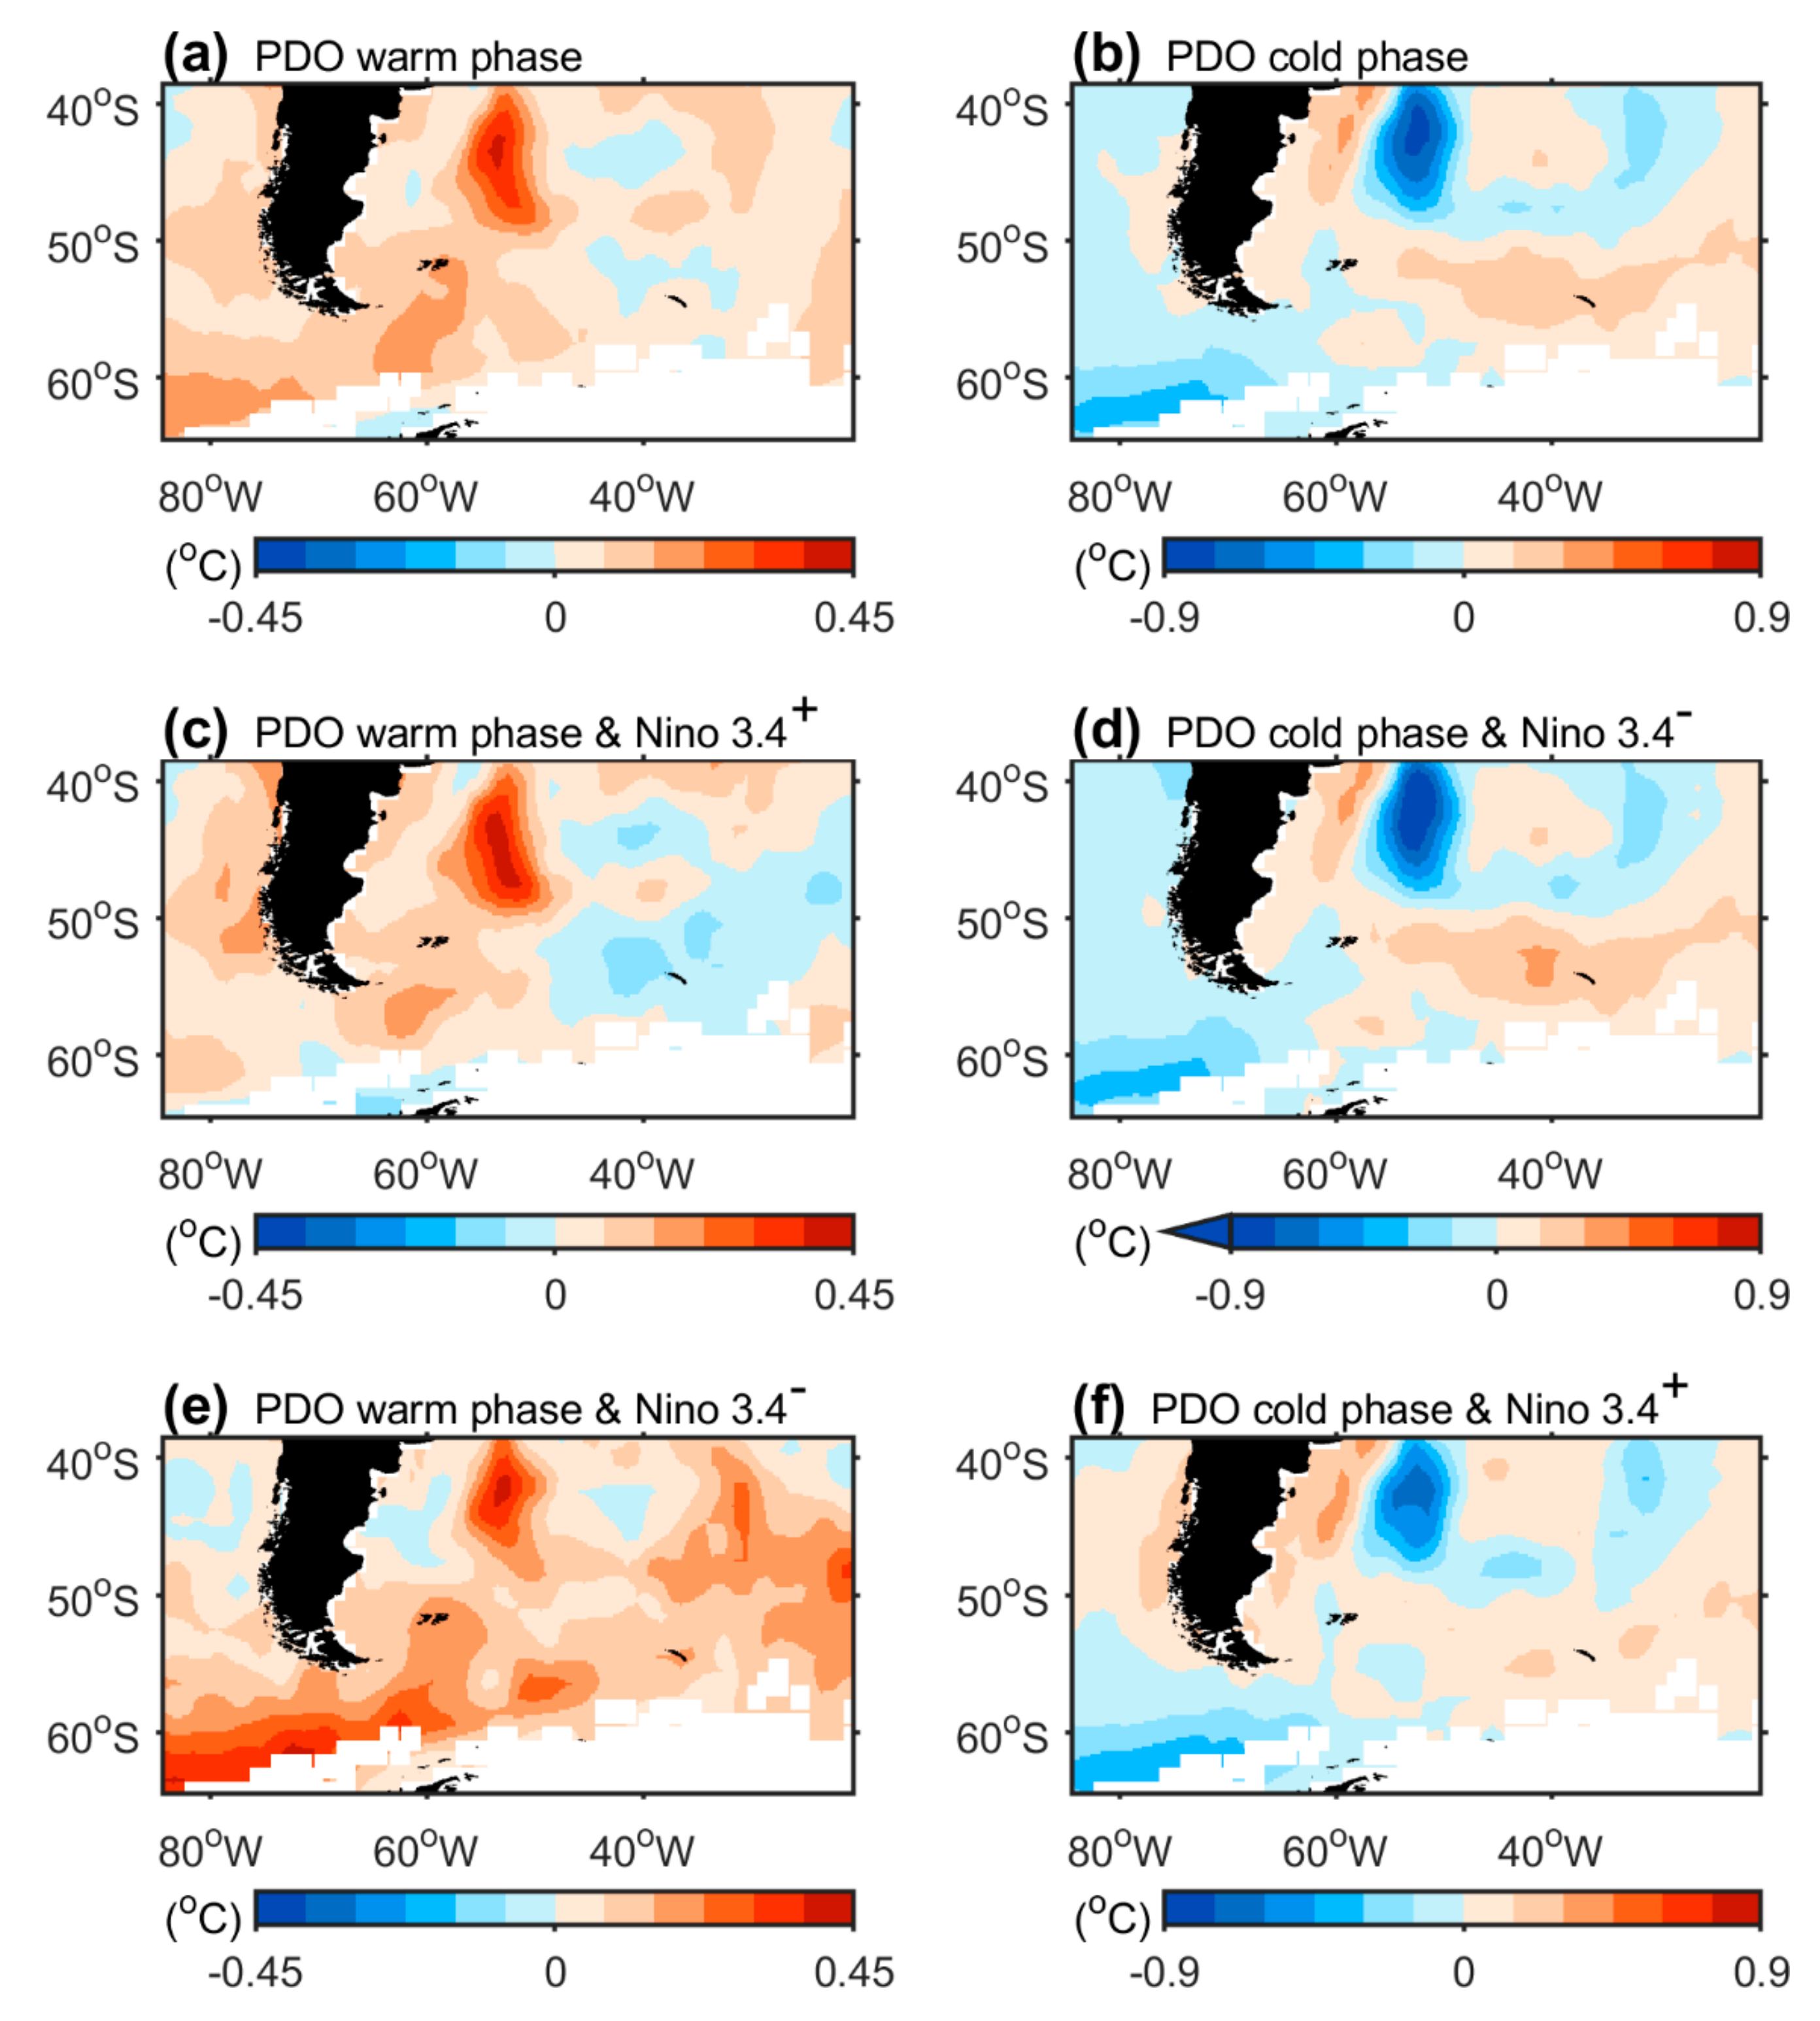
In order to examine the possible coupling influences of the ENSO and the PDO in the spatial distributions of the SSTAs in the study area, we analyzed the SSTA variability under different ENSO scenarios when the PDO was in either a warm or cold phase. Our results showed that when the PDO was in a warm phase (1977–1998), warm SSTAs occurred in the BMC region, the Southeastern Pacific Ocean, and in the area adjacent to the Drake Passage (Figure 6a). Moreover, the opposite cold SSTA area was in the Southwestern Atlantic Ocean. In contrast, the pattern of the distributions of the SSTAs reversed when the PDO was in a cold phase (1950–1976) (Figure 6b).
It is worth mentioning that such patterns of changes in the SSTAs (the magnitudes of the SSTAs) enhanced in El Niño when the PDO was in a warm phase (Figure 6b) or La Niña when the PDO was in a cold phase (Figure 6c). In other words, the influences of the PDO on the SSTAs in our study area were enhanced when in (1) the PDO warm phase and El Niño or in (2) the PDO cold phase and La Niña. Such a finding suggests that the PDO is not only associated with the SSTAs in the North Pacific Ocean, but also correlated with the climate change as far as the south Polar Regions. Based on our findings, we suggest that the SSTAs in the BMC region may have the potential of being used as the index to study the PDO–ENSO coupling effect.
The positive PDO–ENSO coupling effect (enhanced magnitudes of the SSTAs during the same phase for both the PDO and ENSO) may attribute to the close relationship between the PDO and ENSO, as the previous study noticed that they could be involved in a consistent Pacific climate system [51]. In addition, the PDO has shared traits from a low-frequency of the ENSO [52]. However, as the PDO has a significant decadal variability than the ENSO, the PDO in the decadal coupling effect should play an important role. To quantitate the contributions of the PDO and the ENSO in the decadal variabilities of the BMC SSTA, the AR-1 model has been applied [52], stated as
B M C = α × P D O + β × E N S O + r ,
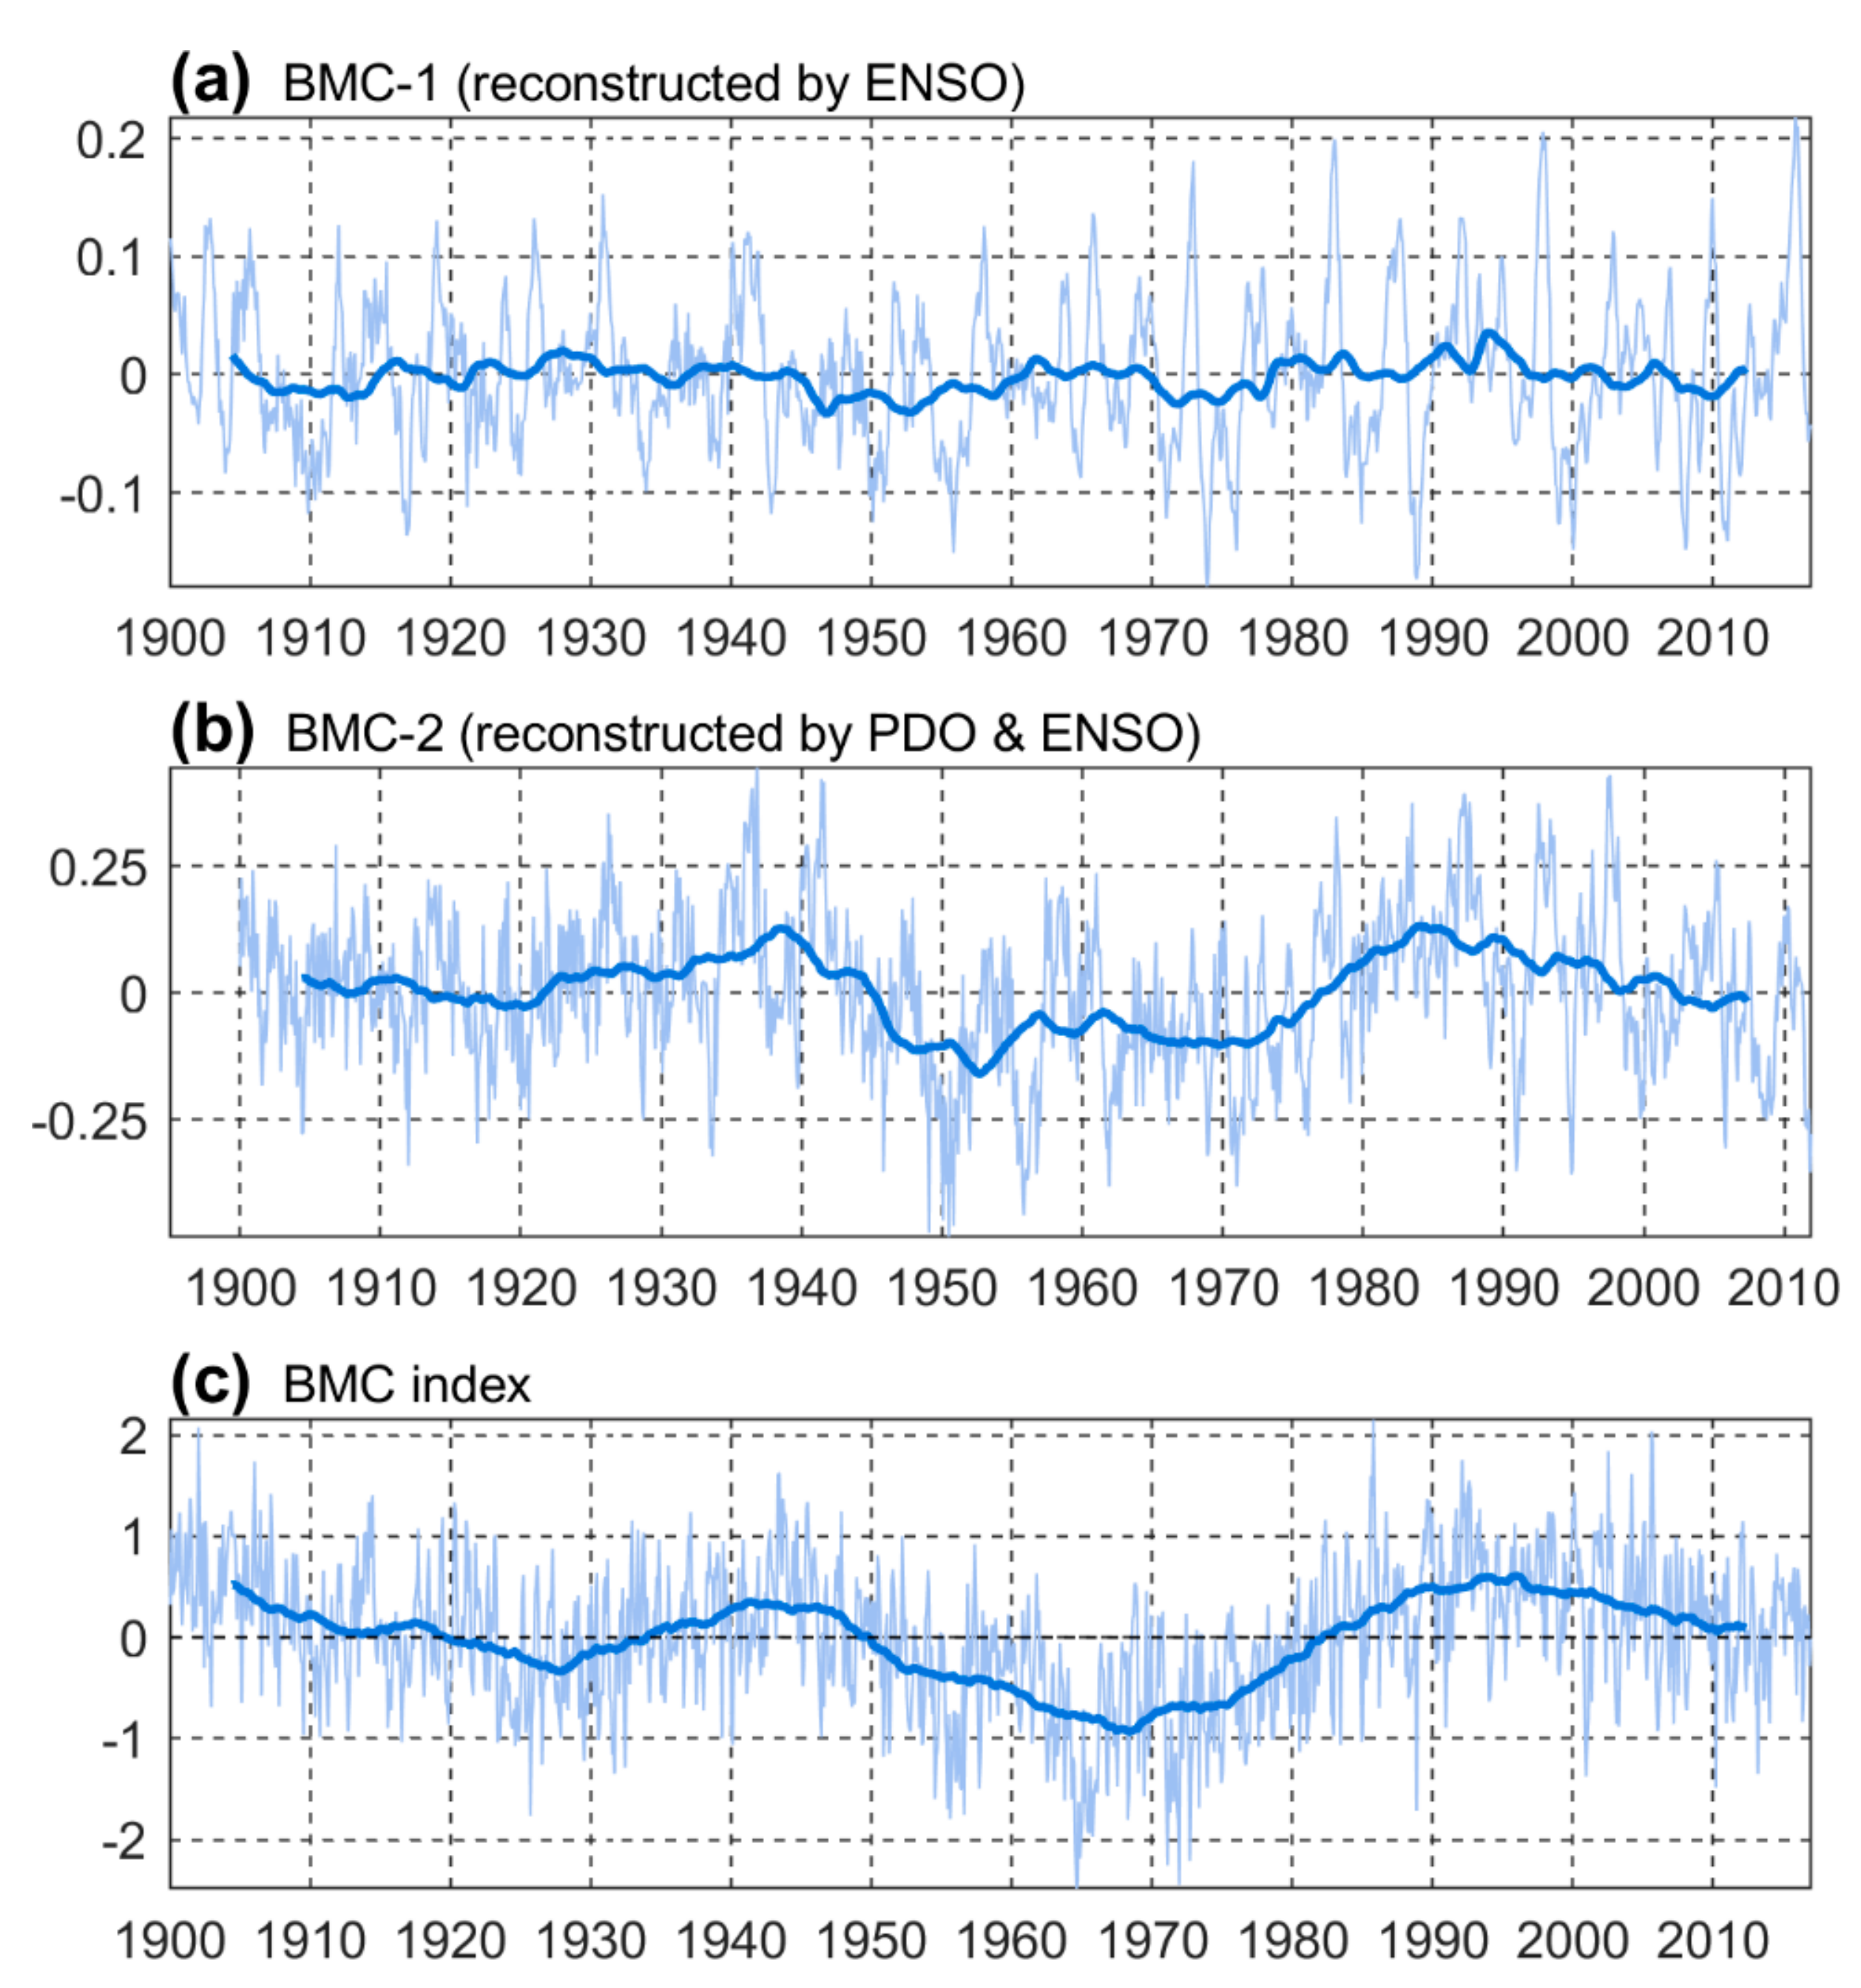
where the BMC is the time series of the SSTA over the BMC region, r represents the unexplained noise, the PDO data leading the BMC index of five-years was used here based on Figure 5. Applying the model to 1900–2016, the BMC-1 (reconstructed by ENSO) and BMC-2 (reconstructed by the PDO and ENSO) are shown in Figure 7. The original BMC index is similar to the reconstructed BMC-2 index rather than BMC-1, indicating that the SSTA variability in the BMC region is mainly associated with the PDO, followed by ENSO. On a decadal time scale (nine-year low-pass filter applied), the PDO contributes much more influence ( α = 0.76) on the BMC SST variability than that by the ENSO ( β = −0.01) (Figure 7b). In summary, our result suggested that the PDO is dominant for the decadal variabilities of the SSTA in the BMC region. On the other hand, the inter-annual influences of the PDO were amplified when both the PDO and ENSO are in a phase.

4. Conclusions

By analyzing the reconstructed SSTs in a 147-year period (1870–2016), this study showed a particularly warm and cold dipole-like pattern over the Southwest Atlantic, the BMC region. The warm and cold cycles were associated with the PDO’s inter-decadal regime shift. When the PDO is in the negative (positive) phase, the significant cooling (warming) in the BMC areas and Southeastern Pacific, but warming (cooling) in the Drake Passage and the Southwest Atlantic ACC had been observed. Interestingly, the changes in the SSTAs were enlarged when the ENSO and the PDO were in the same warm or cold phase. For instance, when both the PDO and the ENSO are positive, the degree of warming in the BMC region was more extreme than that of the PDO, and vice versa in the case of cooling.
The remote forcing of the PDO and ENSO in the western south Atlantic could be attributed to the atmospheric quasi-stationary Rossby Wave train [53,54]. The wave train was due to the tropical Pacific anomalous heating and rainfall, and played an important role in extending the Pacific climate anomalous features as the PDO and ENSO to the South Ocean and Atlantic [53,54]. For instance, Yuan [53] documented that the change of the Antarctic sea ice was associated with a teleconnection between the ENSO and the Antarctic Dipole. The wave train supported one of the factors to the teleconnection.
Our results suggested that (1) the decadal variability of the SST in the western south Atlantic had associated with the PDO regime shift, (2) changes in the SST of higher latitude oceans could be enhanced when the influence of the ENSO was considered along with the PDO, and (3) the BMC area might be used to observe the PDO–ENSO coupling effect in the future work.

Author Contributions

C.-P.L. designed the study. Y.-C.H. and Y.-L.W. analyzed the data and led the writing. All authors contributed to the writing and data interpretation. Contextualization, C.-R.W.

Funding

This research received no external funding.

Acknowledgments

Met Office Hadley Centre and NOAA are acknowledged for providing the invaluable data.

Conflicts of Interest

The authors declare no conflict of interest.

References

  1. Olbers, D.; Borowski, D.; VÖLker, C.; WÖLff, J.-O. The dynamical balance, transport and circulation of the Antarctic Circumpolar Current. Antarct. Sci. 2004, 16, 439–470. [Google Scholar] [CrossRef] [Green Version]
  2. Rintoul, S.; Hughes, C.; Olbers, D. The Antarctic circumpolar current system. In Ocean Circulation and Climate; Siedler, G., Church, J., Gould, J., Eds.; Academic Press: New York, NY, USA, 2001; pp. 271–302. [Google Scholar]
  3. Sloyan, B.M.; Rintoul, S.R. The Southern Ocean limb of the global deep overturning circulation. J. Phys. Oceanogr. 2001, 31, 143–173. [Google Scholar] [CrossRef]
  4. Swart, S.; Speich, S. An altimetry-based gravest empirical mode south of Africa: 2. Dynamic nature of the Antarctic Circumpolar Current fronts. J. Geophys. Res. Oceans 2010, 115. [Google Scholar] [CrossRef] [Green Version]
  5. Swart, S.; Speich, S.; Ansorge, I.J.; Lutjeharms, J.R.E. An altimetry-based gravest empirical mode south of Africa: 1. Development and validation. J. Geophys. Res. Oceans 2010, 115. [Google Scholar] [CrossRef] [Green Version]
  6. Billany, W.; Swart, S.; Hermes, J.; Reason, C. Variability of the Southern Ocean fronts at the Greenwich Meridian. J. Mar. Syst. 2010, 82, 304–310. [Google Scholar] [CrossRef]
  7. Peterson, R.G. The boundary currents in the western Argentine Basin. Deep Sea Res. Part A Oceanogr. Res. Pap. 1992, 39, 623–644. [Google Scholar] [CrossRef]
  8. Rivas, A.L. Spatial and temporal variability of satellite-derived sea surface temperature in the southwestern Atlantic Ocean. Cont. Shelf Res. 2010, 30, 752–760. [Google Scholar] [CrossRef]
  9. Piola, A.R.; Gordon, A.L. Intermediate waters in the southwest South Atlantic. Deep Sea Res. Part A Oceanogr. Res. Pap. 1989, 36, 1–16. [Google Scholar] [CrossRef]
  10. Piola, A.; Matano, R.; Steele, J.; Thorpe, S.; Turekian, K. Brazil and Falklands (Malvinas) Currents; Academic Press: London, UK, 2001. [Google Scholar]
  11. Chelton, D.B.; Schlax, M.G.; Witter, D.L.; Richman, J.G. Geosat altimeter observations of the surface circulation of the Southern Ocean. J. Geophys. Res. Oceans 1990, 95, 17877–17903. [Google Scholar] [CrossRef]
  12. Hsu, Y.-C.; Lee, C.-P.; Wang, Y.-L.; Wu, C.-R.; Lui, H.-K. Leading El-Niño SST Oscillations around the Southern South American Continent. Sustainability 2018, 10, 1783. [Google Scholar] [CrossRef]
  13. Limpasuvan, V.; Hartmann, D.L. Eddies and the annular modes of climate variability. Geophys. Res. Lett. 1999, 26, 3133–3136. [Google Scholar] [CrossRef] [Green Version]
  14. Meredith, M.P.; Hogg, A.M. Circumpolar response of Southern Ocean eddy activity to a change in the Southern Annular Mode. Geophys. Res. Lett. 2006, 33. [Google Scholar] [CrossRef]
  15. Mo, K.C.; Higgins, R.W. The Pacific–South American modes and tropical convection during the southern hemisphere winter. Mon. Weather Rev. 1998, 126, 1581–1596. [Google Scholar] [CrossRef]
  16. Yuan, X.; Martinson, D.G. The Antarctic dipole and its predictability. Geophys. Res. Lett. 2001, 28, 3609–3612. [Google Scholar] [CrossRef] [Green Version]
  17. Verdy, A.; Marshall, J.; Czaja, A. Sea surface temperature variability along the path of the Antarctic Circumpolar Current. J. Phys. Oceanogr. 2006, 36, 1317–1331. [Google Scholar] [CrossRef]
  18. Venegas, S.A.; Mysak, L.A.; Straub, D.N. Evidence for interannual and interdecadal climate variability in the South Atlantic. Geophys. Res. Lett. 1996, 23, 2673–2676. [Google Scholar] [CrossRef]
  19. Venegas, S.; Mysak, L.; Straub, D. Atmosphere–ocean coupled variability in the South Atlantic. J. Clim. 1997, 10, 2904–2920. [Google Scholar] [CrossRef]
  20. Venegas, S.A.; Mysak, L.A.; Straub, D.N. An interdecadal climate cycle in the South Atlantic and its links to other ocean basins. J. Geophys. Res. Oceans 1998, 103, 24723–24736. [Google Scholar] [CrossRef]
  21. Reason, C. Multidecadal climate variability in the subtropics/mid-latitudes of the Southern Hemisphere oceans. Tellus A Dyn. Meteorol. Oceanogr. 2000, 52, 203–223. [Google Scholar] [CrossRef] [Green Version]
  22. Palastanga, V.; Vera, C.S.; Piola, A.R. On the leading modes of sea surface temperature variability in the South Atlantic Ocean. Clivar Exch. 2002, 7, 12–15. [Google Scholar]
  23. Reason, C.; Rouault, M.; Melice, J.-L.; Jagadheesha, D. Interannual winter rainfall variability in SW South Africa and large scale ocean–atmosphere interactions. Meteorol. Atmos. Phys. 2002, 80, 19–29. [Google Scholar] [CrossRef]
  24. Wainer, I.; Venegas, S.A. South Atlantic multidecadal variability in the climate system model. J. Clim. 2002, 15, 1408–1420. [Google Scholar] [CrossRef]
  25. Colberg, F.; Reason, C.; Rodgers, K. South Atlantic response to El Niño–Southern Oscillation induced climate variability in an ocean general circulation model. J. Geophys. Res. Oceans 2004, 109. [Google Scholar] [CrossRef]
  26. de Souza, E.B.; Kayano, M.T.; Tota, J.; Pezzi, L.; Fisch, G.; Nobre, C. On the influences of the El Niño, La niña and Atlantic Dipole Paterni on the Amazonian Rainfall during 1960-1998. Acta Amaz. 2000, 30, 305–318. [Google Scholar] [CrossRef]
  27. Giannini, A.; Kushnir, Y.; Cane, M.A. Interannual variability of Caribbean rainfall, ENSO, and the Atlantic Ocean. J. Clim. 2000, 13, 297–311. [Google Scholar] [CrossRef]
  28. Montecinos, A.; Díaz, A.; Aceituno, P. Seasonal diagnostic and predictability of rainfall in subtropical South America based on tropical Pacific SST. J. Clim. 2000, 13, 746–758. [Google Scholar] [CrossRef]
  29. Cazes-Boezio, G.; Robertson, A.W.; Mechoso, C.R. Seasonal dependence of ENSO teleconnections over South America and relationships with precipitation in Uruguay. J. Clim. 2003, 16, 1159–1176. [Google Scholar] [CrossRef]
  30. Andreoli, R.V.; Kayano, M.T. ENSO-related rainfall anomalies in South America and associated circulation features during warm and cold Pacific decadal oscillation regimes. Int. J. Climatol. A J. R. Meteorol. Soc. 2005, 25, 2017–2030. [Google Scholar] [CrossRef]
  31. Andreoli, R.V.; Kayano, M.T. Tropical Pacific and South Atlantic effects on rainfall variability over Northeast Brazil. Int. J. Climatol. A J. R. Meteorol. Soc. 2006, 26, 1895–1912. [Google Scholar] [CrossRef]
  32. Kayano, M.T.; Andreoli, R.V.; Ferreira de Souza, R.A. Relations between ENSO and the South Atlantic SST modes and their effects on the South American rainfall. Int. J. Climatol. 2013, 33, 2008–2023. [Google Scholar] [CrossRef]
  33. Tedeschi, R.G.; Collins, M. The influence of ENSO on South American precipitation during austral summer and autumn in observations and models. Int. J. Climatol. 2016, 36, 618–635. [Google Scholar] [CrossRef]
  34. Gutzler, D.S.; Kann, D.M.; Thornbrugh, C. Modulation of ENSO-based long-lead outlooks of southwestern US winter precipitation by the Pacific decadal oscillation. Weather Forecast. 2002, 17, 1163–1172. [Google Scholar] [CrossRef]
  35. Krishnan, R.; Sugi, M. Pacific decadal oscillation and variability of the Indian summer monsoon rainfall. Clim. Dyn. 2003, 21, 233–242. [Google Scholar] [CrossRef]
  36. Brown, D.P.; Comrie, A.C. A winter precipitation ‘dipole’in the western United States associated with multidecadal ENSO variability. Geophys. Res. Lett. 2004, 31. [Google Scholar] [CrossRef]
  37. Chelliah, M.; Bell, G.D. Tropical multidecadal and interannual climate variability in the NCEP–NCAR reanalysis. J. Clim. 2004, 17, 1777–1803. [Google Scholar] [CrossRef]
  38. Kayano, M.T.; Andreoli, R.V. Relations of South American summer rainfall interannual variations with the Pacific Decadal Oscillation. Int. J. Climatol. A J. R. Meteorol. Soc. 2007, 27, 531–540. [Google Scholar] [CrossRef]
  39. Mantua, N.J.; Hare, S.R.; Zhang, Y.; Wallace, J.M.; Francis, R.C. A Pacific interdecadal climate oscillation with impacts on salmon production. Bull. Amer. Meteor. Soc. 1997, 78, 1069–1079. [Google Scholar] [CrossRef]
  40. Zhou, J.; Lau, K.M. Principal modes of interannual and decadal variability of summer rainfall over South America. Int. J. Climatol. A J. R. Meteorol. Soc. 2001, 21, 1623–1644. [Google Scholar] [CrossRef]
  41. Kayano, M.T.; de Oliveira, C.P.; Andreoli, R.V. Interannual relations between South American rainfall and tropical sea surface temperature anomalies before and after 1976. Int. J. Climatol. 2009, 29, 1439–1448. [Google Scholar] [CrossRef]
  42. Jacques-Coper, M.; Brönnimann, S. Summer temperature in the eastern part of southern South America: Its variability in the twentieth century and a teleconnection with Oceania. Clim. Dyn. 2014, 43, 2111–2130. [Google Scholar] [CrossRef]
  43. Lentini, C.A.; Campos, E.J.; Podestá, G.G. The annual cycle of satellite derived sea surface temperature on the western South Atlantic shelf. Rev. Bras. Oceanogr. 2000, 48, 93–105. [Google Scholar] [CrossRef] [Green Version]
  44. Rayner, N.; Parker, D.E.; Horton, E.; Folland, C.; Alexander, L.; Rowell, D.; Kent, E.; Kaplan, A. Global analyses of sea surface temperature, sea ice, and night marine air temperature since the late nineteenth century. J. Geophys. Res. Atmos. 2003, 108. [Google Scholar] [CrossRef]
  45. Kennedy, J.; Rayner, N.; Smith, R.; Parker, D.; Saunby, M. Reassessing biases and other uncertainties in sea surface temperature observations measured in situ since 1850: 1. Measurement and sampling uncertainties. J. Geophys. Res. Atmos. 2011, 116. [Google Scholar] [CrossRef] [Green Version]
  46. Björnsson, H.; Venegas, S. A manual for EOF and SVD analyses of climatic data. CCGCR Rep. 1997, 97, 112–134. [Google Scholar]
  47. Butterworth, S. In the theory of filter amplifires. Exp. Wirel. Wirel. Eng. 1930, 7, 536–541. [Google Scholar]
  48. North, G.R.; Bell, T.L.; Cahalan, R.F.; Moeng, F.J. Sampling errors in the estimation of empirical orthogonal functions. Mon. Weather Rev. 1982, 110, 699–706. [Google Scholar] [CrossRef]
  49. Minobe, S. Spatio-temporal structure of the pentadecadal variability over the North Pacific. Prog. Oceanogr. 2000, 47, 381–408. [Google Scholar] [CrossRef] [Green Version]
  50. Kayano, M.T.; Andreoli, R.V.; Souza, R.A.F.d. El Niño–Southern Oscillation related teleconnections over South America under distinct Atlantic Multidecadal Oscillation and Pacific Interdecadal Oscillation backgrounds: La Niña. Int. J. Climatol. 2019, 39, 1359–1372. [Google Scholar] [CrossRef]
  51. Liu, Z. Dynamics of Interdecadal Climate Variability: A Historical Perspective. J. Clim. 2012, 25, 1963–1995. [Google Scholar] [CrossRef]
  52. Newman, M.; Alexander, M.A.; Ault, T.R.; Cobb, K.M.; Deser, C.; Lorenzo, E.D.; Mantua, N.J.; Miller, A.J.; Minobe, S.; Nakamura, H.; et al. The Pacific Decadal Oscillation, Revisited. J. Clim. 2016, 29, 4399–4427. [Google Scholar] [CrossRef] [Green Version]
  53. Yuan, X. ENSO-related impacts on Antarctic sea ice: A synthesis of phenomenon and mechanisms. Antarct. Sci. 2004, 16, 415–425. [Google Scholar] [CrossRef]
  54. Trenberth, K.E.; Fasullo, J.T.; Branstator, G.; Phillips, A.S. Seasonal aspects of the recent pause in surface warming. Nat. Clim. Chang. 2014, 4, 911. [Google Scholar] [CrossRef]
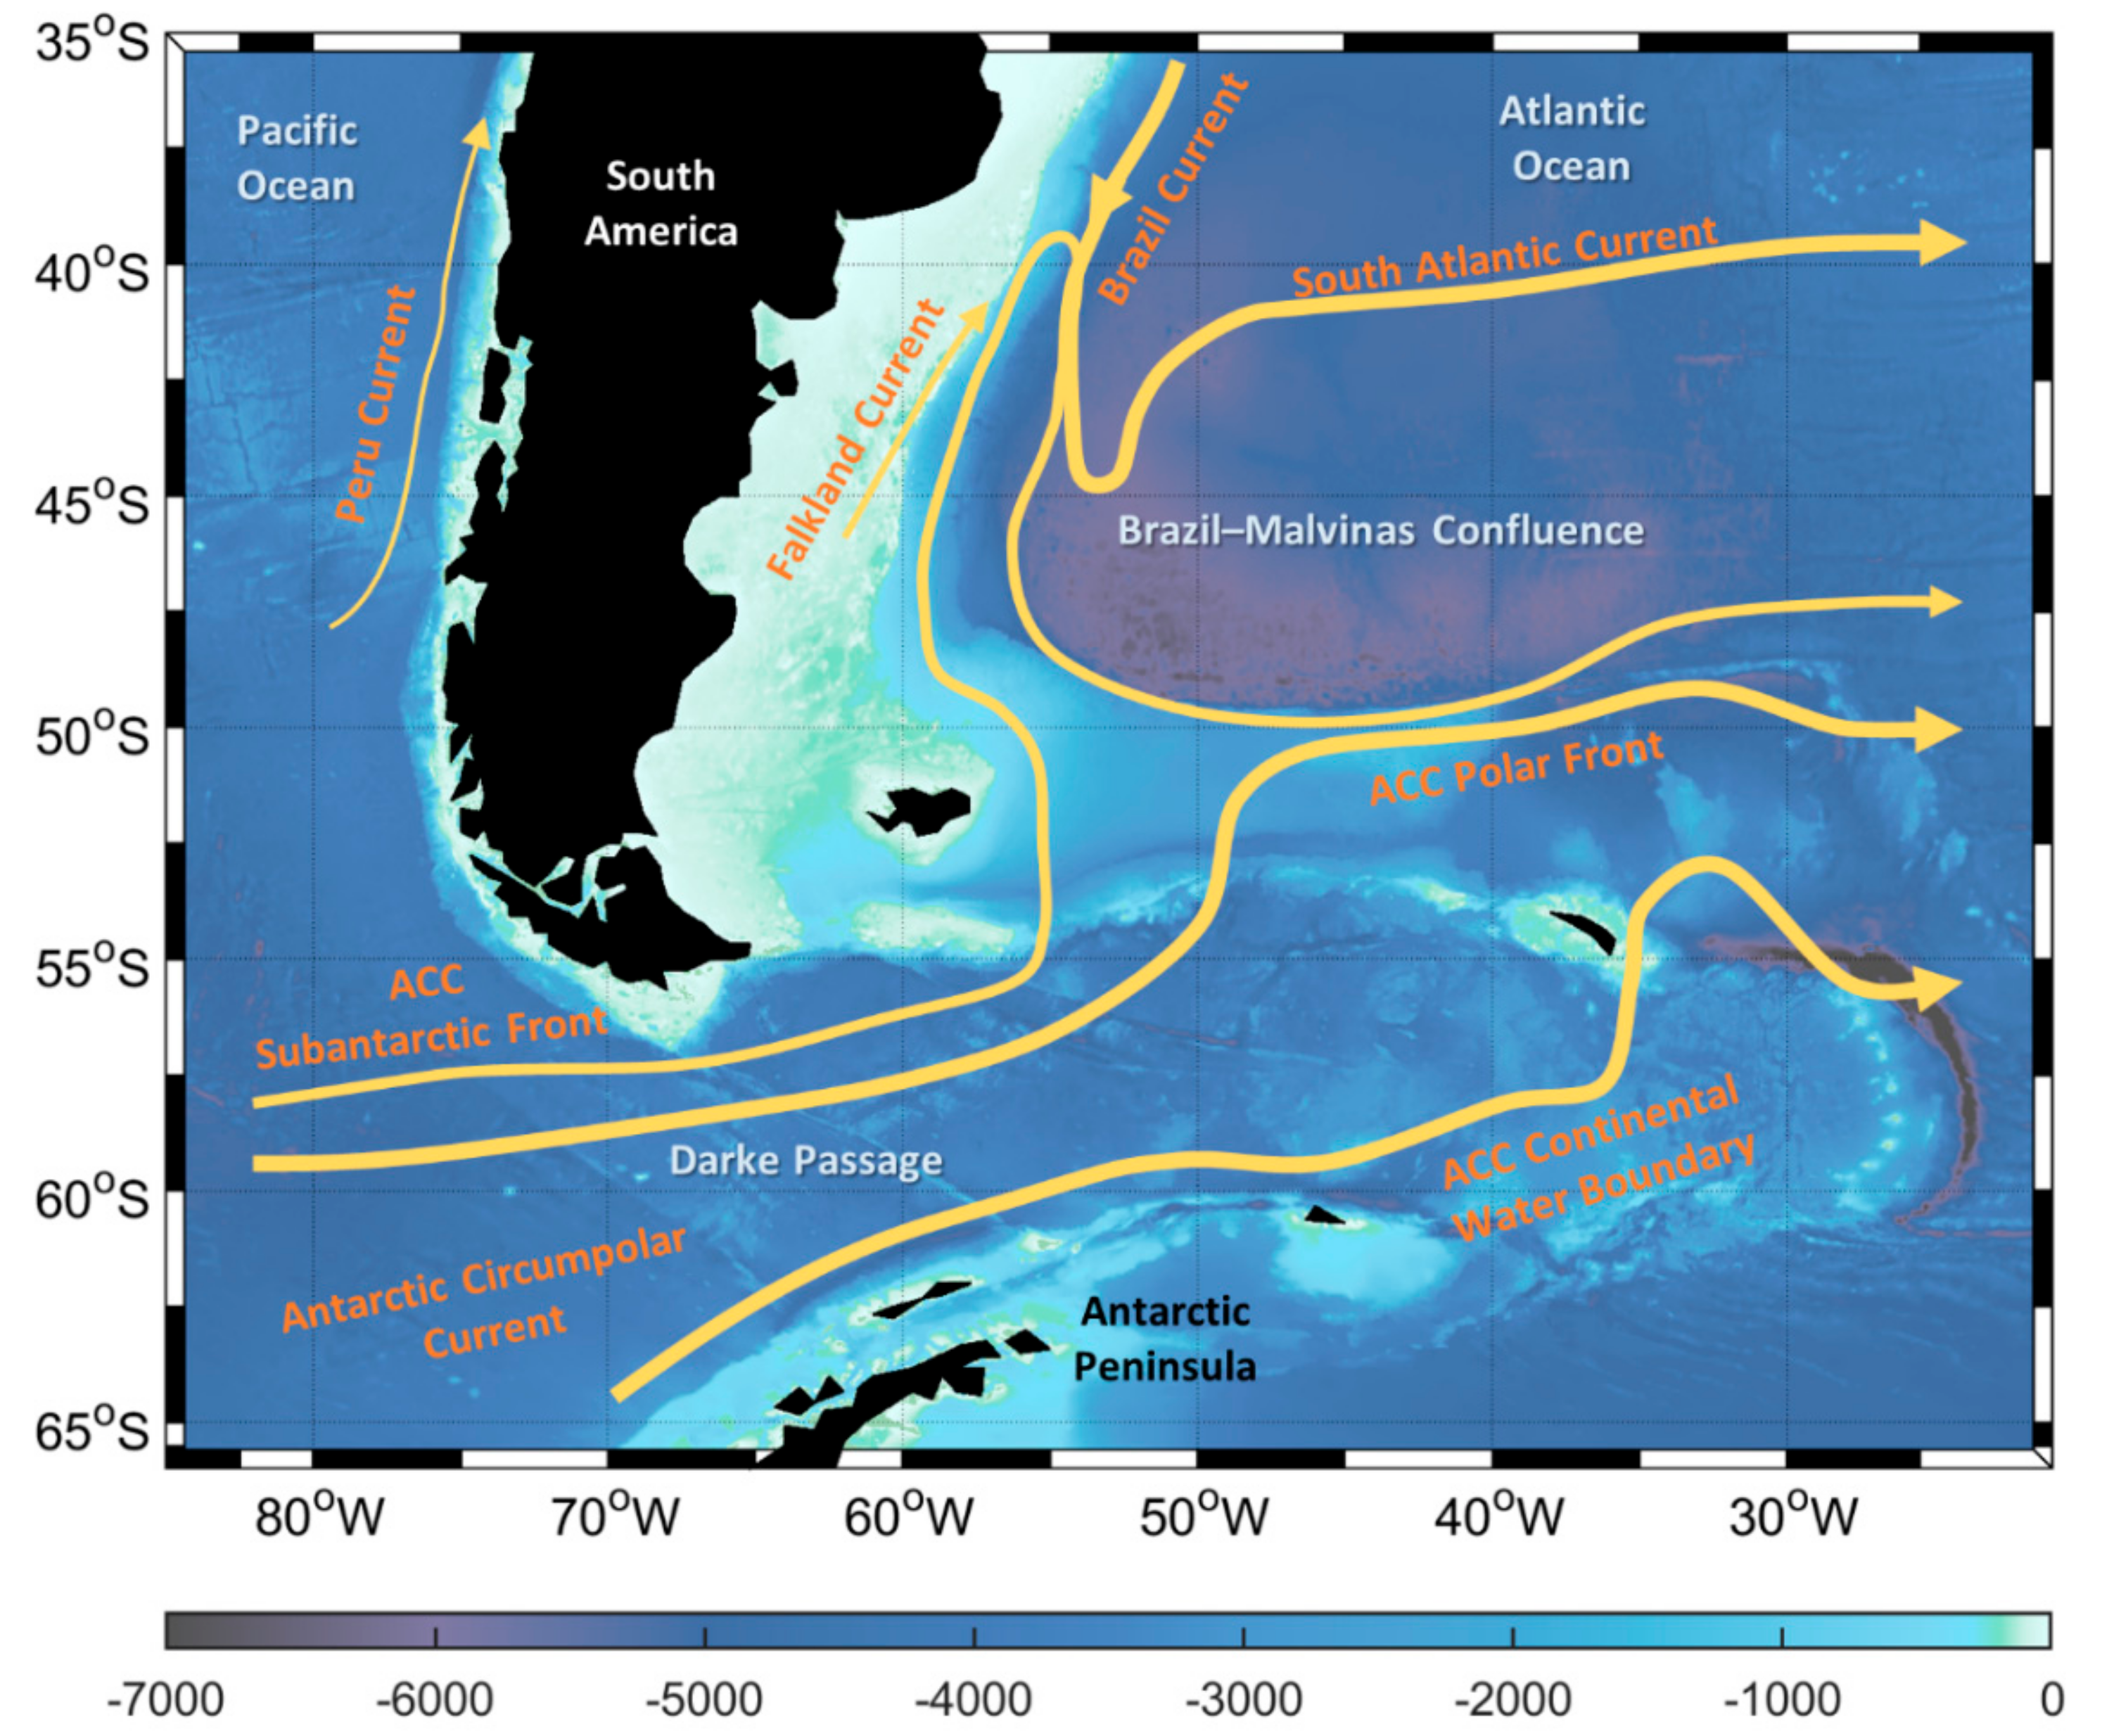
Figure 1. The study area, topography (shading), and ocean currents (arrow) are shown. After Hsu et al. [12].
Sustainability 11 04853 g001
Figure 2. The time series and spatial patterns of the first (a,b) and second (c,d) Empirical Orthogonal Function (EOF) modes of monthly sea surface temperature anomalies (SSTA) over the 84.5° W~20.5° W and 64.5° S~38.5° S during 1870–2016. White color indicates the incomplete data. The 108-month low-pass filter was applied before processing the EOF analysis. The pink box indicates the Brazil–Malvinas Confluence (BMC) region.
Sustainability 11 04853 g002
Figure 3. The spectrum of the time series of the first EOF mode. Statistical significance at 99% confidence level (dash line) was shown.
Sustainability 11 04853 g003
Figure 4. (a) SSTA (with a one-year low-pass filtering) over the Southwest Atlantic Ocean along 41.5° S. (b) The Pacific Decadal Oscillation (PDO) index with a nine-year low-pass filtering. (c) The Niño 3.4 index with a three-year low-pass filtering.
Sustainability 11 04853 g004
Figure 5. Cross-correlation between the PDO and time series of the first mode. Negative year indicates the PDO leading mode 1 (a) and BMC index (b).
Sustainability 11 04853 g005
Figure 6. The composite of the detrend SSTA: (a) PDO warm phase (1977–1998), (b) PDO cold phase (1950–1976), (c) positive Niño 3.4 during the PDO warm phase, (d) negative Niño 3.4 during the PDO cold phase, (e) negative Niño 3.4 during the PDO warm phase, (f) positive Niño 3.4 during the PDO cold phase (white color indicates the incomplete data).
Sustainability 11 04853 g006
Figure 7. (a) The BMC index reconstructed based on the Niño 3.4 index. (b) Same as (a), but based on the PDO (leading five-year) and Niño 3.4 indices. (c) Time series of the SSTA over the BMC region. Monthly (thin curve) and low-pass filtered (nine-year, thick curve) data are shown.
Sustainability 11 04853 g007