Research on Economic Operation Strategy of CHP Microgrid Considering Renewable Energy Sources and Integrated Energy Demand Response

Abstract
:1. Introduction
- (1)
- Considering system operation cost, carbon dioxide emissions cost, as well as system flexibility in the objective function.
- (2)
- Based on the fuzzy C-means (FCM) clustering method, the number of historical scenarios of wind power and solar energy output can be reasonably reduced to a fixed value. Then, a novel clustering evaluation method named CCQ is proposed to determine the number of best scenario categories, which can reduce the uncertainty of renewable energy output compared with previous literature methods.
- (3)
- A new demand side management method called integrated energy demand response is employed. Compared with a single electrical or heat load demand response method, the flexibility of the CHP microgrid system is improved, and the system operation cost is reduced significantly.
- (4)
- The operation mode of the CHP microgrid and the behavior of the system operator in different situations are discussed, and different operational strategies are put forward in the light of the interests of system operators and environmental benefits.
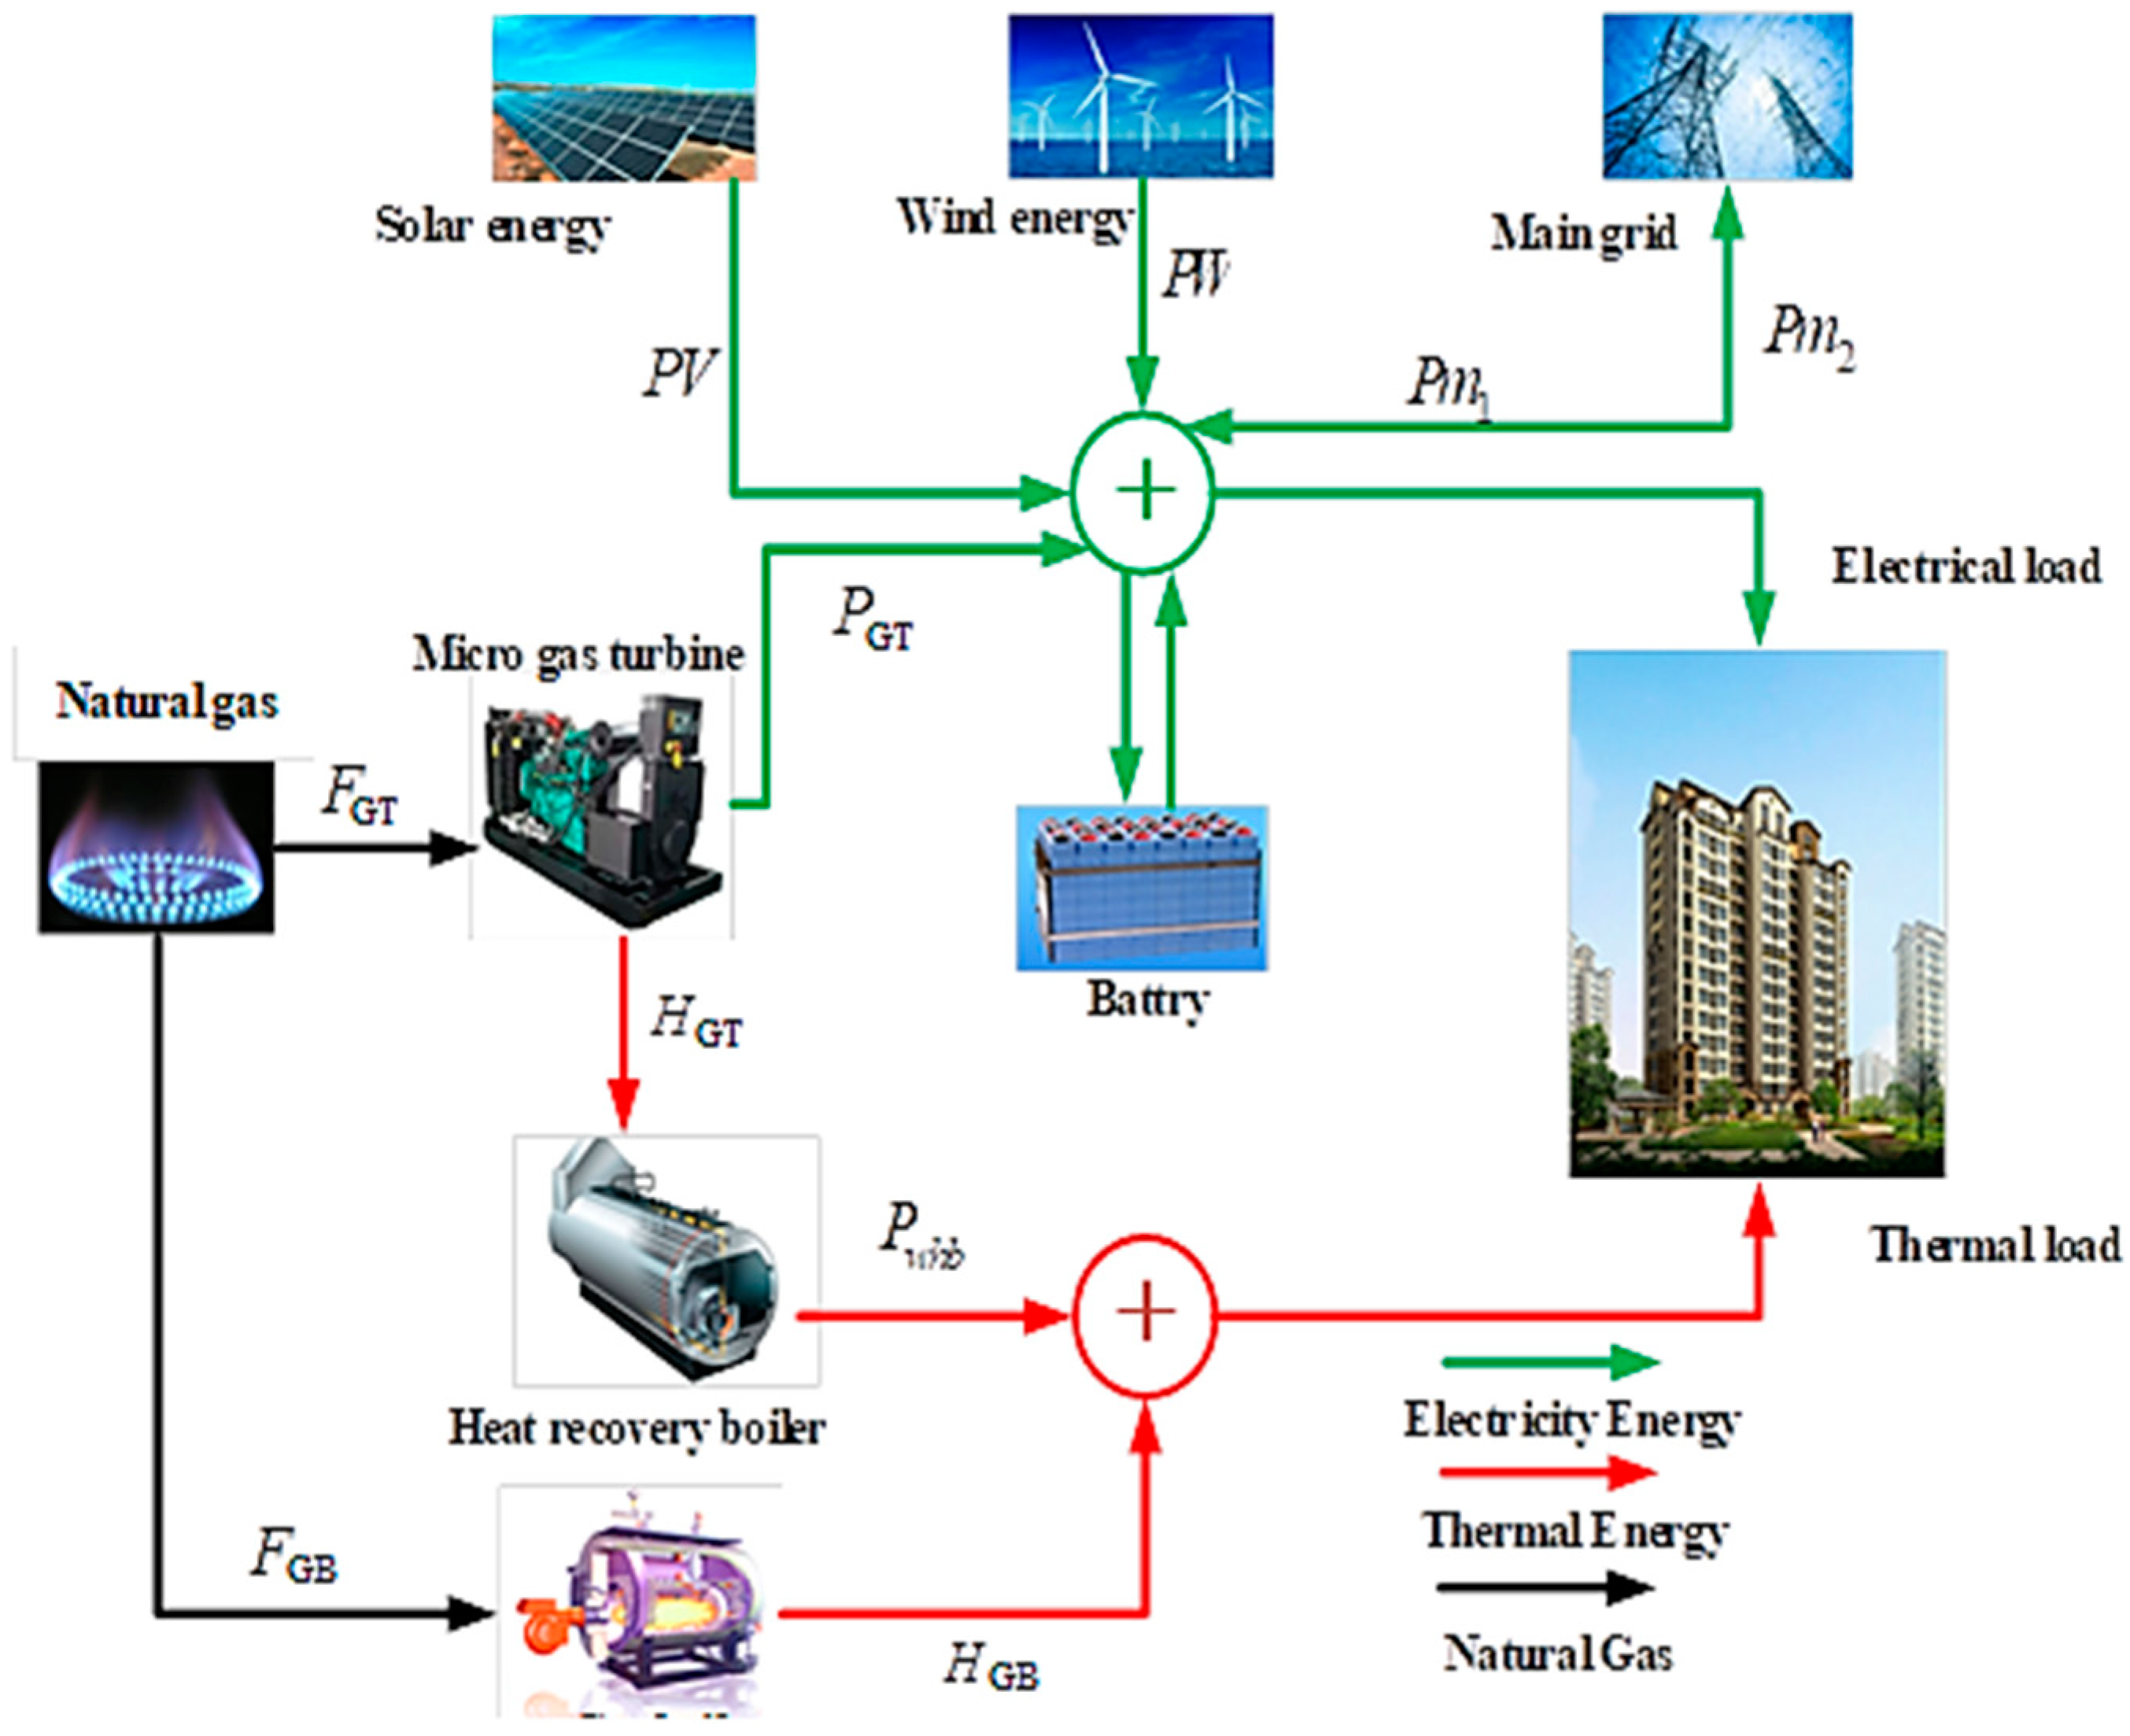
2. CHP Microgrid Structure Description and Mathematical Modelling
2.1. CHP System Composition and Structure
2.2. Mathematical Modeling
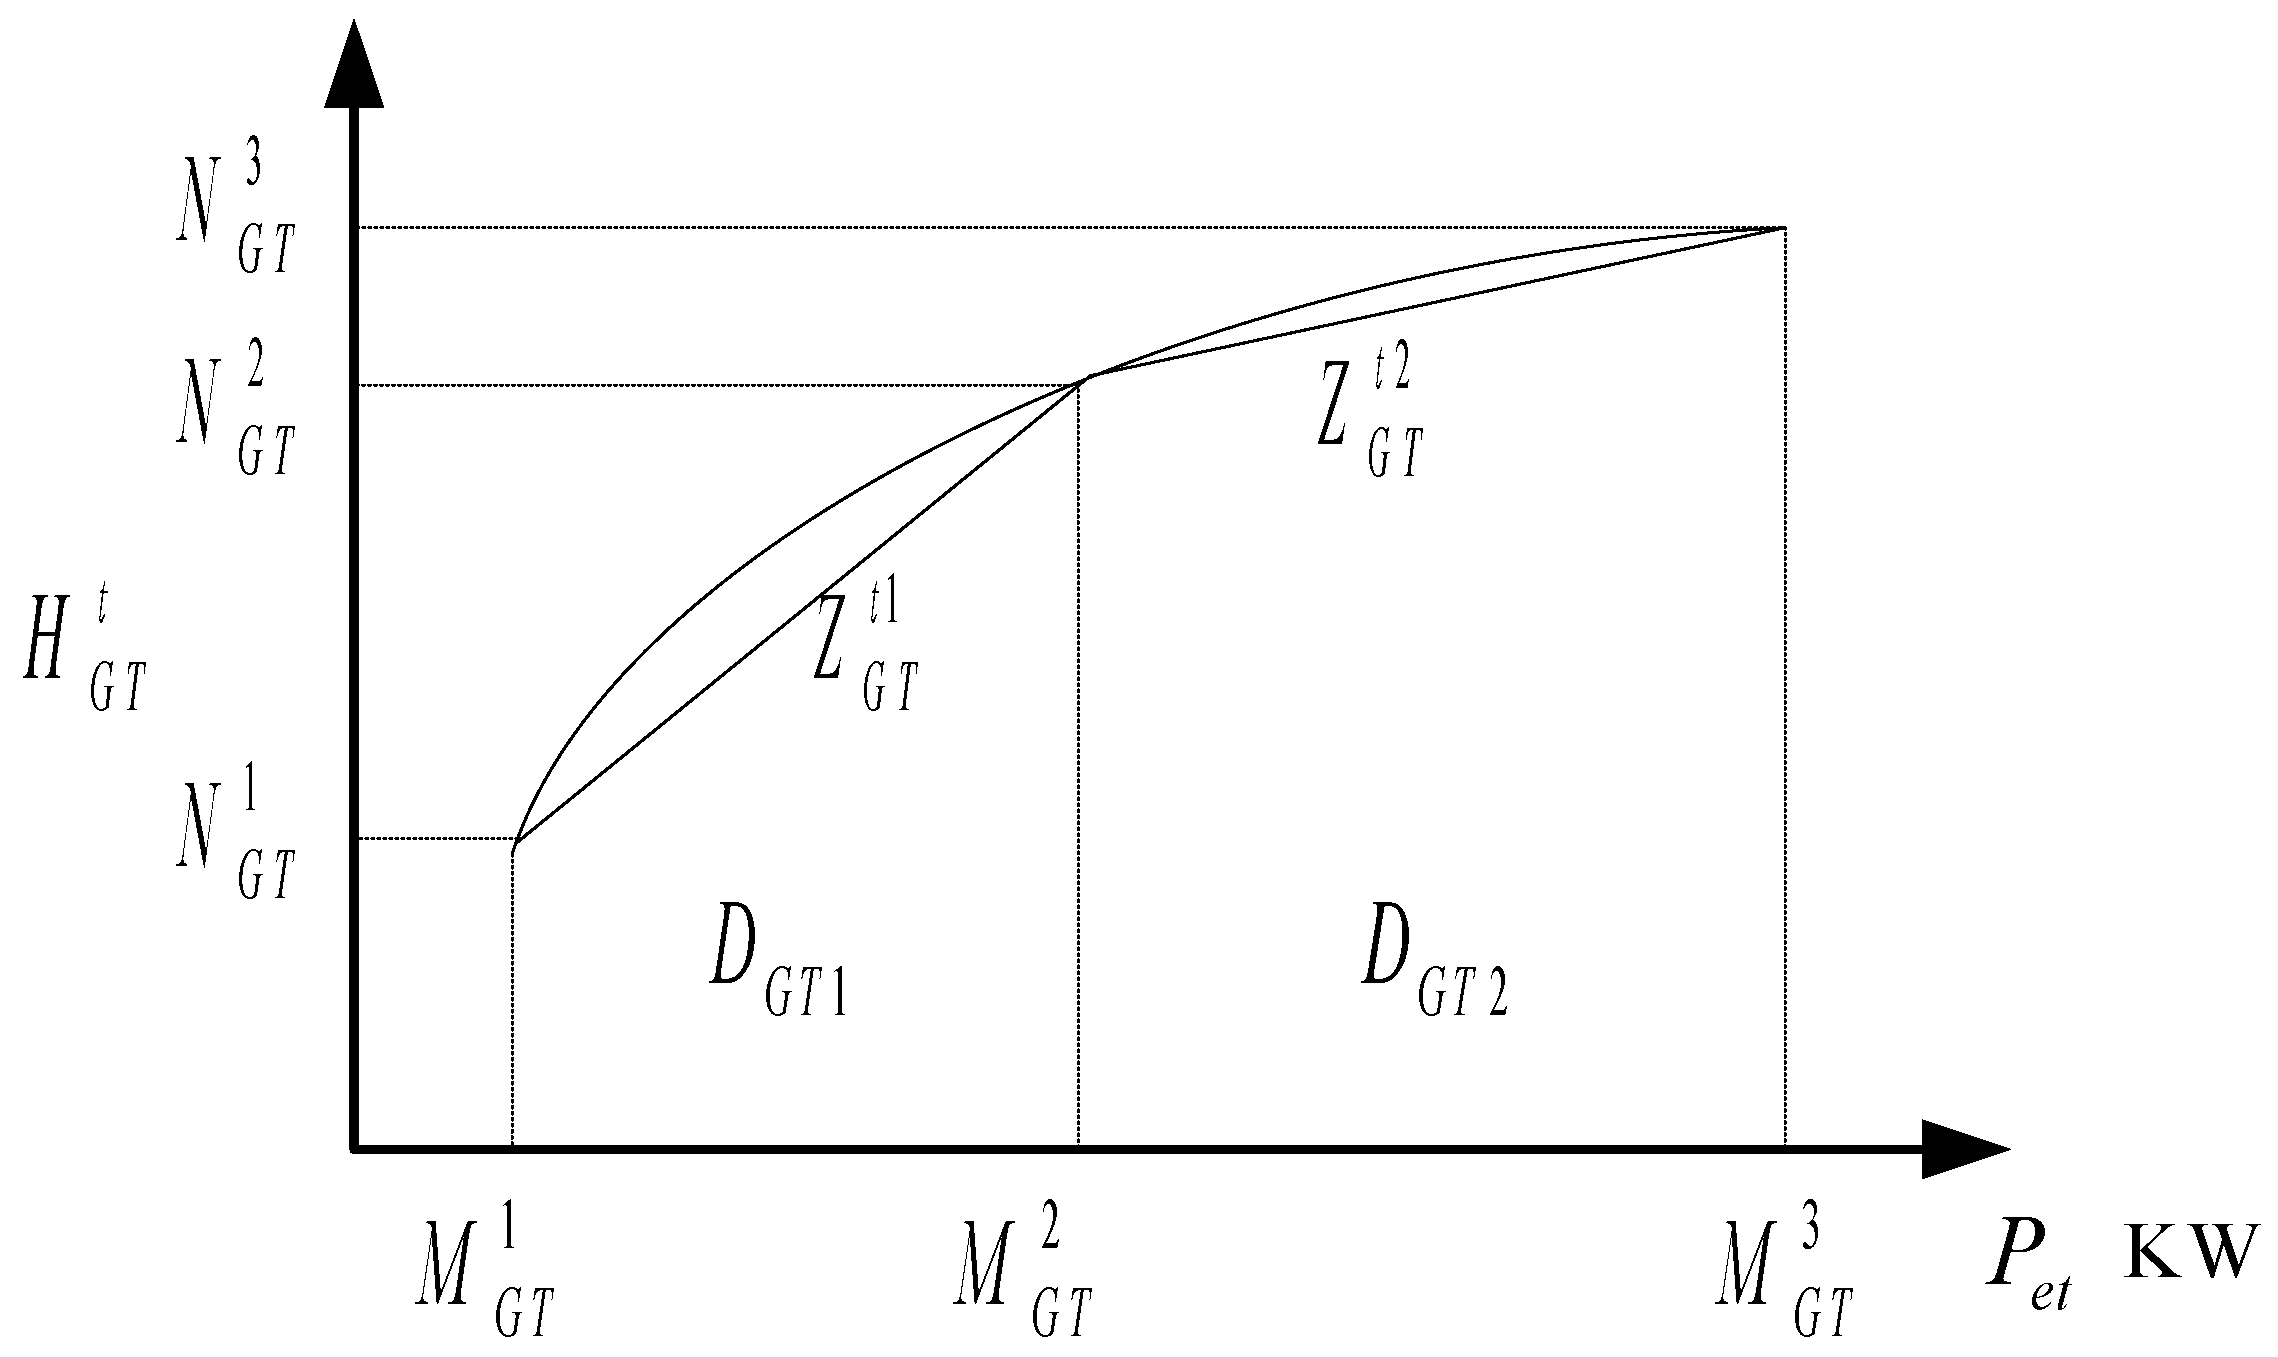
2.2.1. Micro Gas Turbine
2.2.2. Gas Boiler
2.2.3. Waste Heat Boiler
2.2.4. Exchange Power Between the Main Grid and the CHP Microgrid
2.2.5. Battery
2.2.6. Integrated Energy Demand Response Program
2.2.7. Electric Energy
2.2.8. Thermal Energy
3. CHP Microgrid Optimization Scheduling Strategy
3.1. Objective Function
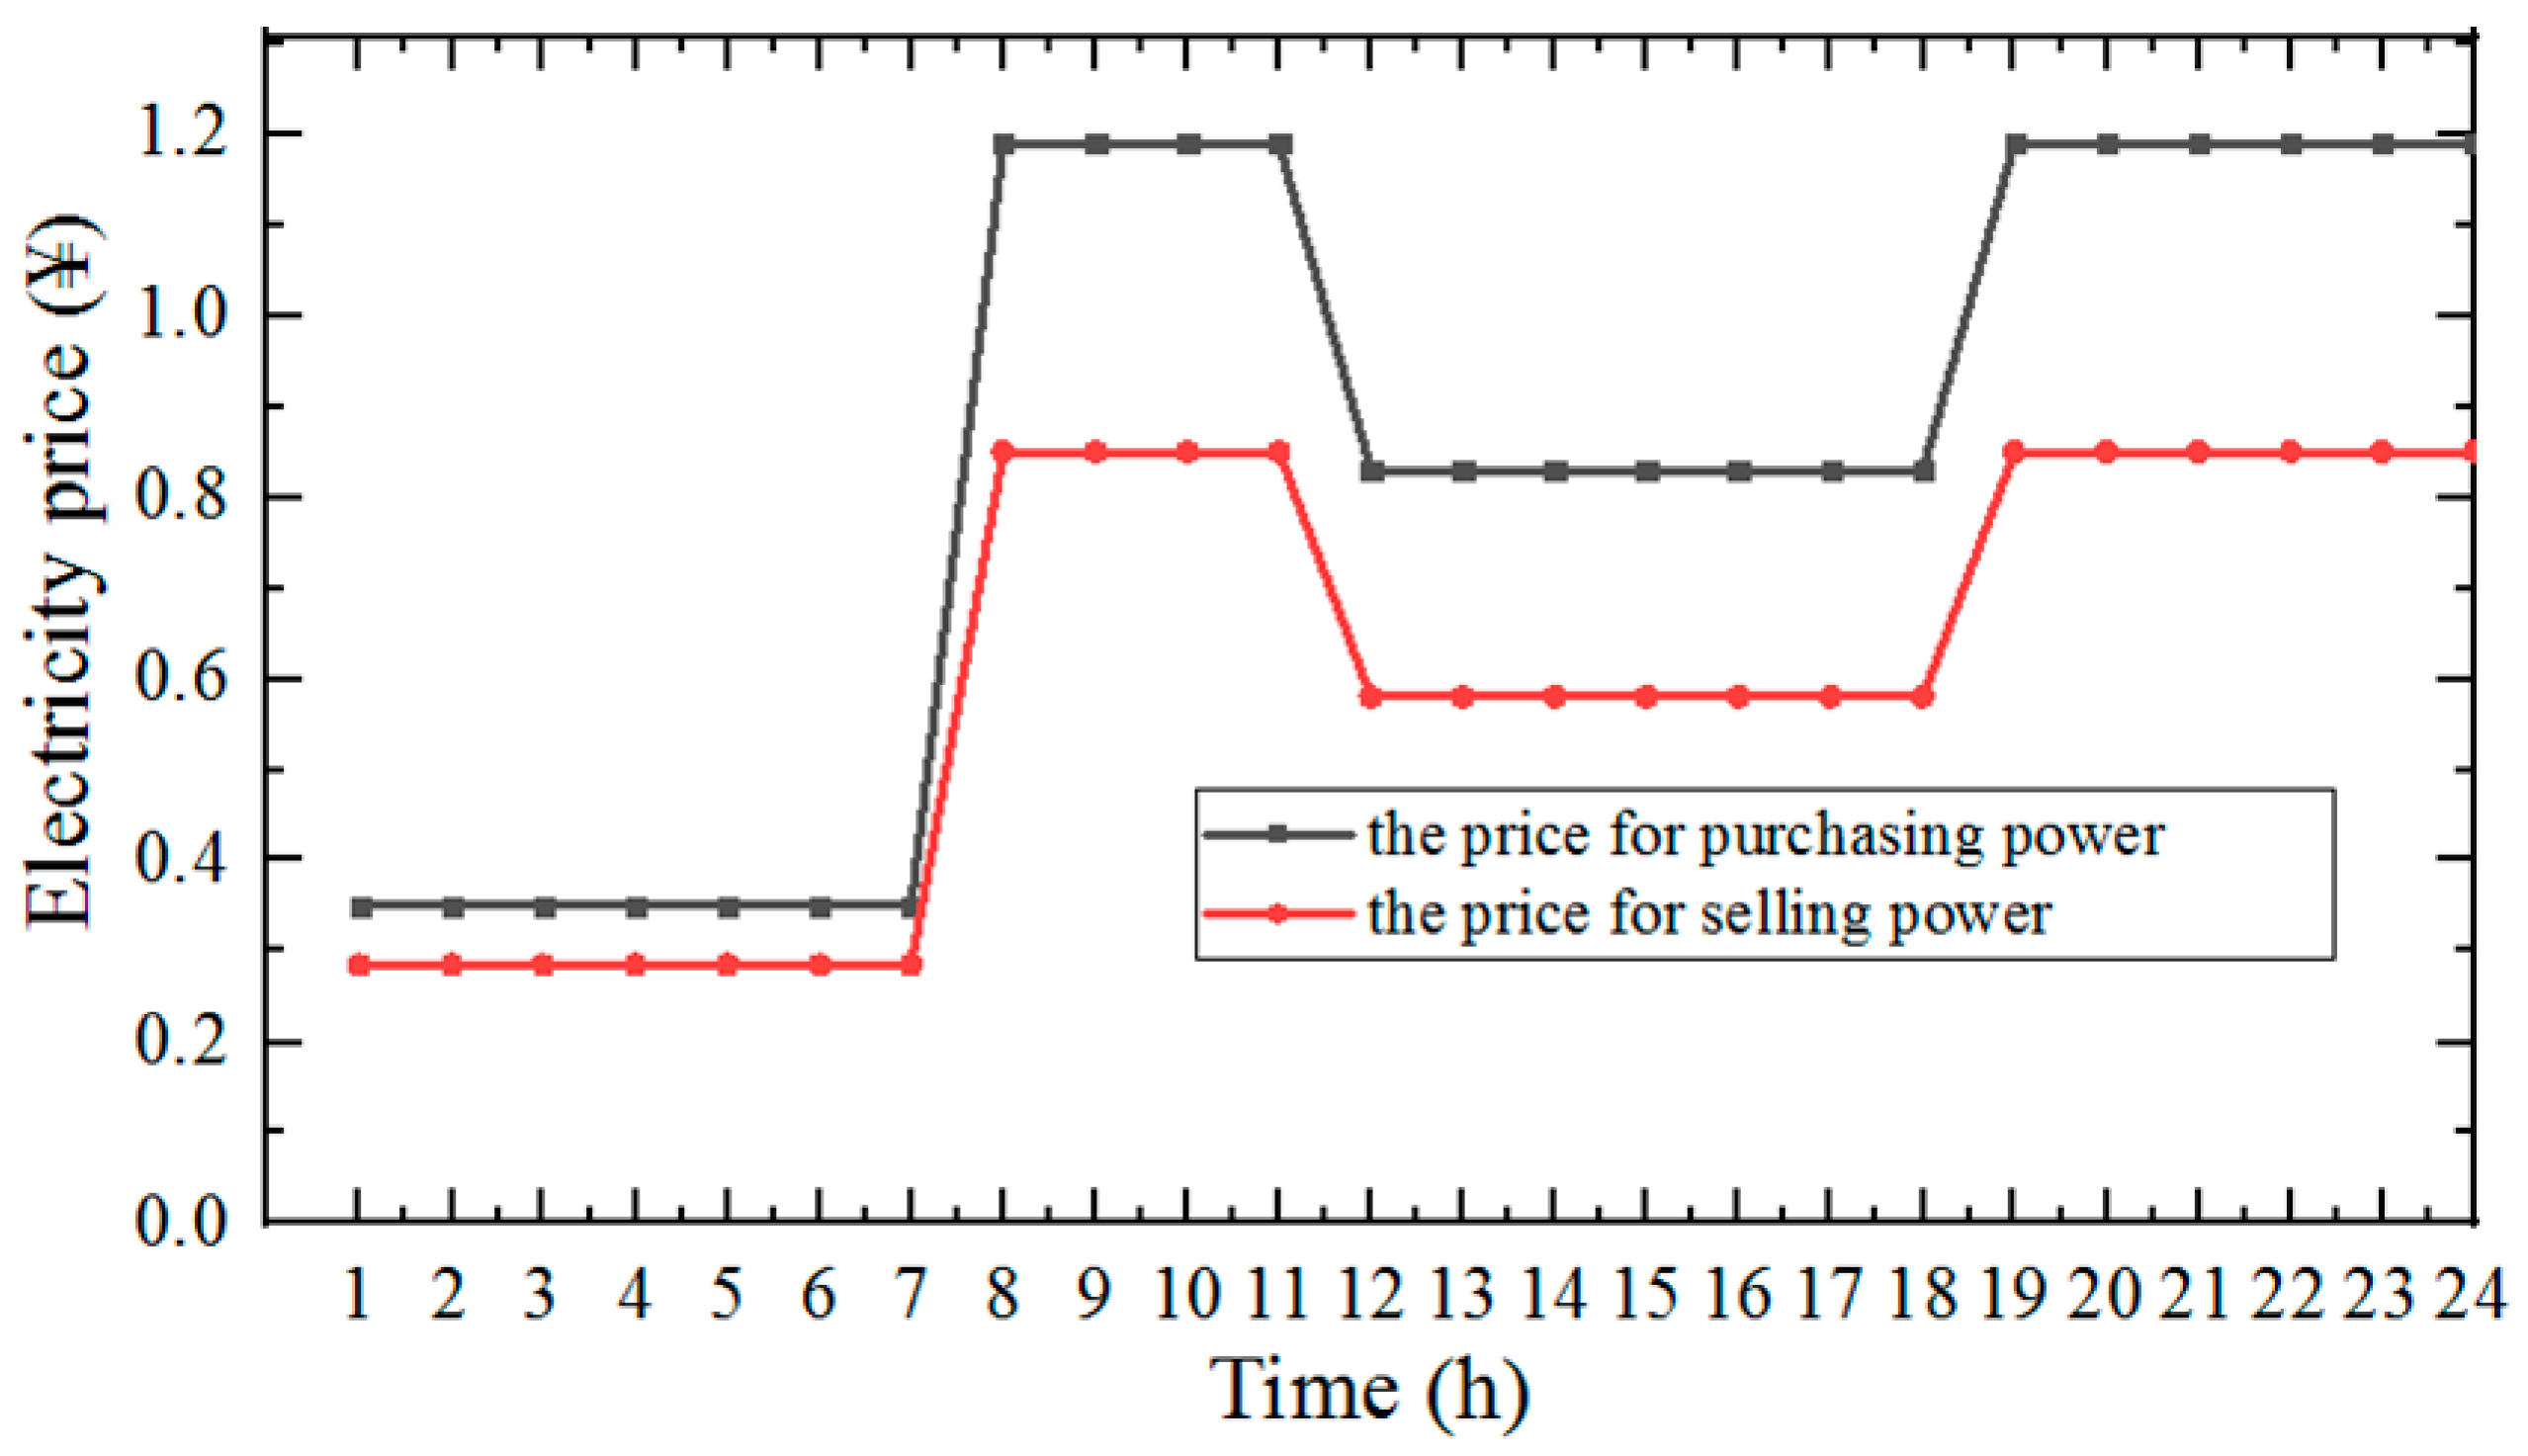
3.1.1. The Cost of Exchange Power between the Main Network and the CHP Microgrid
3.1.2. Natural Gas Consumption Cost
3.1.3. The Maintenance Cost of Each Unit
3.1.4. Carbon Dioxide Emission Cost
3.1.5. Integrated Energy Demand Response Compensation Cost
3.2. CHP Microgrid System Constraints
- Electrical energy balance constraint
- Thermal energy balance constraint
- The technical constraints of the units.
3.3. RESs Uncertainty Sets
3.3.1. FCM Clustering Method
3.3.2. CCQ Evaluation Method
4. Case Study
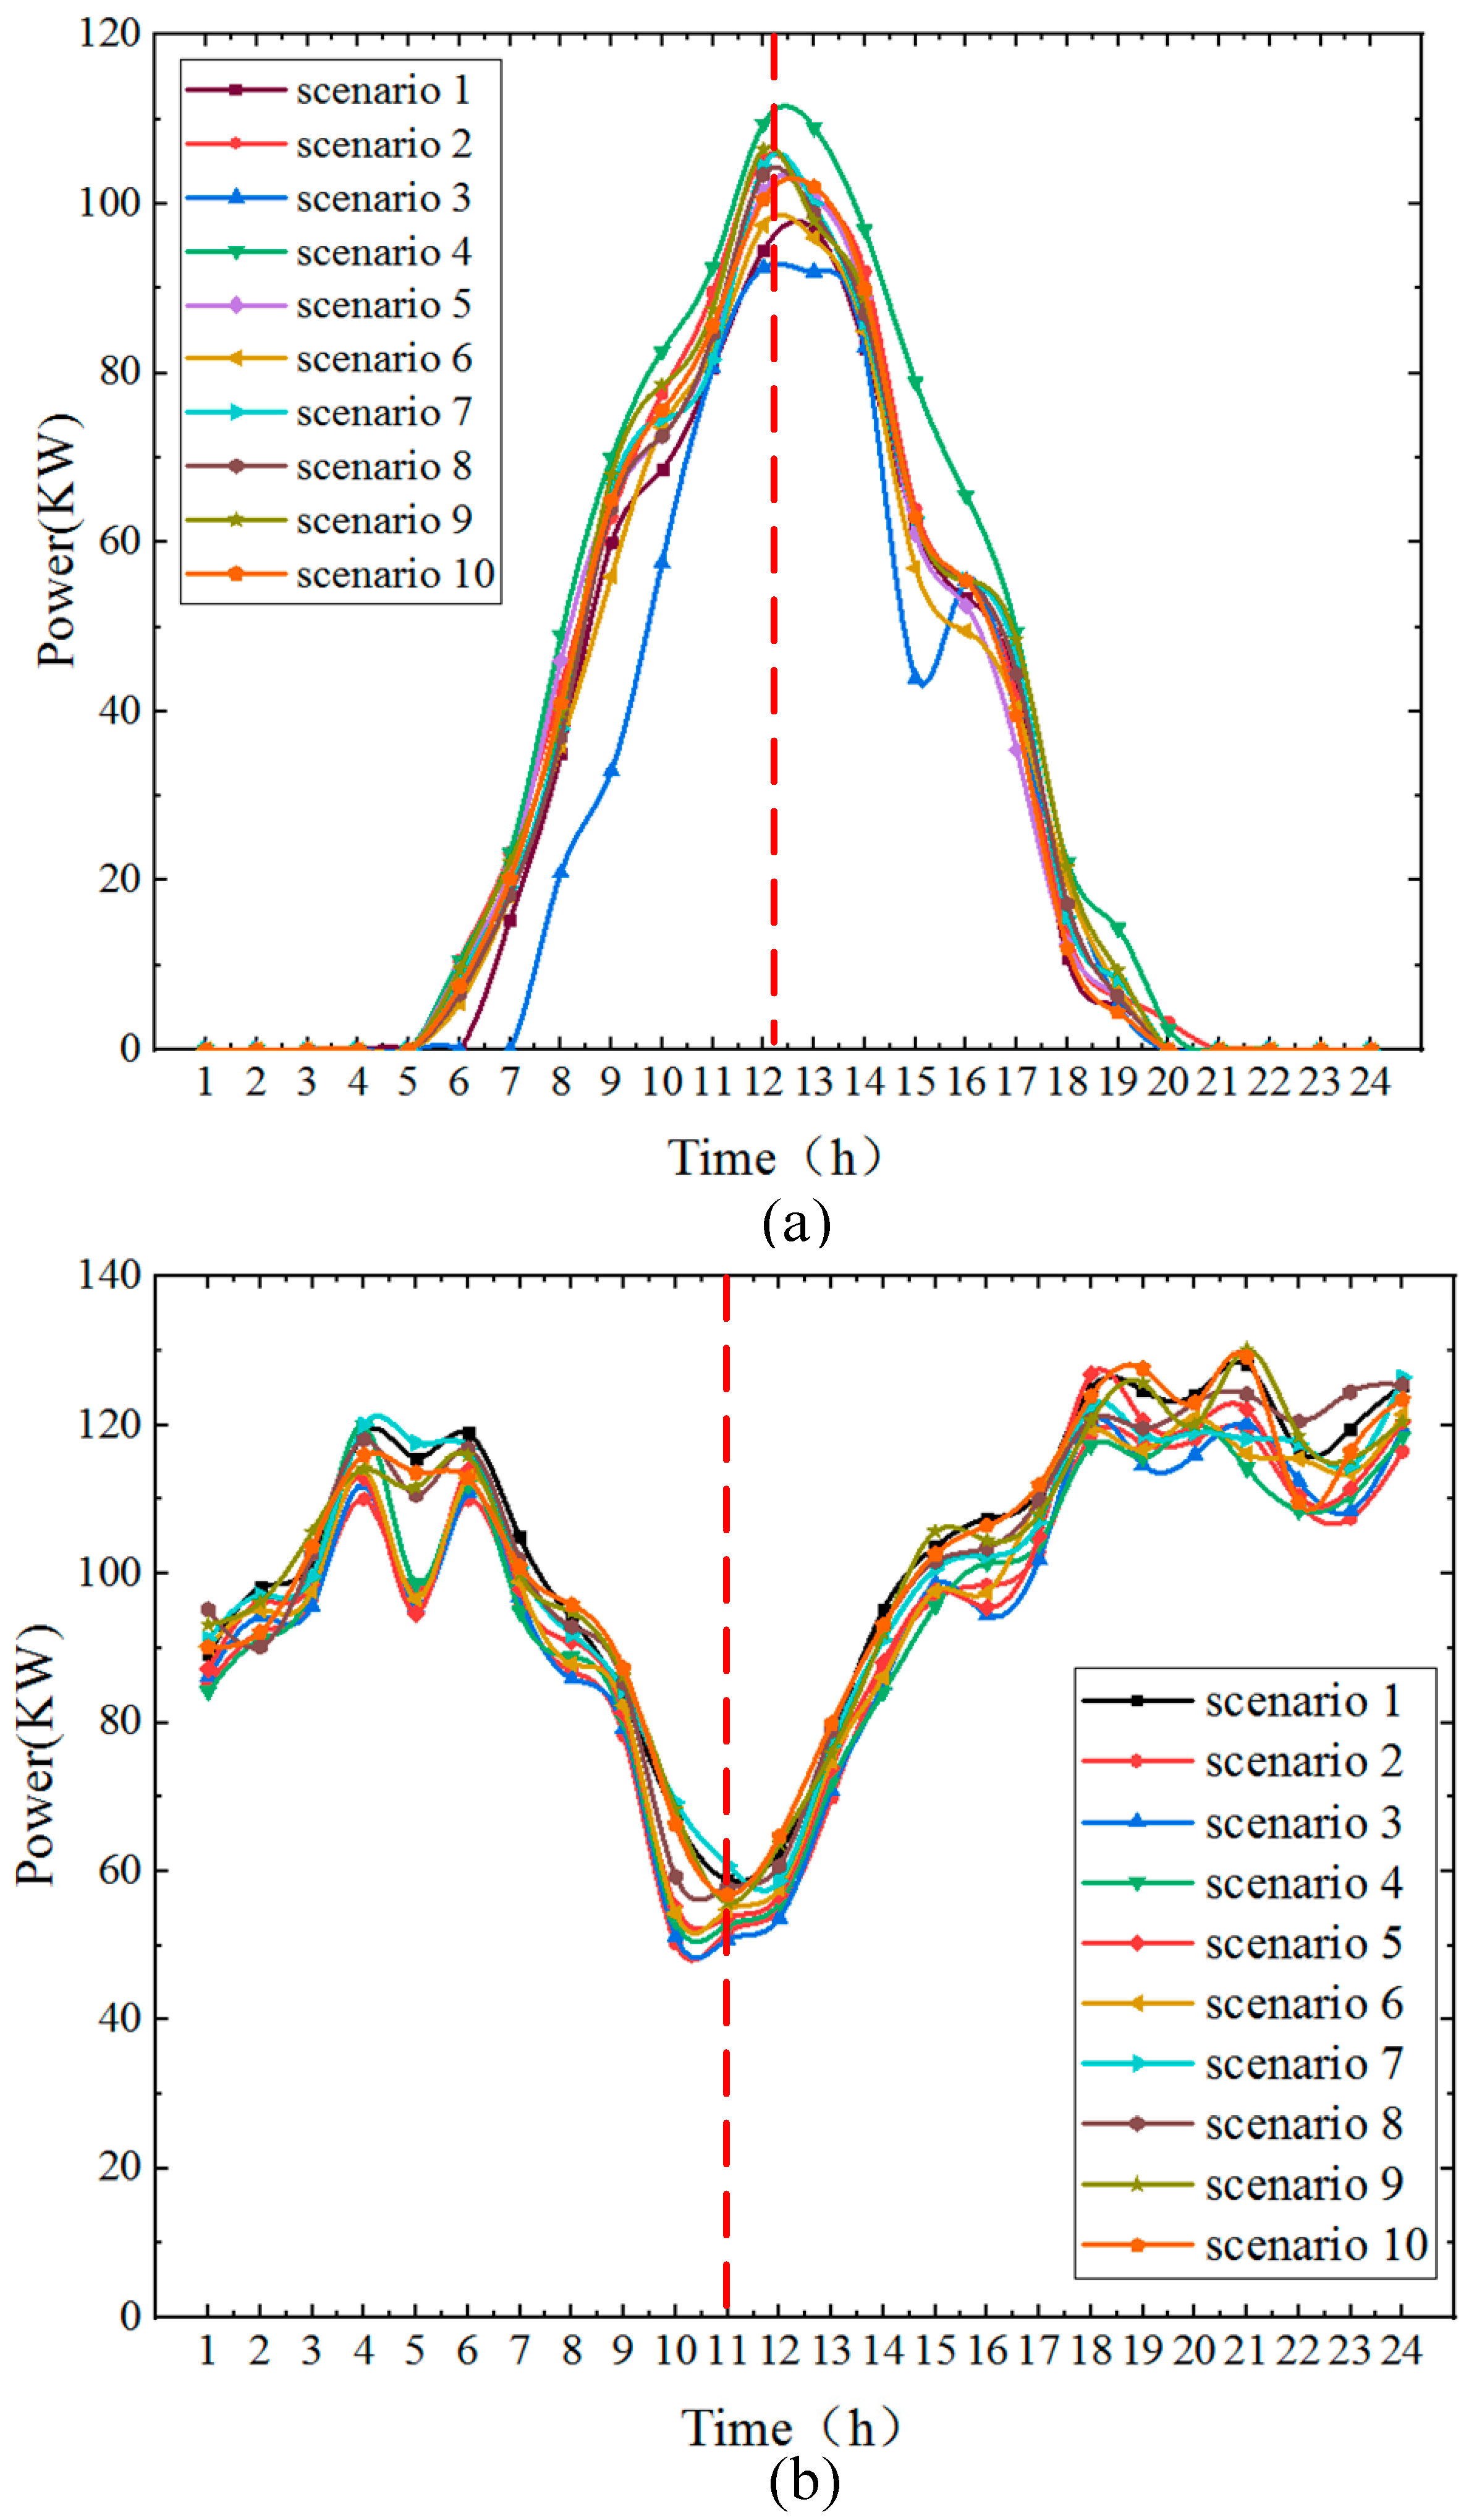
4.1. Data Analysis
4.2. Analysis and Discussion of Results
4.2.1. Operation Mode 1
4.2.2. Operation Mode 2
4.2.3. Operation Mode 3
4.2.4. Operation Mode 4
4.2.5. Operation Mode 5
4.2.6. Comparative Analysis of Results
4.2.7. Analysis of Economic Benefits of Microgrid by Energy Storage Unit
4.3. Operational Strategy
5. Conclusion
Author Contributions
Funding
Conflicts of Interest
References
- Eurostat. Share of Renewable Energy Up to 14.1% of Energy Consumption in the EU28 in 2012; Eurostat: Brussels, Belgium, 11 March 2014. [Google Scholar]
- The 13th Five-Year Plan for Renewable Energy Development in China; National Development and Reform Commission: Beijing, China, December 2016.
- Majidi, M.; Mohammadi-Ivatloo, B.; Anvari-Moghaddam, A. Optimal robust operation of combined heat and power systems with demand response programs. Appl. Therm. Eng. 2019, 149, 1359–1369. [Google Scholar] [CrossRef]
- Zhu, C.; Xu, B.; Nie, Y.Z. An Integrated Design and Operation Optimal Method for CCHP System. Energy Procedia 2019, 158, 1360–1365. [Google Scholar] [CrossRef]
- Pashaei-Didani, H.; Nojavan, S.; Nourollahi, R.; Zare, K. Optimal economic-emission performance of fuel cell/CHP/storage based microgrid. Int. J. Hydrog. Energy 2019, 44, 6896–6908. [Google Scholar] [CrossRef]
- Izadbakhsh, M.; Gandomkar, M.; Rezvani, A.; Ahmadi, A. Short-term resource scheduling of a renewable energy based micro grid. Renew. Energy 2015, 75, 598–606. [Google Scholar] [CrossRef]
- Shao, C.; Li, C.; You, X.; Wu, H.; Zhang, J.; Ding, Y.; Song, Y. Optimal coordination of CHP plants with renewable energy generation considering substitutability between electricity and heat. Energy Procedia 2016, 103, 100–105. [Google Scholar] [CrossRef]
- Wang, H.; Yin, W.; Abdollahi, E.; Lahdelma, R.; Jiao, W. Modelling and optimization of CHP based district heating system with renewable energy production and energy storage. Appl. Energy 2015, 159, 401–421. [Google Scholar] [CrossRef]
- Pourghasem, P.; Sohrabi, F.; Abapour, M.; Mohammadi-Ivatloo, B. Stochastic multi-objective dynamic dispatch of renewable and CHP-based islanded microgrids. Electr. Power Syst. Res. 2019, 173, 193–201. [Google Scholar] [CrossRef]
- Moghaddam, A.A.; Seifi, A.; Niknam, T.; Pahlavani, M.R.A. Multi-objective operation management of a renewable MG (micro-grid) with back-up micro-turbine/fuel cell/battery hybrid power source. Energy 2011, 36, 6490–6507. [Google Scholar] [CrossRef]
- Niknam, T.; Azizipanah-Abarghooee, R.; Roosta, A.; Amiri, B. A new multi-objective reserve constrained combined heat and power dynamic economic emission dispatch. Energy 2012, 42, 530–545. [Google Scholar] [CrossRef]
- Ren, H.; Wu, Q.; Gao, W.; Zhou, W. Optimal operation of a grid-connected hybrid PV/fuel cell/battery energy system for residential applications. Energy 2016, 113, 702–712. [Google Scholar] [CrossRef]
- Maleki, A.; Hafeznia, H.; Rosen, M.A.; Pourfayaz, F. Optimization of a grid-connected hybrid solar-wind-hydrogen CHP system for residential applications by efficient metaheuristic approaches. Appl. Therm. Eng. 2017, 123, 1263–1277. [Google Scholar] [CrossRef]
- Alipour, M.; Zare, K.; Mohammadi-Ivatloo, B. Short-term scheduling of combined heat and power generation units in the presence of demand response programs. Energy 2014, 71, 289–301. [Google Scholar] [CrossRef]
- Firouzmakan, P.; Hooshmand, R.A.; Bornapour, M.; Khodabakhshian, A. A comprehensive stochastic energy management system of micro-CHP units, renewable energy sources and storage systems in microgrids considering demand response programs. Renew. Sustain. Energy Rev. 2019, 108, 355–368. [Google Scholar] [CrossRef]
- Aghaei, J.; Alizadeh, M.I. Multi-objective self-scheduling of CHP (combined heat and power)-based microgrids considering demand response programs and ESSs (energy storage systems). Energy 2013, 55, 1044–1054. [Google Scholar] [CrossRef]
- Alipour, M.; Zare, K.; Seyedi, H.; Jalali, M. Real-time price-based demand response model for combined heat and power systems. Energy 2019, 168, 1119–1127. [Google Scholar] [CrossRef]
- Hosseinnia, H.; Tousi, B. Optimal operation of DG-based micro grid (MG) by considering demand response program (DRP). Electr. Power Syst. Res. 2019, 167, 252–260. [Google Scholar] [CrossRef]
- Wu, J.; Zhang, B.; Jiang, Y.; Bie, P.; Li, H. Chance-constrained stochastic congestion management of power systems considering uncertainty of wind power and demand side response. Int. J. Electr. Power Energy Syst. 2019, 107, 703–714. [Google Scholar] [CrossRef]
- Korprasertsak, N.; Leephakpreeda, T. Robust short-term prediction of wind power generation under uncertainty via statistical interpretation of multiple forecasting models. Energy 2019, 180, 387–397. [Google Scholar] [CrossRef]
- Shukla, A.; Singh, S.N. Clustering based unit commitment with wind power uncertainty. Energy Convers. Manag. 2016, 111, 89–102. [Google Scholar] [CrossRef]
- Sharifzadeh, H.; Amjady, N.; Zareipour, H. Multi-period stochastic security-constrained OPF considering the uncertainty sources of wind power, load demand and equipment unavailability. Electr. Power Syst. Res. 2017, 146, 33–42. [Google Scholar] [CrossRef]
- Nazari-Heris, F.; Mohammadi-ivatloo, B.; Nazarpour, D. Network constrained economic dispatch of renewable energy and CHP based microgrids. Int. J. Electr. Power Energy Syst. 2019, 110, 144–160. [Google Scholar] [CrossRef]
- Zhang, Y.; Meng, F.; Wang, R.; Kazemtabrizi, B.; Shi, J. Uncertainty-resistant stochastic MPC approach for optimal operation of CHP microgrid. Energy 2019, 179, 1265–1278. [Google Scholar] [CrossRef]
- Luo, Z.; Wu, Z.; Li, Z.; Cai, H.; Li, B.; Gu, W. A two-stage optimization and control for CCHP microgrid energy management. Appl. Therm. Eng. 2017, 125, 513–522. [Google Scholar] [CrossRef]
- Dong, J.; Yang, P.; Nie, S. Day-Ahead Scheduling Model of the Distributed Small Hydro-Wind-Energy Storage Power System Based on Two-Stage Stochastic Robust Optimization. Sustainability 2019, 11, 2829. [Google Scholar] [CrossRef]
- Wang, Y.; Wang, X.; Yu, H.; Huang, Y.; Dong, H.; Qi, C.; Baptiste, N. Optimal design of integrated energy system considering economics, autonomy and carbon emissions. J. Clean. Prod. 2019, 225, 563–578. [Google Scholar] [CrossRef]


| Authors | Energy Demand | System Components | IEDR | Grid-Connected | CO2 Emission | Uncertainty Processing Method | ||||
|---|---|---|---|---|---|---|---|---|---|---|
| Electric | Heat | PV | WT | Battery | CHPs | |||||
| Haichao Wang (2015) | √ | √ | √ | √ | √ | √ | ||||
| Changzheng Shao (2016) | √ | √ | √ | √ | ||||||
| Pouya Pourghasem (2019) | √ | √ | √ | √ | √ | scenario generation process | ||||
| Yan Zhang (2019) | √ | √ | √ | √ | √ | √ | √ | scenario reduction technique | ||
| Farhad Nazari-Heri (2019) | √ | √ | √ | √ | √ | √ | √ | scenario generation process | ||
| This paper | √ | √ | √ | √ | √ | √ | √ | √ | √ | FCM-CCQ |
| Parameters | Value | Parameters | Value |
|---|---|---|---|
| 0.8 | 200 KWh | ||
| 0.85 | 30 KWh | ||
| 0.73 | 500 KWh | ||
| , | 0.95 | 200 KWh | |
| 9.7 KWh/m3 | 100 KWh | ||
| 0.08 ¥/KWh | 130 KWh | ||
| 0.11 ¥/KWh | 200 KWh | ||
| 0.02 ¥/KWh | 200 KWh | ||
| 0.01685 ¥/KWh | 10 KWh | ||
| 0.02 ¥/KWh | 5 KWh | ||
| 0.025 ¥/KWh | Ses | 20 KWh | |
| DRPmax | 30 KWh |
| Natural Gas | Electricity | Carbon Tax | |
|---|---|---|---|
| unit | 220 (g/KWh) | 968 (g/KWh) | 0.04345 ($/kg) |
| Operation Mode | IEDR | Battery | On-Grid | Islanded |
|---|---|---|---|---|
| 1 | √ | √ | √ | |
| 2 | √ | √ | ||
| 3 | √ | √ | ||
| 4 | √ | |||
| 5 | √ | √ | √ |
| Operation Mode | System Structure | System Operation Cost (¥) | IEDR | CO2 Emission Cost (¥) | Proportion of Electricity Purchase | ||
|---|---|---|---|---|---|---|---|
| On-Grid | DR | Battery | Compensation Cost (¥) | ||||
| 1 | √ | √ | √ | 6188.1433 | 907.4090 | 879.9429 | 10.07% |
| 2 | √ | √ | 6191.6159 | 886.7599 | 875.2604 | 9.88% | |
| 3 | √ | √ | 6269.3646 | 0 | 849.3497 | 9.46% | |
| 4 | √ | 6272.7725 | 0 | 843.9117 | 9.19% | ||
| 5 | √ | √ | 6372.2021 | 797.4766 | 697.7986 | 0 | |
| Operation Mode | System Structure | System Operation Cost (¥) | DR | CO2 Emission Cost (¥) | Proportion of Electricity Purchase | ||
|---|---|---|---|---|---|---|---|
| On-Grid | DR | Battery | Compensation Cost (¥) | ||||
| 1 | √ | √ | √ | 6199.3748 | 521.4735 | 915.8112 | 13.01% |
| 2 | √ | √ | 6202.5363 | 521.4735 | 877.4196 | 10.25% | |
| 5 | √ | √ | 6372.2021 | 427.4089 | 697.7986 | 0 | |
© 2019 by the authors. Licensee MDPI, Basel, Switzerland. This article is an open access article distributed under the terms and conditions of the Creative Commons Attribution (CC BY) license (http://creativecommons.org/licenses/by/4.0/).
Share and Cite
Dong, J.; Nie, S.; Huang, H.; Yang, P.; Fu, A.; Lin, J. Research on Economic Operation Strategy of CHP Microgrid Considering Renewable Energy Sources and Integrated Energy Demand Response. Sustainability 2019, 11, 4825. https://doi.org/10.3390/su11184825
Dong J, Nie S, Huang H, Yang P, Fu A, Lin J. Research on Economic Operation Strategy of CHP Microgrid Considering Renewable Energy Sources and Integrated Energy Demand Response. Sustainability. 2019; 11(18):4825. https://doi.org/10.3390/su11184825
Chicago/Turabian StyleDong, Jun, Shilin Nie, Hui Huang, Peiwen Yang, Anyuan Fu, and Jin Lin. 2019. "Research on Economic Operation Strategy of CHP Microgrid Considering Renewable Energy Sources and Integrated Energy Demand Response" Sustainability 11, no. 18: 4825. https://doi.org/10.3390/su11184825
APA StyleDong, J., Nie, S., Huang, H., Yang, P., Fu, A., & Lin, J. (2019). Research on Economic Operation Strategy of CHP Microgrid Considering Renewable Energy Sources and Integrated Energy Demand Response. Sustainability, 11(18), 4825. https://doi.org/10.3390/su11184825