1. Introduction
The continued impacts of climate change, on par with human activities, have altered hydrological processes and affected the spatiotemporal distribution of global water resources [
1,
2,
3]. Human activity has changed the spatial-temporal distribution of water resources through land use, water construction, and other water engineering and management operations [
4]. Climate variation is supposed to have led to global warming and changes of precipitation and evaporation characteristic [
5]. Most scientists have mainly researched hydrologic responses to land use/cover change and climate variation [
6,
7,
8], which are the two dominant factors influencing the hydrological cycle. Several studies showed that the effects of human activity exert a dominant influence on runoff change compared to climate variation [
9]. Wang et al. [
10] indicated that, in the Baimasi River, the contribution of runoff variation due to climate variability was estimated to be 89%, 66%, and 56% in the 1970s, 1980s, and 1990s, respectively. However, Döll and Zhang [
11] reported that, by 2050 the effects of climate change may have a generally larger effect on flow regimes than it is estimated that dams and water withdrawals have had until now.
The Arys and Keles rivers are one of the important water arteries in the Syrdarya river basin. Those rivers are the last tributaries of the Syrdarya River and account for more than 9% of its total runoff [
12]. The Syrdarya River Basin (Central Asia) is characterized by the semi-arid and arid climate with scarce water resources [
13]. Due to the rise in water demand as a consequence of the growing population and the larger variability in water resources resulting from both climate change and intense human activities, water resources in this region are increasingly under pressure [
13,
14]. It has been proven that there has been a significant increase in temperature and in precipitation over Central Asia and the Syrdarya River Basin during the recent decades [
15,
16]. Moreover, human activities including change in land use (especially the expansion of agricultural land) and dam construction have significantly affected the water supply and water demand patterns, and impact the runoff reductions in this region [
17]. Therefore, the water resources of Keles and Arys are very important components of the basin.
The water resources of the Keles and Arys rivers’ watersheds sustain irrigation systems in the arid region. The rivers originate in the altitudes of the Western Tian Shan mountain ranges, where their water is generated from seasonal snow accumulations and glacier melt. A change in air temperature has an impact on the process of snow accumulation and the onset and duration of the spring and summer melt. It will thus change the flow regimes of the rivers. This will affect irrigated agriculture which strongly depends on the given spatio-temporal patterns of water availability and distribution. Next to changing those patterns, an increase in temperature will increase evapotranspiration, which will make irrigated agriculture even more sensitive to water deficit [
18].
Because of the effects of global climate change, such as increasing temperature, precipitation and evapotranspiration, and human activities, such as irrigation and water constructions, the incoming water to the Syrdarya River varies strongly [
19,
20]. Therefore, the extent of climate influence and quantifying the scale of their effects will help to identify the nature of the influential factors and improve the management of the Arys River and Keles River watersheds, and the Syrdarya River Basin as a whole. It is significant to understand the hydrological responses to these changes since the change in small watersheds runoff affects the water resources of large basins. Hydrological Sensitivity Analysis is an effective and simple method for determining changes in runoff, which has recently become a major method by which to distinguish the hydrological response between climate variability and human activities. Until recently, to our knowledge, detailed analysis on the long-term change in the runoff of the Arys River and Keles River watersheds and the individual contribution effect of climatic variation and human activities have not been studied. In this study, we will investigate the changes in two of the river watersheds in the Syrdarya River Basin, Central Asia. The objectives of this study were to: (1) assess long-term runoff change in two river basins, (2) detect change points of annual runoff, and (3) quantitatively evaluate the contribution of climate variation to the runoff change.
2. The Study Area
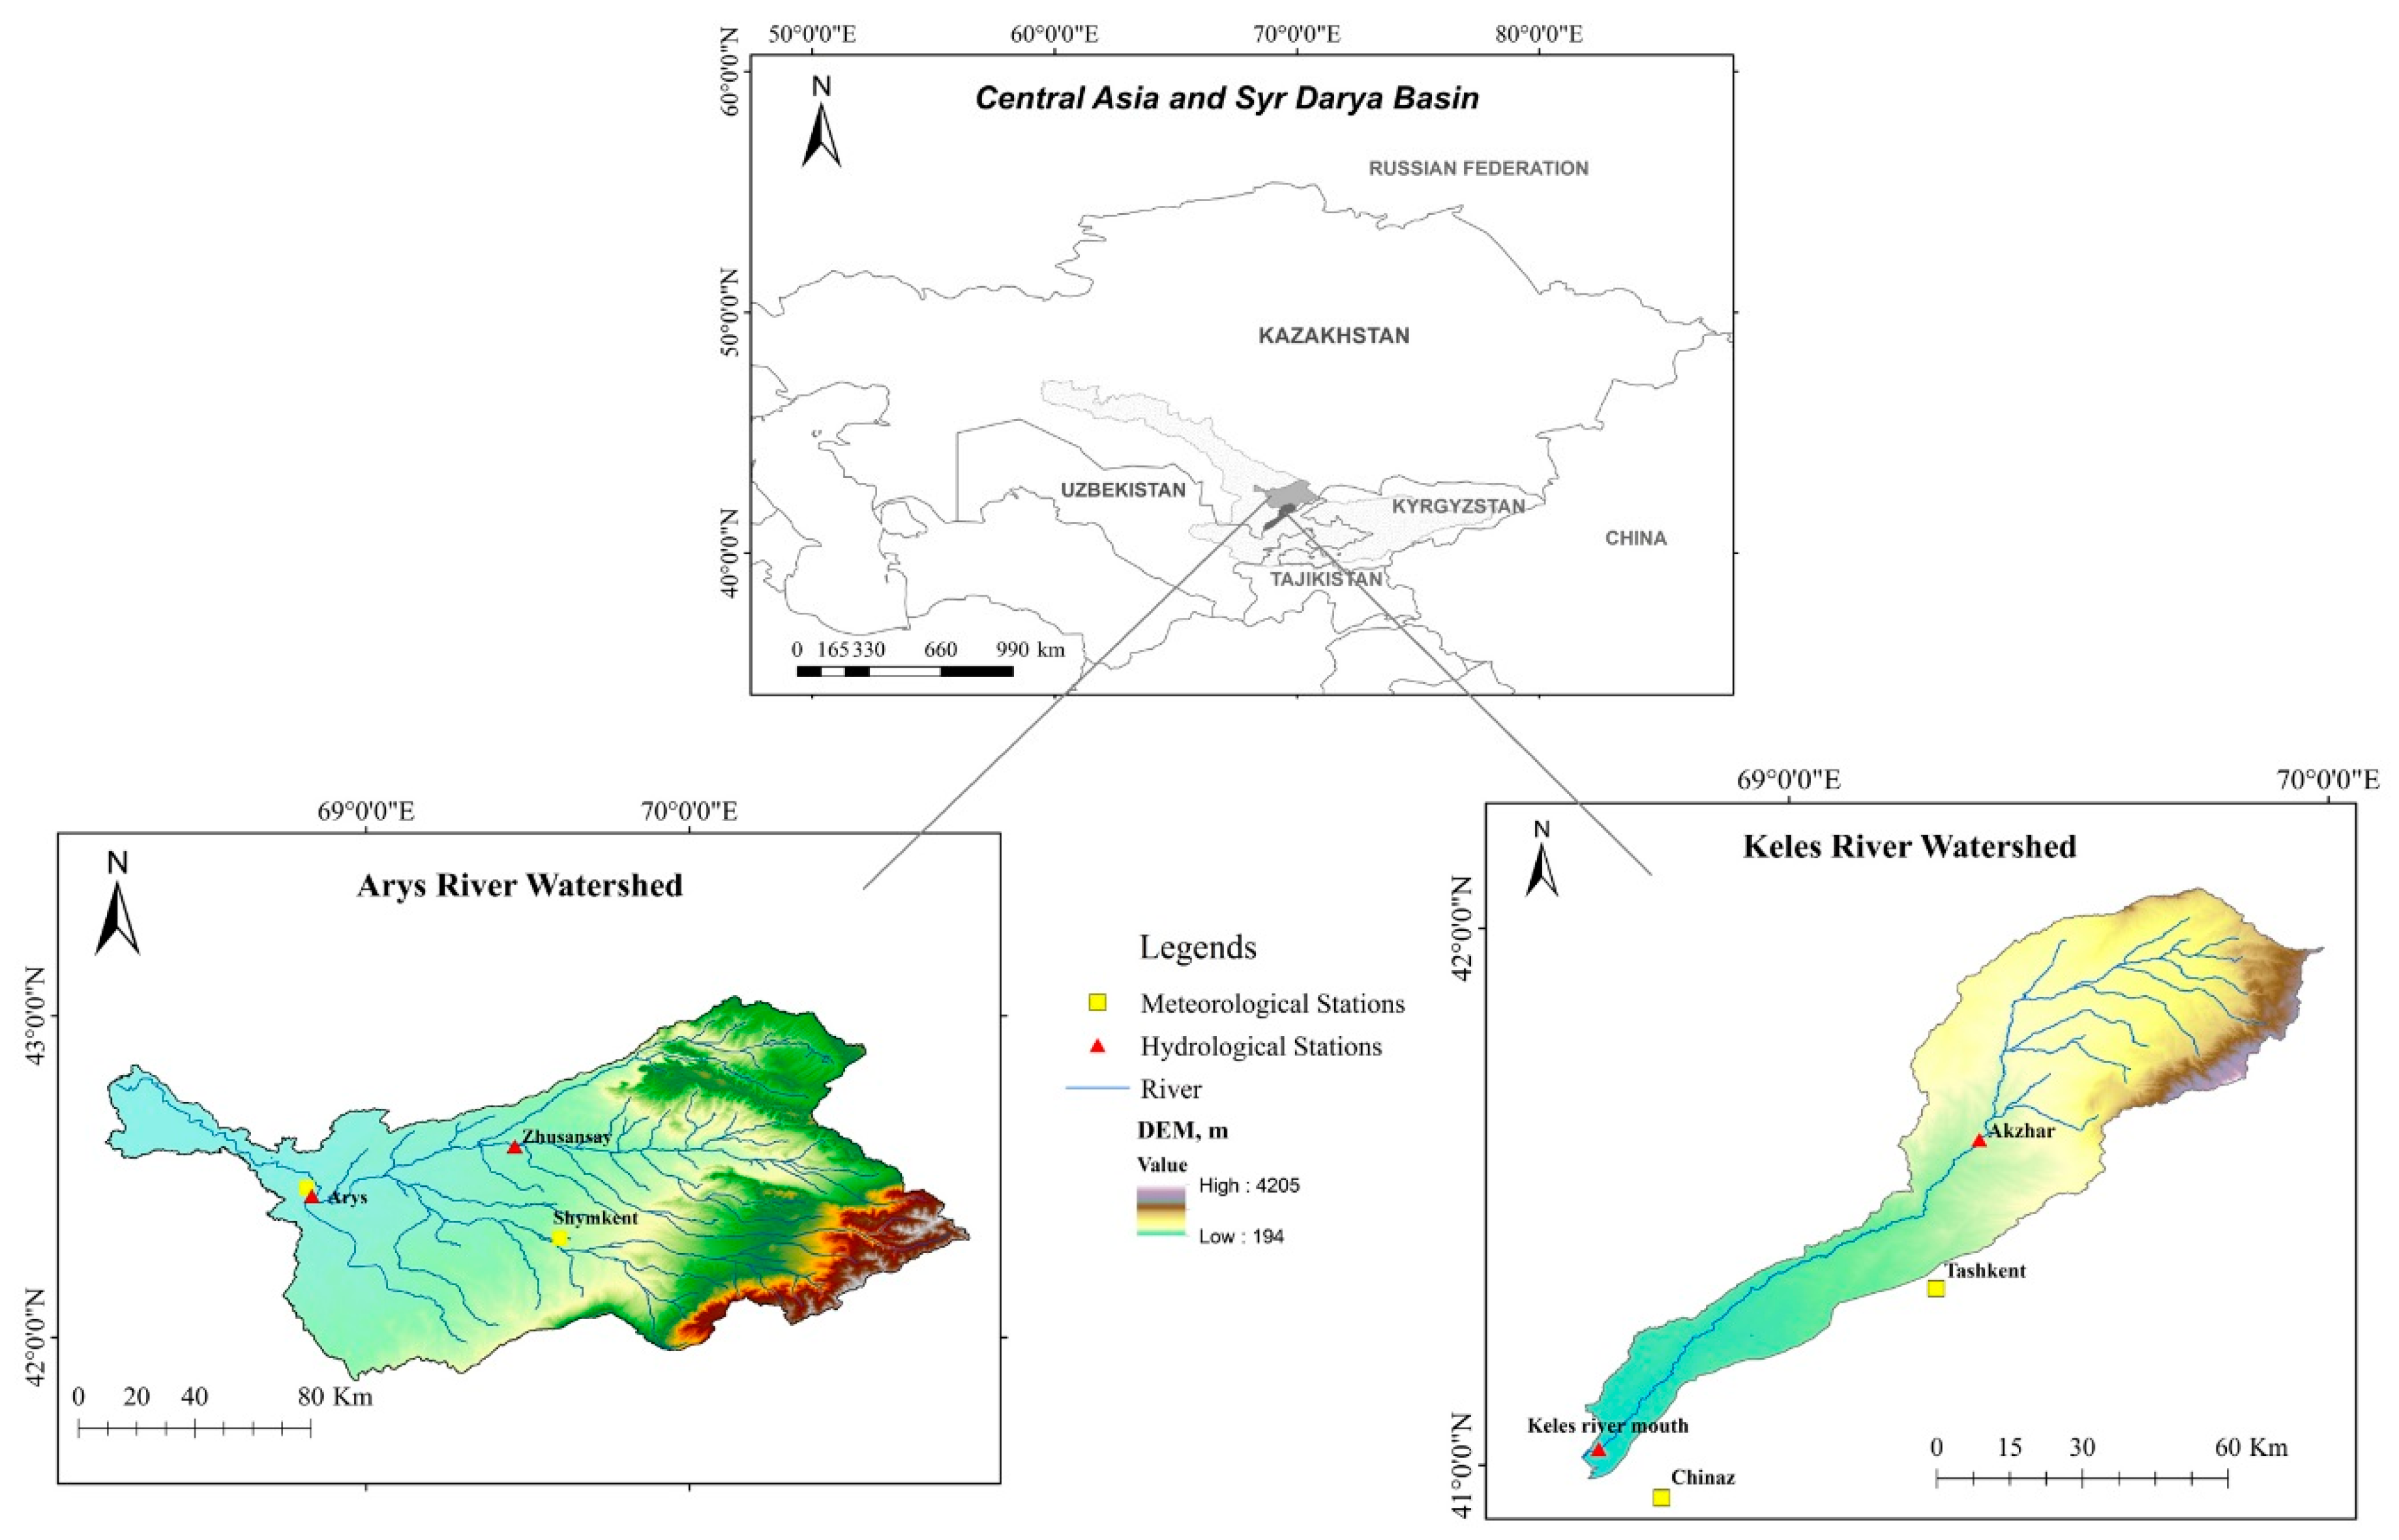
The study areas are the Arys River and Keles River watersheds (
Figure 1), which is the main runoff-producing area of the Syrdarya River Basin in lower reaches. The main catchment rivers are the Arys (42°31′01″ N–70°37′39″ E) and Keles(41°57′42″ N–69°42′33″ E), which are right tributaries of the Syrdarya River (one of the major basins in Central Asia) [
21]. Arys originates from the springs Aksu-Zhabagly Nature Reserve on the Talas Alatau ridge, the right tributaries flows from the Karatau ridge. The river length is 378 km and the basin area is 14,900 km
2. The average water discharge is 46.6 m
3/s. The maximum discharge occurs in April and the minimum discharge in August.
The Keles river originates from the Karzhantau mountain range. The river length is 241 km, the basin area is 3310 km
2. The Keles River watershed flows to low mountain areas. The river receives its main feed from the northwestern slope of the Karzhantau ridge. Water discharge is 6.5 m
3/s. The river’s maximum discharge occurs in April (water discharge begins to increase from February) and minimum discharge occurs in August. Tributaries of theKeles River can be found in only the first 55 km from the source (confluence of the rivers Juzumduk and Dzhegirgen), they are absent below this, except for dry ravines. The water resources of the Arys and Keles river watersheds are mainly used for irrigation [
22,
23].
The climate is temperate with cool, dry winters and hot summers, and the mean annual temperature is in the 5.9–13.4 °C range across the two watersheds. The mean annual precipitation is approximately 530 mm in the Arys River Watershed and 421 mm in the Keles River Watershed, 80% of which falls between November and March, and the mean annual potential evapotranspiration is 1000–1200 mm. Snow cover is insignificant and unstable. The average snow depth on sloping plains in the south is 5–10 cm. Sometimes there is no snow cover. In the foothills, the snow depth ranges from 15–25 cm, and in the mountains it can reach 30–35 cm. The main land-use types in the study areas are pasture and arable cropland. The main soil types in both watersheds are sierozems and mountain sierozems.
3. Data Collection
Metrological data (1960–2015) were collected from 4 stations from the Central Asia Climate Database (
http://snobear.colorado.edu/Markw/Geodata/geodata.html). Due to the lack of some meteorological observation data, especially in the mountain area, the precipitations (P), temperature (T), and potential evapotranspiration (PET) in the watersheds from 1960 to 2015 were additionally calculated by using the Climatic Research Unit Time Series (CRU, TS v.4.01) (
http://www.cru.uea.ac.uk/data/). This dataset is produced by the Climatic Research Unit (CRU), University of East Anglia, England. The dataset has a resolution of 0.5° × 0.5°, based on the analysis of over 4000 individual weather station records [
24]. In addition, the PET data in CRU is calculated based on the Penman–Monteith equation, which is the most accurate PET equation. Recent studies [
25,
26] suggested that the CRU dataset is applicable and satisfactory for hydrometeorological studies in Central Asia.
The runoff data obtained from the 2 hydrological stations at the Arys River watershed and 2 hydrological stations at the Keles River watershed (
Figure 1), which were available for the period 1960–2015, were used in this study. Data were collected from the State Water Cadastre editions books [
27,
28]. The control areas of the Zhusansay, Arys stations are 4080 km
2 and 13,100 km
2, the Akzhar and Keles river mouth stations are 1960 km
2 and 3310 km
2, respectively. They account for about 27–50% and 87–99% of the watersheds.
Furthermore, we collected land use/land cover maps for 1976, 1994, and 2012. Changes in 8 land use/land cover categories, including irrigation area, non-irrigation area, grassland, water, urban land, bared land, mountainous and wetland, were quantified for the Arys River and Keles River watersheds.
4. Research Methods
4.1. Mann–Kendall Trend Test
Mann–Kendall (MK) [
29,
30] rank-based nonparametric statistical tests are applied in many hydro-climatological studies, which are used for detecting monotonic trends in time series data. Yue and Wang [
31] indicated that the power of the trend depends on the pre-assigned significance level, magnitude of trend, sample size, and the amount of variation within a time series.
The Mann–Kendal trend test was used in this study to investigate trends in the climatic and stream flow variables considered. The test statistic S is given by:
where,
xj and
xk are the annual data values in years
j and
k,
j >
k respectively, and n is the number of observations.
S is normally distributed with mean 0, and Variance,
the variance
Var(
S) and
Z are computed using Equations (3) and (4), respectively. Computation for the
Z score is obtained by:
For a given level of significance α, the null hypothesis of no trend in the time series will be rejected if >ȥ1−α. More specifically, Z>ȥ1−α indicates the existence of an increasing trend and Z<ȥα implies a decreasing trend.
The MK test should be applied to series data which are independent or uncorrelated [
32]. However, certain hydrological time series may frequently display statistically significant serial correlation. Therefore, in order to eliminate the influence of serial correlation, “pre-whitening” was proposed by Von Storch [
33] to remove the lag-1 serial correlation (r1) from the time series.
4.2. Change Point Analysis Method
The Pettitt’s test [
34] is a non-parametric approach to determine the occurrence of a change point. It has been commonly used to detect changes in the hydrological series as well as climatic ones [
35]. This approach considers a time series as two samples represented by
x1;
x2; …;
xt and
xt+1; …;
xn. The Pettitt indices
Ut,n can be calculated from the following formula [
36]:
where, the maximum
Ut,n corresponds to the change point year.
The double cumulative curve (DCC) is the plot of the accumulated values of one variable against the accumulated values of another related variable for a concurrent period [
37]. The DCC between precipitation and runoff has recently become an effective tool for detecting the changes of hydrological regime due to anthropogenic disturbances [
38]. Normally, the DCC between precipitation and runoff is a straight line, a change in the gradient of the curve may represent that the original relationship between variables has been broken. In this study, the DCC will be utilized to identify the change point of the runoff series as a confirmation of the change points detected by Pettitt’s test. Using trend and change-point analysis, the runoff series can be divided into the pre-change and the post-change periods. Thus, the impacts of climate variability and human activities on runoff can be separated by using the following method.
4.3. Hydrologic Sensitivity Analysis Method
The hydrological sensitivity analysis method can be described as the percentage change in annual runoff in response to the change in annual precipitation and evapotranspiration. The concept is based on a water balance for a watershed and can be described as:
where,
P is the precipitation (mm),
AET is the actual evapotranspiration (mm),
R is the runoff (mm), and Δ
S is the change in the basin water storage (mm). Over a long period of time (i.e., equal to or greater than 10 years), Δ
S can be assumed as zero.
Following a simple model (called Zhang’s curve) developed by Zhang et al. (2001):
where,
PET is the potential evapotranspiration and
w is a model parameter related to the vegetation type, soil hydraulic property, and topography [
39]. In this study, the parameter
w is calibrated by comparing the annual
AET from Equations (6) and (7).
Variation in both precipitation and PET can lead to changes in the water balance. As a first-order approximation, the total change in mean annual runoff can be estimated as:
where, Δ
Robs indicates the observed change in mean annual runoff, Δ
Rclim is the change in mean annual runoff due to climate variation, and Δ
Rhum represents the change in mean annual runoff due to human activity.
Based on the hydrologic sensitivity relationship, the change in mean annual runoff due to climate variation (
) can be approximated as follows [
40]:
where,
represents the change in mean annual runoff due to the effect of climate change. Δ
P and Δ
PET denote changes in mean annual precipitation and potential evaporation respectively, and
β and
are the sensitivity coefficients of runoff to precipitation and potential evaporation, which are expressed [
41] as:
in which
is the mean annual index of dryness (equal to
PET/P). And the contribution of each variable to the change in runoff can be expressed as follows:
5. Results
5.1. Trend and Change-Point Analysis of Temperature and Precipitation Series
The decadal trends in meteorological factors such as P, T, and PET were analyzed to understand the effect of climate characteristics on the hydrological system [
42,
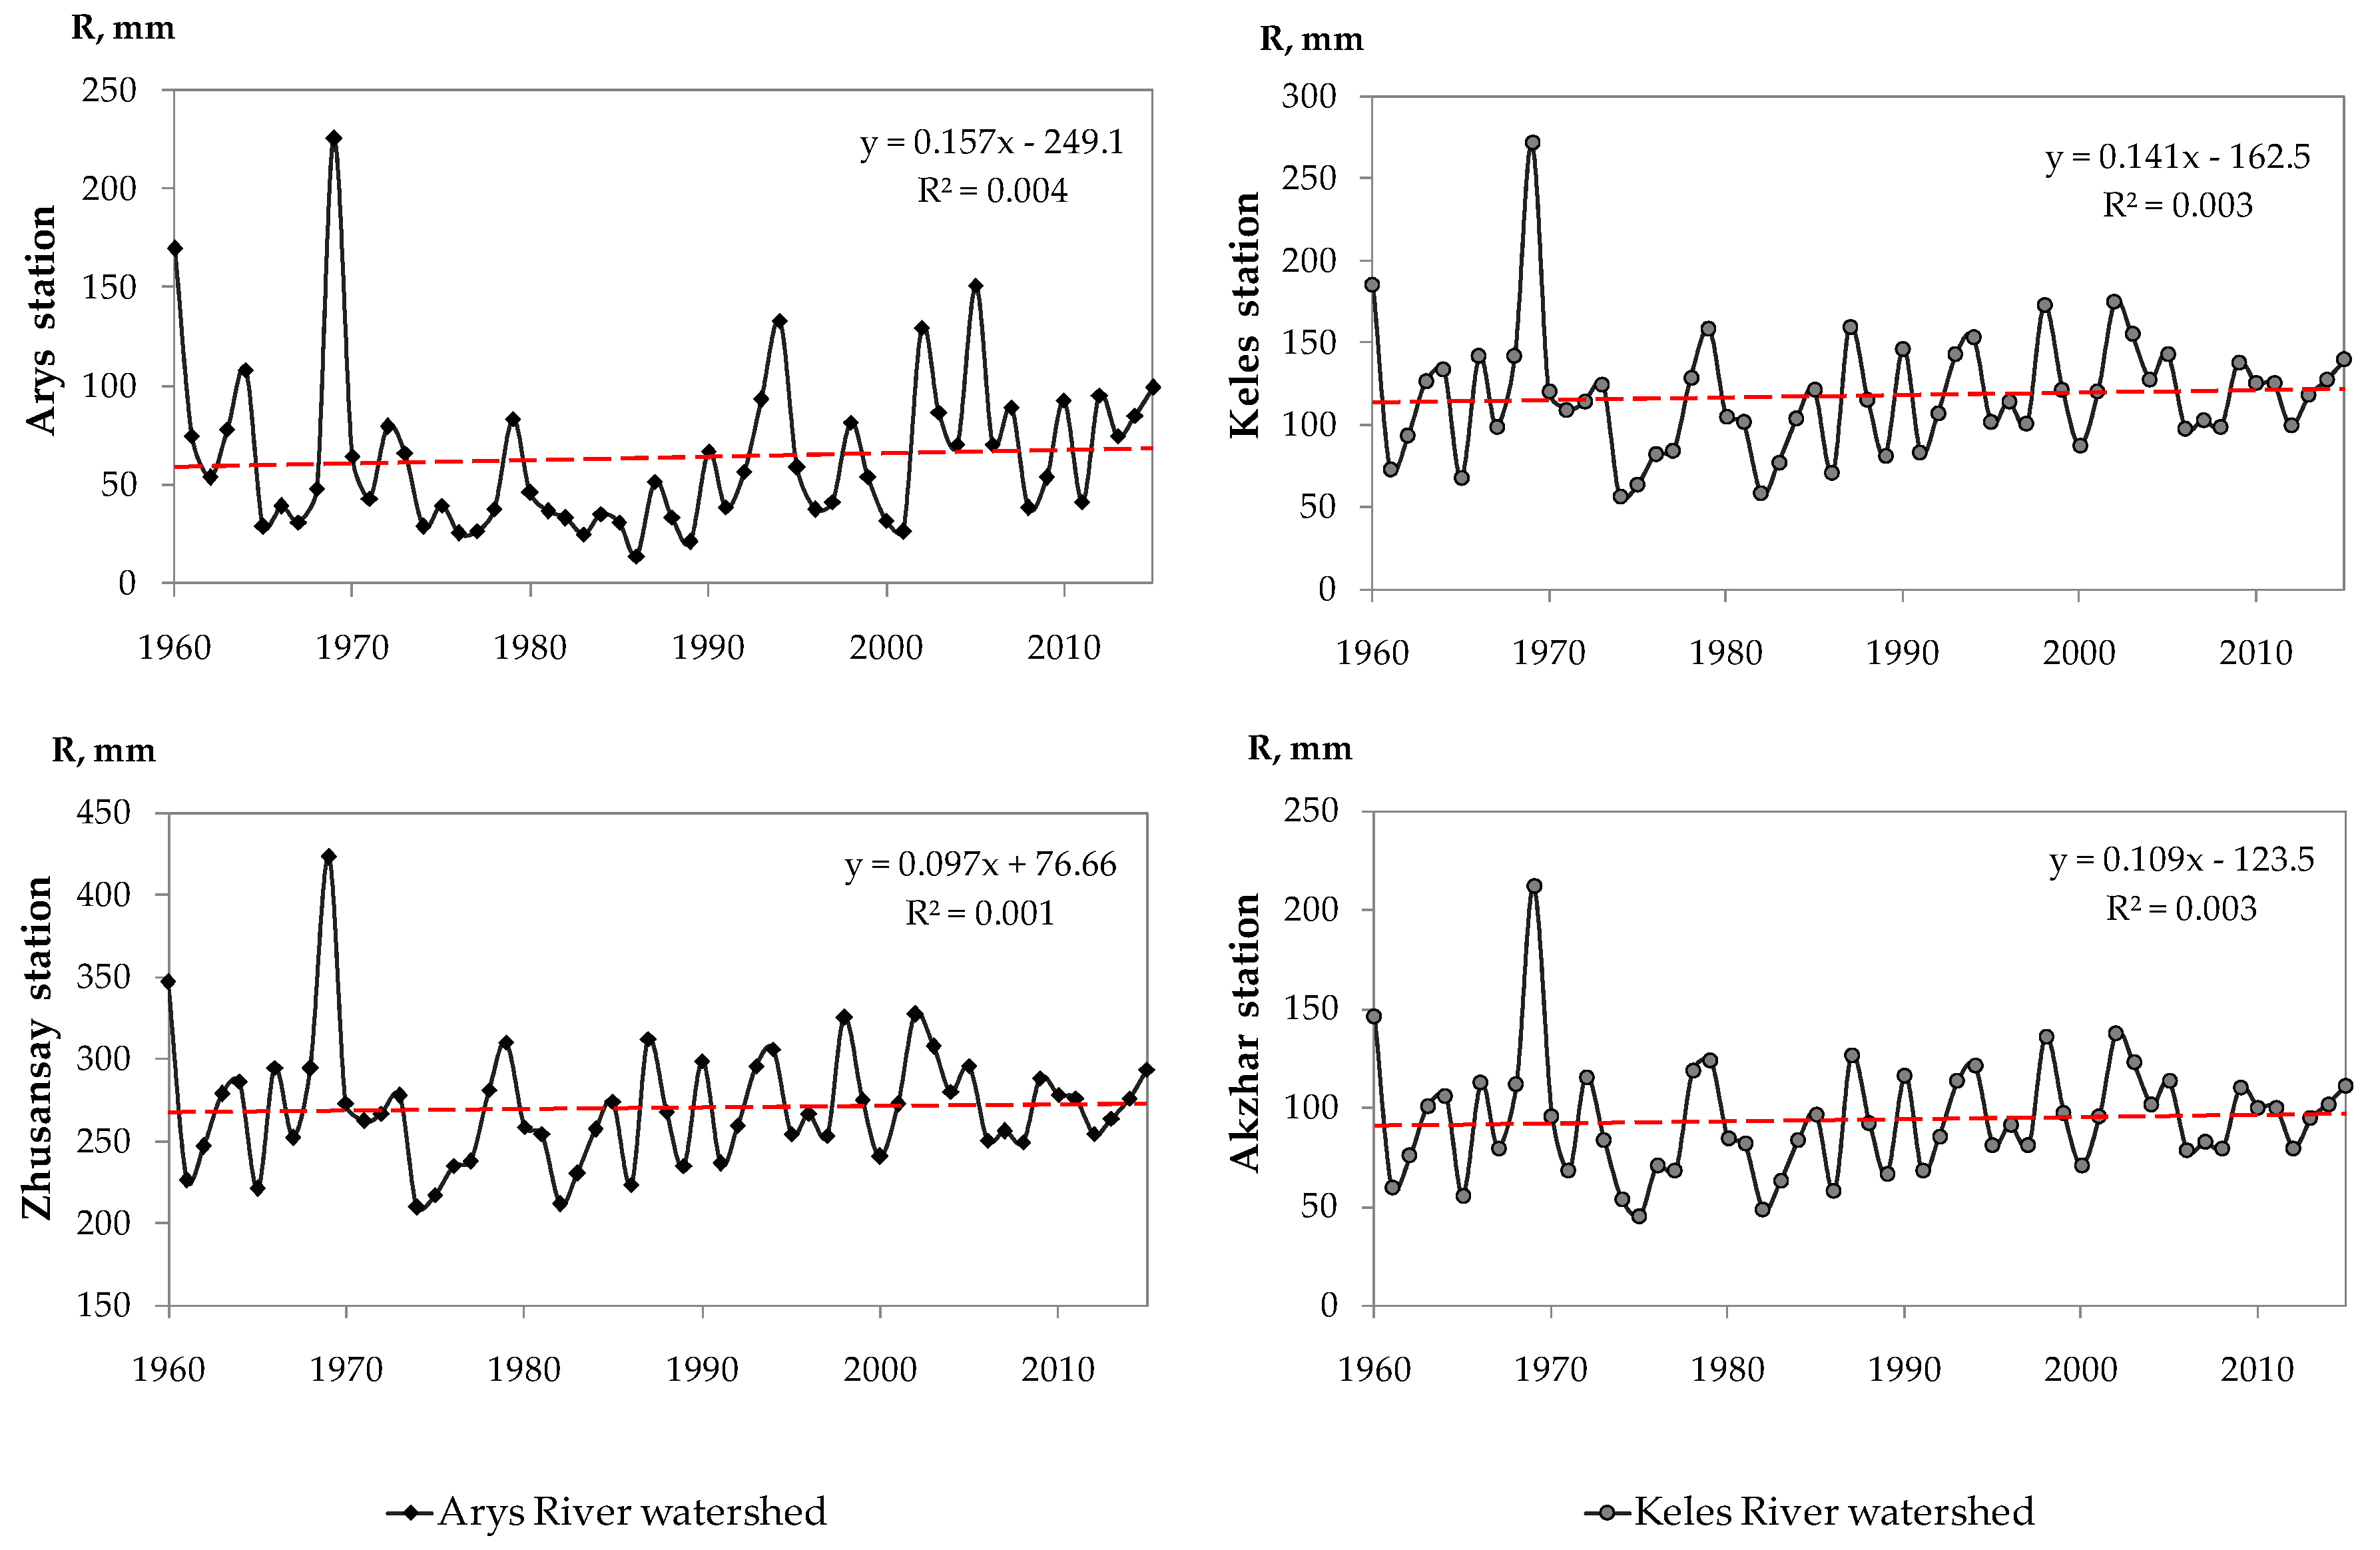
43]. Over the past 55 years, the Arysand KelesRivers’watersheds showed an increasing trend of temperature, precipitation, and evaporation (
Figure 2). The annual T increased at a rate of 0.029 °C/year. Moreover, the annual P and PET had positive trends of 0.32–0.38 and 1.1 mm/year, respectively.
Based on the Mann–Kendall test, the long-term trends of P, PET, and T over the past 55 years are shown in
Table 1. The trend of P was upward, but the increase was not obvious. The PET and T showed a significant increasing trend at the 0.05 confidence level. Throughout the whole study period (1960–2015), the results indicated that the study area underwent a climate variation, which may influence the runoff.
It can be observed from the Pettitt test results (
Table 1) that all annual temperature series had a change point in 1996. As with temperature, the precipitation series had a change point in 1989 also. All precipitation time-series had a monotonic tendency over the last 55 years.
5.2. Trend and Change-Point Analysis of Runoff
The analysis of runoff was done based on the record at Zhusansay and Arys stations (Arys River watershed) and Akzhar and Keles river mouth stations (Keles River watershed). The Zhusansay and Akzhar stations are located in mid-stream and upstream and Arys and Keles river mouth stations are located in the watershed downstream. Based on the Mann–Kendall test, the value of statistic Z was 1.5–1.7, suggesting that during the past 55 years, the annual runoff exhibited an increasing trend across the entire study area, at a rate of 0.1–0.16 mm/year (Arys River) and 0.11–0.14 mm/year (Keles River) (
Figure 3). The annual trend showed an increasing trend which is not significant (
Table 2). But, considering the change in river runoff for the 80-year period, the analysis showed a decrease in river runoff at a significant level. This means over the past 55 years the river’s runoff has been growing.
The Pettitt’s test and DCC method were applied to identify the change-point of the annual runoff series. The results of Pettitt’s test are shown in
Table 2, it was concluded that 1991–1992 could be the detected significant change points reflecting the period after which the effect of human activities on runoff for the two watersheds were change.
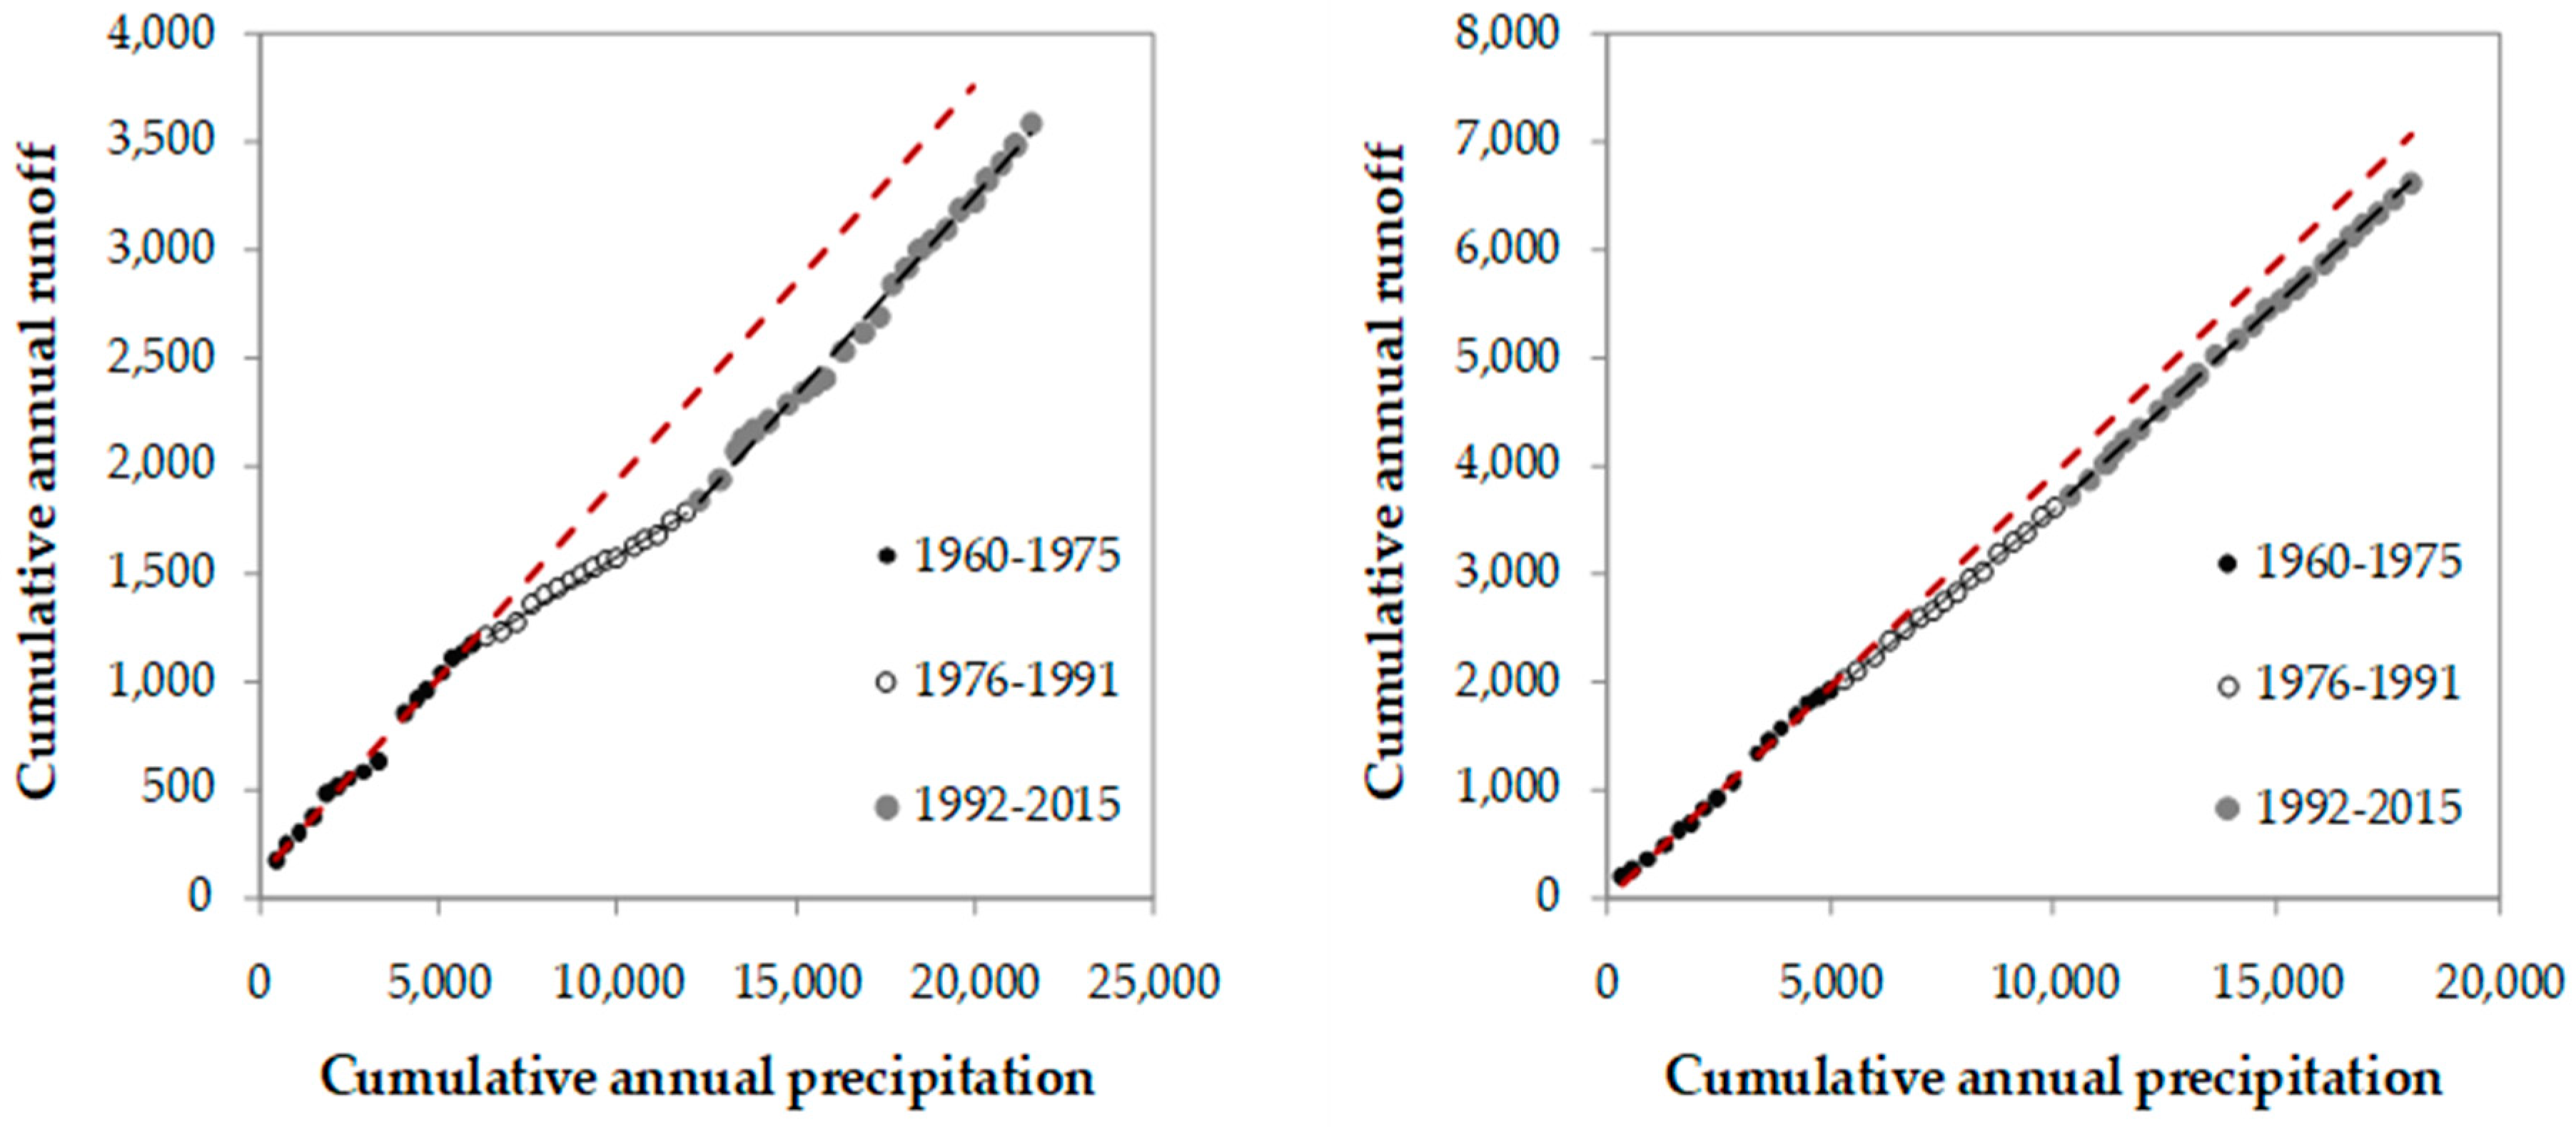
Furthermore, we used the DCC method to detect the change points in runoff series.
Figure 4 shows the cumulative annual precipitation and runoff over the two watersheds. The DCC method detected another change point of runoff series (
Figure 4). It can be demonstrated that the P and runoff were relatively uniform before 1975, but after 1975, the characteristics of runoff changed. Also, it shows that the relationships between cumulative annual precipitation and cumulative annual runoff can be expressed with two nearly straight lines in different slopes before and after 1975 and 1991, suggesting the characteristics of precipitation or runoff changed after those years. We can conclude, then, that the variation in runoff before 1975 is a result of natural variation, with the runoff obviously largely related to precipitation patterns. Consequently, the regression line for data before 1975 is assumed to represent characteristics of river runoff under natural conditions.
Combining the DCC method and Pettitt’s test, 1976 and 1991 could be the abrupt change points reflecting that climate variability and human activities changed to affect the river runoff. Therefore, 1960–1975 was taken as the natural period during which the effect of climate variability and human activities on runoff was less recognized. The periods 1976–1991 and 1992–2015 were considered as the climate and human-induced period during which intensifying climate variation and human activities resulted in obvious perturbations of the runoff. Therefore, the period was divided into three durations: 1960–1975, 1976–1991, and 1992–2015.
5.3. Precipitation–Runoff Relationship
Changes in the runoff due to climate variations and human activities have been shown to be sensitive to variations in the precipitation [
44]. Linear and correlation relationships between annual precipitation and annual runoff were used to identify the relationship between precipitation and runoff variations. The correlation between the precipitation and runoff was good in both watersheds, where the correlation coefficient was 0.5–0.75 (at a significance level of 0.05). In the Syrdarya River Basin, the natural land cover has been significantly changed by the increase of population, large-scale agricultural development, and water construction activities since the mid-1960s [
45].
To separate and quantify the effect of climate variation from human activities on runoff, the baseline period was defined as prior to 1975. In 1960–1975, results for precipitation-correlated runoff for the Arys and Keles rivers watersheds was 0.75–0.83, after the 1975 correlations it decreased to 0.5–0.6 (1976–1991). For the period 1992–2015 the correlation coefficient was 0.5–0.81. These results show that the runoff was dramatically impacted by the water-related human activities (e.g., intensive land use change, agricultural irrigation, river engineering) after 1975 in the Arys and Keles rivers watersheds.
5.4. Effects of Climate Change and Human Activities on Runoff
Determining the sensitivity of runoff to climate variation still remains a difficult problem in hydrology, due to the combined feedback between climate, land-use changes, soil water capacity, and soil hydrologic conductivity [
46]. Precipitation, potential evaporation, and aridity index, as the typical indicators for representing the interaction between water and heat limitation on runoff, could be used to estimate the impact of climate variation on runoff in study areas.
For both watersheds, the hydrologic sensitivity analysis method provided approximate estimates of the change in the runoff for change periods induced by climate variation and human activities. The quantitative assessment showed that human activities played a negative effect on runoff in two watersheds (
Table 3). The results showed that the percentage changes in the runoff due to human activities were 91.1%–95.5% (Arys River Watershed) and 80%–91.3% (Keles River Watershed) for 1976–1991, while climate variation only accounted for 4.5%–18.9% and 8.7%–20%, respectively. However, the impact of climate variability appeared to become stronger from 4.5%–20% to 52.6%–66.4% (Arys River Watershed) and 56.3%–72.2% (Keles River Watershed) during 1992–2015, which may be due to the strengthening of climate variation in the 1990s in both watersheds. The result showed that runoff in these watersheds was more sensitive to climate variability after 1991.
In the period 1976–1991, a decrease in runoff was found in both watersheds. Furthermore, human activity played a big and negative role in reducing runoff. Then, as the influence of climate was not observed at all, the precipitation rates at this time did not change or were less than in the baseline period. The subsequent 1992–2015 period shows an increase in climate influence. Precipitation has increased in comparison with the base period. At the same time, human activity decreased, but it remained at the same level downstream of the Keles River watershed. All this had a positive response to the runoff, which generally led to an increase in runoff. Nevertheless, in the 1976–2015 period, human activity was prevalent.
6. Discussion
6.1. Climate Variation and its Impact on Runoff
Climate variation and human activity are two prevailing factors that influence runoff variation. Several studies reported an increase in precipitation [
16] and in PET [
47,
48] in the Aral Sea basin and the Syrdarya River Basin. Overall, our findings showed similar trends in precipitation and PET for both watersheds. However, the results showed that the precipitation during the last 55 years increased by an insignificant level in the Keles and Arys Rivers’ watersheds. Some studies describe that Global warming, southward shift, and intensification of the westerly cyclones and the associated changes of water vapor at the middle latitudes are likely the major factors that increase the precipitation over Central Asia [
49,
50].
Based on estimated changes in runoff due to climate variation and human activities, we found the runoff was sensitive to the quantity of precipitation. When precipitation was less than average, the surface runoff was reduced and would also spur human activities in these regions. Moreover, when precipitation was more than average, the runoff showed a positive value. In addition, precipitation and runoff had a strong and good positive correlation. Runoff in watersheds increased by 3–4 mm due to climate variation in 1991–2015. Thus, it can be seen that precipitation plays a significative role in runoff variation for watersheds.
6.2. Human Activity and its Impact on Runoff
In both watersheds, human activities played a dominant role in runoff decline and the impact in 1976–1991 was much larger than that of other periods.
Land cover/use in the Arys River watershed has changed substantially since 1967, with the construction of the Arys–Turkestan water channel. The river watershed is provided by 57 thousand hectares of irrigated land available in Ordabasy, Otyrar districts and the Turkestan city (Kazakhstan) [
51]. Moreover, the Keles River flows into the Chirchik–Akhangaran–Keles irrigation area (67.5 thousand hectares of irrigated land in the Kazakhstan part). In the 1970s, the irrigation area increased three times, which led to an increase in water intake [
52].
Table 4 shows the changes in the main types of land cover/use in the Arys River and Keles River Watersheds.
According to the table, the grass land type showed a sharp decline during the 1994 and 2012 periods by 5% and 16% in the Arys River watershed and by 47% and 28% in the Keles River watershed when compared with that of 1976, while the irrigated land and built-up land had an increasing trend. The increasing built-up land reveals an increasing water demand in domestic and industry that could aggravate the conflict in water supply and demand. In addition, with the rapid growth of population in the Aral Sea Basin and the Syrdarya Basin, the area of irrigated land expanded. The area of irrigated land in 2015 increased by more than 31% (Arys watershed) and 15.1% (Keles watershed) than that of 1976.
Since 1992, after the dissolution of the Soviet Union, due to the restructuring of state and collective farms into small farms, there has been a decrease in irrigated land [
53] and water intake for irrigation has been reduced, respectively. But, in the future, there planned to increase irrigated land in these areas. Also, the population of both watersheds is rising [
54]. Moreover, the increasing water demand for agriculture irrigation and for populated areas would consequently increase water consumption.
The change of runoff was closely related to human activity. However, climate variation also played an important role in runoff change. In reality, land use/cover can be influenced by both climate variation and human activities and climate variation can also be affected by human activities.
6.3. Uncertainties Analysis
There are various uncertainties in the hydrologic sensitivity analysis method in assessing the effects of climate variation and human activities on runoff. The hydrologic sensitivity analysis method is based on the data for a long-term period hydro–meteorological observation data without the effects of human activities. In actuality, there were only 55 years of observation data in watersheds, and even during the baseline period (1960–1976), there may be some human disturbances, such as water construction and irrigation. Also, the limited number and distribution of hydro–meteorological stations may affect the simulation accuracy of the hydro–climatic variables (such as P, PET, and AET). Furthermore, the method expects that climate variation and human activities are independent of each other. However, climate variation may influence human activities such as land use, and human activities such as extensive urbanization and expanded population may cause changes in climate (water). Despite the uncertainties and limitations, this study led the understanding of the sensitivity of runoff to climate variation and human activities in the Arys River and Keles River watersheds, where water is pointed for development of the arid land. Finally, further study will be carried out on the estimation of these uncertainties in our future studies to improve the results.
7. Conclusions
This study investigated the impacts of climatic variation and human activity on a 55-yeartrend of runoff in two river watersheds, Arys and Keles, in Kazakhstan. This work applied the hydrologic sensitivity analysis method to identify these effects. We found an upward trend in the rivers’ watershed’s runoff, but at an insignificant level. Through Pettitt’s test and the DCC method, an abrupt change point in annual runoff was identified in the studied areas, which occurred in the years between 1975 and 1991 dividing the long-term hydrologic series into a baseline period (1960–1975) and a climate and human-induced period (1975–1991 and 1992–2015).
The contribution of climate variation and human activities varied temporally. The hydrologic sensitivity analysis method estimated the effects of climate variation and human activities on runoff in 1960–2015, indicating that human activities were the main factor that decreased runoff with the contribution of 54%–78% during 1975–2015, while climate change only accounted for 15%–45%. However, the impact of climate change increased from 2.5%–20% to 52.5%–54.2% (Arys River Watershed) and 56.3%–72.2% (Keles River Watershed) during 1992–2015.
This study sheds light on the understanding of the felling of runoff to climate variation and human activities in the watersheds, where water is crucial for agriculture and the water geosystem. The results of the present work can supply a reference to regional water resources management and planning.
Author Contributions
Conceptualization: S.B. and J.A.; Methodology, Formal Analysis, Visualization and Writing–Original Draft Preparation: S.B. and D.S.; Investigation: D.S. and A.S.; Supervision and Project Administration: J.A.
Funding
This research was funded and supported by the National Natural Science Foundation of China (U1603242), Science and Technology Service Network Initiative Program of Chinese Academy of Sciences (KFJ-STS-QYZD-071), the Training Program for Youth Innovative Talents in Science and Technology in Xinjiang (QN2016BS0052), CAS “Light of West China” Program (2017–XBQNXZ–B–012), the Foundation of State Key Laboratory of Desert and Oasis Ecology, Xinjiang Institute of Ecology and Geography Chinese Academy of Sciences. Authors acknowledge the support received from all the organizations for present study.
Conflicts of Interest
The authors declare no conflict of interest.
References
- Ohana–Levi, N.; Karnieli, A.; Egozi, R.; Givati, A.; Peeters, A. Modeling the effects of land–cover change on rainfall–runoff relationships in a semiarid, eastern mediterranean watershed. Adv. Meteorol. 2015, 2015. [Google Scholar] [CrossRef]
- Ljungqvist, F.C.; Krusic, P.J.; Sundqvist, H.S.; Zorita, E.; Brattström, G.; Frank, D. Northern Hemisphere hydroclimate variability over the past twelve centuries. Nature 2016, 532, 94. [Google Scholar] [CrossRef] [PubMed]
- Adam, J.C.; Hamlet, A.F.; Lettenmaier, D.P. Implications of global climate change for snowmelt hydrology in the twenty–first century. Hydrol. Processes Int. J. 2009, 23, 962–972. [Google Scholar] [CrossRef]
- Milly, P.C.D.; Dunne, K.A.; Vecchia, A.V. Global pattern of trends in streamflow and water availability in a changing climate. Nature 2005, 438, 347. [Google Scholar] [CrossRef] [PubMed]
- IPCC. Climate Change 2007–the Physical Science Basis: Working Group I Contribution to the Fourth Assessment Report of the IPCC; Solomon, S., Qin, D., Manning, M., Averyt, K., Marquis, M., Eds.; Cambridge University Press: Cambridge, UK, 2007. [Google Scholar]
- Mango, L.M.; Melesse, A.M.; McClain, M.E.; Gann, D.; Setegn, S.G. Land use and climate change impacts on the hydrology of the upper Mara River Basin, Kenya: Results of a modeling study to support better resource management. Hydrol. Earth Syst. Sci. 2011, 15, 2245–2258. [Google Scholar] [CrossRef]
- Mishra, V.; Cherkauer, K.A.; Niyogi, D.; Lei, M.; Pijanowski, B.C.; Ray, D.K.; Bowling, L.C.; Yang, G. A regional scale assessment of land use/land cover and climatic changes on water and energy cycle in the upper Midwest United States. Int. J. Clim. 2010, 30, 2025–2044. [Google Scholar] [CrossRef]
- Zhang, Y.; Guan, D.; Jin, C.; Wang, A.; Wu, J.; Yuan, F. Analysis of impacts of climate variability and human activity on streamflow for a river basin in northeast China. J. Hydrol. 2011, 410, 239–247. [Google Scholar] [CrossRef]
- Zhan, C.; Xu, Z.; Ye, A.; Su, H. LUCC and its impact on run–off yield in the Bai River catchment—Upstream of the Miyun Reservoir basin. J. Plant Ecol. 2011, 4, 61–66. [Google Scholar] [CrossRef]
- Wang, J.; Hong, Y.; Gourley, J.; Adhikari, P.; Li, L.; Su, F. Quantitative assessment of climate change and human impacts on long–term hydrologic response: A case study in a sub–basin of the Yellow River, China. Int. J. Climatol. 2010, 30, 2130–2137. [Google Scholar] [CrossRef]
- Döll, P.; Zhang, J. Impact of climate change on freshwater ecosystems: A global–scale analysis of ecologically relevant river flow alterations. Hydrol. Earth Syst. Sci. 2010, 14, 783–799. [Google Scholar] [CrossRef]
- CAREWIB. Assessment of Water Resources and Riverbed Balance of the Syr Darya River within the Republic of Kazakhstan; CAREWIB: Tashkent, Uzbekistan; Almaty, Kazakhstan, 2011. [Google Scholar]
- Qi, J.; Bobushev, T.S.; Kulmatov, R.; Groisman, P.; Gutman, G. Addressing global change challenges for Central Asian socio–ecosystems. Front. Earth Sci. 2012, 6, 115–121. [Google Scholar] [CrossRef]
- Issanova, G.; Abuduwaili, J. Aeolian Processes in the Arid Territories of Central Asia and Kazakhstan; Springer: Berlin/Heidelberg, Germany, 2017. [Google Scholar]
- Yin, G.; Hu, Z.; Chen, X.; Tiyip, T. Vegetation dynamics and its response to climate change in Central Asia. J. Arid Land 2016, 8, 375–388. [Google Scholar] [CrossRef]
- Yao, J.; Chen, Y. Trend analysis of temperature and precipitation in the Syr Darya Basin in Central Asia. Theor. Appl. Climatol. 2015, 120, 521–531. [Google Scholar] [CrossRef]
- Zou, S.; Jilili, A.; Duan, W.; Maeyer, P.D.; de Voorde, T. Van Human and Natural Impacts on the Water Resources in the Syr Darya River Basin, Central Asia. Sustainability 2019, 11, 3084. [Google Scholar] [CrossRef]
- Savitskiy, A.G.; Schlüter, M.; Taryannikova, R.V.; Agaltseva, N.A.; Chub, V.E. Current and future impacts of climate change on river runoff in the Central Asian river basins. In Adaptive and Integrated Water Management; Pahl–Wostl, C., Kabat, P., Möltgen, J., Eds.; Springer: Berlin/Heidelberg, Germany, 2008. [Google Scholar]
- Nezlin, N.P.; Kostianoy, A.G.; Lebedev, S.A. Interannual variations of the discharge of Amu Darya and Syr Darya estimated from global atmospheric precipitation. J. Mar. Syst. 2004, 47, 67–75. [Google Scholar] [CrossRef]
- Dukhovny, V.A.; de Schutter, J. Water in Central Asia: Past, Present, Future; CRC Press: Boca Raton, FL, USA, 2011. [Google Scholar]
- Kostianoy, A.G.; Kosarev, A.N. The Aral Sea Environment; Kostianoy, A.G., Kosarev, A.N., Eds.; Springer: Berlin/Heidelberg, Germany, 2010. [Google Scholar]
- Ayagan, B.G. Kazakhstan National Encyclopedia; Kazak Encyclopedias: Alamaty, Kazakhstan, 2004. [Google Scholar]
- Makhmudov, I.E.; Makhmudova, D.E.; Muradov, N. Assessment of the Chirchik and Akhangaran river basins potential to improve the efficiency of the rivers use on the territory of the Republic of Uzbekistan. In Water Conservation, Land Reclamation and Hydraulic Structures as the Basis for the Formation of Agricultural Clusters of Russia in the XXI Century; State Architectonic Building University: Tyumen, Russia, 2016. [Google Scholar]
- Harris, I.; Jones, P.D.; Osborn, T.J.; Lister, D.H. Updated high–resolution grids of monthly climatic observations–the CRU TS3. 10 Dataset. Int. J. Climatol. 2014, 34, 623–642. [Google Scholar] [CrossRef]
- Guo, H.; Bao, A.; Liu, T.; Ndayisaba, F.; Jiang, L.; Kurban, A.; De Maeyer, P. Spatial and temporal characteristics of droughts in Central Asia during 1966–2015. Sci. Total Environ. 2018, 624, 1523–1538. [Google Scholar] [CrossRef]
- Deng, H.; Chen, Y. Influences of recent climate change and human activities on water storage variations in Central Asia. J. Hydrol. 2017, 544, 46–57. [Google Scholar] [CrossRef]
- State Water Cadastre. Surface Water. Long–Term Data on the Regime and Resources of the Land Surface Waters. Part 1. Rivers and Canals. Issue 13.; GWK: Leningrad, Russian, 1986. [Google Scholar]
- State Water Cadastre. Annual Data on the Regime and Resources of the Land Surface Waters. By Series: Republic of Kazakhstan. Issue 3. The Basin of the Syrdarya, Chu and Talas Rivers; GWK: Leningrad, Russian, 2012. [Google Scholar]
- Mann, H.B. Nonparametric tests against trend. Econom. J. Econom. Soc. 1945, 13, 245–259. [Google Scholar] [CrossRef]
- Kendall, M.G. Rank Correlation Methods; Griffin: Oxford, UK, 1955. [Google Scholar]
- Yue, S.; Wang, C.Y. Applicability of prewhitening to eliminate the influence of serial correlation on the Mann-Kendall test. Water Resour. Res. 2002, 38, 1–4. [Google Scholar] [CrossRef]
- Helsel, D.R.; Hirsch, R.M. Statistical Methods in Water Resources; Elsevier: Amsterdam, The Netherlands, 1992. [Google Scholar]
- Von Storch, H. Misuses of statistical analysis in climate research. In Analysis of Climate Variability; Springer: Berlin/Heidelberg, Germany, 1999. [Google Scholar]
- Pettitt, A.N. A non–parametric approach to the change–point problem. Appl. Stat. 1979, 28, 126–135. [Google Scholar] [CrossRef]
- Verstraeten, G.; Poesen, J.; Demarée, G.; Salles, C. Long-term (105 years) variability in rain erosivity as derived from 10-min rainfall depth data for Ukkel (Brussels, Belgium): Implications for assessing soil erosion rates. J. Geophys. Res. Atmos. 2006, 111. [Google Scholar] [CrossRef]
- Kiely, G.; Albertson, J.D.; Parlange, M.B. Recent trends in diurnal variation of precipitation at Valentia on the west coast of Ireland. J. Hydrol. 1998, 207, 270–279. [Google Scholar] [CrossRef]
- Searcy, J.K.; Hardison, C.H. Double–Mass Curves; US Government Printing Office: Washington, DC, USA, 1960.
- Huo, Z.; Feng, S.; Kang, S.; Li, W.; Chen, S. Effect of climate changes and water-related human activities on annual stream flows of the Shiyang river basin in arid north–west China. Hydrol. Process. Int. J. 2008, 22, 3155–3167. [Google Scholar] [CrossRef]
- Zhang, L.; Dawes, W.R.; Walker, G.R. Response of mean annual evapotranspiration to vegetation changes at catchment scale. Water Resour. Res. 2001, 37, 701–708. [Google Scholar] [CrossRef]
- Milly, P.C.D.; Dunne, K.A. Macroscale water fluxes 2. Water and energy supply control of their interannual variability. Water Resour. Res. 2002, 38, 21–24. [Google Scholar] [CrossRef]
- Li, L.; Zhang, L.; Wang, H.; Wang, J.; Yang, J.; Jiang, D.; Li, J.; Qin, D. Assessing the impact of climate variability and human activities on streamflow from the Wuding River basin in China. Hydrol. Processes Int. J. 2007, 21, 3485–3491. [Google Scholar] [CrossRef]
- Shi, Y.; Zhang, X. Impact of climate change on surface water resource and tendency in the future in the arid zone of northwestern China. Sci. China 1995, 11, 1395–1408. [Google Scholar]
- Chen, Y.; Takeuchi, K.; Xu, C.; Chen, Y.; Xu, Z. Regional climate change and its effects on river runoff in the Tarim Basin, China. Hydrol. Processes Int. J. 2006, 20, 2207–2216. [Google Scholar] [CrossRef]
- Ma, Z.; Kang, S.; Zhang, L.; Tong, L.; Su, X. Analysis of impacts of climate variability and human activity on streamflow for a river basin in arid region of northwest China. J. Hydrol. 2008, 352, 239–249. [Google Scholar] [CrossRef]
- UNECE. Water Quality in the Amudarya and Syrdarya River Basins; UNECE: Geneva, Switzerland, 2011. [Google Scholar]
- Wu, J.; Wang, Z.; Dong, Z.; Tang, Q.; Lv, X.; Dong, G. Analysis of Natural Streamflow Variation and Its Influential Factors on the Yellow River from 1957 to 2010. Water 2018, 10, 1155. [Google Scholar] [CrossRef]
- Lioubimtseva, E. Impact of climate change on the Aral Sea and its basin. In The Aral Sea; Springer: Berlin/Heidelberg, Germany, 2014. [Google Scholar]
- Shibuo, Y.; Jarsjö, J.; Destouni, G. Hydrological responses to climate change and irrigation in the Aral Sea drainage basin. Geophys. Res. Lett. 2007, 34. [Google Scholar] [CrossRef]
- Chen, F.; Huang, W.; Jin, L.; Chen, J.; Wang, J. Spatiotemporal precipitation variations in the arid Central Asia in the context of global warming. Sci. China Earth Sci. 2011, 54, 1812–1821. [Google Scholar] [CrossRef]
- Lioubimtseva, E.; Cole, R. Uncertainties of climate change in arid environments of Central Asia. Rev. Fish. Sci. 2006, 14, 29–49. [Google Scholar] [CrossRef]
- Oralsynkyzy, M.; Abdikerimov, S.; Baymakhanov, K.; Medeuova, K.; Kultasov, B. Problems of water supply in Arys–Turkestan region and ways to solve them. Res. Results 2017, 4, 532–539. [Google Scholar]
- Rubinova, F.E. The Change in the Runoff of the Syr Darya River under the Influence of Water–Economic Construction in Its Basin; Gidrometizdat: Moscow, Russia, 1979. [Google Scholar]
- Amirgaliev, N.A.; Gogol, L.A.; Zheksenbai, E.; Saianov, S.E. Regime of hydrochemical indicators of the Syrdarya River in the conditions of anthropogenic impacts. Ecol. Hydrofauna 2008, 2, 82–91. [Google Scholar]
- Data Division of Kazakhstan. Available online: http://pop–stat.mashke.org (accessed on 5 May 2019).
© 2019 by the authors. Licensee MDPI, Basel, Switzerland. This article is an open access article distributed under the terms and conditions of the Creative Commons Attribution (CC BY) license (http://creativecommons.org/licenses/by/4.0/).


