Article

The Prediction and Assessment of the Impacts of Soil Sealing on Agricultural Land in the North Nile Delta (Egypt) Using Satellite Data and GIS Modeling

1
National Authority for Remote Sensing and Space Sciences (NARSS), 1564 Alf Maskan, Cairo 11614, Egypt
2
Italian National Research Council, C.da Santa Loja, Tito Scalo, 85050 Potenza, Italy
3
School of Engineering, University of Basilicata, 85100 Potenza, Italy
4
Geography Department, King Saud University, 11451 Riyadh, Saudi Arabia
*
Author to whom correspondence should be addressed.
Sustainability 2019, 11(17), 4662; https://doi.org/10.3390/su11174662
Submission received: 8 May 2019 / Revised: 29 July 2019 / Accepted: 18 August 2019 / Published: 27 August 2019
(This article belongs to the Special Issue Smart Urban Planning and Land Management)

Abstract

:
Soil sealing is currently one of the most critical barriers to sustainable development, particularly in developing countries such as Egypt. Agriculture is a major component of the Egyptian economy and the country’s main source of food security. Urbanization is devouring vast areas of agricultural land, and therefore, in the present study, urbanization was used to determine the degree of soil sealing in a region of Kafr El Sheikh Governorate, Egypt. In this work, remote sensing data were used to monitor changes in land use and land cover (LULC) between 1984 and 2016. A field survey and population data were also used in the analysis. Support vector machine (SVM) classification was used to produce LULC maps of the study area. An accuracy assessment was performed by calculating overall accuracy and individual kappa coefficients. Additionally, soil sealing was assessed using data from 1984 to 2016, and the potential expansion of soil sealing until 2048 was simulated using the cellular automata (CA)–Markov model. Our analysis showed that in the study area (i) about 90% of the soils had soil capability degrees between class II and class III; (ii) soil sealing was not uniformly distributed in the study area; (iii) between 1984 and 2016, the area of soil sealing in fertile soils due to urbanization increased by 19,500 hectares; and (iv) between 1984 and 2000, the urban area increased by around 29%, whereas between 2000 and 2010 it increased by around 43.6%. The results suggest that the magnitude of soil sealing is a good indicator of the soil loss rate and the potential for agricultural development in the Nile Delta. The model predicted that by 2048 an area of 32,290 hectares of agricultural soil will be lost to urbanization. This study indicates that the change of LULC has a negative impact on soil sealing. Between 2000 and 2010, the area of agricultural land decreased by 4%, despite an increase in land reclamation in the north of the study area. The amount of soil sealing was found to increase towards the southeast and northeast of the study area, except for the northern parts, where the amount of soil sealing increased towards the east. Our analyses and forecasts are useful for decision-makers responsible for soil-sealing mitigation strategies and soil-sealing protection plans in the Kafr El Sheikh Governorate, Egypt.

1. Introduction

Soil degradation is the most common issue threatening agricultural development around the world [1,2]. In developing countries such as Egypt, urban expansion is uncontrolled and causes numerous problems such as environmental and social problems [3]. A 2014 United Nations report stated that the urbanization of rural populations is accelerating and the global urban population is expected to grow from 3.9 billion to 6.4 billion by 2050 [4]. Africa and Asia have the world’s largest rural populations, yet are urbanizing faster than any other regions. However, the United States, Eastern China, and Europe are also rapidly urbanizing [5,6,7,8,9]. In developing countries, urban areas are expected to increase to 1,200,000 km2 by 2050, up from 300,000 km2 in the year 2000. However, agricultural soil in developing countries experiencing rapid urbanization has not received sufficient research attention [10,11]. A change in land use has been driven by rapid population growth, particularly in developing countries, which has led to a reduction in the area of agricultural land. The best agricultural land around settlements is lost as the settlements expand, with the agricultural land being converted into more marginal land. Studies have shown that degraded land accounts for around 24% of the total global land area (35 million km2), degraded forest areas account for about 23%, and rangeland accounts for 20–25% [12].
In Egypt, agricultural activities contribute significantly to the national income, and are mainly concentrated in the Nile Valley and Nile Delta regions, which contain some of the most fertile soils in the country. The Nile Valley and Nile Delta represent approximately 4% of Egypt’s territory. Population increase has decreased food availability in Egypt [13,14,15,16]. Therefore, one of the most pressing issues for the Egyptian government is to find solutions to food provision and cope with the loss of agriculturally productive lands that have been transformed into urban land, roads, transport infrastructure, and so on. Soil sealing is one of the most serious factors causing land degradation in Egypt. In Europe, around 3% of the continent has been strongly affected by soil sealing for more than 15 years (mainly during 2000–2006), as discussed in several conferences addressing the definition of mitigation strategies (the Thematic Strategy for Soil Protection 2006; the soil remediation and soil sealing conference 2012) [17]. The increase of urban growth in the Nile Delta has led to a permanent covering of soil in suburbs, which in turn has led to a change in soil properties and restrictions on the exchange of gases, water, and energy. As a result of this, the multiple functions of soil have been obstructed, inhibiting sustainable agricultural development [18].
Many investigations in Egypt have focused on monitoring urbanization in several locations along the Nile Valley and Nile Delta, which once supported about 95% of Egypt’s population. The population distribution in Egypt varies widely across the country [19,20,21,22]. In the territory located between Rosetta and Damietta, an area of about 35,900 hectares was urbanized between 1998 and 2014, with the highest rate of urbanization being recorded between 2011 and 2013 [23]. Remote sensing data have been used to assess the magnitude of the impacts of urban expansion on productive soils in some areas of Upper Egypt between 1984 and 2017. Studies have shown that, during this time period, the area of soil sealing in Qena Governorate was 18,483 hectares, while those in the Al Minya and Beni Suef governorates were 16,704.8 and 12,948 hectares, respectively [24,25,26].
Remote sensing data and GIS tools provide useful, detailed, and up-to-date information about land use and land cover (LULC). For example, freely available Landsat and sentinel earth observation images can be used to obtain a wide range of information about changes in land use and land cover [27,28,29,30,31,32]. The multi-attribute decision method (MADM) allows the comparison of several alternatives by using a set of indicators, and therefore supports decision-making [33].
Many classification methods have been used to distinguish urban areas from agricultural and other land types, such as support vector machines (SVMs), minimum distance, neural networks (NNs), and maximum likelihood (ML) [34,35,36,37]. The cellular automata (CA)–Markov model has been preferred by many researchers due to its ability to distinguish heterogeneous LULC and urban areas. Therefore, this model is considered as one of the most feasible models for simulating future urban encroachment [38].
The CA–Markov model has commonly been used to monitor changes in LULC due to its ability to quantitatively simulate change trends using different data. The model is simple and easy to use, has a pre-defined calibration process that allows the simulation of changes in LULC [39,40].
Muller and Middleton used two representative models for studying LULC, namely the Markov chain (MC) model and the CA–Markov model. The MC is more distinctive due to its ability to integrate remote sensing and GIS techniques, while the CA–Markov model can achieve remarkable results in the integration of spatial emergency information when simulating changes in land cover [41].
The CA–Markov model is based on a stochastic progression that analyzes changes in the probability of certain LULC types occurring over time based on the transition probability matrix [42,43]. Additionally, the CA–Markov model has the advantage of being able to simulate future changes in land cover based on conversion probabilities [44,45,46,47]. The main objectives of the present study were to quantify and evaluate the impacts of soil sealing in Kafr El Sheikh Governorate, North Nile Delta, Egypt, between 1984 and 2016. Furthermore, the CA–Markov model was used to simulate the LULC in 2048 based on observed changes in LULC between 1984 and 2016. The results of this study provide decision-makers with valuable information about the magnitude of soil sealing and how to reduce it as much as possible.

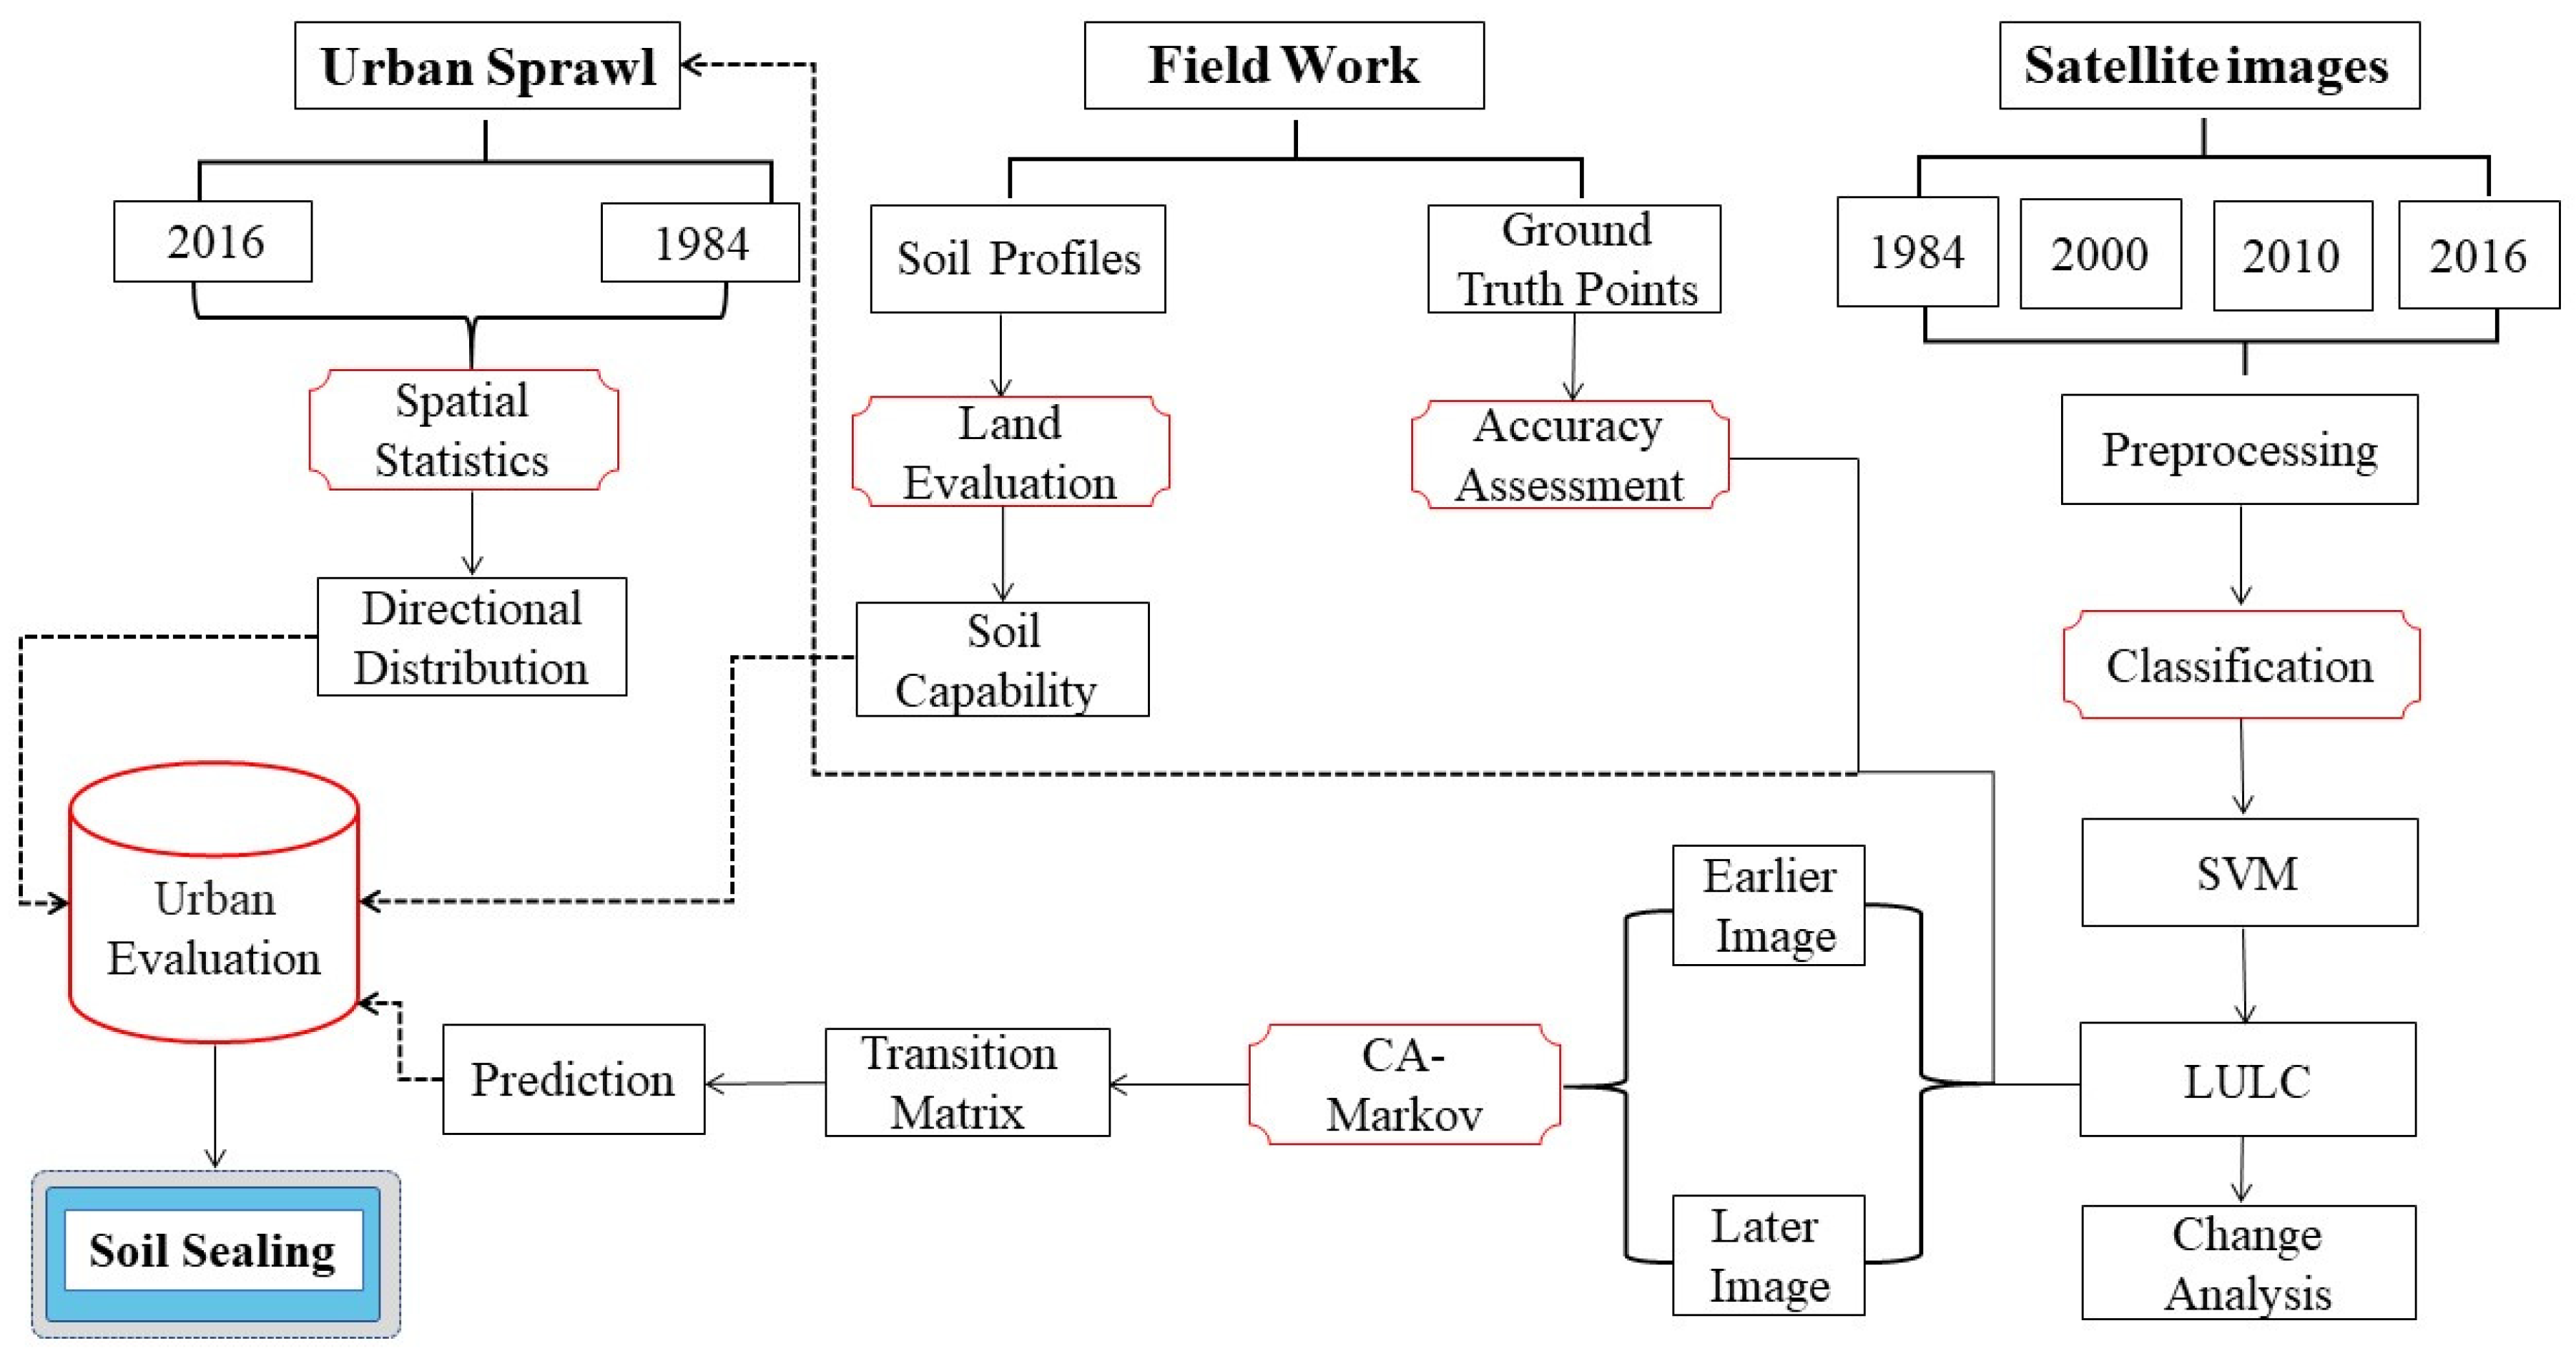
2. Materials and Methods
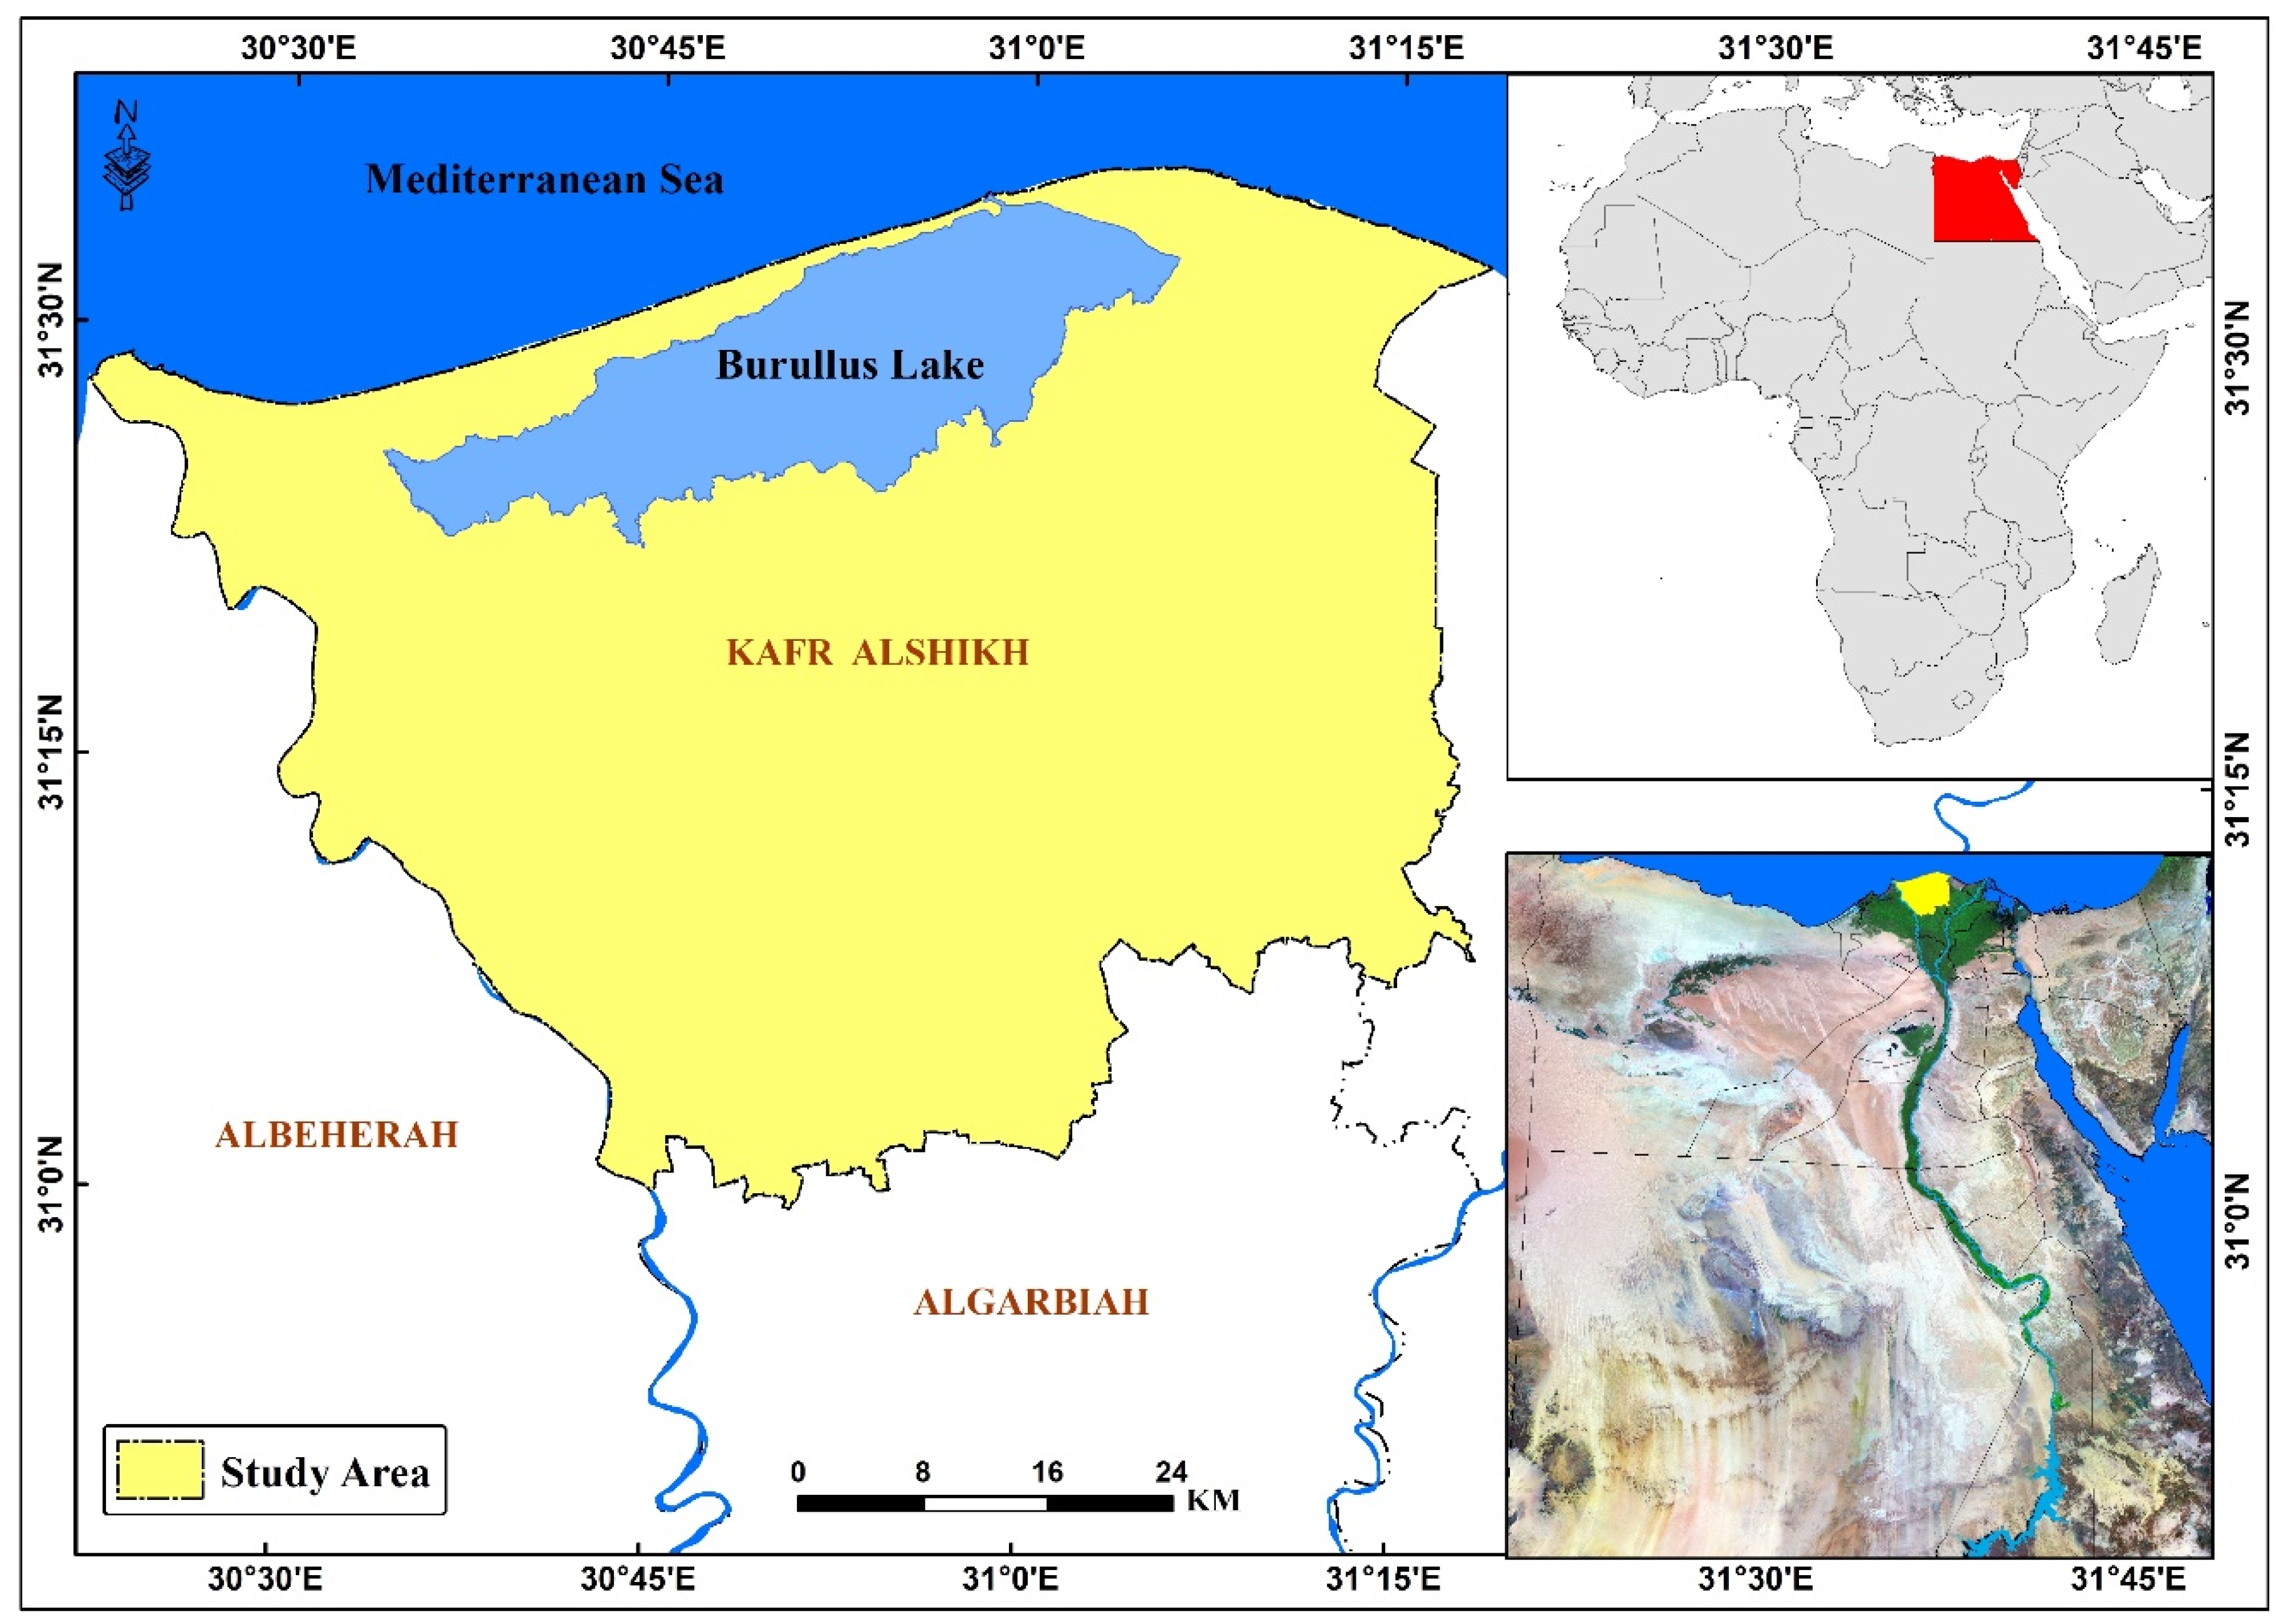
2.1. Study Area

The study area is located in the northern part of the Nile Delta, Egypt. It is located between 30°21′ and 32°5′ E and between 31°00′ and 31°17′ N, and encompasses the Kafr El Sheikh Governorate. The study area covers approximately 3748 km2 (Figure 1) and is characterized by a Mediterranean climate as well as high biodiversity and diverse land uses. The Kafr El Sheikh Governorate is one of the largest governorates in Egypt that invests in fish farm activities. The northern areas of the Kafr El Sheikh Governorate are characterized by high soil salinity and a highly saline water table. Therefore, fish farms are widespread in the northern parts of the study area, especially south of Lake Burullus. The other parts of the study area are used for agricultural activities such as horticulture and field cropping. The study area has three main ecosystems (i.e., alluvial, lacustrine, and marine plains), each of which is characterized by specific physical and chemical properties [48].

2.2. Data Collection and Image Processing
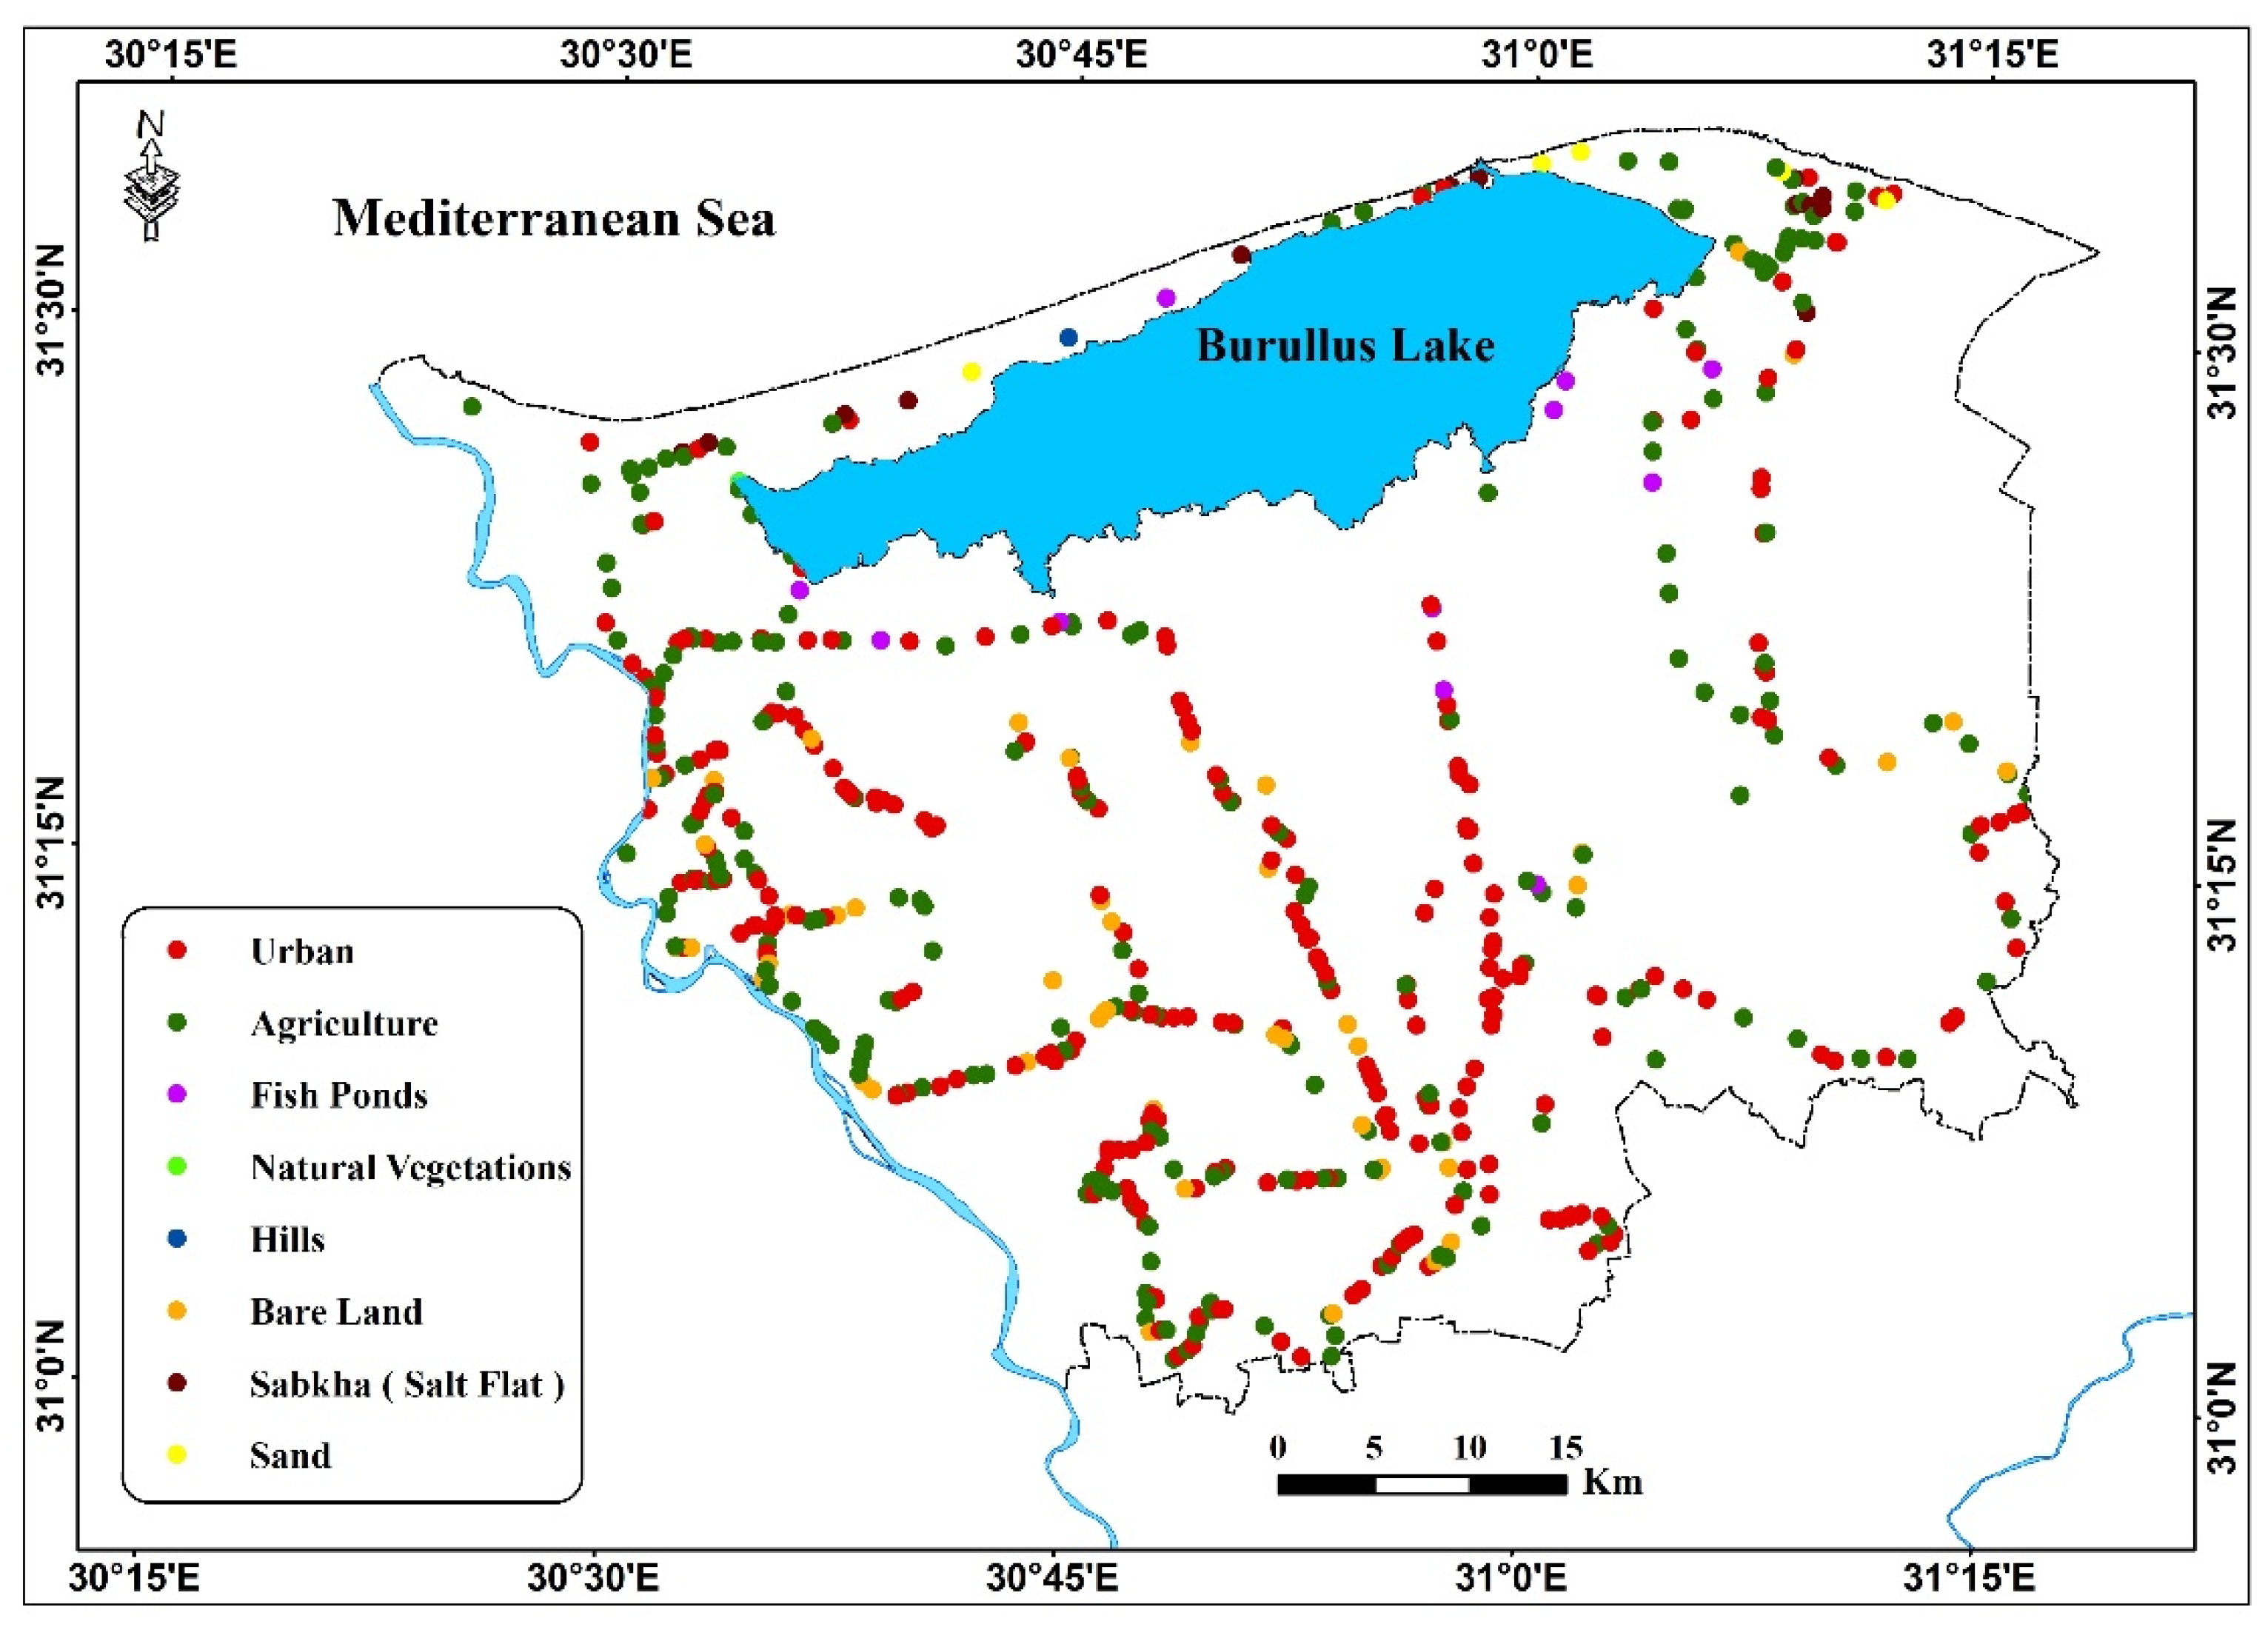
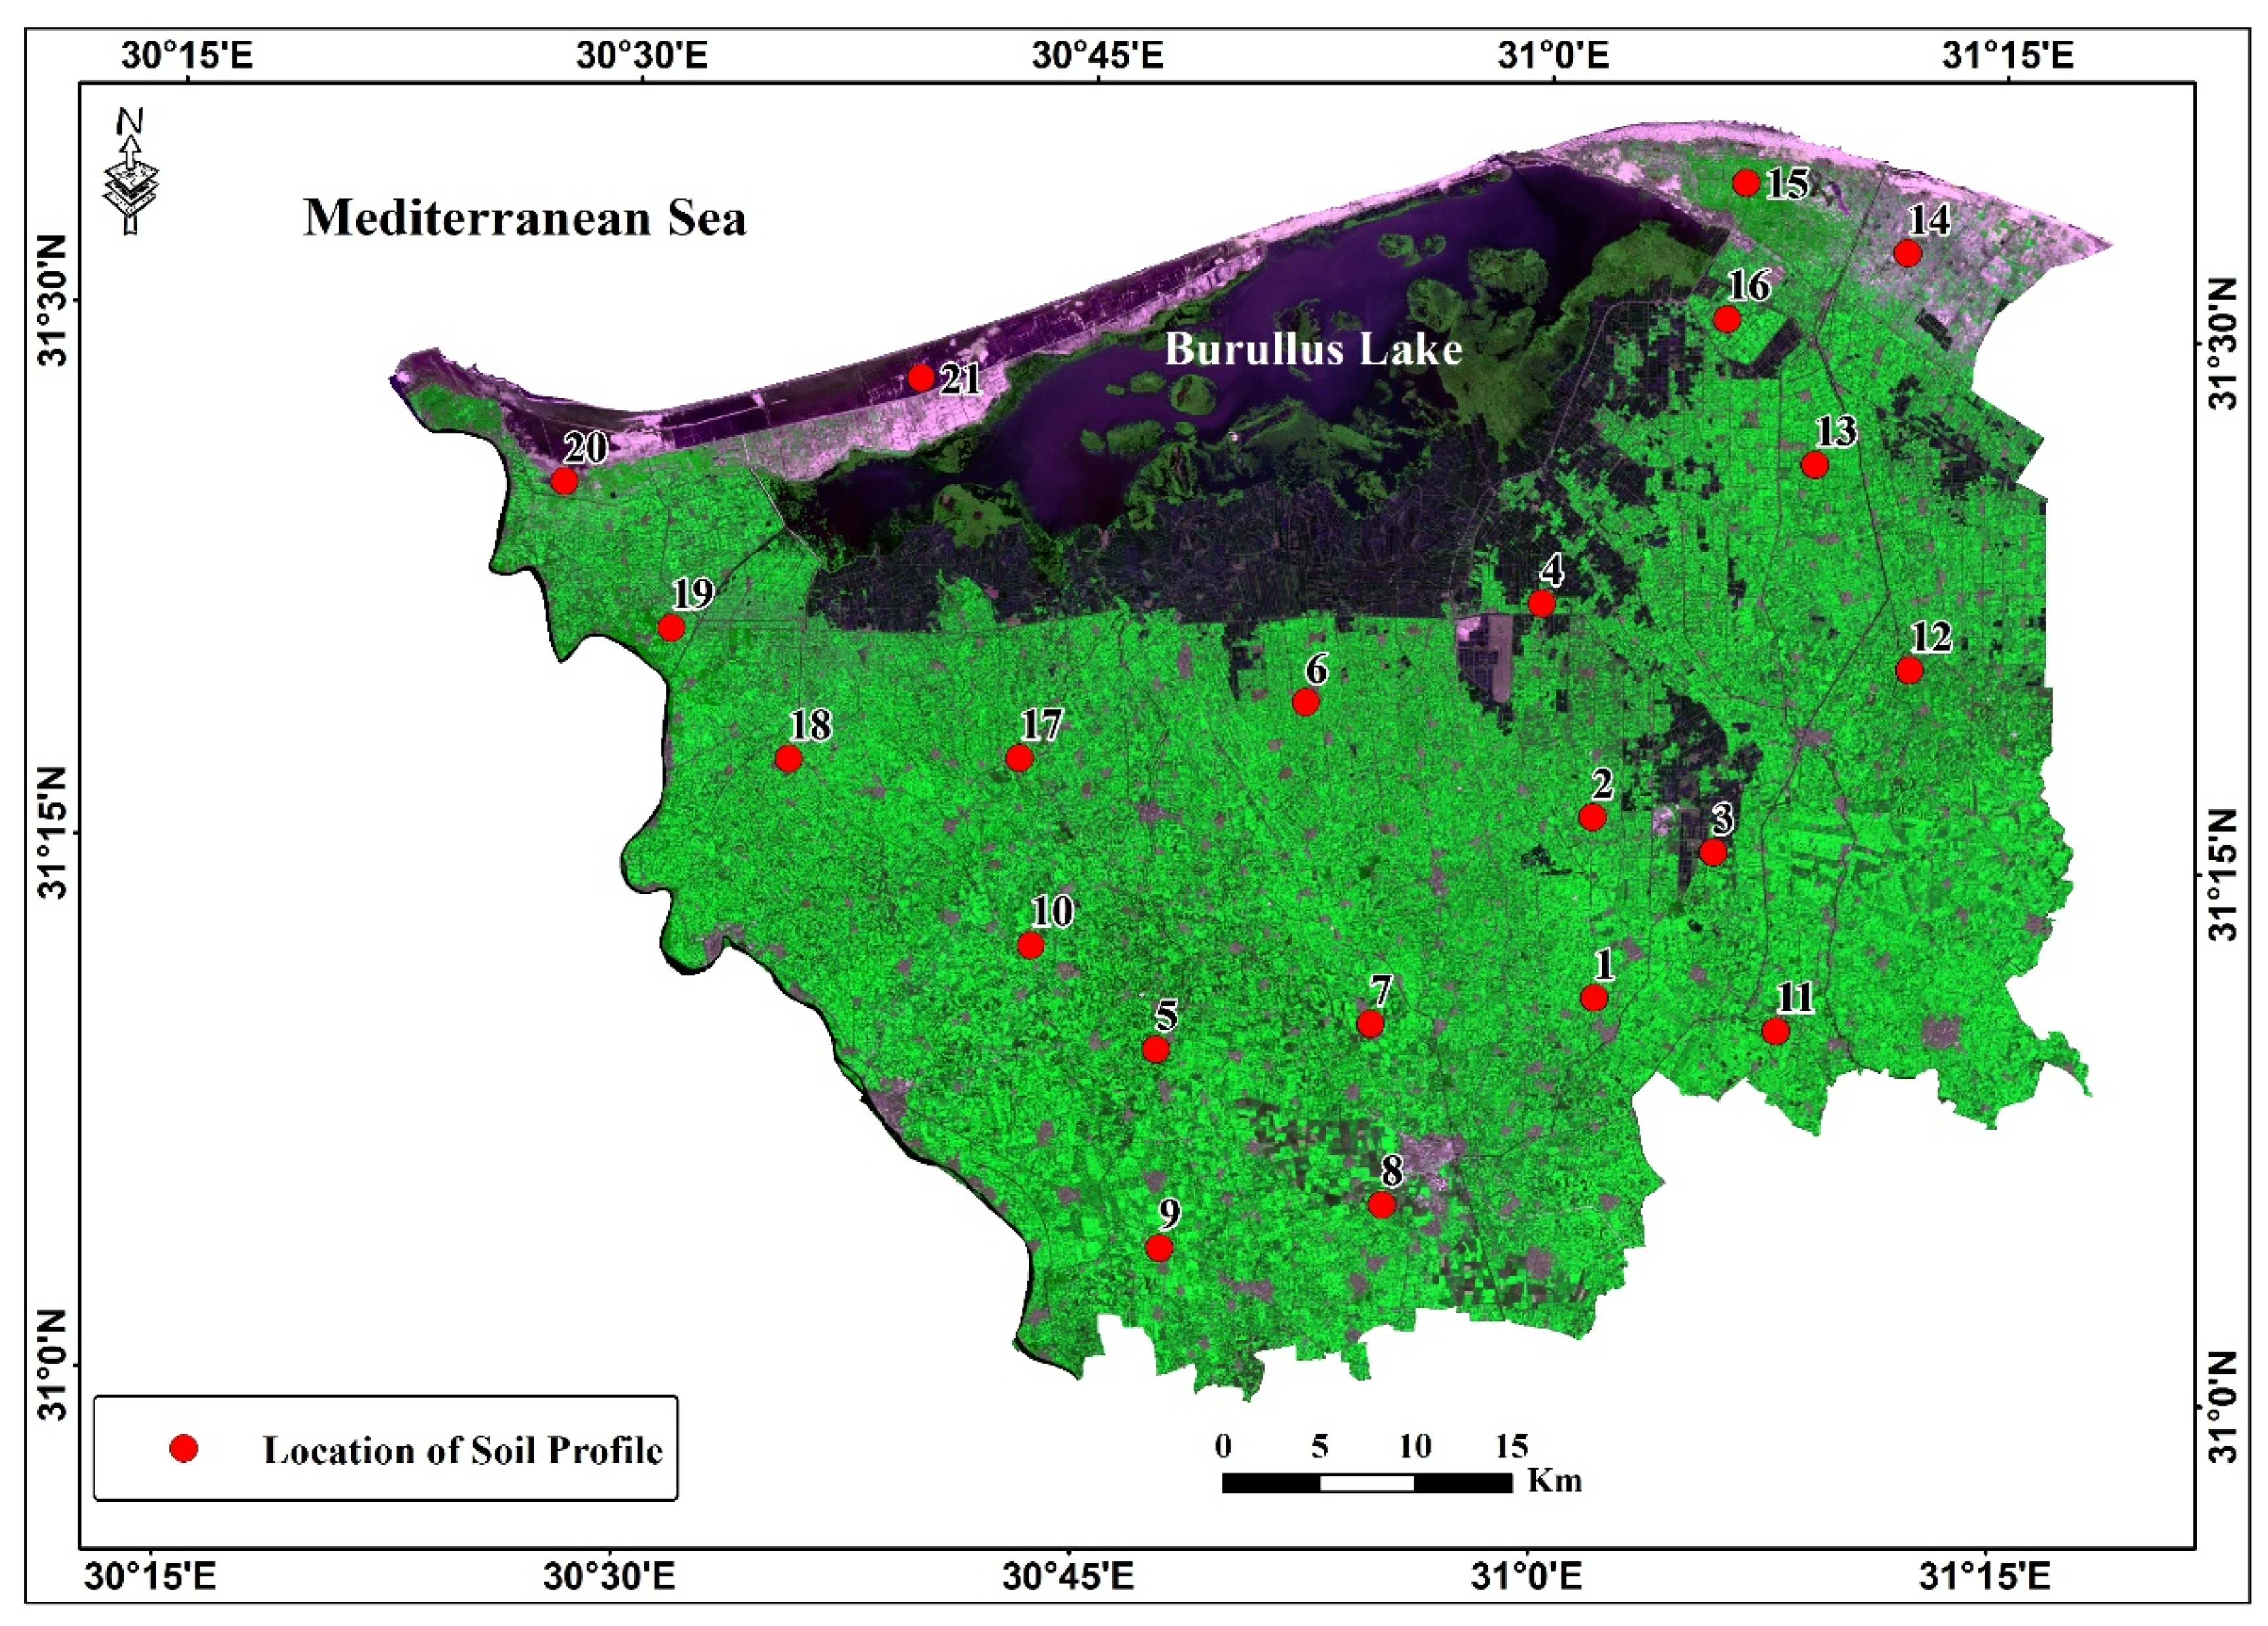
The purpose of soil capability assessment is to determine the effect of sealing processes on soil quality. The soil capability of the study area was studied based on its physical and chemical characteristics. To achieve the purpose of our analysis, the following multi-temporal remote sensing images were used in this study: (i) Landsat Thematic Mapper (TM) images acquired in 1984; (ii) TM images acquired in 2000; (iii) Enhanced TM (ETM) images acquired in 2010; and (iv) operational land imagery (OLI) images acquired in 2016 with a spatial resolution of 30 m. The satellite images were radiometrically and atmospherically corrected [49,50].
In this study, SVMs were used for satellite data processing. SVM is a classification method based on statistical concept theory, which gives reliable classifications in the presence of mixed land use in a dataset. This method is an effective tool to study the complex distribution of LULC classes in the study area. The SVMs that were used to determine LULC were based on the following sigmoid equation [51]:
Sigmoid   K ( x i , x j ) = t a n ( g x x j T x j + r )
where K ( x i , x j ) are kernel functions, g is the gamma term, and r is the bias term in the kernel function for sigmoid kernels.
To ensure the accuracy of estimated changes in LULC, the statistical robustness of the assessment of the accuracy and the estimation of the area of change is a critical issue. The use of reference data is recommended for designing and implementing an accuracy assessment of a map of LULC change and estimating the area over which the change occurred [52]. In this study, an accuracy assessment of the classification was performed for each land use class based on ground-truth points. The overall accuracy and kappa coefficients were calculated for each satellite image in order to assess the accuracy of the classified image according to the following equation [53]:
K = P ( A ) P ( E ) 1 P ( E )
where P ( A ) is the proportion of times that the codes agree, and P ( E ) is the proportion of times that we would intuitively expect them to agree by chance (Figure 2).
A total of 600 ground-truth points, covering all LULC classes in the Kafr El Sheikh Governorate, were used in the analysis. These reference points were split into two groups, with 60% being used as training points for image classification and 40% being used for accuracy assessment (Figure 3).

2.3. Field Survey

A field study was carried out to achieve the objectives of this study. During the field study, 21 soil profiles were dug in different locations selected according to the heterogeneity in the geomorphological characteristics, and 60 soil samples were collected (Figure 4). Additionally, the land use, infrastructure constructions, and other new human activities in the study area were monitored. The soil was analyzed in a soil survey laboratory [54] for the following parameters: bulk density (g/cm3), particle size, electrical conductivity (dS/m), soil pH, organic matter content (%), CaCO3 content (%), and cation exchange capacity (meq/100 g).

2.4. Evaluation of Soil Capability

Soil capability was evaluated by the analysis of chemical and physical properties such as texture, pH, and available water holding capacity. Capability ratings are numbers that reflect the relative values of physical and chemical properties of soils and the effect of these properties on the productivity of the most commonly grown crops [55].

2.5. CA–Markov Model

The CA–Markov model is frequently used to simulate temporal changes in the spatial distribution of LULC due to its ability to integrate spatial data from satellite images and topographic maps [56]. The output of Markov chain analysis is a transition probability matrix between times t1 and t2 that indicates the probability of change in LULC from one period to another. However, the lack of a spatial dimension is one of the major limitations of Markov chain analysis, and it cannot identify the spatial distribution of occurrences within each LULC category [57].
Additionally, CA methods are very efficient tools for simulating complex spatial processes based on simple decision rules. The CA–Markov model is a combination of a CA filter and a Markov chain procedure. Changes in land use are predicted using the following equations [58]:
S ( t + 1 ) = P i j × S ( t )
where S ( t ) and S ( t + 1 ) are the system statuses at time t and t + 1 , respectively, and P i j is the transition probability matrix in a state, which is calculated as follows:
P i j = [ P 11 P 21 P n 1 P 12 P 22 P n 2 P 1 n P 2 n P n n ]
where ( 0 P i j < 1   a n d   j = 1 N P i j = 1 , ( i , j = 1 , 2 , , n ) ) .
The transitional probability matrix contains the probability that each LULC category will change to each other category, whereas the transitional area matrix contains the number of pixels that are expected to be converted from one LULC category to other categories over a specific period of time [59]. The present study used transition area matrices and thematic maps derived from the MC. We used a 1984 LULC map to obtain base land-cover data in the CA–Markov module of the IDRISI software and cellular automata. Transition probability matrices were calculated for the periods 1984–2000, 2000–2010, and 2010–2016 in order to simulate the 2016 LULC map so that this map could be compared with the simulated LULC map for 2048 to examine the model performance.
Furthermore, a simulation model for soil sealing was developed for the study area using the CA–Markov model in the IDRISI software. This simulation model simulates changes in LULC between 1984 and 2016 and then extrapolates the expected results to 2048 [14]. The cellular automata (CA)–Markov model can effectively simulate temporal dynamic changes in LULC by using transition probability matrices for land use during 1984, 2010, and 2016. Furthermore, we estimated the kappa coefficient to justify the agreement between the simulation and the actual data. After successfully validating the simulated data using the actual data, we obtained the LULC prediction for 2048.
The changes in the spatial dynamics of soil sealing were found to be controlled by the local factors of population density, socioeconomic conditions, and neighborhood configuration and transition probabilities. Additionally, remote sensing data and GIS were used to determine the model probabilities and define the neighborhood objects.

3. Results and Discussions

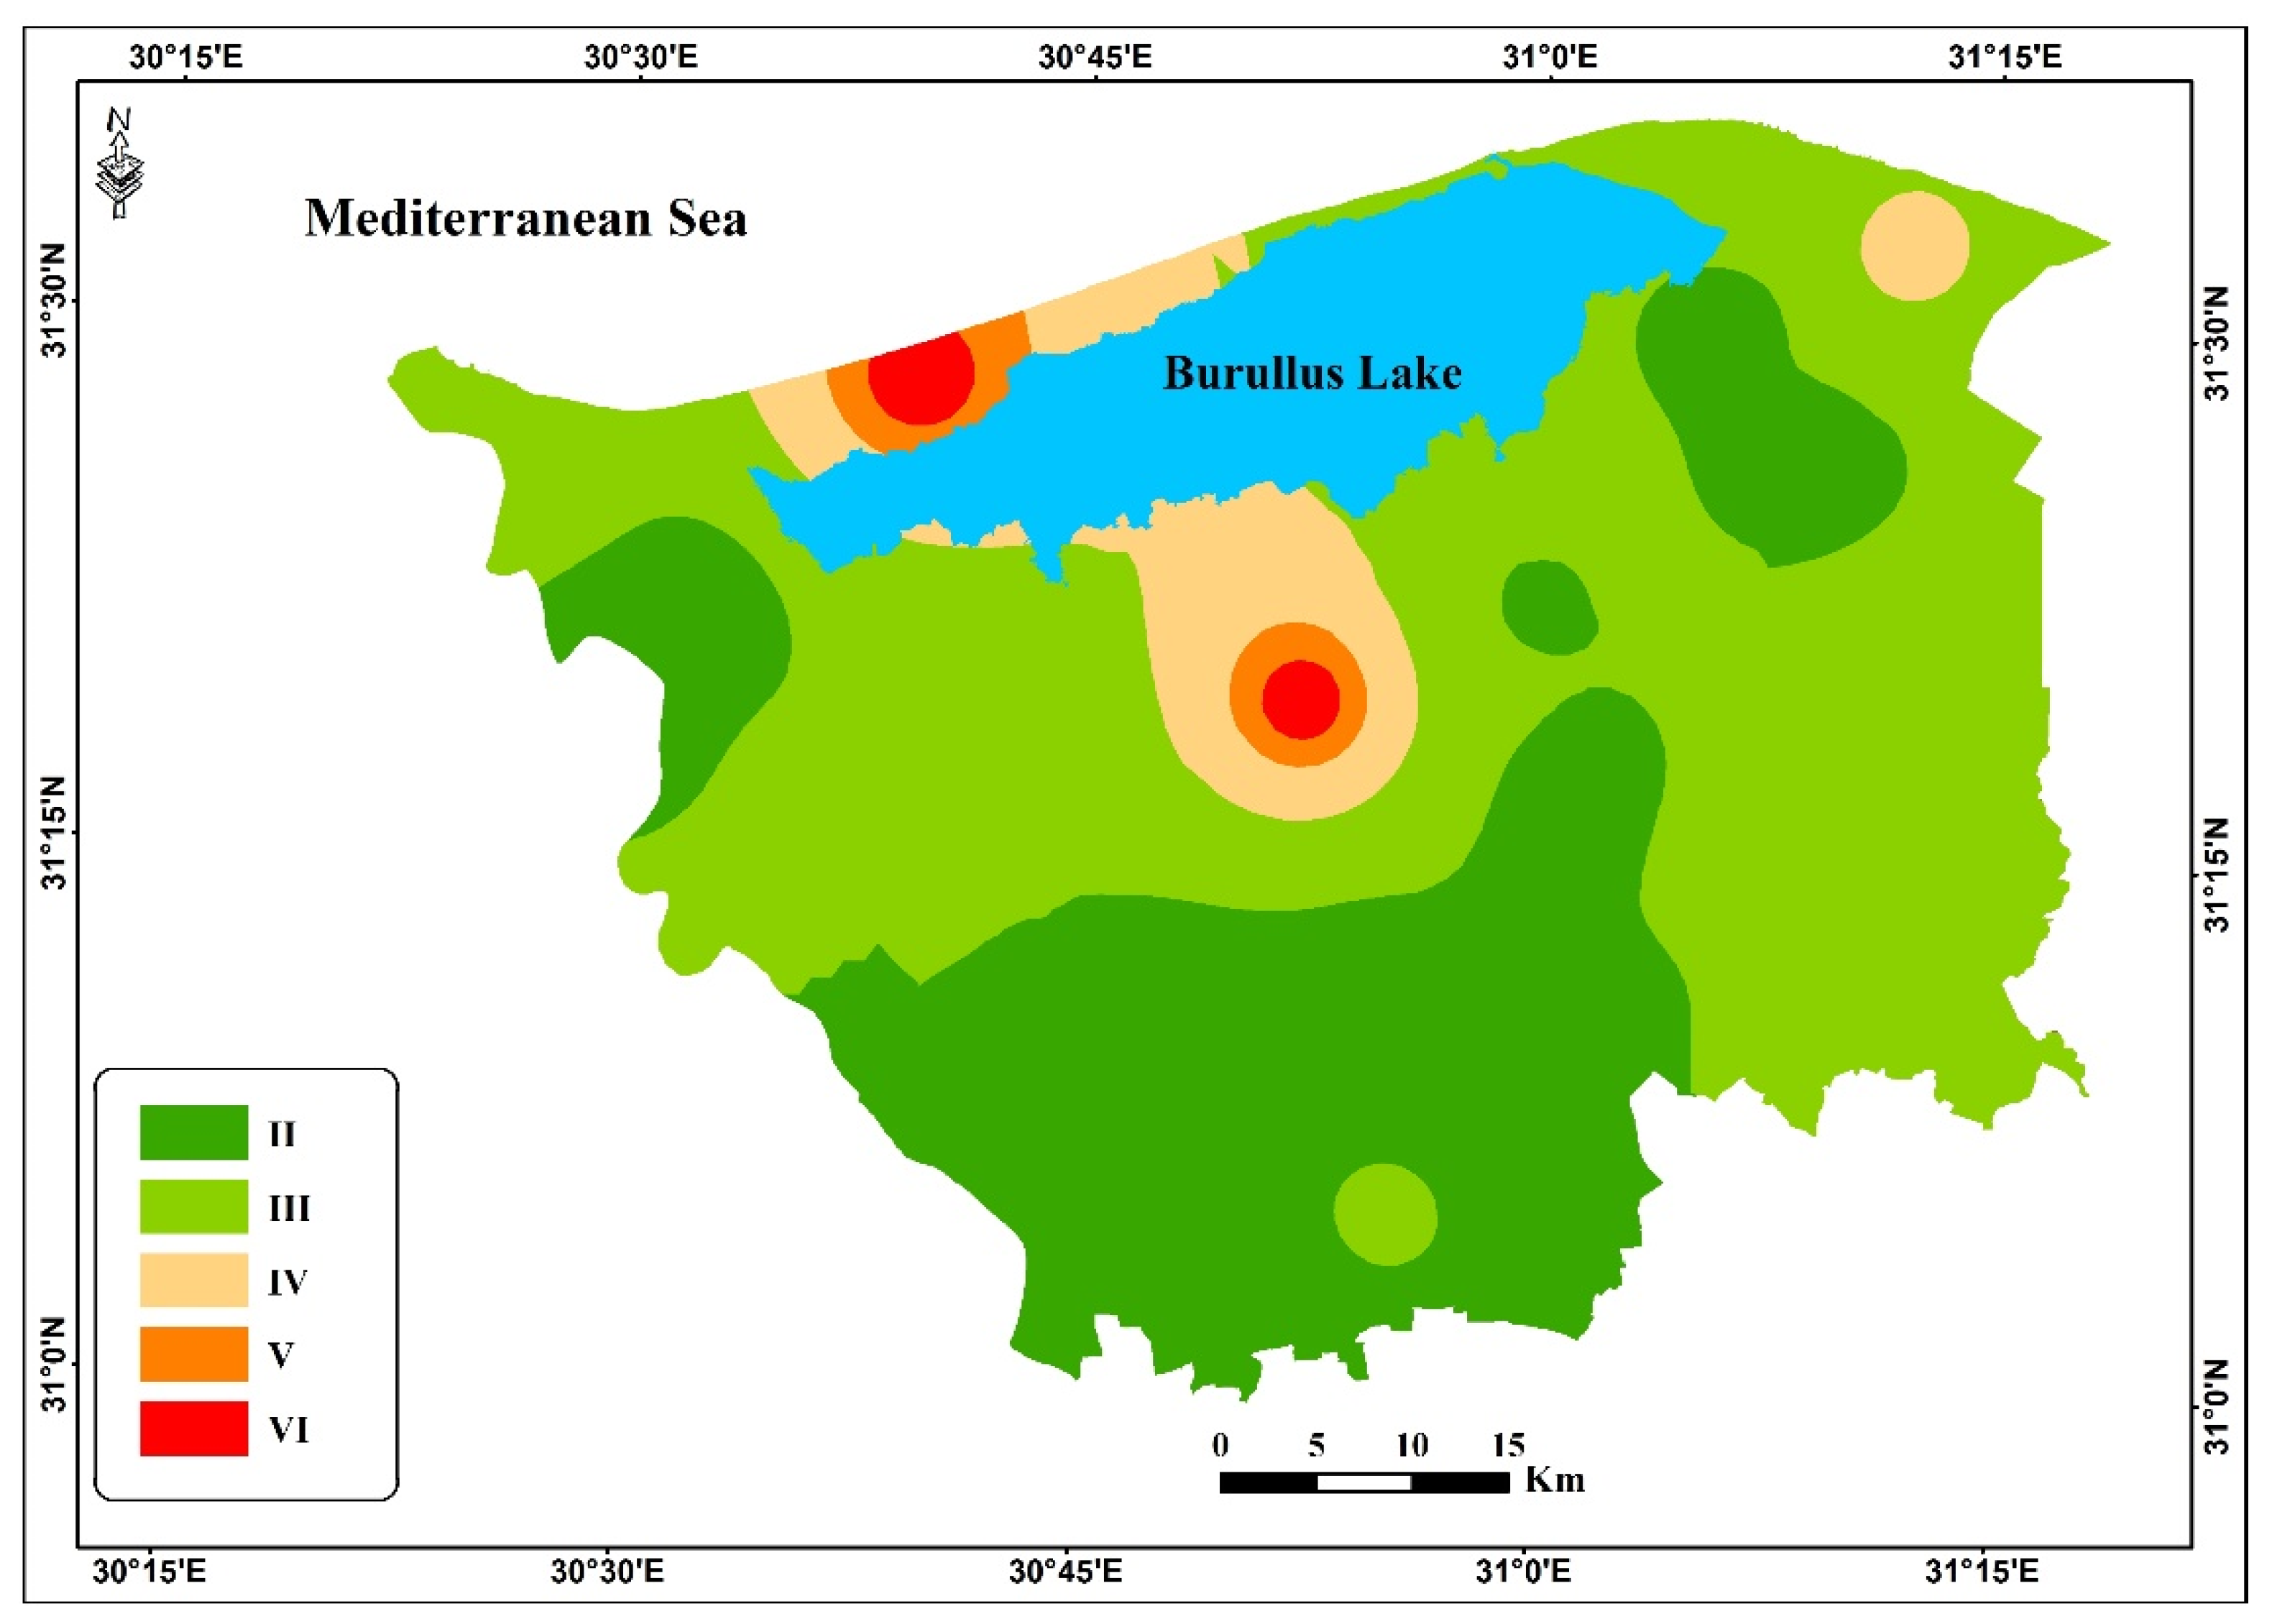
3.1. Soil Capability in the Study Area

The soils in the study area were classified according to the availability and limitations of their nutrients for the growing of agricultural crops [60]. The results show that soil texture varied between silt, clay loam, clay, sandy loam, and loamy sand. The measured soil salinity contents varied with location and ranged from slight to high soil salinity. The area close to Lake Burullus, which covers about 15% of the study area, was characterized by high to very high soil salinity, with a wide range of soil salinity (20 to 91 dS/m). On the other hand, about 20% of the study area, located in the southern part of the study area, was characterized by low to absent salinity, with electrical conductivity of saturated soil-paste extract (ECe) values less than 2 dS/m. The rest of the study area was characterized by moderately high salinity of 4–8 dS/m. Soil depth was not considered to be a limiting factor in the study area, as the soil profile depths ranged from 100 to 150 cm (deep to very deep), except in some areas that suffer from rising groundwater, where the water table depth ranged between 75 and 90 cm. In about 78% of the study area, measured soil organic matter contents ranged between 1 and 1.5%; the rest of the study area had soil organic matter contents below 1%. The measured bulk soil density in the study area varied from 1.35 to 1.66 mg/cm3, and the bulk soil density was found to be correlated with soil texture. The soil in the study area was non-calcareous, and CaCO3 levels ranged accordingly between 1 and 4%. The measured soil cation exchange capacity in the study area had a wide range, between 6.9 and 44.85 cmol/kg, due to a variation in the soil characteristics, especially the organic matter contents and clay contents. The results of this study show that the soil capability degree of the study area was mostly class II or class III, which together accounted for about 90% of the total study area. Class II soil, which is suitable for most crops, represented about 54% of the total study area. Class III soil is suitable for most crops, however it requires more management than class II soil. In approximately 10% of the study area, mostly adjacent to Lake Burullus, the soil was classified as class IV, V, or VI. These results are consistent with the trend of changes in soil properties and LULC in the Nile Valley from the south to the north, and are also consistent with the same trend in the Nile Delta (Figure 5) [61,62,63].

3.2. Accuracy Assessment

The accuracy of the CA–Markov model performance was assessed by calculating kappa statistics, and the overall accuracy of the model was determined by comparing the simulated values of soil parameters with the analytical results for the soil samples collected from the study area in 2016. As the main land classes in the study area are considered to be agricultural land, urban land, fish ponds, and Lake Burullus, the accuracy assessment and calculation of kappa statistics for the study area were applied for these four classes. The calculated overall accuracies of the classification methods for 1984, 2000, 2010, and 2016 were 89%, 92%, 94%, and 98.1%, respectively, while the kappa coefficients were 0.84, 0.88, 0.91, and 0.97, respectively. The kappa coefficient calculation showed that the classification of 2016 was more accurate than those for the other years. This can be attributed to the fact that the ground-truth points (Figure 2) were collected in 2016 (Table 1).

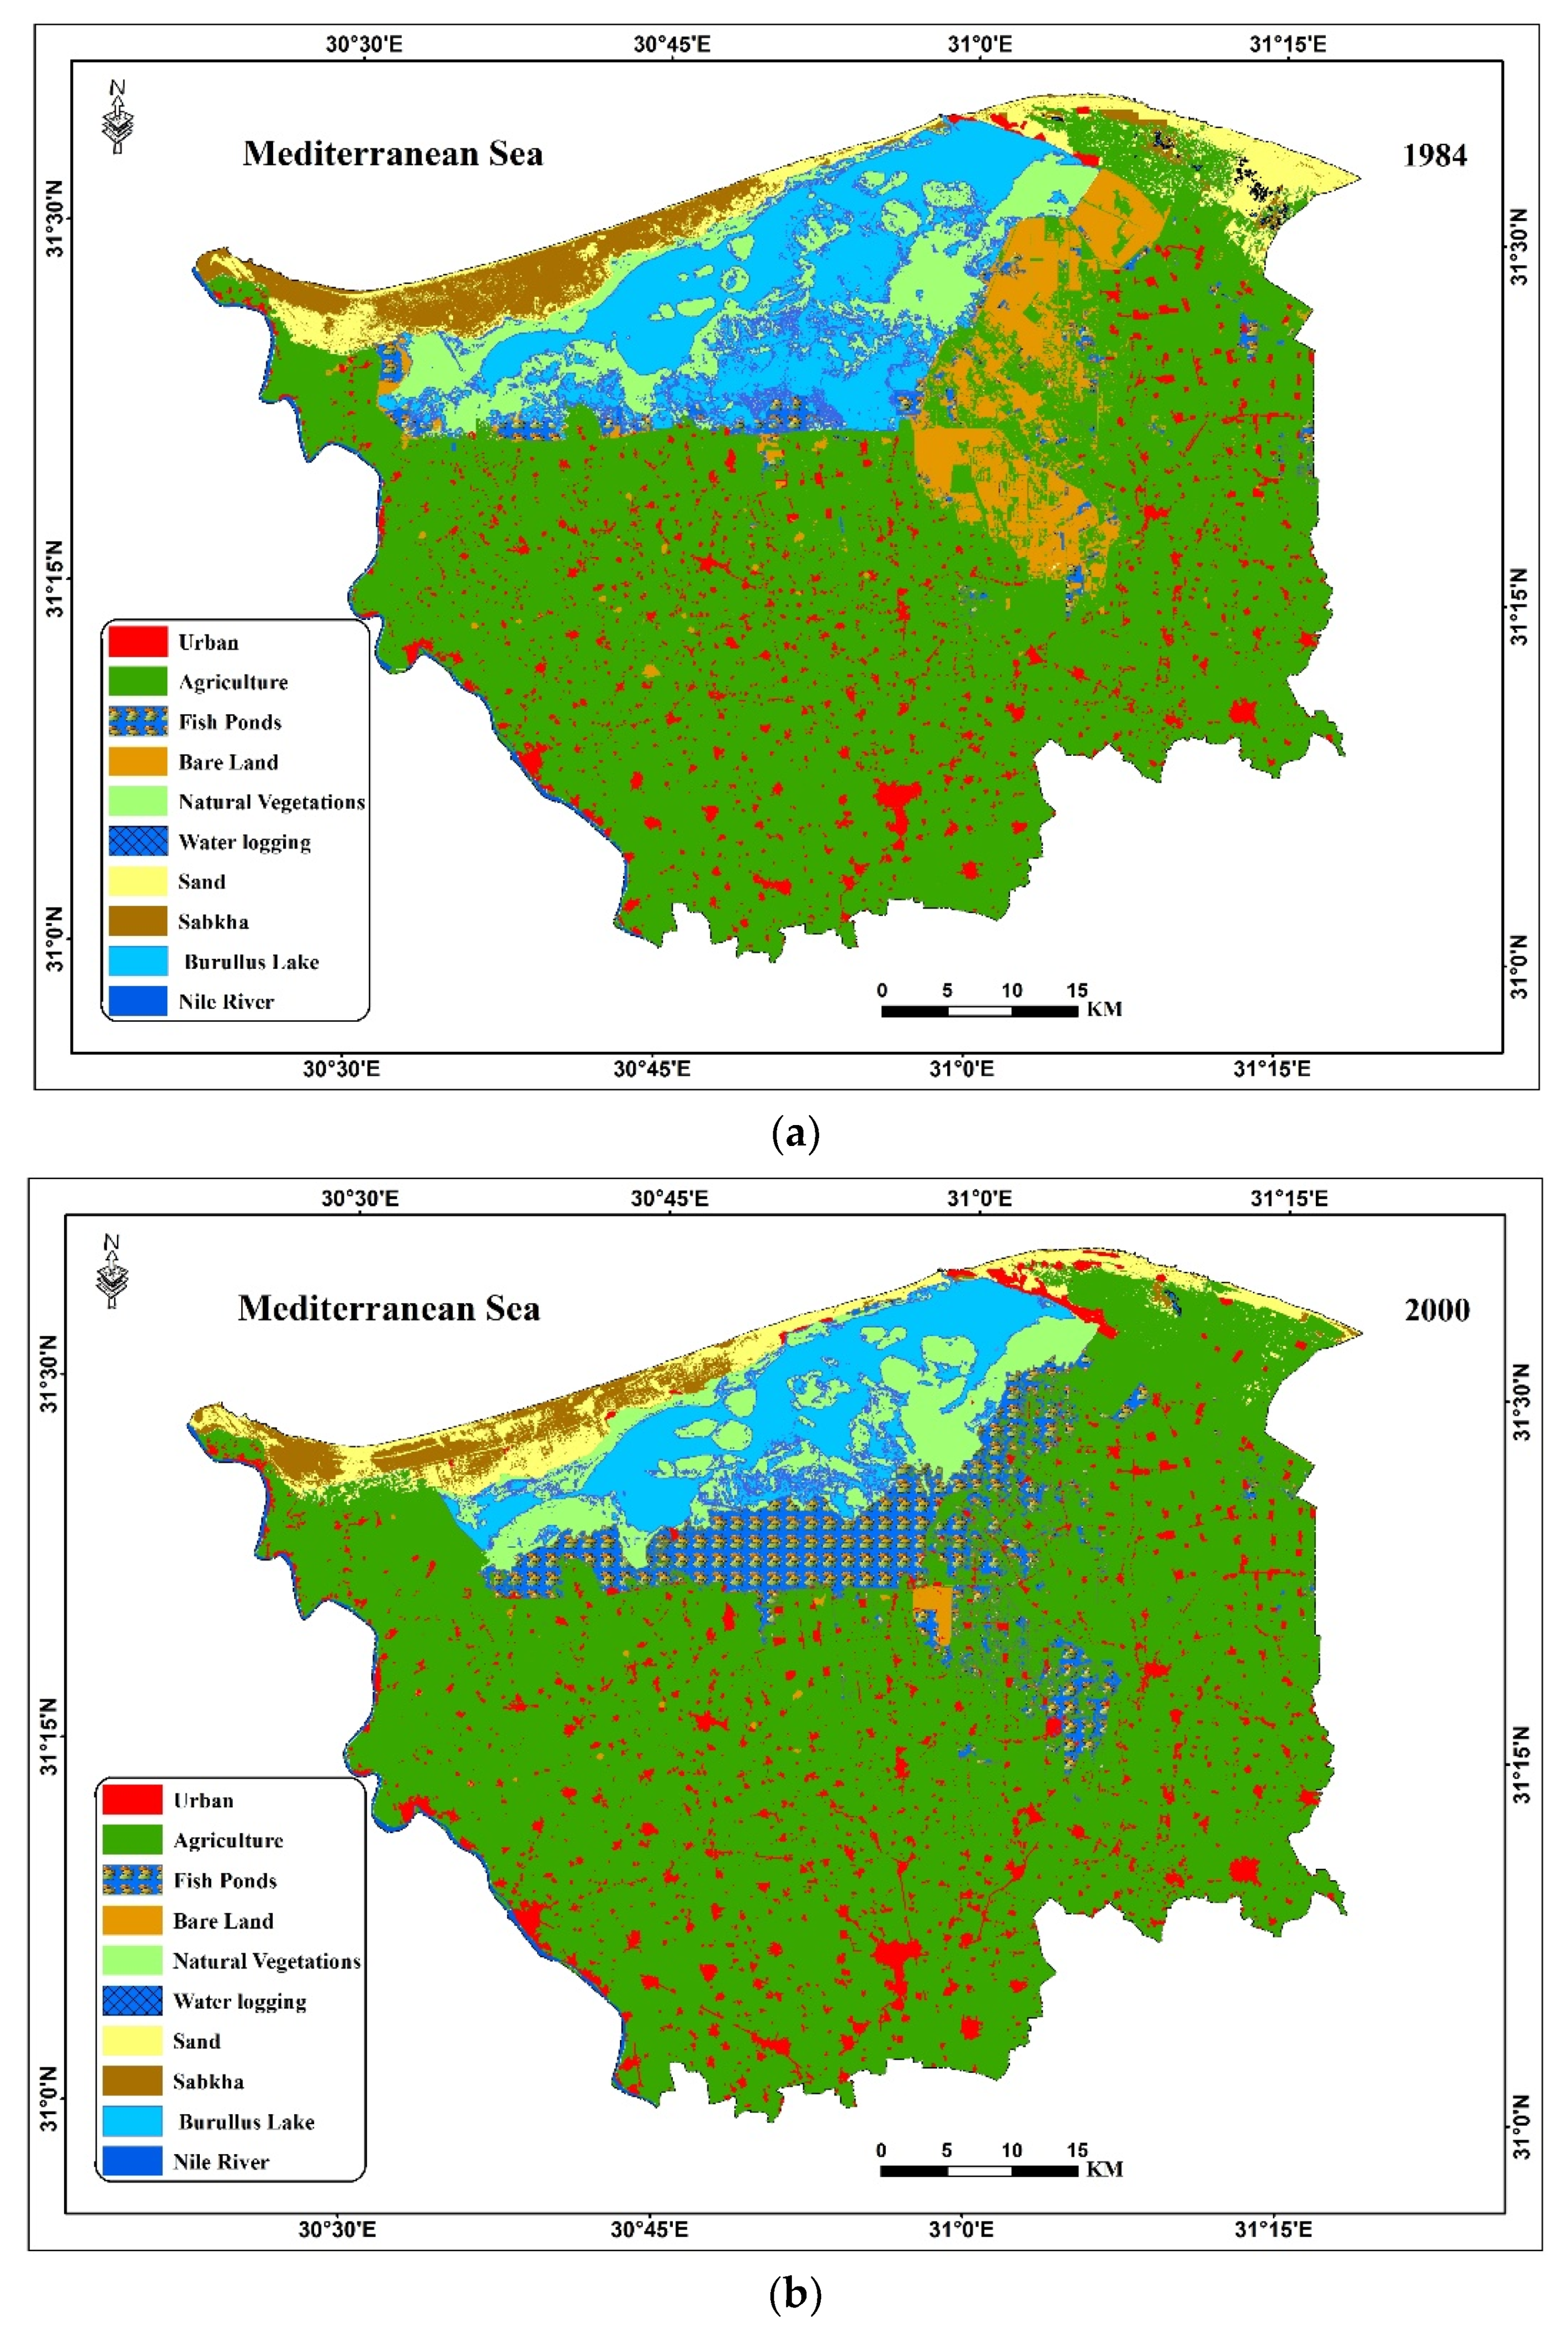
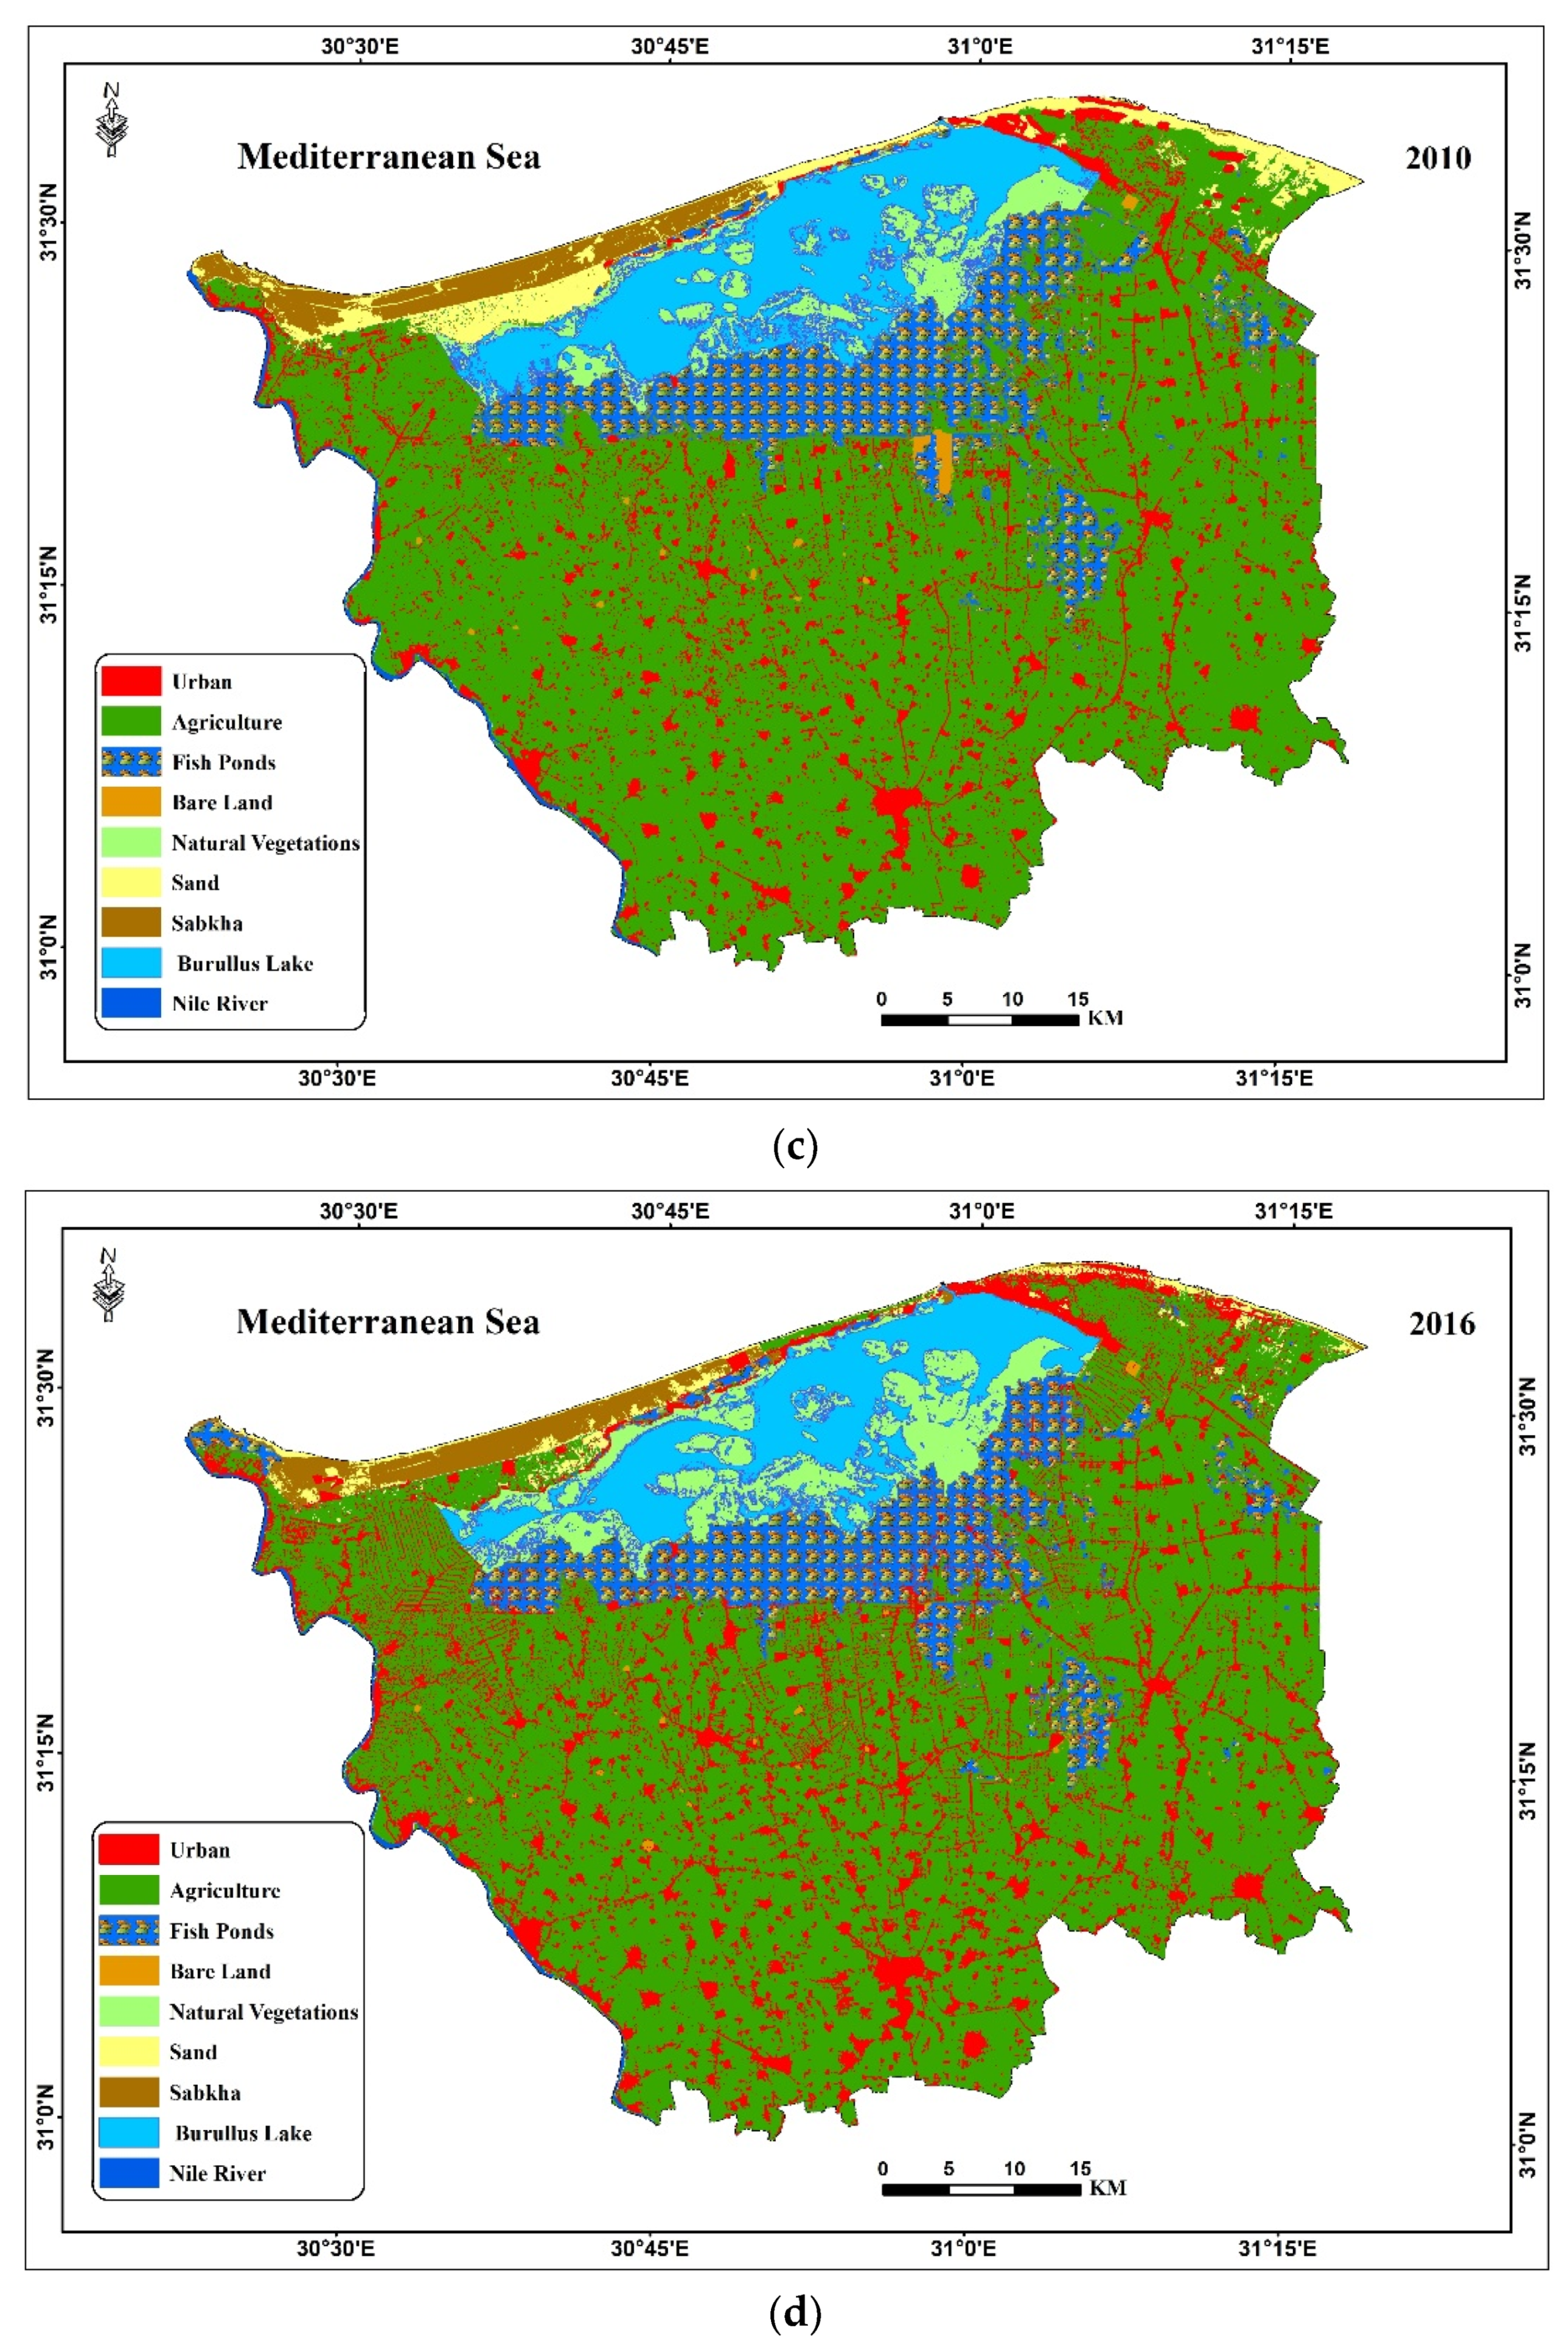
3.3. Detection of Changes in Land Use and Land Cover (LULC)

Table 2 shows estimated changes in LULC between 1984 and 2016. The following 10 main features of the study area were determined: urban land, agricultural land, fish ponds, bare land, natural vegetation, water bodies, sand dunes, sabkhas (salt flats), Lake Burullus, and the Nile River. In the study area, the urban area increased by 29% between 1984 and 2000, and by 43.6% between 2000 and 2010. According to the results of the data analysis, the urban area increased by 28.6% between 2010 and 2016. Hence, the results show that soil sealing has continuously increased in the study area. This soil sealing was caused by the loss of agricultural land, which in turn was caused by several factors such as population growth and increasing infrastructural development. However, the area of agricultural land increased by 8% between 1984 and 2000, when reclamation plans were implemented. Meanwhile, a 4% reduction in the area of agricultural land was observed between 2000 and 2010. This decrease was due to increasing urban growth in that period. The area of urban land increased during 2010–2016, however this increase was due to the development of bare land (Figure 6).

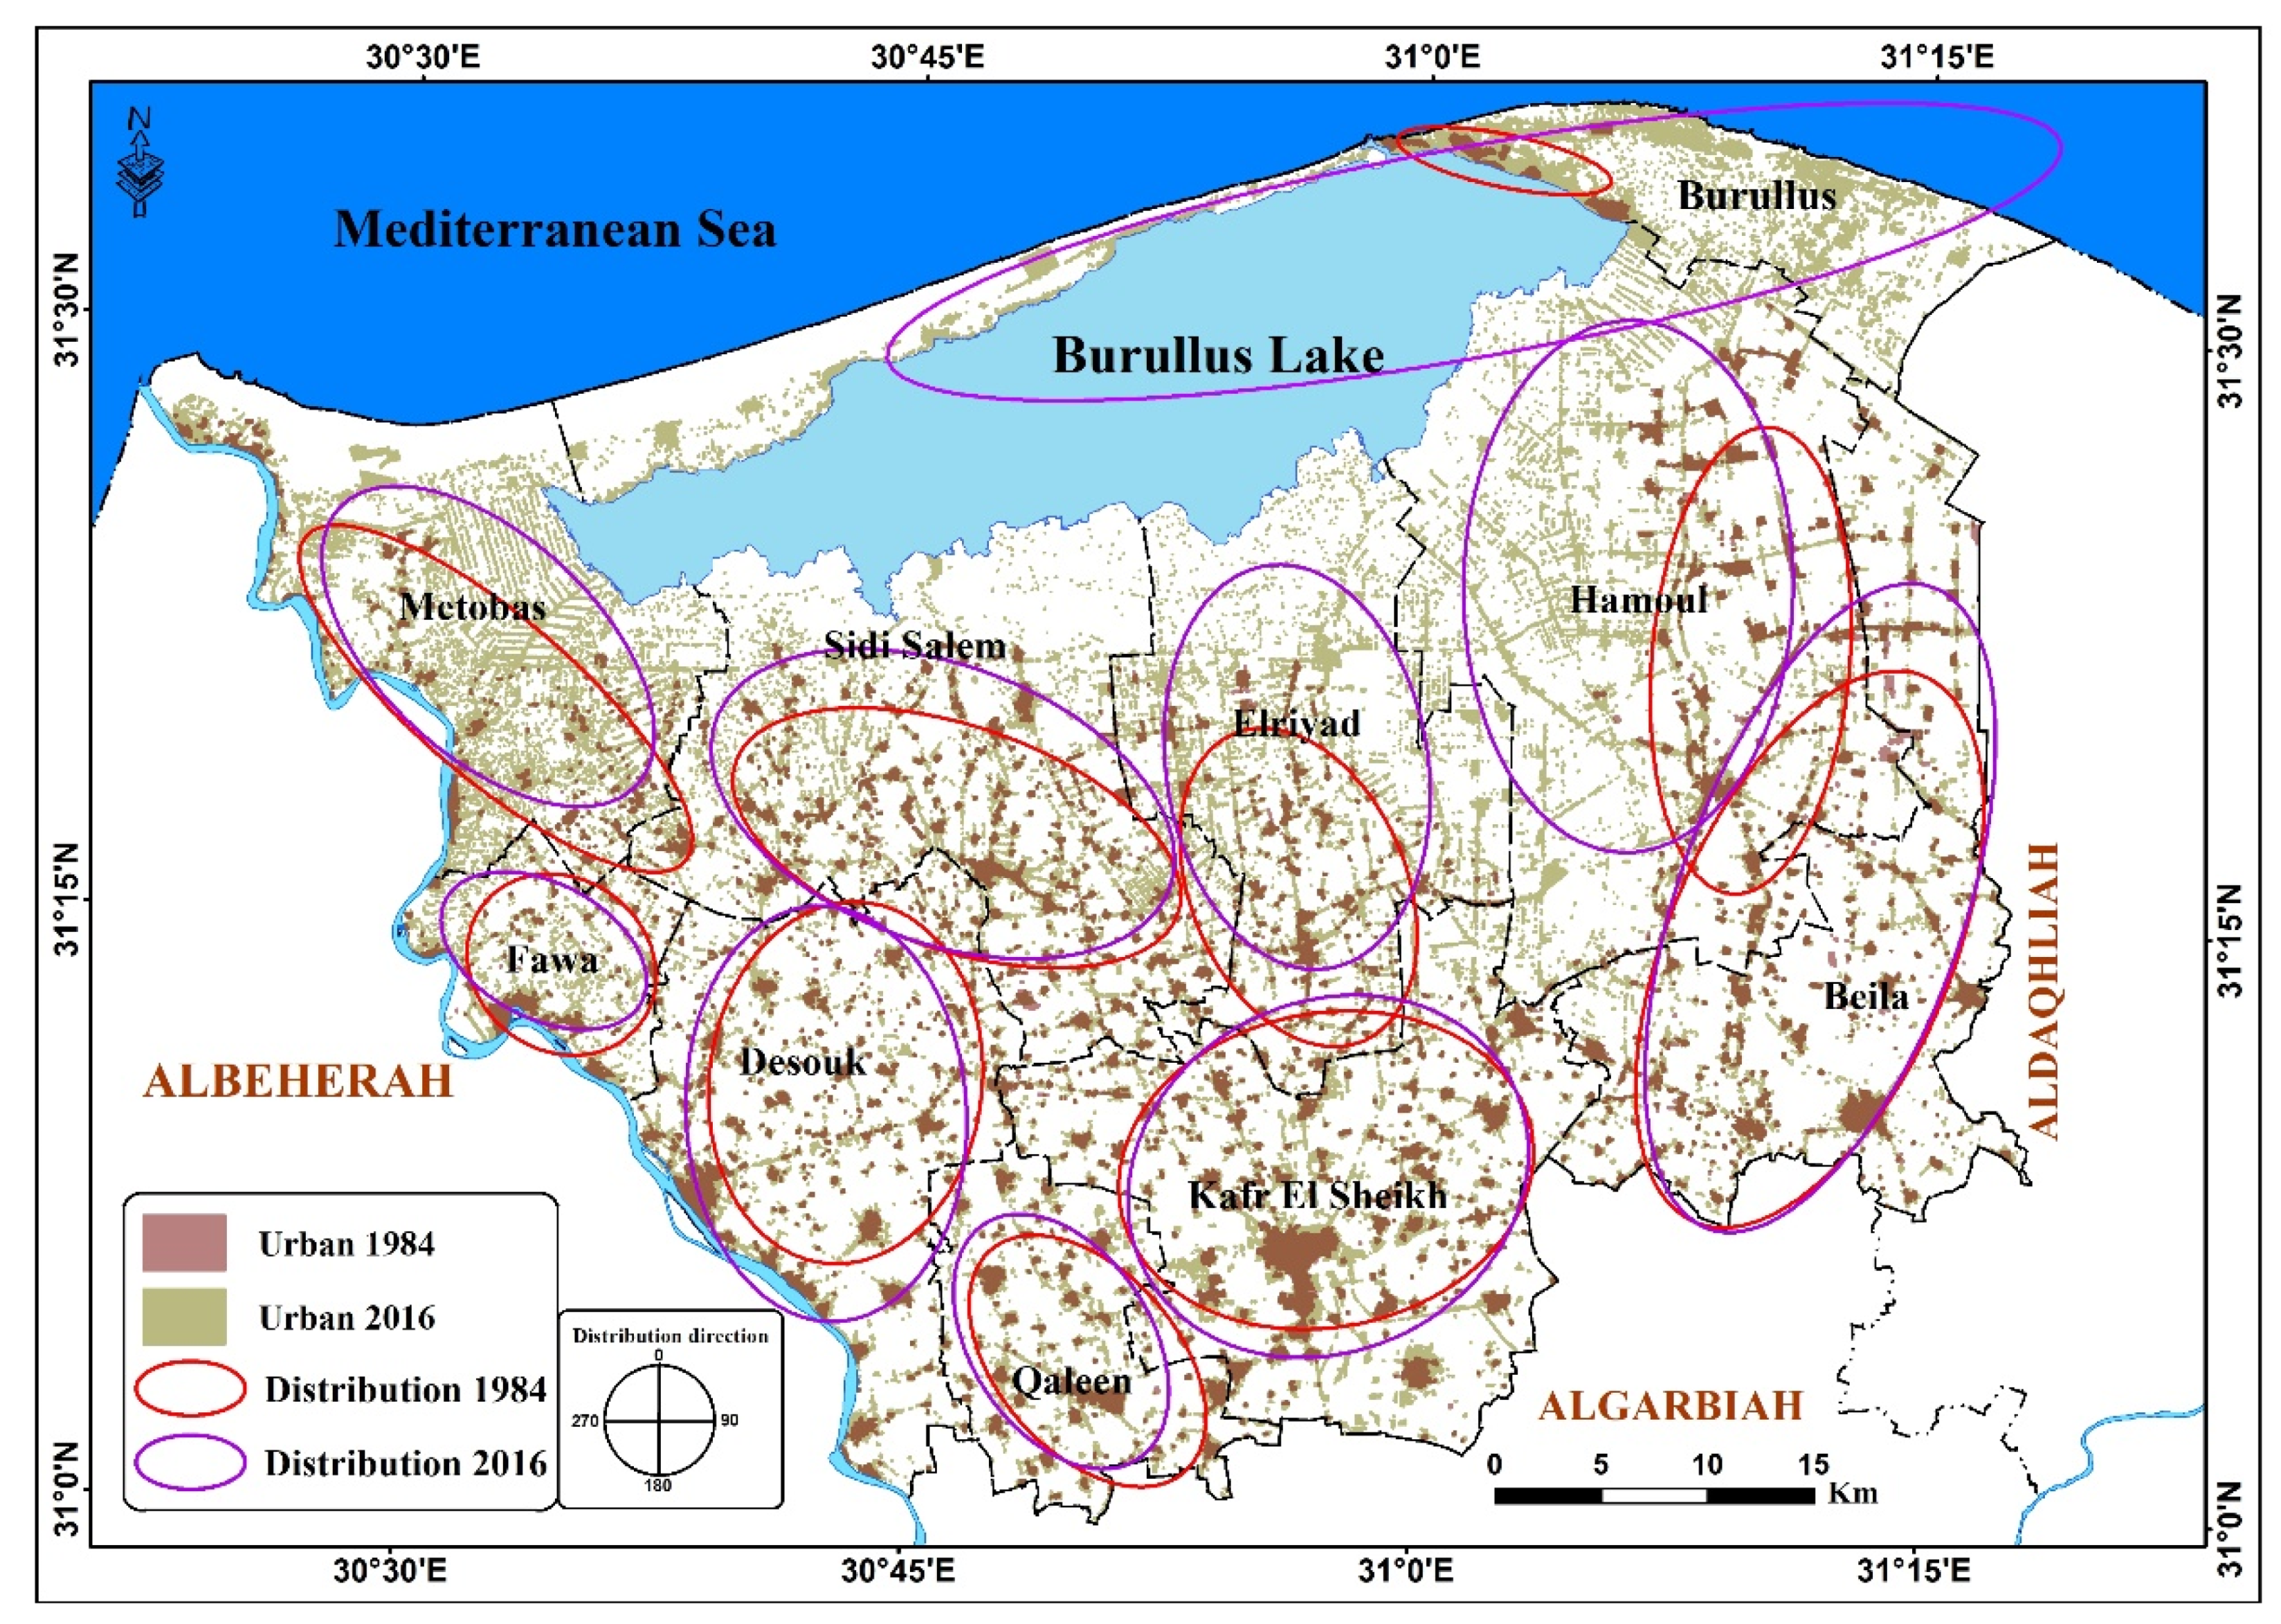
3.4. Spatial Distribution of Soil Sealing Patterns

Soil sealing is primarily observed in land that has been converted from agricultural land to urban land. Figure 7 shows the calculated spatial distribution of soil sealing in the study area along with the spread of urban land. Urban land was quite heterogeneous in the study area, with the suburbs of Kafr El Sheikh and its neighboring cities having high densities of urban land from 1984 to 2016.
According to the soil capability map (Figure 4) and area of urban land in 2016, it can be observed that the amount of soil sealing in the study area is increasing at a rapid rate. The northern parts of the study area have a high rate of soil sealing. However, the problems are different in these areas—they have experienced an increase in the area of bare land, sand dunes, and sabkhas, and their soil is low quality and poorly suited to agricultural production. As can also be seen in Figure 6, the amount of soil sealing in the study area increases to the southeast and northeast, except in certain areas where urban land is observed from the north to the south, and in the northern parts of the study area, where the area of urban land increases toward the east.

3.5. Expected Changes in Soil Sealing between 2016 and 2048

The potential soil sealing was predicted based on the integration of GIS, remote sensing data, and observations of changes in LULC from 1984 to 2016. The CA–Markov model was used to simulate soil sealing until 2048 based on the trend and rate of changes in LULC during 1984, 2000, 2010, and 2016. As shown in Figure 8, the temporal and spatial variation in land cover is not homogeneous, with the density of buildings differing from one place to another. This is due to natural limitations such as water bodies (e.g., Lake Burullus) in the north of the study area, and consistent with observations in other parts of the North Nile Delta [18]. This observation should be taken into account by the relevant authorities in order to take the necessary measures to reduce the expansion of the urbanization of fertile land that is being driven by the increasing population in the region. If urbanization continues at the current rate, the amount of soil sealing could significantly increase by 2048. The results of this study show that the spatial distribution of urbanization follows main and subsidiary roads. The results of simulation model analysis for urban areas suggest that the study area will reach 596.9 km2 by 2048. This means that, over the next three decades, the area of soil sealing in the study area will reach 322.9 km2 (32,290 hectares), representing an increase of 54% compared to the 2016 level. This is a worrying finding for future generations. If the government does not take the necessary measures to reduce soil sealing in the face of increasing population growth, there could be serious consequences for food security.

4. Recommendations

The current work reports the loss of highly productive lands in Egypt. It is necessary to combat this phenomenon, which is a barrier to sustainable agricultural development, through the following measures:
  • increase cooperation between governmental authorities, stakeholders, and educational and research institutions to combat soil sealing;
  • reactivate past laws that combat soil sealing;
  • increase awareness of citizens of the hazards posed by soil sealing via different media;
  • the government should oblige the population not to establish any urban communities in the agricultural areas.

5. Conclusions

Changes in land use estimated from satellite images are considered a good indicator of the trend of soil sealing in Kafr El Sheikh Governorate, Egypt. In recent years, urbanization has covered large areas of highly fertile land in rural areas and urban suburbs, which is considered to be an important factor in the decline of food production in Egypt.
The results of this study allow the following nine classes of LULC to be distinguished in the study area: urban land, agricultural land, fish farms, natural vegetation, hills, bare areas, sabkhas, sand dunes, and Lake Burullus. The results illustrate that soil sealing has primarily occurred on productive soil that has been converted to urban land. It was found that, between 1984 and 2016, 19,500 hectares of agriculture land were converted to urban areas in the study area. After 2010, the rate of soil sealing was found to increase, which coincided with a decrease in land reclamation. The rate of soil sealing was found to increase towards the southeast and northeast of the study area, except for the northern parts, where the rate of soil sealing was found to increase towards the east. The CA–Markov model was used to predict the potential degree of soil sealing until 2048. The results indicate that, in the future, urbanization and soil sealing will increase in the study area. Soil sealing was predicted to increase by 54% by 2048. The results obtained in this study can be used as broad guidelines for governments to formulate policies against soil sealing within urban planning and regional development strategies.
Decision-makers are responsible for the reinforcement of plans to combat soil sealing driven by urbanization in Kafr El Sheikh Governorate and other areas.

Author Contributions

The manuscript included three main contributions: a field survey, data analysis, and writing the text. E.H., A.A.B., and E.S.M. conducted the field survey. The satellite imagery were analyzed by E.S.M. and E.H. The text of the article was written by A.A.B., A.E., A.A.A., and B.M. R.L. conceived and designed the experiments. The last version of the article was revised by B.M., R.L., and A.A.B.

Funding

This research received no external funding and considered one of the result of efficient scientific participation between scientific institutions in Egypt, Saudi Arabia, and Italy.

Acknowledgments

The authors would like to thank the University of Basilicata and the Italian National Research Council (CNR) at Potenza for supporting the research activities. Special thanks are given to the National Authority for Remote Sensing and Space Science (NARSS) for funding the field survey. The authors would like to extend their sincere appreciation to the research center at the College of Arts, King Saud University, for cooperation to produce this manuscript.

Conflicts of Interest

The authors hereby certify that no conflict of interest exists in the data analysis and interpretation; in the writing of the article, and in the decision to publish the results. The authors would also like to declare that the funding for the study was supported by the authors’ institutions (Basilicata University, NARSS, and CNR).

References

  1. Prokop, G.; Jobstmann, H.; Schonbauer, A. Report on Best Practices for Limiting Soil Sealing and Mitigating its Effects; European Commission: Brussels, Belgium, 2011. [Google Scholar]
  2. Mohamed, E.S. Spatial assessment of desertification in north Sinai using modified MEDLAUS model. Arab. J. Geosci. 2013, 6, 4647–4659. [Google Scholar] [CrossRef]
  3. Chen, M.; Liu, W.; Lu, D. Challenges and the way forward in China’s new-type urbanization. Land Use Policy 2016, 55, 334–339. [Google Scholar] [CrossRef]
  4. Desa, U.N. World Urbanization Prospects, the 2011 Revision. Population Division, Department of Economic and Social Affairs; United Nations Secretariat: New York, NY, USA, 2014. [Google Scholar]
  5. World’s Population Increasingly Urban with More than Half Living in Urban Areas. Available online: https://www.un.org/en/development/desa/news/population/world-urbanization-prospects-2014.html (accessed on 5 July 2019).
  6. Xiao, R.; Su, S.; Wang, J.; Zhang, Z.; Jiang, D.; Wu, J. Local spatial modeling of paddy soil landscape patterns in response to urbanization across the urban agglomeration around Hangzhou Bay, China. Appl. Geogr. 2013, 39, 158–171. [Google Scholar] [CrossRef]
  7. Biasioli, M.; Barberis, R.; Ajmonemarsan, F. The influence of a large city on some soil properties and metals content. Sci. Total Environ. 2006, 356, 154–164. [Google Scholar] [CrossRef] [PubMed]
  8. Martellozzo, F.; Amato, F.; Murgante, B.; Clarke, K.C. Modelling the impact of urban growth on agriculture and natural land in Italy to 2030. Appl. Geogr. 2018, 91, 156–167. [Google Scholar] [CrossRef] [Green Version]
  9. Cosentino, C.; Amato, F.; Murgante, B. Population-Based Simulation of Urban Growth: The Italian Case Study. Sustainability 2018, 10, 4838. [Google Scholar] [CrossRef]
  10. Seto, K.C.; Güneralp, B.; Hutyra, L.R. Global forecasts of urban expansion to 2030 and direct impacts on biodiversity and carbon pools. Proc. Natl. Acad. Sci. USA 2012, 109, 16083–16088. [Google Scholar] [CrossRef] [Green Version]
  11. Li, X.; Yang, L.; Ren, Y.; Li, H.; Wang, Z. Impacts of Urban Sprawl on Soil Resources in the Changchun–Jilin Economic Zone, China, 2000–2015. Int. J. Environ. Res. Public Health 2018, 15, 1186. [Google Scholar] [CrossRef]
  12. Bai, Z.G.; Dent, D.L.; Olsson, L.; Schaepman, M.E. Global Assessment of Land Degradation and Improvement: 1. Identification by Remote Sensing (No. 5); ISRIC-World Soil Information: Wageningen, The Netherlands, 2008. [Google Scholar]
  13. Hamdi, H.; Abdelhafez, S. Agriculture and Soil Survey in Egypt. Soil Resources of Southern and Eastern Mediterranean Countries; Zdruli, P., Steduto, P., Lacirignola, L., Montanarella, L., Eds.; OPTIONS Méditerranéennes: Bari, Italy, 2001. [Google Scholar]
  14. Mohamed, E.; Saleh, A.; Belal, A. Sustainability indicators for agricultural land use based on GIS spatial modeling in North of Sinai-Egypt. Egypt. J. Remote Sens. Space Sci. 2014, 17, 1–15. [Google Scholar] [CrossRef] [Green Version]
  15. Foley, J.A.; Ramankutty, N.; Brauman, K.A.; Cassidy, E.S.; Gerber, J.S.; Johnston, M.; Mueller, N.D.; O’Connell, C.; Ray, D.K.; West, P.C.; et al. Solutions for a cultivated planet. Nature 2011, 478, 337–342. [Google Scholar] [CrossRef] [Green Version]
  16. Tilman, D.; Cassman, K.G.; Matson, P.A.; Naylor, R.; Polasky, S. Agricultural sustainability and intensive production practices. Nature 2002, 418, 671–677. [Google Scholar] [CrossRef]
  17. Mohamed, E.S.; Belal, A.; Shalaby, A. Impacts of soil sealing on potential agriculture in Egypt using remote sensing and GIS techniques. Eurasian Soil Sci. 2015, 48, 1159–1169. [Google Scholar] [CrossRef]
  18. Mohamed, E.S.; Abu-Hashim, M.; Belal, A.A.A. Sustainable Indicators in Arid Region: Case Study—Egypt. In The Handbook of Environmental Chemistry; Springer Science and Business Media LLC: Berlin/Heidelberg, Germany, 2018; pp. 273–293. [Google Scholar]
  19. Ceccarelli, T.; Bajocco, S.; Salvati, L.; Perini, L. Investigating syndromes of agricultural land degradation through past trajectories and future scenarios. Soil Sci. Plant. Nutr. 2014, 60, 60–70. [Google Scholar] [CrossRef] [Green Version]
  20. Prokop, G.; Jobstmann, H.; Schönbauer, A. Overview of Best Practices for Limiting Soil Sealing or Mitigating Its Effects in EU-27; European Communities: Brussels, Belgium, 2011. [Google Scholar]
  21. El-Ramady, H.; Alshaal, T.; Bakr, N.; Elbana, T.; Mohamed, E.; Belal, A.A. The Soils of Egypt. 2018. Available online: https://www.springer.com/gp/book/9783319955155 (accessed on 5 July 2019).
  22. Elfadaly, A.; Attia, W.; Lasaponara, R. Monitoring the Environmental Risks Around Medinet Habu and Ramesseum Temple at West Luxor, Egypt, Using Remote Sensing and GIS Techniques. J. Archaeol. Method Theory 2018, 25, 587–610. [Google Scholar] [CrossRef]
  23. Elfadaly, A.; Lasaponara, R.; Murgante, B.; Qelichi, M.M. Cultural Heritage Management Using Analysis of Satellite Images and Advanced GIS Techniques at East Luxor, Egypt and Kangavar, Iran (A Comparison Case Study). Available online: https://link.springer.com/chapter/10.1007/978-3-319-62401-3_12 (accessed on 22 August 2019).
  24. Lasaponara, R.; Elfadaly, A.; Attia, W. Low Cost Space Technologies for Operational Change Detection Monitoring Around the Archaeological Area of Esna-Egypt. Available online: https://link.springer.com/chapter/10.1007/978-3-319-42108-7_48 (accessed on 22 August 2019).
  25. Saleh, N.H.S. Monitoring the Agriculture Land Change and its Impact on Water Consumption Between branches damietta and rosetta, Egypt Using Remote Sensing and GIS Techniques. Ph.D. Thesis, Ain Shams University, Cairo, Egypt, 2016. [Google Scholar]
  26. Mohamed, E.; Belal, A.A.; Ali, R.R.; Saleh, A.; Hendawy, E.A. Land degradation. In The Soils of Egypt; Springer: Cham, Germany, 2019; pp. 159–174. [Google Scholar]
  27. Abu-Hashim, M.; Mohamed, E.; Belal, A.-E. Identification of potential soil water retention using hydric numerical model at arid regions by land-use changes. Int. Soil Water Conserv. Res. 2015, 3, 305–315. [Google Scholar] [CrossRef] [Green Version]
  28. Hassan, A.; Belal, A.; Hassan, M.; Farag, F.; Mohamed, E.; Hassaan, A. Potential of thermal remote sensing techniques in monitoring waterlogged area based on surface soil moisture retrieval. J. Afr. Earth Sci. 2019, 155, 64–74. [Google Scholar] [CrossRef]
  29. Mohamed, E.S.; Abu-Hashim, M.; Abdelrahman, M.A.E.; Schütt, B.; Lasaponara, R. Evaluating the Effects of Human Activity over the Last Decades on the Soil Organic Carbon Pool Using Satellite Imagery and GIS Techniques in the Nile Delta Area, Egypt. Sustainability 2019, 11, 2644. [Google Scholar] [CrossRef]
  30. Hammam, A.; Mohamed, E. Mapping Soil Salinity in the East Nile Delta Using Several Methodological Approaches of Salinity Assessment. Available online: https://www.sciencedirect.com/science/article/pii/S1110982318301339 (accessed on 22 August 2019).
  31. Abu-Hashim, M.; Elsayed, M.; Belal, A.E. Effect of land-use changes and site variables on surface soil organic carbon pool at Mediterranean Region. J. Afr. Earth Sci. 2016, 114, 78–84. [Google Scholar] [CrossRef]
  32. Elfadaly, A.; Lasaponara, R. On the Use of Satellite Imagery and GIS Tools to Detect and Characterize the Urbanization around Heritage Sites: The Case Studies of the Catacombs of Mustafa Kamel in Alexandria, Egypt and the Aragonese Castle in Baia, Italy. Sustainability 2019, 11, 2110. [Google Scholar] [CrossRef]
  33. Zanakis, S.H.; Solomon, A.; Wishart, N.; Dublish, S. Multi-attribute decision making: A simulation comparison of select methods. Eur. J. Oper. Res. 1998, 107, 507–529. [Google Scholar] [CrossRef]
  34. Belal, A.A.; El-Ramady, H.R.; Mohamed, E.S.; Saleh, A.M. Drought risk assessment using remote sensing and GIS techniques. Arab. J. Geosci. 2014, 7, 35–53. [Google Scholar] [CrossRef]
  35. Savin, I.Y. Sealed soils (ecranozems) mapping in Moscow agglomeration based on Landsat images. Issled Zemli Kosm. 2013, 5, 55–61. [Google Scholar]
  36. Elfadaly, A.; Attia, W.; Qelichi, M.M.; Murgante, B.; Lasaponara, R. Management of Cultural Heritage Sites Using Remote Sensing Indices and Spatial Analysis Techniques. Surv. Geophys. 2018, 39, 1347–1377. [Google Scholar] [CrossRef]
  37. Arsanjani, J.J.; Kainz, W.; Mousivand, A.J. Tracking dynamic land-use change using spatially explicit Markov Chain based on cellular automata: the case of Tehran. Int. J. Image Data Fusion 2011, 2, 329–345. [Google Scholar] [CrossRef]
  38. Elfadaly, A.; Wafa, O.; AbouArab, M.A.R.; Guida, A.; Spanu, P.G.; Lasaponara, R. Geo-Environmental Estimation of Land Use Changes and Its Effects on Egyptian Temples at Luxor City. ISPRS Int. J. Geo Inf. 2017, 6, 378. [Google Scholar] [CrossRef]
  39. Lasaponara, R.; Murgante, B.; Elfadaly, A.; Qelichi, M.M.; Shahraki, S.Z.; Wafa, O.; Attia, W. Spatial Open Data for Monitoring Risks and Preserving Archaeological Areas and Landscape: Case Studies at Kom el Shoqafa, Egypt and Shush, Iran. Sustainability 2017, 9, 572. [Google Scholar] [CrossRef]
  40. Vaz, E.D.N.; Nijkamp, P.; Painho, M.; Caetano, M. A multi-scenario forecast of urban change: A study on urban growth in the Algarve. Landsc. Urban Plan. 2012, 104, 201–211. [Google Scholar] [CrossRef] [Green Version]
  41. Muller, M.R.; Middleton, J. A Markov model of land-use change dynamics in the Niagara Region, Ontario, Canada. Landsc. Ecol. 1994, 9, 151–157. [Google Scholar]
  42. Sun, H.; Forsythe, W.; Waters, N. Modeling Urban Land Use Change and Urban Sprawl: Calgary, Alberta, Canada. Netw. Spat. Econ. 2007, 7, 353–376. [Google Scholar] [CrossRef]
  43. Eastman, J.R. IDRISI Taiga, Guide to GIS and Remote Processing. Guide to GIS and Remote Processing; Clark University: Worcester, MA, USA, 2009. [Google Scholar]
  44. Myint, S.W.; Wang, L. Multicriteria decision approach for land use land cover change using Markov chain analysis and a cellular automata approach. Can. J. Remote Sens. 2006, 32, 390–404. [Google Scholar] [CrossRef]
  45. Guan, D.; Li, H.; Inohae, T.; Su, W.; Nagaie, T.; Hokao, K. Modeling urban land use change by the integration of cellular automaton and Markov model. Ecol. Model. 2011, 222, 3761–3772. [Google Scholar] [CrossRef]
  46. Nouri, J.; Gharagozlou, A.; Arjmandi, R.; Faryadi, S.; Adl, M. Predicting Urban Land Use Changes Using a CA–Markov Model. Arab. J. Sci. Eng. 2014, 39, 5565–5573. [Google Scholar] [CrossRef]
  47. Abdelrahman, M.A.E.; Shalaby, A.; Aboelsoud, M.H.; Moghanm, F.S. GIS spatial model based for determining actual land degradation status in Kafr El-Sheikh Governorate, North Nile Delta. Model. Earth Syst. Environ. 2017, 4, 359–372. [Google Scholar] [CrossRef]
  48. Bernstein, L.S.; Adler-Golden, S.M.; Sundberg, R.L.; Levine, R.Y.; Perkins, T.C.; Berk, A.; Ratkowski, A.J.; Felde, G.; Hoke, M.L. Validation of the QUick Atmospheric Correction (QUAC) algorithm for VNIR-SWIR multi-and hyperspectral imagery. In Algorithms and Technologies for Multispectral, Hyperspectral, and Ultraspectral Imagery XI. Int. Soc. Opt. Photonics 2005, 5806, 668–679. [Google Scholar]
  49. Chander, G.; Markham, B.L.; Helder, D.L. Summary of current radiometric calibration coefficients for Landsat MSS, TM, ETM+, and EO-1 ALI sensors. Remote Sens. Environ. 2009, 113, 893–903. [Google Scholar] [CrossRef]
  50. Chen, D.; Stow, D.A.; Gong, P. Examining the effect of spatial resolution and texture window size on classification accuracy: an urban environment case. Int. J. Remote Sens. 2004, 25, 2177–2192. [Google Scholar] [CrossRef]
  51. Olofsson, P.; Foody, G.M.; Herold, M.; Stehman, S.V.; Woodcock, C.E.; Wulder, M.A. Good practices for estimating area and assessing accuracy of land change. Remote Sens. Environ. 2014, 148, 42–57. [Google Scholar] [CrossRef]
  52. Carletta, J. Assessing agreement on classification tasks: the kappa statistic. Comput. Linguist. 1996, 22, 249–254. [Google Scholar]
  53. Burt, R. Soil Survey Laboratory Methods Manual. Soil Survey Investigations Report 42, Version 4.0. United States Department of Agriculture; Natural Resources Conservation Service, National Soil Survey Center: Washington, DC, USA, 2004. [Google Scholar]
  54. Ye, B.; Bai, Z. Simulating land use/cover changes of Nenjiang County based on CA–Markov model. Comput. Comput. Technol. Agric. 1984, 1, 321–329. [Google Scholar]
  55. Megahed, Y.; Cabral, P.; Silva, J.; Caetano, M. Land Cover Mapping Analysis and Urban Growth Modelling Using Remote Sensing Techniques in Greater Cairo Region—Egypt. ISPRS Int. J. Geo Inf. 2015, 4, 1750–1769. [Google Scholar] [CrossRef]
  56. Baker, W.L. A review of models of landscape change. Landsc. Ecol. 1989, 2, 111–133. [Google Scholar] [CrossRef]
  57. Hamad, R.; Balzter, H.; Kolo, K. Predicting Land Use/Land Cover Changes Using a CA-Markov Model under Two Different Scenarios. Sustainability 2018, 10, 3421. [Google Scholar] [CrossRef]
  58. Sang, L.; Zhang, C.; Yang, J.; Zhu, D.; Yun, W. Simulation of land use spatial pattern of towns and villages based on CA–Markov model. Math. Comput. Model. 2011, 54, 938–943. [Google Scholar] [CrossRef]
  59. Araya, Y.H.; Cabral, P. Analysis and Modeling of Urban Land Cover Change in Setúbal and Sesimbra, Portugal. Remote Sens. 2010, 2, 1549–1563. [Google Scholar] [CrossRef]
  60. Mohamed, E.S.; Belal, A.; Saleh, A. Assessment of land degradation east of the Nile Delta, Egypt using remote sensing and GIS techniques. Arab. J. Geosci. 2013, 6, 2843–2853. [Google Scholar] [CrossRef]
  61. El-Zeiny, A.M.; Effat, H.A. Environmental analysis of soil characteristics in El-Fayoum Governorate using geomatics approach. Environ. Monit. Assess. 2019, 191, 463. [Google Scholar] [CrossRef]
  62. Elbeih, S.F.; El-Zeiny, A.M. Qualitative assessment of groundwater quality based on land use spectral retrieved indices: Case study Sohag Governorate, Egypt. Remote Sens. Appl. Soc. Environ. 2018, 10, 82–92. [Google Scholar] [CrossRef]
  63. El-Zeiny, A.M.; Effat, H.A. Environmental monitoring of spatiotemporal change in land use/land cover and its impact on land surface temperature in El-Fayoum governorate, Egypt. Remote Sens. Appl. Soc. Environ. 2017, 8, 266–277. [Google Scholar] [CrossRef]
Figure 1. The location of the study area in the Nile Delta, Egypt. Inset bottom right is a Landsat7 satellite image (RGB 3, 2, 1).
Sustainability 11 04662 g001
Figure 2. Workflow of the present study including the collected data and all of the processing steps.
Sustainability 11 04662 g002
Figure 3. Location of the study area and the 600 ground-truth points in Kafr El Sheikh Governorate.
Sustainability 11 04662 g003
Figure 4. Location of the study area (Landsat operational land imagery (OLI) satellite image from 2016; RGB 4, 3, 2) and the soil profiles (n = 21).
Sustainability 11 04662 g004
Figure 5. Map of measured soil capability degree in the study area. Degrees range between class II and class VI.
Sustainability 11 04662 g005
Figure 6. Changes in land use in the study area between 1984 and 2016. (a) Supervised classification of the study area using thematic mapper (TM) satellite imagery from 1984. (b) Supervised classification of the study area using TM satellite imagery from 2000. (c) Supervised classification of the study area by enhanced thematic mapper (ETM) satellite imagery from 2010. (d) Supervised classification of the study area using OLI satellite imagery from 2016.
Sustainability 11 04662 g006aSustainability 11 04662 g006b
Figure 7. The observed spatial distribution of soil sealing between 1984 and 2016.
Sustainability 11 04662 g007
Figure 8. The simulated increase in urban area as a result of soil sealing in the study area between 2016 and 2048.
Sustainability 11 04662 g008
Table 1. The results of the accuracy assessment and the calculation of kappa statistics for land use and land cover (LULC) types in the study area between 1984 and 2016.
LULC1984200020102016
Producer (%)User (%)Producer (%)User (%)Producer (%)User (%)Producer (%)User (%)
Agricultural land92.596.195.495.295.895.19998.8
Urban land88.188.191.79294.990.798.198.5
Fish ponds90.477.592.987.596.696.697.998.3
Lake Burullus73.693.369.288.27691.893.391.8
Overall accuracy89 92 94 98.1
Kappa statistic0.84 0.88 0.91 0.97
Table 2. Calculated changes in LULC in the study area between 1984 and 2016.
LULC1984 (km2)2000 (km2)2010 (km2)2016 (km2)Change (%)
1984–20002000–20102010–2016
Urban land114.9148.3213.1274.029.143.628.6
Agricultural land2389.82582.72477.12485.08.1−4.10.3
Fish farms71.0303.6373.8381.9327.723.12.2
Lake Burullus391.9239.5304.8243.6–38.927.3–20.1
Natural Vegetation274.9235150210.4–14.5–36.240.3
Sabkha (salt flat)130.181.987.474.7–37.16.8–14.5
Sand133.3122.5108.549.9−8.1−11.4−54.0
Bare land217.611.110.37.8−94.9−7.2−24.4
Water logging2.70.8--−71.9--
Nile River15.916.617.114.7−4.43.1−14.4

