Article

Measuring the Scale and Scope of Workplace Bullying: An Alternative Workplace Bullying Scale

1
Department of Applied Psychology, Lahore College for Women University, Lahore 54000, Pakistan
2
Department of Zoology, Lahore College for Women University, Lahore 5400, Pakistan
3
School of Business & Economics, Deree College, The American College of Greece, 153-42 Athens, Greece
4
Effat College of Business, Effat University, Jeddah P.O. Box 34689, Saudi Arabia
5
Department of Sociology, Manchester Metropolitan University, Manchester M15 6BH, UK
6
Department of Operations, Technology, Events and Hospitality Management, Manchester Metropolitan University, Manchester M15 6BH, UK
*
Author to whom correspondence should be addressed.
Sustainability 2019, 11(17), 4634; https://doi.org/10.3390/su11174634
Submission received: 26 July 2019 / Revised: 19 August 2019 / Accepted: 22 August 2019 / Published: 26 August 2019
(This article belongs to the Special Issue Technology Enhanced Learning Research)

Abstract

:
The toll of workplace bullying is immense, yet, similarly as with an iceberg, its scope, scale and implications tend to remain underestimated. Several ways of assessing the prevalence of workplace bullying have been proposed in the literature. The most frequently discussed are the ‘subjective method’ assessing individuals’ perceptions of being a victim and the questionnaire, i.e., criterion-based, methods, including Negative Acts Questionnaire (NAQ) and Leymann Inventory of Psychological Terror (LIPT). Since in both cases culture plays a profound role as a mediating factor in the process of identifying, collecting, and processing data, the applicability of these methods across cultures and countries has several limitations. At this stage, it is impossible to determine the impact of the implicit cultural-bias that these methods entail on the research outcomes. This would be possible if an alternative workplace bullying scale (WBS) was at hand and, consequently, a comparative analysis was conducted. This paper, drawing from a study conducted at higher education institutions (HEI) across Pakistan, addresses this issue by devising an alternative WBS. The value added of this paper is three-fold, i.e., it elaborates on the study and the specific methods employed to prove the validity and relevance of the alternative WBS. Moreover, by so doing, it addresses some of the limitations that other methods measuring the prevalence of workplace bullying display. As a result, it adds to the researchers’ and administrators’ toolkit as regards research and policies aimed at mitigating the scope and scale of bullying at HEIs across cultures and countries.

1. Introduction

Workplace bullying seems to be an elusive concept in that it is challenging, first, to grasp the scope and scale of acts of hostility bullying implies and, second, to quantify it [1]. Several definitions of workplace bullying exist. In a nutshell, one could make a case that workplace bullying is essentially about purposeful breaches of an individual’s space of dignity, rights, and integrity. To put it differently, workplace bullying means harassing, offending, socially excluding someone, and/or negatively affecting someone’s work tasks [2]. This is an escalating process, in which a person feels unable to control negative acts (e.g., repeated attempts to undermine your personal dignity, excessive monitoring of your work, name calling, etc.) and becomes the target of systematic negative social behavior. A consensus exists about circumstances, in which negative behaviors can be called bullying [3].
To classify an act of behavior as bullying, three criteria have to be met: (1) Exposure to negative treatment systematically (i.e., once a week); (2) Exposure to negative treatment in a long term (approximately six months); and (3) Power inequality between the exposing and the exposed to negative treatment party [4,5,6,7]. A behavior that takes place only once or is repeated from time to time cannot be considered bullying. Previous studies [8,9] show that workplace bullying is different from typical job-related stress situations. The main reason for that is that bullying, unlike stress typical to specific occupations, encompasses a systematic targeting of an individual, including humiliation in front of other colleagues, unjustified criticisms, or intentional exclusion [10]. Moreover, there is a certain frequency to workplace bullying (e.g., weekly) and a certain duration (e.g., approximately six months). There has been some progress as regards to recognizing workplace bullying as a phenomenon that does exist, still a lot of work is needed to name it, expose it, measure it, and address it.
Indeed, over the past decade, several studies reported on negative implications of bullying not only on health and wellness of employees, but also on organizations themselves [11,12,13]. Research [14,15,16,17] suggests that victims of bullying may endure not only physical consequences (e.g., heart diseases, sleep problems, headaches), psychological problems (e.g., depression, anxiety) but also behavioral strains (e.g., aggressive behavior, crying). Workplace bullying may lead to a decrease in job satisfaction, loss in productivity and increased intention to leave [18,19]. There is, therefore, an urgent need to be increase the general awareness of bullying, to improve our capacity to measure and assess the scale and scope of bullying, and finally to address bullying and its implications. Practice suggests that diagnosis and tangible evidence are needed to wither away disbelief and convince all stakeholders that a practice, in this case bullying, is taking place. Quantifiable results are the ones that are the most convincing. In this view, considering the scale of bullying and the breadth of its negative implications on individuals and on organizations, it is necessary to devise a tool that allows to quantify the scope and scale of bullying in the workplace as it affects an increasing number of individuals.
Generally, researchers have employed one or two different methods to assess the prevalence of workplace bullying. The first is the subjective method of asking participants whether they—based on a given definition of workplace bullying—perceive themselves as victims of bullying [20]. The second is the operational, or criterion-based, method, where various questionnaires of workplace bullying are used e.g. Negative Acts Questionnaire (NAQ) [2]. The employees are given a list of negative acts at workplace and they are prompted to tick the ones they have been subjected to. The most popular tools for the measurement of workplace bullying are the Leymann Inventory of Psychological Terror (LIPT-60) [21] and the Negative Acts Questionnaire (NAQ) [2]. Despite the strengths of these bullying measurement methods and related scales, there is, however, considerable room for improvement [22,23]. Existing bullying questionnaires are very lengthy (e.g., LIPT-60) and, since they were developed in Europe, they are culturally specific and may have limited application in Pakistan. As a result, the appropriateness of administering these measures outside Europe may be questionable. It is also argued [24] that workplace structure is the key factor in the occurrence of workplace bullying. It is also argued that societies ranking high in power distance (PDI) and low in uncertainty avoidance (UAI) [25,26] may be more prone to workplace bullying. In this reading, workplace bullying might be more prevalent in Asian societies as compared to European countries, and then Canada, or the United States [27]. Sadly, our own research suggests—and this might be the key feature of workplace bullying—the ways and means ‘adjust’ flawlessly to culture specifics. Hence, it would be simplistic to say that some cultures are more/less prone to bullying and research seems to attest to that [28]. Importantly, what may be changing though across cultures, are the means and patterns of practices associated with bullying, also attitudes to bullying and ways of responding to it. In this context, one can make a case that Pakistan and other Asian countries have distinct features of work culture, being more vertical, collective, concerned for the quality of interpersonal relation, and hierarchy oriented. This might result in specific patterns of workplace bullying. The same would apply to other countries representative of different cultures.
The generalizability of the existing bullying scales in countries like Pakistan, where English is not the first language must also be considered, because some words convey different meanings in different cultures. Sometimes, it is also hard to find suitable substitute for a particular English word while translating the statements, which may change its meaning, especially when using technical terms in a specific context [29,30,31]. Language barriers could also influence the accurate assessment of workplace bullying. Some scales (e.g., LIPT-60) are somewhat long and, consequently difficult to use in standard organizational surveys. For the above-mentioned reasons, theoretical and practical benefits are likely to be derived not only from a new instrument encompassing the previous ones, but also from the validity added by a sample of indigenous participants. Therefore, the need for developing a culturally anchored measurement of bullying at work in Pakistan that is short and comprehensible seems to be justified. The remainder of this paper is structured as follows. Section 2 outlines the phases of the study and the methods employed to garner the results. The Discussion follows in Section 3 and Conclusions ensue.

2. Method and Methodology

This study consisted of four phases. In phase I, items of the Workplace Bullying Scale were generated using both inductive and deductive approaches. The exploratory factor analysis (EFA) was run on 200 university faculty aged 22 to 60 years (M = 36.40, SD = 10.70) in phase II. A Varimax rotation method was used, which yielded two factors: person-related and work-related bullying; this accounted for 60% of the variance. In phase III, Confirmatory Factor Analysis (CFA) was run to validate the findings of EFA. The sample for CFA consisted of 400 faculty aged 21 to 60 years (M = 34.0, SD = 8.0). This convenience sample was recruited from 7 universities of Lahore (Pakistan). The CFA demonstrated a good fit with the data. The Cronbach alpha coefficients for work-related and person related bullying ranged from 0.77 to 0.87 respectively and 0.88 for the total workplace bullying scale. In phase IV, the convergent validity of the Workplace Bullying Scale was determined by finding a positive correlation (r = 0.75) with the score of the Job Stress Scale (JSS).

3. The Study and Its Results

3.1. Phase I—Item Generation for Workplace Bullying Scale (WBS)

Items for the WBS were derived using both inductive and deductive approaches. The following sources were used to generate the WBS items: (a) literature review, (b) in-depth interviews of 20 university teachers with equal number of both genders selected through convenience sampling, and (c) interview of five psychologists. Interviews were comprised of semi-structured questions (e.g., describe bullying behaviors you face or observe at you workplace). These questions were prepared with the consultation of three university faculty taken from the psychology department to ensure a comprehensive and wide range of bullying behaviors (e.g., colleagues provide you necessary professional information, respect your personal dignity, give you due rights e.g., leave, include, or exclude you from group activities, etc.) particularly occur in our culture. These interviews were carried out individually and face to face. The researcher explored and encouraged research participants to describe bullying behaviors. Furthermore, these interviews were audio recorded with the permission of participants. The audio tape interviews and notes were transcribed. The bullying behaviors gathered from the abovementioned sources were pooled together in the form of a list. All the statements of scale were written in the native language Urdu. This list of items was presented to four experts (who had expertise in bullying research). After the Scrutiny of the WBS items (on the basis of clarity, fidelity, comprehensibility, and redundancy), with the consensus of four experts, 31 items were finalized [32].
To measure workplace bullying we have two methods. First, we can calculate a binary bullying score to classify participants as either bullied or not bullied. Based on the existing literature [5,6,33], the criterion was that respondents had to have experienced at least two of the bullying behaviors weekly or more often over the past 6 months. Second, the mean score across the all items can be computed to yield an average response for each participant. Participants who had more than average scored can be classified as bullied [34].
In order to determine the clarity of the items and the level of difficulty, a pilot study was conducted on 30 faculty (male = 14, female = 16) selected by convenience from different universities of Lahore, Pakistan. Participants’ ages ranged between 24 and 60 years (Mean = 34.73, standard deviation = 8.85). Participants were approached personally in their respective work places. Finally, 21 items were chosen to ensure factor validity and theoretical structure of workplace bullying scale via EFA.

3.2. Phase II—Factor Structure, Construct Validity, and Internal Consistency of the Scale Sample

An independent sample of 200 teachers was selected through convenience sampling from three major universities in Lahore. The age range of sample was between 24 to 60 years (M = 33.55, SD = 8.0). Both men and women employees were included in the sample. Participants with various levels of qualification and ranks were included. The base line for the work experience was 1 year. Participants diagnosed with any clinical problem (prior to bullying exposure) were excluded from study.

3.2.1. Procedure

First of all, participants’ consent was obtained. WBS was administered individually in their respective institutes. All participants were informed about the purpose of the study and written instructions to fill questionnaire. The researcher also assured the confidentiality and anonymity to participants about their feedback since no names were noted. All 200 questionnaires were fully completed.

3.2.2. Results

After testing all assumptions for factor analysis, 21 items of the workplace bullying strains scale were subjected to exploratory factor analysis. The Varimax rotation method was employed to extract the principal components. Analysis produced two factors exceeding Eigen value 1 (see Table 1). Both factors were well defined, interpretable, clear, and accurate. Factors were finalized on the basis of theoretical relevance, scree plot, and Eigen values > 1.0 [35]. Furthermore, a significant amount of variance (60.0%) was accounted for both well-defined factors [36]. Factor 1 describes items related to threats about one’s professional life. This factor was labeled as “Work-Related Bullying”. This factor consisted of 10 items of WBS (5, 6, 7, 12, 13, 15, 16, 17, 18, and 19) (see Appendix A).
Factor 2 consisted of items related to attack on ones’ personality and personal life. So, factor 2 was labeled as “Person-Related Bullying”. This factor comprised of 11 items (1, 2, 3, 4, 8, 9, 10, 11, 14, 20, and 21) (see Table 1, Figure 1 and Appendix A).
Table 2 shows that all the subscales of the WBSS are reliable. Both subscales are positively correlated with each other and with total workplace bullying scale. So, WBS is internally consistent measure.

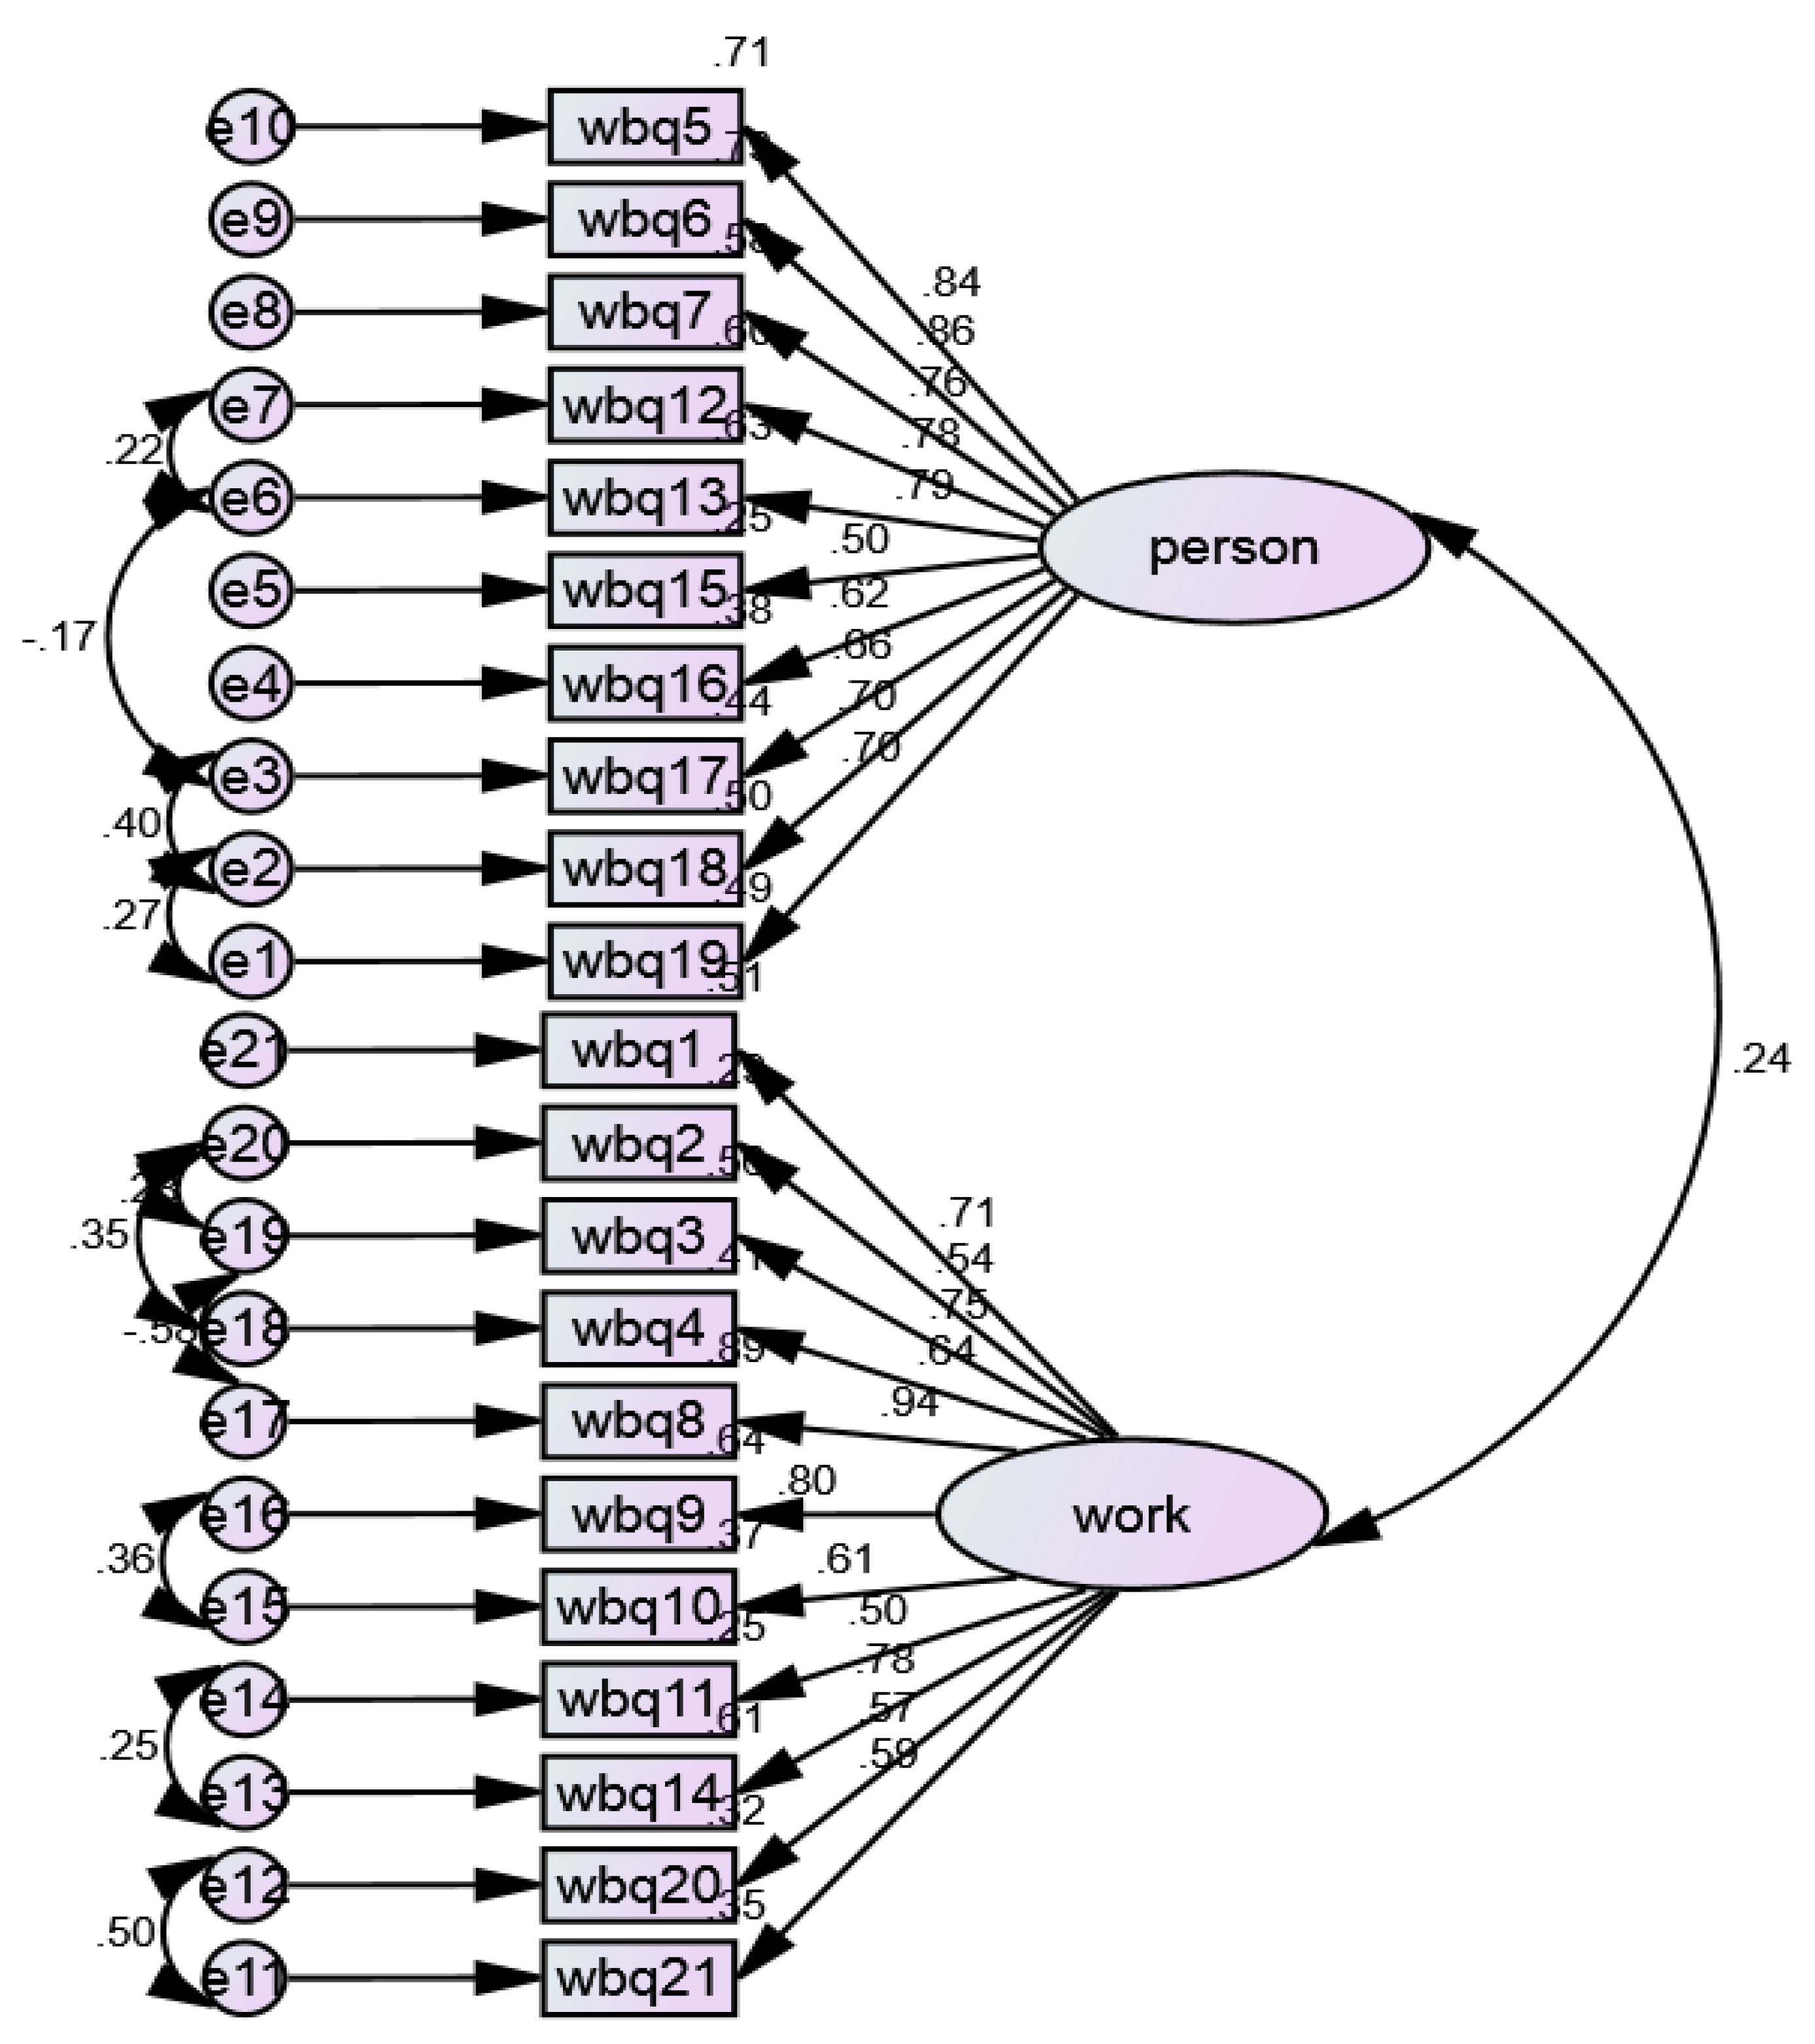
3.3. Phase III—Confirmatory Analysis Sample

An independent sample of 400 university faculty (men = 200, women = 200) was collected from seven universities (both public and private) in Lahore, Pakistan. The age range of the sample was 22 to 60 years (M = 38.50, SD = 9.40) (Minimum 21 is the age of starting job and 60 retirement in university). The participants belong to various job ranks, levels of education, and socio-economic statuses. Only faculty who had more than 1 year of teaching experience were included (1 year was set as criteria because problems may be because of adjustment and not bullying).

3.3.1. Instrument

The workplace bullying scale developed in Phase I was used. This scale consists of two subscales, including work-related bullying (WRB) and person-related bullying (PRB).

3.3.2. Procedure

Participants were approached after the official permission from university authorities. Researcher presented a written consent form to participants individually with the complete information regarding the aim of the research. The WBS developed in Phase I was accompanied by a set of written guidelines (e.g., How often have you been subjected to the following negative acts at work or you have observed your colleague? Please mark on any one of the five options e.g., never, rarely, monthly, weekly and daily that best corresponds with your experience over the last six months) explaining how the questionnaire should be responded to. This study was conducted in a manner that respects the dignity, right and welfare of all the participants of research. Participants were informed that all the information revealed by them will be kept confidential. Participants were also informed that they can withdraw from the study at any time. Researcher collected all data personally.

3.3.3. Results

In order to confirm the factor structure of the WBS (as emerged in the EFA) a confirmatory factor analysis was used. The results of the CFA show a good fit to the data with Chi- square = 427.46, df = 159, Chi square/df = 2.68, RMSEA = 0.04, CFI = 0.92, TLI = 0.91, GFI = 0.91, p < 0.05. Non-significant Chi- square is recommended for CFA, but for large sample the value of Chi-square will virtually always be significant. So, Chi-Square was divided by degree of freedom and the results showed Chi Square = 2.68, which is less than 0.3 and represents a good fit model (Hatcher, 1994).

3.4. Phase IV—Convergent Validity of Workplace Bullying Scale

To establish the convergent validity of the newly developed scale, WBS scores were compared with the Job Stress Scale (JSS) developed by Parker and DeCotiis [34]. It was hypothesized that both scales, having similar constructs, will be positively correlated.

3.4.1. Sample

The sample of this study consisted of 60 faculty (men = 30, women = 30) of age ranged between 23 and 60 years (M = 31.50, SD = 6.32). All the participants were recruited from different universities in Lahore. Participants were selected from diverse socio-economic backgrounds, job ranks, and education levels. Only those participants who had at least 1 year of teaching experience were selected.

3.4.2. Material

Workplace Bullying Scale (WBS)

The newly developed 21 items workplace bullying scale was used. The scale was scored on a five-point Likert rating scale where Never scored as 1 and Daily as 5. Cronbach’s alpha acquired in the present study was 0.87, and 0.77 for Person-related bullying and work-related bullying, respectively, and 0.91 for total WBSS scale.

Job Stress (JSS)

The job stress scale measures employees’ work-related stress [37]. This scale consists of 13 items. Each item of JSS was scored on five-point Likert-type scale from strongly disagree (1) to strongly agree (5). Cronbach’s alpha of JSS was 0.86.

3.4.3. Procedure

Participants were approached at their respective workplaces. They were individually contacted. After seeking permission from participants they were requested to complete the questionnaires by choosing the appropriate option. All the participants were guaranteed that their responses will be kept confidential. All participants completed and returned set of questionnaires. It took about 10 to 15 min to complete the protocol. All the participants filled questionnaires with keen interest. Participants were acknowledged for their cooperation. To establish the convergent validity of the newly constructed scale, we calculated correlations between subscales of WBS and perceived job stress scale.

3.4.4. Results

To test the hypothesis that the workplace bullying scale is positively correlated with the job stress scale, Pearson’s correlation was calculated. The findings presented in Table 3 show that total and all the subscales of WBS significantly and positively correlate with job stress scale.

4. Discussion

The present study was conducted to construct a valid and reliable tool for the assessment of bullying behaviors. This study was completed in four phases and the findings showed that bullying occurs in the form of personal attacks and professional damage (work-related bullying and person-related bullying). Keeping in view the sensitive nature of bullying phenomenon, none of the items explicitly use the word “bullying”. All items were written in behavioral form. The construct validity of the scale was determined through exploratory factor analysis (N = 200). Two interpretable and distinctive factors based on 21 items emerged as a result of the Varimax rotation method. The items of the scale were designed to measure bullying behaviors. Final factor structure was interpreted keeping in view the magnitude of factor loading and based on theoretical relevance of the items to the respective factors. A detailed examination of the twenty-one items appearing in two factors confirmed that they were relatively conceptually distinct from each other. Previous researches also showed that victims experience two forms of bullying, i.e., “work-related bullying” and “person-related [38]. In the present study, factor 1 described items related to “work-related bullying”. Literature shows that the bully makes the life of the victim difficult [39]. Their bullying behaviors make it difficult to carry out the employees’ work or involve taking away some or all of their professional responsibilities. Such types of bullying behavior are a hurdle in progress and promotion of the employee [40]. The second factor emerged in our study consists of bullying behaviors related to persons related in the bully target victims’ personal life. They spread rumors about one’s personal life, ignore one’s opinion because of one’s gender or age, or pass malicious jokes.
The Cronbach alpha for the total WBS was 0.88. The alpha coefficients of both factors of the scale showed high internal consistency and had significant items total correlations (most of the items total correlation > 0.3) and inter-correlations among factors. In order to confirm the factor structure, we employed CFA on an independent normative sample (N = 400). The final model showed excellent fit indices and confirmed 21 items with two distinct dimensions (viz., work-related bullying, and person-related bullying) (see Figure 1).
Convergent validity was established through the Pearson product–moment correlation method. Respondents’ scores for bullying behaviors on the scale of WBS were observed with the scores of perceived job stress scale (PSS) developed by Parker and Decotiis [37]. Results showed significant and positive correlation of subscales and total WBS with perceived job stress scale. A significant positive relationship supported our claim that the newly developed scale has strong convergent validity.

Limitations

The major limitation of the present research is that data was collected only from Punjab province, so to increase the external validity of WBS future researches should include large and diverse sample. Furthermore, this study only examined one construct (i.e., job stress scale) to assess convergent validity. Other valid and reliable constructs (i.e., occupational stress scale, general measure of work stress scale, etc.) should also be tested by future scholars to strengthen the convergent validity of this scale.

5. Conclusions

The negative relationship between bullying, an individual’s well-being and productivity has acquired considerable attention in academia [41,42,43,44,45]. Implicitly, the discussion on bullying hints to the enabling structures, in which acts of bullying take place. In this way, this paper suggested that bullying measures implemented at the institutional level that is that of an institution’s administration [46,47]. This scale will also helpful for victims to identify and avoid bullying behaviors. Considering that the existing WBS display several limitations, the objective of this paper was to devise an alternative WBS and, thus open the possibility of comparing the validity of results thus obtained. This, indeed, might be done in our future research. Despite its limitations, the alternative WBS displays high reliability and validity. Future research will show how useful a tool it actually is.

Author Contributions

A.A. conceptualized the idea. A.A. and A.M. planned the study, performed statistical analysis and drafted the manuscript. A.V. and R.N. edited analysis and critically revised the manuscript. A.M. critically revised the manuscript and supervised the study. F.M. helped drafting the manuscript. All authors contributed significantly to the submitted manuscript. A.M. and R.N. oversaw the project.

Funding

This research received no external funding.

Acknowledgments

Raheel Nawaz would like to thank the Business Transformation Research Centre at Manchester Metropolitan University for their financial support. Anna Visvizi would like to thank Effat University in Jeddah, Saudi Arabia, for funding the research reported in this paper through the Research and Consultancy Institute.

Conflicts of Interest

The authors declare no conflict of interest.

Appendix A. Workplace Bullying Scale (Translated in English)

The following behaviors are often seen as examples of negative behaviors in the workplace. How often have you been subjected to the following negative acts at work? Please mark tick (√) on any one of the five options that best corresponds with your experience over the last six months.
S.no: Statements
NeverRarelyMonthlyWeeklyDaily
12345
1Shifting work tasks without your consultation
2Undervaluing of your work
3Being ordered to do work below your level of proficiency
4Persistent unjustified monitoring of your work
5Repeated attempts to undermine your personal dignity
6Verbal and non-verbal threats
7Making inappropriate jokes about you
8Withholding necessary information affecting your professional progress
9Exclude you from workgroup activities
10Reject your application for leave, training or promotion without reason
11Setting of impossible deadlines to accomplish work
12Spread rumors about you
13Repeated offensive remarks about your person or private life
14Signals from others that you should resign your job
15Repeated reminders of your mistakes
16Neglect of your opinions or views
17Not give importance of your rights and opinions with reference to your gender
18Devaluation of your rights and opinions with reference to your age
19Negative responses from others because you work hard
20Several times forced to attend supplementary meetings and training sessions
21Intimidatory use of discipline/competence procedure

References

  1. Anjum, A.; Muazzam, A.; Manzoor, F.; Visvizi, A.; Nawaz, R. Mediating Bullying and Strain in Higher Education Institutions: The Case of Pakistan. Sustainability 2019, 11, 2244. [Google Scholar] [CrossRef]
  2. Einarsen, S.; Hoel, H.; Notelaers, G. Measuring exposure to bullying and harassment at work: Validity, factor structure and psychometric properties of the Negative Acts Questionnaire-Revised. Work Stress 2009, 23, 24–44. [Google Scholar] [CrossRef]
  3. Matthiesen, S.B.; Einarsen, S. Perpetrators and targets of bullying at work: role stress and individual differences. Violence Vict. 2007, 22, 735–753. [Google Scholar] [CrossRef] [PubMed]
  4. Harlos, K.; Knoll, M. Employee Silence and Workplace Bullying. In Pathways of Job-Related Negative Behaviour; Handbooks of Workplace Bullying, Emotional Abuse and Harassment; D’Cruz, P., Noronha, E., Eds.; Springer: Singapore, 2018; Volume 2. [Google Scholar]
  5. Mikkelsen, E.G.; Einarsen, S. Basic assumptions and post-traumatic stress among victims of workplace bullying. Eur. J. Work Organ. Psychol. 2002, 11, 87–111. [Google Scholar] [CrossRef]
  6. Salin, D. Prevalence and forms of bullying among business professionals: A comparison of two different strategies for measuring bullying. Eur. J. Work. Organ. Psychol. 2001, 10, 425–441. [Google Scholar] [CrossRef] [Green Version]
  7. Vartia, M.A.L. Consequences of workplace bullying with respect to the well-being of its targets and the observers of bullying. Scand. J. Work. Environ. Heal. 2001, 27, 63–69. [Google Scholar] [CrossRef] [Green Version]
  8. Johnson, S.; Cooper, C.; Cartwright, S.; Donald, I.; Taylor, P.; Millet, C. The experience of work-related stress across occupations. J. Manag. Psychol. 2005, 20, 178–187. [Google Scholar] [CrossRef]
  9. Baillien, E.; De Witte, H. Why is Organizational Change Related to Workplace Bullying? Role Conflict and Job Insecurity as Mediators. Econ. Ind. Democr. 2009, 30, 348–371. [Google Scholar] [CrossRef]
  10. Agervold, M. Bullying at work: A discussion of definitions and prevalence, based on an empirical study. Scand. J. Psychol. 2007, 48, 161–172. [Google Scholar] [CrossRef]
  11. Giorgi, G. Workplace bullying in academia creates a negative work environment. An Italian study. Empl. Rights Responsib. J. 2012, 24, 261–275. [Google Scholar] [CrossRef]
  12. Power, J.L.; Brotheridge, C.M.; Blenkinsopp, J.; Bowes-Sperry, L.; Bozionelos, N.; Buzády, Z.; Chuang, A.; Drnevich, D.; Garzón-Vico, A.; Leighton, C.; et al. Acceptability of workplace bullying: A comparative study on six continents. J. Bus. Res. 2013, 66, 374–380. [Google Scholar] [CrossRef]
  13. Rai, A.; Upasna, A.A. Linking workplace bullying and eleven outcomes: Role of psychological contract violation and workplace friendship. Int. J. Manpow. 2019, 40, 211–227. [Google Scholar] [CrossRef]
  14. Björkqvist, K.; Osterman, K.; Hjelt-Bäck, M.; Hjelt-Bäck, M. Aggression among university employees. Aggress. Behav. 1994, 20, 173–184. [Google Scholar] [CrossRef]
  15. Bowling, N.A.; Beehr, T.A. Workplace harassment from the victim’s perspective: A theoretical model and meta-analysis. J. Appl. Psychol. 2006, 91, 998–1012. [Google Scholar] [CrossRef] [PubMed]
  16. Einarsen, S.; Nielsen, M.B. Workplace bullying as an antecedent of mental health problems: A five-year prospective and representative study. Int. Arch. Occup. Environ. Health 2015, 88, 131–142. [Google Scholar] [CrossRef] [PubMed]
  17. Tianwei, X.U.; Hanson, H. Workplace bullying and violence as risk factors for type 2 diabetes: A multi cohort study and meta-analysis. Diabetologia 2018, 61, 75–83. [Google Scholar]
  18. Robert, F. Impact of Workplace Bullying on Job Performance and Job Stress. J. Manag. Inf. 2018, 5, 12–15. [Google Scholar] [CrossRef]
  19. Visvizi, A.; Lytras, M.D.; Daniela, L. Chapter 19 Education, Innovation and the Prospect of Sustainable Growth and Development. In The Future of Innovation and Technology in Education: Policies and Practices for Teaching and Learning Excellence; Emerald Publishing: Bingley, UK, 2018; pp. 297–305. [Google Scholar]
  20. Niedl, K. Mobbing and well-being: Economic and personal development implications. Eur. J. Work Organ. Psychol. 1996, 5, 239–249. [Google Scholar] [CrossRef]
  21. Korukcu, O.; Bulut, O.; Tuzcu, A.; Bayram, Z.; Türkmen, H.O. An adaptation of Leymann Inventory of Psychological Terror to health sciences programs in Turkey. Anadolu Psikiyatr. Derg 2014, 15, 335–343. [Google Scholar] [CrossRef]
  22. Lynn, M.R. Determination and Quantification of Content Validity. Nurs. Res. 1986, 35, 382. [Google Scholar] [CrossRef]
  23. Nielsen, M.B.; Matthiesen, S.B.; Einarsen, S. Leadership and bullying. Posttraumatic symptoms among victims after bullying by their leaders. Nord. Psykol. 2005, 57, 391–415. [Google Scholar] [CrossRef]
  24. Tracy, S.J.; Alberts, J.K.; Lutgen-Sandvik, P.; Lutgen-Sandvik, P. Burned by Bullying in the American Workplace: Prevalence, Perception, Degree and Impact. J. Manag. Stud. 2007, 44, 837–862. [Google Scholar]
  25. Escartín, J.; Zapf, D.; Arrieta, C.; Rodríguez-Carballeira, Á. Workers’ perception of workplace bullying: A cross-cultural study. Eur. J. Work. Organ. Psychol. 2011, 20, 178–205. [Google Scholar] [CrossRef]
  26. Zabrodska, K.; Kveton, P. Prevalence and Forms of Workplace Bullying Among University Employees. Empl. Responsib. Rights J. 2013, 25, 89–108. [Google Scholar] [CrossRef]
  27. Akella, D. Workplace Bullying: Not a Manager’s Right? J. Workplace Rights. 2016, 6, 1–10. [Google Scholar] [CrossRef]
  28. National Academies of Sciences, Engineering, and Medicine. Preventing Bullying Through Science, Policy, and Practice; The National Academies Press: Washington, DC, USA, 2016. [Google Scholar]
  29. Khalid, K.; Afzal, H.; Moqaddas, F.; Iltaf, N.; Sheri, A.M.; Nawaz, R. Extension of Semantic Based Urdu Linguistic Resources Using Natural Language Processing. In Proceedings of the IEEE 15th International Conference on Dependable, Autonomic and Secure Computing, 15th International Conference on Pervasive Intelligence and Computing, 3rd International Conference on Big Data Intelligence and Computing and Cyber Science and Technology Congress(DASC/PiCom/DataCom/CyberSciTech), Orlando, FL, USA, 6–10 November 2017; pp. 1322–1325. [Google Scholar]
  30. Thompson, P.; Nawaz, R.; McNaught, J.; Ananiadou, S. Enriching news events with meta-knowledge information. Lang. Resour. Eval. 2017, 51, 409–438. [Google Scholar] [CrossRef]
  31. Ali, S.; Mehmood, F.; Dancey, D.; Ayaz, Y.; Khan, M.J.; Naseer, N.; Amadeu, R.D.C.; Sadia, H.; Nawaz, R. An Adaptive Multi-Robot Therapy for Improving Joint Attention and Imitation of ASD Children. IEEE Access 2019, 7, 81808–81825. [Google Scholar] [CrossRef]
  32. Davis, L.L. Instrument review: Getting the most from your panel of experts. Appl. Nurs. Res. 1992, 5, 194–197. [Google Scholar] [CrossRef]
  33. Hauge, L.J.; Skogstad, A.; Einarsen, S. Relationships between stressful work environments and bullying: Results of a large representative study. Work Stress 2007, 21, 220–242. [Google Scholar] [CrossRef] [Green Version]
  34. Gregory, R.L. Eye and Brain: The psychology of Seeing; Princeton University Press: Princeton, NJ, USA, 2015. [Google Scholar]
  35. Kaiser, H.F. The Application of Electronic Computers to Factor Analysis. Educ. Psychol. Meas. 1960, 20, 141–151. [Google Scholar] [CrossRef]
  36. William, B.; Onsman, A.; Brown, T. A research and factor analysis of a paramedic graduate attribute scale. Eval. Health Prof. 2012, 35, 148–168. [Google Scholar] [CrossRef]
  37. Parker, D.F.; Decotiis, T.A. Organizational determinants of job stress. Organ. Behav. Hum. Perform. 2001, 32, 160–177. [Google Scholar] [CrossRef]
  38. Einarsen, S. The nature and causes of bullying at work. Int. J. Manpow. 1999, 20, 16–27. [Google Scholar] [CrossRef]
  39. Einarsen, S.; Raknes, B.I. Harassment in the Workplace and the Victimization of Men. Violence Vict. 1997, 12, 247–263. [Google Scholar] [CrossRef]
  40. Mattheisen, S.B. Bullying at Work, Antecedents and Outcomes; The Free Press: New York, NY, USA, 2006. [Google Scholar]
  41. Agervold, M.; Mikkelson, E.G. Relationship between bullying, psychosocial work and individual stress reactions. Work Stress 2004, 18, 336–351. [Google Scholar] [CrossRef]
  42. Mikkelsen, E.G.; Einarsen, S. Bullying in Danish work-life: prevalence and health correlates. Eur. J. Work Organ. Psychol. 2001, 10, 393–414. [Google Scholar] [CrossRef]
  43. Bowling, N.A.; Beehr, T.A. Occupational stress and failures of social support: When helping hurts. J. occu. Psychol. 2010, 15, 45–59. [Google Scholar]
  44. De Cuyper, N.; Baillien, E.; De Witte, H. Job insecurity, perceived employability and targets’ and perpetrators’ experiences of workplace bullying. Work Stress 2009, 23, 206–224. [Google Scholar] [CrossRef]
  45. Anjum, A.; Muazzam, A. The Gendered Nature of Workplace Bullying in the Context of Higher Education. Pak. J. Psychol. Res. 2018, 33, 493–505. [Google Scholar]
  46. Visvizi, A.; Lytras, M.D.; Sarirete, A. Management and Administration of Higher Education Institutions in Times of Change; Emerald Publishing: Bingley, UK, 2019; ISBN 9781789736281. [Google Scholar]
  47. Bass, B.M.; Avolio, B.J. Improving Organizational Effectiveness through Transformational Leadership; Sage: Thousand Oaks, CA, USA, 1994. [Google Scholar]
Figure 1. The Final Model to Confirm the Factor Structure of the Workplace Bullying.
Sustainability 11 04634 g001
Table 1. Factor loading for workplace bullying scale (N = 200).
ItemsFactors
12Item Total Correlation
wbq10.1030.7100.55 **
wbq2-0.6780.44 **
wbq30.1230.7640.61 **
wbq4−0.1100.7590.44 **
wbq50.850-0.65 **
wbq60.858-0.64 **
wbq70.7650.1210.64 **
wbq80.1270.8680.57 **
wbq90.1080.7840.54 **
wbq100.1060.6700.63 **
wbq110.3380.5260.64 **
wbq120.819-0.50 **
wbq130.806-0.54 **
wbq140.1570.7960.55 **
wbq150.5200.2750.56 **
wbq160.656-0.64 **
wbq170.718-0.58 **
wbq180.7650.1070.66 **
wbq190.7380.1560.65 **
wbq20-0.6410.58 **
wbq210.1240.6740.55 **
Eigen values 34.8421.40
Cumulative percentage of variance29.3360.0
** p < 0.01. Note. Items with 0.40 or above are boldfaced and selected for scale (Raubenheimer, 2004).
Table 2. Alpha Coefficient and Inter-Correlation for Subscales and Total Score of Workplace Bullying Scale (N = 200).
Factors123
1. Person B---
2. Work B0.45 **--
3. Total WBS0.58 **0.66 **-
Alpha coefficient0.870.770.88
** p < 0.01 Note. Person B = Person-related bullying, Work B = Work-related bullying, Total WBS = total workplace bullying scale.
Table 3. Correlation of WBS and its Subscales with perceived Job Stress Scale (N = 60).
Sr. No.SubscalesJob Stress
1Work-B0.76 **
2Person-B0.62 **
3WBS total0.75 **
** p < 0.01. Note. Work-B, work-related bullying, Person-B = person related bullying, WBS total = work-related bullying scale total

