Abstract
Global economic trends have shown the progression of social inequalities and environmental deterioration in the grey economy. New economic practices and policies need to be developed in order to achieve the sustainable development goals (SDGs). A green economy (GE) has a correlative role with the implementation of sustainable development (SD), which could revive the grey economy, human well-being, and social equity, as well as substantially decrease environmental risks and ecological scarcities. This study aims to develop a hybrid methodological and mathematical approach to prioritize the most effective variables from classified GE and SDGs criteria (23 criteria) to implement SD. This study has deliberated over the Decision making trial and evaluation laboratory (DEMATEL) technique for considering interconnections among numerous criteria to collect the most effective variables (12 criteria) based on three pillars (3Ps) of SD. Likewise, the analytic network process (ANP) technique ranked these effective variables by considering their network relations based on three indicators. Lastly, integration was used to finalize and prioritize the most effective variables based on their weight from the ANP technique. This study will highlight the green economy with exclusive environmental issues and sustainable growth as the greatest effective variables among GE and SDGs criteria for SD implementation.
1. Introduction
Various indications have demonstrated that the current rate of global economic growth is not sustainable [1]. Although this economic growth has brought around one billion people out of extreme poverty during the last two decades, approximately another billion are still experiencing hardship. Around 1.1 billion of the population are deprived of electricity and 2.5 billion are without access to sanitation [2]. Failure to meet these basic human needs can also be a threat to the environment. For instance, the improper disposal and treatment of wastewater and domestic faecal sludge could also affect water resources and ecosystems. In addition, the economic growth is affecting the environment because it is the main source of economy. This situation has led to environmental degradation and climate change, which are affecting everyone in the world [3]. Thus, it is vital to overcome these obstacles, a necessity that has led to the birth of the sustainable movement and inclusive economic growth.
Sustainable development (SD) provides the operational policy agenda and context for the economy, which can constructively accomplish concrete, measurable advancement at the interface between the economy and the environment [4,5]. The 2030 Agenda for SD is a plan of action for the people and the planet, which focuses on environmental issues and resource depletion through human activities [6]. All three pillars (3Ps) of SD (economic, environmental, and social pillars) are relevant entry points for identifying issues and developing green policies for the economy [7]. Incidentally, the green economy (GE) has been anticipated as the catalyzer to renew national policy growth and international support, which fundamentally supports SD as the strategic economy policy agenda. It is defined by United Nations Environment Programme (UNEP) as the economy that could enhance human well-being and social equity, while expressively mitigating environmental issues and ecological shortages [8,9].
The history of GE practice in policy began with the Rio Conference in 1992. Next, the GE was given a definition by the UNEP in 2011, in a paper entitled “Towards a Green Economy: Pathways to Sustainable Development and Poverty Eradication”. Its history in the academic world began in 1989 in a paper by Pearce et al. entitled “Blueprint for a Green Economy” [10]. GE’s practical operation is indubitably interrelated to the multiplicity of factors depending on the context, but there is no assorted and recognized categorization for GE conception [11]. This shortcoming includes insufficient global principles related to GE policies for economic growth and poverty eradication [12]. Additionally, the world is still concerned about global issues related to the environment, social inequality, and the economy that the SD initiative has failed to rectify [13,14]. Meanwhile, the GE has the ability to promote successful sustainable development goals (SDGs) and improve the conversion to low-carbon, resource-efficient, and comprehensive economies. This study was conducted with the aim of developing an operational and efficient approach for prioritizing the most significant criteria for GE and SDGs to ensure SD is achieved. The research objectives are as follows:
- ❖
- To identify and classify the criteria and indicators for GE and SDGs, and expand their correlations for aligning GE criteria with SDGs based on the 3Ps of SD;
- ❖
- To categorize and investigate the efficacy and interconnections of classified criteria through pairwise comparison in each 3Ps;
- ❖
- To evaluate and quantify the relationships between the most effective criteria for SD implementation based on indicators;
- ❖
- To analyze and prioritize the most effective criteria for GE and SDGs to support SD.
To achieve these objectives, the hybrid multi-criteria decision making (MCDM) technique was applied in this study to align GE and SDGs criteria for SD prevalence. This study has highlighted a new trend in research technique, with clear instructions on how to assemble these hybrid methods via the MATLAB software.
2. Literature Review
2.1. Sustainable Development Goals (SDGs)
Sustainable development consists of several goals that coalesce into 3Ps, namely environmental, economic, and social pillars. This unique development towards sustainability was introduced by Barbier (1987), which underlines the prospect of trade-offs among the countless economic, environmental, and social goals, with positive or negative preference [15]. The confluence and maximization of the 3Ps goals would lead to sustainable development and ease the implementation of sustainability [16].
The SDGs for 2015 to 2030 was adopted through “Transforming our world: the 2030 Agenda for Sustainable Development”, with 193 United Nations (UN) member countries in September 2015 [17,18]. It represents the world’s inclusive strategy for social inclusion, environmental sustainability, and economic development. To achieve all of the proposed SDGs, the assistance and teamwork among governmental and non-governmental organizations are needed around the world [19]. The participation of all countries in this new global consensus on sustainable development could tackle inequality and integrate environmental protection and poverty improvement in all policies and programmes.
In the United Nations, the voluntary national reviews (VNRs) track strategies are implemented by governmental institutions to gain multi-stakeholder support and partnerships for the implementation of SGDs [20]. They provide an online review platform that inscribe the division of involvements among the 172 countries in SDGs, including achievements, challenges, and knowledgeable instructions, with the intention of fast-tracking the execution of the 2030 Agenda. In addition, previous studies on SDGs have shown the inclusive domain paybacks of SDGs, which includes diverse categories based on 800 reviewed articles) in Web of Science, with Sustainable Development Goals in their titles, from 1989 until December 2018 (Figure 1).
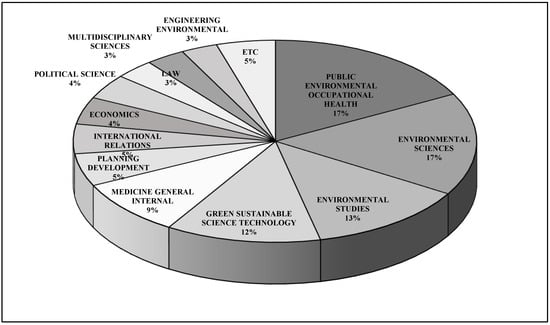
Figure 1.
The diverse categories in Web of Science, with SDGs in the title from 1989 until December 2018.
Figure 1 shows that the main researches with SDGs in the title were the environmental and sustainable science at approximately 60% from a total of eight altered fields. Nonetheless, the economy, as one of the main pillars of SD, has four per cent coverage in previous SDGs research articles and publications. There is one article on SDGs and GE in relation to natural resources, which was published in December 2018 that implied to the uniqueness of this research gap [21]. This article revealed the connections between SDGs and natural resources though systematic analysis, while focusing on GE. Meanwhile, this current study will demonstrate the direct and indirect influences of GE indicators on the implementation of SDGs. This study is needed to exhibit the main goals of SD, which are included in the 2030 Agenda.
The main function of the SDGs is to maintain stability among the economic, social, and environmental aspects, which would promote universal changes towards a sustainable future [22,23]. There is an evolving global exercise and an upward directory of interrelated scientific publications to implement the SDGs framework [24,25,26]. The SDGs framework includes 17 goals, 169 targets, and 232 indicators that undoubtedly have unclear interconnections, contributory interactions, and reaction loops [27]. The alignment between indistinct functionalities from the SDGs framework and the previous weaknesses have confuted sustainability interventions by policy makers when implementing the SDGs, simultaneously integrated in a consistent manner, as shown by evidence and scientific-based approaches [28,29,30].
The literature on SDG implementation has evidently disclosed general policy development, the implementation and practice of SDGs, and the measurement of ex-ante impact of their mandatory conditions [31,32]. These aspects need to be supplemented with methodical outlines, tools, and investigations that empower the interactions among SD goals through quantitative or coherent models. Science-based approaches have outlined the dynamic criticisms, interconnections, and incorporations of the 3Ps of sustainable development [33,34], such as the national study applying system dynamics modelling between energy, health, and education targets [24]. Other publications suggested using quantitative methods, such as the ‘nexus’ approach [19,24,33,35] or multi-criteria analysis [36,37,38,39] to support decision making for SDGs implementation. This current study has considered the multi-criteria decision-making method to align the GE criteria to SD goals through SD indicators.
Based on the Agenda 2030, there are 17 goals in the SDGs that all countries must act upon to promote prosperity, while protecting the earth (Table 1). It is important to achieve each goal by 2030 to end poverty with policies that shape economic growth and address an assortment of social requirements, as well as education, well-being, social safety, and career opportunities, while undertaking environmental protection [40]. Based on the definitions of SDGs listed in Table 1, the relative function of each goal is clear. It was difficult to classify all 17 goals consistent with the three dimensions of sustainability.

Table 1.
The 17 sustainable development goals (SDGs) [41].
However, the designation and classification of SDGs pursuant to the 3Ps have allowed researchers to investigate the UN SDGs using the arrangements method to sustainability. Previous researches and SDGs definitions [42] have categorized these goals based on the 3Ps of SD, which include:
- ❖
- Economic: SDGEc1 (No poverty), SDGEc2 (Zero hunger), SDGEc3 (Good health & well-being), SDGEc4 (Clean water & sanitation), SDGEc5 (Affordable & clean energy), SDGEc6 (Good jobs & economic growth), and SDGEc7 (Industry, Innovation, & Infrastructure)
- ❖
- Social: SDGSo1 (Quality Education), SDGSo2 (Gender Equality), SDGSo3 (Reduce Inequalities), SDGSo4 (Peace, Justice, & strong institutions), and SDGSo5 (Partnership for the goals)
- ❖
- Environment: SDGEn1 (Sustainable cities & communities), SDGEn2 (Responsible consumption & production), SDGEn3 (Climate Action), SDGEn4 (Life below water), and SDGEn5 (Life on land)
For example, SDG1 is marked as no poverty, which is defined as an economic growth that must be inclusive to provide sustainable jobs and promote equality. It has a direct bearing on the social aspect, while reflecting on the economic category of SD. Therefore, it is vital to consider the interconnections and influences among all SD goals in this study. The next part of this review is regarding the definition, function, and designation of the green economy.
2.2. Green Economy (GE)
The trends of the global economic models during the previous decades have shown growth in social inequalities, environmental deterioration, and aggravating societal tensions, which will pressure each country’s prospective for upcoming development and growth [5]. Economic practices and policies need to be reframed and aligned with sustainability in order to achieve the sustainable development targets [43]. Policy makers around the world should transform their economies to exterminate poverty, grow careers and societal equity, strengthen incomes and environmental stewardship, and stand growing in line with the sustainable development goals.
GE and economic growth have correlative roles in implementing the SD goals. Economic growth is one of the important parameters of a booming economy. However, the paybacks of conventional economic growth are not consistently distributed, which can often lead to wealth inequality and social divisions [44]. This conventional strategy has undervalued ecological goods and services that outline the foundation of all economic movement. The GE is a prerequisite for economic growth based on the SD, which can result in a grey economy, human well-being and social equity, and substantially decreasing environmental risks and ecological scarcities [9]. It can be purely well-defined as being low-carbon, resource efficient, and socially inclusive [45].
The GE, as a widespread concept, is observed as a corridor to sustainability by international organizations [45,46]. The acceptance trend of top organizations regarding GE’s policy started with the GE report by UNEP (2011) to green growth with the Organisation for Economic Co-operation and Development (OECD) (2011), and the comprehensive Green Growth with the World Bank (2012) [9,47,48]. GE policies are generating synergies across economic sectors and improving the overall well-being of the population. It operates like the umbrella concept to embrace diverse consequences, such as social equity and well-being, retrofitted economic growth, and mitigating environmental issues [3]. It is an essential division to achieve SD goals and the climate mitigation targets according to Paris meeting [9,49]. Nonetheless, the influences between GE and SDGs still need to be determined. Figure 2 shows a review of 600 academic publications, such as articles, reviews, books, and letters related to GE in the titles in a search of the Web of Science from 1993 until December 2018 (Figure 2).
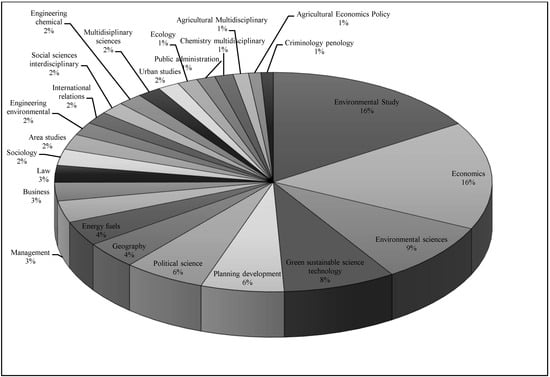
Figure 2.
Publications record with GE in the title in the Web of Science from 1993 until December 2018.
Figure 2 shows that the main categories of academic studies are related to the environment at 30%, while 8% belongs to the green and sustainable science. These results imply at the critical influence of the GE concept in the environment category as one of the SD pillars. The second important category is the economic studies at 16%. In addition, GE studies, in terms of social studies, is only at 4%, which shows the absence of more research in this category. Table 2 shows the majority of recent articles with the title green economy in Web of Science that were published in the green sustainable and environment category.
Table 2.
Recent articles, with green economy in their title, found in the Web of Science.
The listed publications in Table 2 show the verities of recent researches in environmental areas, such as renewable energy, green supply chain management, and low carbon economy. These publications are needed to develop an outline that covers commonly appropriate green economy frameworks based on indicators as GE’s metric or metric value. There are particular cases that considered the specific effective factors for GE. In 2013, The UNEP classified GE’s effective factors into three different categories, namely environmental, policy, and well-being and equity [64,65].
Kasztelan A. (2017) deliberated that GE’s effective factors include two different parts, namely, natural and built capital [66]. Canari (2017) considered five critical actions for GE implementation, which include valuing nature, eradicating inequality, greening economic sectors, reforming financial systems, and measuring and governing [67]. One of the greatest classifications was made by Loiseau et al. in 2016. They reviewed 877 documents with green economy in the title [68]. Their team found 157 keywords and finalized them based on the three pillars of sustainability. Based on the reviewed literature, the transition framework required for GE indicators to succeed must be focused on poverty eradication, ecological preservation, and economic prosperity (Figure 3). Figure 3 shows the Venn diagram of GE, with three specific indicators and three pillars (3Ps) as GE’s benefits. Table 3 lists the three pillars (3Ps) as GE’s benefits that have particular definitions and specifications.
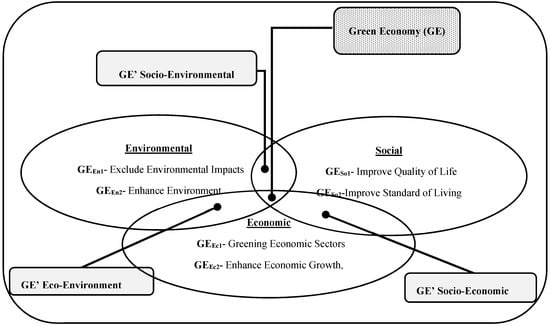
Figure 3.
The final transition framework for the Green Economy.
Table 3.
The three pillars (3Ps) of GE, with definition and abbreviation.
The transition to green economy will transpire when the three distinctive pillars of GE are launched simultaneously. According to Figure 3, GE is executed by integrating the involvement of each pillar. Consequently, these interactions will create three shared boundaries, namely, eco-economic, socio-environment, and socio-economic. The reflection of GE, in the context of SD, would accurately deliver prospects for policymaking to achieve SD goals. GE conscript is as the catalyzer to reform the grey economy and activate SD goals in national and international policies. Based on Figure 3, the three precise GE indicators are as outlined below:
- Eco-Environment: the greater emphasis on the interaction between GE and the natural environment, with considerations for local and global environmental issues;
- Socio-Environment: the mutual function between environmental and social aspects, which are prepared through the GE activity; and
- Socio-Economic: the fairness of the GE movement and guidelines that provide at least the basic and equal minimum of income, goods, and services in society.
Based on the current research objective, the most significant criteria must be identified following the classification of GE and SDGs criteria to match the three pillars of SD. The DEMATEL is great mathematical technique to analyze the efficacy and interrelations among these classified criteria for accumulating the most significant criteria in three separated pillars. However, it is only capable of examining the cause-effect interactions among criteria, not prioritizing them. Hence, this technique was mixed with other approaches to prioritize these significant criteria and enroll three GE indicators for prevailing SD. These research techniques are summarized in Section 3, under four sub-sections
3. Research Method
This research method included five phases that were focused on evolving the methodological and systematic approach to categorize the criteria for green infrastructure for the implementation of green economy. These steps include:
- To classify and cluster criteria related to GE and SDGs based on the 3Ps through literature review;
- To evaluate the interrelations among these categorized criteria and determine the most significant factors using the DEMATEL technique, which was progressed through MATLAB software;
- To arrange and accurately rank the most significant criteria with their network relations based on three separated indicators through the ANP method (SuperDecisions software);
- To improve the integration technique for enrolling three indicators with the most significant-ranked criteria for prevailing SD.
Based on the literature review, 17 SDGs criteria and six GE criteria were classified, with specific abbreviations in three pillars (Figure 4), namely, social, economic, and environment. The next step extended this research methodology through the preparation of the research questionnaire.
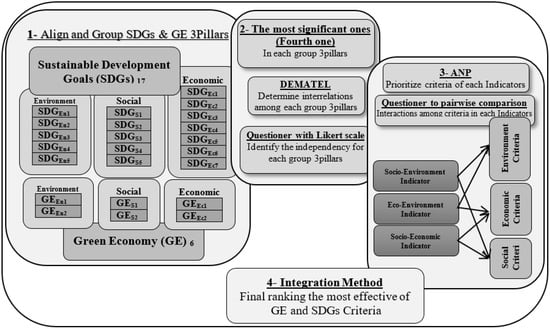
Figure 4.
Research Framework.
3.1. Questioners and Sample Size
This phase of research methodology concentrated to scheme two separated questionnaires:
- Four-point Likert scale questions to categorize interrelations among group SDGs and GE criteria in separated three pillars through DEMATEL method that outcome the most significant criteria in 3Ps;
- Pair-wise comparison with scale of 1–9 to rank the most significant criteria based on their network relations in GE’s three indicators through the ANP method
The random sample method considered for an equal geographic spreading amongst samples. The Equation (1) conducted to determine the sample size as signified the population of the questionnaire [69].
In Equation (1), SS is the considered sample size, a is the value of confidence level (e.g., 1.96 for 95% confidence level), P is proportion of the selection will be picked, stated as unit (0.5 for sample size), and c is the confidence interval. After calculation, SS is modified for fixing the population with Equation (2):
where Pop is inhabitants. The Corrected SS modified with Equation (3) through response rate (rr):
According to random sample method, around 100 questionnaires distributed to postgraduate students and researchers who have familiar with term of green economy and sustainable development goals.
3.2. DEMATEL Technique
Initially, the Science and Human Affairs Program of the Battelle Memorial Institute of Geneva established DEMATEL to decide the complex and intertwined problem group [70]. DEMATEL created based on graph philosophy to resolve problems visually which is comprehend causal relations to design the network interrelationship among classified variables [71]. DEMATEL technique explain shortly in next six steps:
3.2.1. Step 1
Initial average matrix: The pairwise judgements between any two variables are signified by xij and are given a number ranging from no impact (0); low impact (1); medium impact (2); high impact (3); and very high impact (4) respectively. The initial average matrix X is obtained based on the non-negative answer matrix A as follows:
where n is the amount of criteria, Ci is a criterion, and xij is an average of the pairwise comparisons that is calculated in below:
where, the scores by each professional will give us a n × n non-negative response matrix A = [aijk]n×n. K is the amount of professionals (k = 1, 2, …, p), and aijk is a kth experts’ scores.
3.2.2. Step 2
Normalized matrix: with the initial average matrix (X) that shows the dependences of each criteria, the normalized matrix (Xnorm) was consequent:
where α is
3.2.3. Step 3
The total-relation matrix (T) is obtained through normalized matrix as the follow equation:
3.2.4. Step 4
Threshold value: This stage isolates the slight effects offered in T matrix and constructs a suitable cause-effect diagram. Judgement makers should fix a threshold value (h) for impact levels. In T, some features, that are upper than h, can convert into the cause-effect diagram. It’s calculated through:
3.2.5. Step 5
Cause–effect diagram: The sum of the rows and the columns represented as R vector and C vector in the next equations:
This diagram, as a network relationship map (NRM), can be achieved by drawing the dataset of (R + C, R − C). The horizontal axis (R +), relation, interprets the component importance, while the vertical axis (R −), Influence, separates components into cause and effect. When (ri +) is positive, then the component i is disturbing further components and i fits to the cause group. If (ri −) is negative, then the component i is being influenced by others components and i fits to the effect group.
3.2.6. Step 6
According to the value of h, it can filter the minor impacts in the components of matrix T. The new total-influence matrix Th can acquire:
where the values of components in T are zero if their values less than h. That is, there are lower impacts with other criteria when their values are less than h.
3.3. ANP Technique
The ANP technique is the general model of relative dimension used to develop relation compound ratio scales from individual ratio scales representing the relation amounts of impact components interacting with a regulator criterion. It developed by Saaty in 1996 as a generalization of AHP [72] that captures dependence outcomes among the components clusters. This technique can briefed to:
3.3.1. Step 1
Create the network structure: the net has clusters of components, with the components in one cluster connected to components in another cluster (outer-dependence) or the same cluster (inner-dependence) (See in Appendix A Figure A1).
3.3.2. Step 2
Pairwise comparison matrices are created through questionnaires that show the importance and influence between criteria with considering the preferences of respondents. It is very important to test the inconsistency for the validity and reliability of respondent’s questionnaires. The threshold as considered 0.1 to judge whether the comparison is consistent [73]. Therefore the study considered this for the comparison value as the consistency ratio.
3.3.3. Step 3
The super-matrix of a network characterizes the impact significance of a component on the left of the matrix on a component at the top of the matrix with respect to a specific control criterion. The priorities subsequent from pairwise comparison matrices are arrived as fragments of the columns of a super-matrix. The element C1 in the super-matrix includes all the significance vectors consequent for nodes that are “parent” nodes in the C1 cluster.
3.3.4. Step 4
The limit super matrix of a network raises the super-matrix to limiting powers l (Equation (12)) until the super-matrix touched to get the global priority vectors or weights.
If the limiting super-matrix is not the only one, it would be considered to get the final weighted limiting super-matrix Wf (the average priority weights) as
where Wj denotes the jth limiting super-matrix.
The priorities of the alternatives achieved by normalizing the corresponding values in the suitable columns of the limit matrix.
3.4. Integration Method for GE Implementation
The final purpose of this research methodology is to rank the best of the most effective classified criteria. It acquired from combination of three separated indicator vectors from the results of ANP technique in Section 3.3. This research deliberated the integration method with consideration of the weighted average technique, which finalizes the new priorities of the most effective classified criteria based on the integration of the three indicators. Each indicator vector is sorted in descending order base on the weight of criteria. Three indicator vectors are shown as follow:
The process of obtaining the finalized priorities with integration of three vectors using weighted average is descripted as follow:
where yi is the final value of ith criteria after integration method, xik is a value of ith criteria in the kth indicator vector before sorting, and the coefficient of xik in the above equation namely which in is the place of ith criteria in the kth sorted indicator vector.
4. Results
4.1. DEMATEL Results
According to the research methodology shown in Figure 4, the total relation matrix (T) from this part of the methodology was needed to collect the most effective criteria in the 3Ps. The MATLAB software was used to implement the DEMATEL method (as shown in Appendix A Figure A2). The average of the four-point Likert scale questions (questionnaire, part A) finalized the initial information (Table 4) in DEMATEL method to identify the interrelations among GI criteria.
Table 4.
Initial DEMATEL info: Environment (4-a); Social (4-b); and Economic (4-c).
Then, by using Equations (6) and (7), the normalized initial direct-relation matrix was calculated. Other parts of the DEMATEL had focused on calculating the total relation matrix (T), especially on the threshold value for impact level. The threshold value was at 0.6, which was calculated and inferred in each three pillars through Equation (8) and expert judgments. Through the sum of rows (D) and columns (R) of each criteria as the dataset, which was obtained from Step 6, the importance (D + R) and prominence (D − R), and finally, the rank of the criteria in the 3Ps were estimated. Table 5 shows the datasets for the network relation of criteria from DEMATEL technique in separate 3Ps.
Table 5.
Final dataset and ranking of criteria from DEMATEL in separate pillars.
Table 5 shows the final results of the ranking of criteria in each separate pillar. The ranking was according to the higher amount of importance (R + C) in each pillar. Table 6 shows the fourth most effective criteria in each separate pillar as the final output variables from the DEMATEL technique, which were used as the input for the ANP technique in the next part.
Table 6.
Final output variables from DEMATEL—the fourth most effective criteria.
4.2. ANP Results
Pairwise comparison was performed among the most effective criteria by considering their network relations in each indicator (Appendix A Figure A1). It derived the initial info from the average respondent answers in part B of the questionnaire. The reliability and validity of the respondents’ answers were checked using the consistency ratio before calculating criteria priorities in each indicator. Figure 5 shows the averaging pairwise comparison matrices among the most effective criteria for the Eco-Environment indicator, with an acceptable inconsistency rate (0.08828, which is less than 0.1).
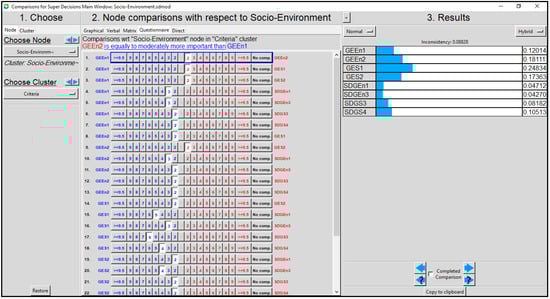
Figure 5.
Pairwise comparison among the most effective criteria (Eco-Environment indicator).
The super decision software adapted the initial matrix to limit the matrix using Equations (12) and (13) by normalizing the corresponding values. Table 7 shows the rank and weight of the most effective criteria in each indicator.
Table 7.
Final rank of the most effective criteria in each GE indicator.
These final rankings were considered as the input data for the final step (4) of the research method, which was to finalise and rank the most effective GE and SDGs Criteria.
4.3. Integration Results
The integration method was the last part of this research method, leading to the finalised effective criteria. This mathematical method used the input data from Table 7 and converted them into the final data shown in Table 8 using Equations (14) and (15).
Table 8.
Final rank of the most effective GE and SDGs criteria with normalised weight.
The final weight of criteria ranking was calculated from the integration of criteria weight in three separate indicators and normalised. These ranking criteria are needed to elucidate their definition and role in the implementation of sustainable development and the green economy.
5. Discussion
Institutionally, the GE was offered as a “vehicle” to distribute SD [64]. It was even supposed in some researches that the greater priority is needed for tackling poverty and inequality in GE procedures to influence SDGs. Clearly, the ignorance of social issues in green policymaking can result in significant costs for people living in poverty [74]. Based on the International Institute for Environment and Development (IIED) “for green growth to really fulfil its promise, it also needs to focus on people—to tackle the poverty, inequality, and exclusion that constrain both growth and environmental sustainability, to realize women and men’s aspirations, and to gain broad societal support” [75]. This study aimed to align the criteria of the green economy and SD goals to promote sustainable development. There were three different techniques that were hybridised in this research methodology for SD implementation by aligning GE and SDGs criteria (23 criteria). These techniques were implemented to finalise and prioritise the most effective variables for achieving the research objective. DEMATEL was used to deliberate over four effective variables in each 3Ps of the classified GE and SDGs criteria by considering their interconnections. These results were applied as the input data for the ANP technique, which prioritised these variables into three different indicators by considering their network relations. These three indicators were consequently finalised through integration using a mathematical technique. These techniques produced different results, which needed more discussion according to their function. Aligning GE and SDGs criteria proceeded with the following three techniques:
- Obtain the most effective variable based on the 3Ps of SD:The results from first technique (DEMATEL) created the most effective criteria (12 criteria) from classified GE and SDGs criteria through pairwise comparison and considering their interrelations. These outputs (Table 4) demonstrated the rank of effective variables for GE and SDGs in each pillar of SD.In the environmental pillar of SD, the best rank belonged to GEEn1 as the economy exclusive of environmental issues, such as global warming; and GEEn2 as the economy with improving environmental quality, such as resource efficiency. In this pillar, the effective variables were followed by SDGEn3, focusing on climate actions that could affect everyone and everyplace, and SDGEn1 as sustainable cities and communities.In the social pillar, GES1 was placed as an effective variable among other classified criteria that are defined as improving quality of life. This was followed by SDGS4 as peace, justice, and strong institutions, while SDGS3 as reduced inequalities. These two items are focused on political actions and administrating social equality. GES2 was the final most important variable of the social pillar for SD implementation, which was defined as improving the standards of living, such as education, job security, income, and inflation rate.In the economic pillar, the most effective variables belonged to SDGs, which include SDGEc6 as productive decent work and sustainable economic growth; SDGEc1 as eliminating poverty, the supreme challenges facing humanity; SDGEc2 as endorsing sustainable agriculture and food security to end hunger; and SDGEc3 as promoting well-being and healthy lifestyle.
- Rank of the most effective variables based on three indicators:The most effective variables and criteria were the output of DEMATEL, which were used as input in the second technique, ANP. They were classified based on the 3Ps of SD, and their network relations were analysed through ANP technique in the next step. Three different indicators were determined for variables network relations, and pairwise comparison among them were considered for data collection and software modelling. The output data from the ANP technique, as shown in Table 7, were prioritised variables based on their network relations in three different indicators. Each indicator has eight weighted variables that determined their priorities for SD implementation, which need more discussion. Nonetheless, the initial discussion was focused on analysing the majority weighted variables (first half), where their weight formed more than 70% of each indicator (Table 7).The Eco-Environment indicator is emphasised for lining up the green economy with environmental issues. The major weight of the most effective variables in this indicator was at 82%, which consisted of sustainable growth (SDGEc6), excludes environmental issues (GEEn1), improvements of environmental quality (GEEn2), and the promotion of well-being (SDGEn3).The Socio-Environment indicator implied that a collaboration between society and environment should be organised to achieve green economy. The majority of the weighted variables originated from the green economy at 72% based on the following priorities: increase quality of life (GES1), develop environmental quality (GEEn2), recover standard of living (GES2), and eliminate environmental concerns (GEEn1).The Socio-Economic, as the final indicator, determined the green economy as an effort to promote equality and social welfare. The major weight of the most effective variables in this indicator was at 76% that promote sustainable economy (SDGEc6), peace and justice (SDGS4), equalities (SDGS3), and standard of living (GES2).
- Achieve final rank of the most effective variables for SD implementation:The final technique was integration, which prioritised the most effective criteria in three indicators (output from ANP) to achieve the final rank for SD implementation. The final data in Table 8 is epitomized (in Appendix A Figure A3), which shows the proportions of the most effective GE and SDGs criteria for SD implementation. The first four variables present the major weight of the most effective criteria, which was 86%.The most effective variable among the ranked GE and SDGs criteria was GEEn1 at 50% value towards SD implementation. It was defined as excludes environmental issues from economy, which is an important factor for aligning green economy and SD goals. Environmental issues are destructive features of human movements and actions that lead to different effects, such as climate change and pollution on the biophysical environment. The second effective variable (with 23% effectiveness) for aligning GE and SDGs was sustainable economic growth (SDGEc6) that was focused on reaching higher stages of efficiency through technical innovation. Mandated actions, such as endorsing improved government policies, are required to nurture sustainable business practices, and to produce prospects for noble and decent works.GES1 was estimated to be 9% effectiveness as the third variable from the most effective GE and SDGs criteria for SD implementation. Quality of life refers to the general well-being in the society that could shape adverse and progressive features of life, such as health, safety, education, wealth, and profession. The fourth most effective variable was GEEn2 at 5% efficacy for SD implementation. It was defined as improving environmental quality, which was focused on several actions, such as improving resource efficiency and condensing fossil fuel consumption to mitigate environmental degradation. The rest of the analysed variables made up to 14% of effectiveness that their roles were undeniable for aligning GE and SDGs to SD implementation.
6. Conclusions
As the main resource of economy, unsustainable economic growth has become one of the causes of the costly degradation of the environment. The green regulation of economic policy has explicitly reduced environmental issues and degradation, while enhancing social welfare, justice, and economic prosperity. Furthermore, sustainable development could afford a comprehensive strategy of performance, and measurable improvement for social inclusion, environmental sustainability, and economic development.
The current research determined the most effective variables among green economy and SDG criteria to endorse sustainable development. There is variation among these most effective variables based on each indicator. In the Eco-Environment indicator, the major weight of the variables was at 82%, which was characterised through the GE with sustainable economic growth. The weight of the variables for Socio-Environment indicator was at 72%, which was designated for intensifying the quality of life, environmental quality, and standard of living, while eradicating environmental concerns. As a final point, the weight of the most effective variables in the Socio-Economic indicator was 76%, which was categorised as green economy efforts to endorse SD; peace and justice, equalities, and standard of living.
The most effective variables that reached the research objective were the first four variables with 86% of total effectiveness that prioritized: GEEn1 (50% of effectiveness) as the economy that excludes environmental issues; SDGEc6, defined as sustainable economic growth (23% of weight); GES1, as the overall welfare in society (9% of effectiveness), and GEEn2, as improving environmental quality (5% of efficacy).
This study concluded that the most effective variable among GE and SDGs criteria for SD implementation is the GE with exclusive environmental issues and sustainable growth, and the next highlighted variable is focused on the overall social well-being. This can be considered as a guideline if precisely addressed in future studies on greening the economy. The authors suggest the premises of the systematic outline, which could be advantageous for improving understanding of the SDGs implementation, and it’s application for future research on complex and confusing concepts.
Author Contributions
All authors have contributed equally to this manuscript.
Funding
This research was funded by the grant of the Malaysia’ ministry of higher education. Grant no. 04E28, the Staff of Construction Research Center (CRC), the Faculty of civil engineering, and RMC UTM.
Conflicts of Interest
The authors declare no conflict of interest.
Appendix A

Figure A1.
Network structure among the most effective GE and SDGs criteria based on Eco-Environment indicator.
Figure A1.
Network structure among the most effective GE and SDGs criteria based on Eco-Environment indicator.


Figure A2.
DEMATEL framework implementation in MATLAB software.
Figure A2.
DEMATEL framework implementation in MATLAB software.


Figure A3.
Proportion of the most effective GE and SDGs criteria for SD implementation.
Figure A3.
Proportion of the most effective GE and SDGs criteria for SD implementation.

References
- Roser, M. Global Economic Inequality. Published online at OurWorldInData.org. 2018. Available online: https://ourworldindata.org/global-economic-inequality (accessed on 1 July 2019).
- Schroeder, P.; Anggraeni, K.; Weber, U. The Relevance of Circular Economy Practices to the Sustainable Development Goals. J. Ind. Ecol. 2018, 23, 77–95. [Google Scholar] [CrossRef]
- Rockström, J.; Steffen, W.; Noone, K.; Persson, A.; Chapin, F.S.I.I.I.; Lambin, E.F.; Lenton, T.M.; Scheffer, M.; Folke, C.; Schellnhuber, H.J.; et al. A Safe Operating Space for Humanity. Nature 2009, 461, 472–475. [Google Scholar]
- International Trade Union Confederation. Workers and Trade Unions’ Consolidated Contribution to the United Nations Conference on Sustainable Development; International Trade Union Confederation: Brussels, Belgium, 2012. [Google Scholar]
- Megwai, G.; Njie, N.I.; Richards, T. Exploring green economy strategies and policies in developing countries. Int. J. Green Econ. 2016, 10, 338. [Google Scholar] [CrossRef]
- UNEP; Bloomberg. Global Trends in Renewable Energy Investment 2017; UNEP, Bloomberg New Energy Finance, Frankfurt School-UNEP Collaborating Centre, 2017. Available online: https://www.greengrowthknowledge.org/resource/global-trends-renewable-energy-investment-2017 (accessed on 15 August 2019).
- International Resource Panel (IRP). Resource Efficiency for Sustainable Development: Key Messages for the Group of 20; United Nations Environment Programme: Nairobi, Kenya, 2018. [Google Scholar]
- EEA. Climate Change, Impacts and Vulnerability in Europe 2012—An Indicator-Based Report; EEA Report, 12/2012a; European Environment Agency: Copenhagen, Denmark, 2012. [Google Scholar]
- UNEP. Towards a Green Economy: Pathway to Sustainable Development and Poverty Reduction; A Synthesis for Policy Makers; UNEP: Nairobi, Kenya, 2011. [Google Scholar]
- Pearce, D.; Markandya, A.; Barbier, E. Blueprint for a Green Economy; Earthscan: London, UK, 1989. [Google Scholar]
- OECD Indicators. Environment at a Glance 2015; OECD Publishing: Paris, France, 2015. [Google Scholar] [CrossRef]
- Allen, C.; Clouth, S. A Guidebook to the Green Economy; Issue 1: Green Economy, Green Growth, and Low-Carbon Development—History, Definitions and a Guide to Recent Publications. UN Division for Sustainable Development, 2012. Available online: https://sustainabledevelopment.un.org/content/documents/GE%20Guidebook.pdf (accessed on 15 August 2019).
- United Nations. Prototype Global Sustainable Development Report; United Nations Department of Economic and Social Affairs, Division for Sustainable Development: New York, NY, USA, 2014. [Google Scholar]
- Lee, J.W.; Jung, H.S.; Lee, T.J. Korea’s Green Growth: Based on OECD Green Growth Indicators; Statistical Research Institute: Daejeon, Korea, 2012. [Google Scholar]
- Komen, K. Framework for a Green Economy Transition: Towards a Low-Carbon, Climate-Resilient and Resource Efficient City. Technical Report. 2013. Available online: https://www.researchgate.net/publication/315687574_Framework_for_a_Green_Economy_Transition_Towards_a_Low-Carbon_Climate-Resilient_and_Resource_Efficient_City (accessed on 15 August 2019).
- Adams, W.M. The Future of Sustainability: Re-thinking Environment and Development in the Twenty-first Century. In Proceedings of the Report of the World Conservation Union (IUCN) Renowned Thinkers Meeting, Gland, Switzerland, 29–31 January 2006. [Google Scholar]
- McArthur, J.W.; Rasmussen, K. Change of Pace: Accelerations and Advances during the Millennium Development Goal Era; Brookings Institution Global Economy and Development Working 2017a; Brookings Institution: Washington, DC, USA, 2017; p. 97. [Google Scholar]
- United Nations General Assembly. Transforming Our World: The 2030 Agenda for Sustainable Development; Outcome Document of the United Nations Summit for the Adoption of the Post-2015 Agenda, RES/A/70/L.1; United Nations: New York, NY, USA, 2015. [Google Scholar]
- Allen, C.; Metternicht, G.; Wiedmann, T. An Iterative framework for national scenario modelling for the sustainable development goals (SDGs). Sustain. Dev. 2017, 25, 372–385. [Google Scholar] [CrossRef]
- Galli, A.; Đurović, G.; Hanscom, L.; Knezevic, J. Think globally, act locally: Implementing the sustainable development goals in Montenegro. Environ. Sci. Policy 2018, 84, 159–169. [Google Scholar] [CrossRef]
- Merino-Saum, A.; Baldi, M.G.; Gunderson, I.; Oberle, B. Articulating natural resources and sustainable development goals through green economy indicators: A systematic analysis. Resour. Conserv. Recycl. 2018, 139, 90–103. [Google Scholar] [CrossRef]
- Costanza, R.; McGlade, J.; Lovins, H.; Kubiszewski, I. An overarching goal for the UN sustainable development goals. Solutions 2014, 5, 13–16. [Google Scholar]
- Costanza, R.; Daly, L.; Fioramonti, L.; Giovannini, E.; Kubiszewski, I.; Mortensen, L.F.; Pickett, K.E.; Ragnarsdottir, K.V.; De Vogli, R.; Wilkinson, R. Modelling and measuring sustainable wellbeing in connection with the UN Sustainable Development Goals. Ecol. Econ. 2016, 130, 350–355. [Google Scholar] [CrossRef]
- Collste, D.; Pedercini, M.; Cornell, S.E. Policy coherence to achieve the SDGs: Using integrated simulation models to assess effective policies. Sustain. Sci. 2017, 12, 921–931. [Google Scholar] [CrossRef]
- Guppy, L. Accelerating Water-Related SDG Success; 6 Steps and 6 Components for SDG 6; UNU-INWEH Policy Brief, Issue 4; United Nations University Institute for Water Environment and Health: Hamilton, ON, Canada, 2017. [Google Scholar]
- Allen, C.; Nejdawi, R.; El-Baba, J.; Hamati, K.; Metternicht, G.; Wiedmann, T. Indicator-based assessments of progress towards the sustainable development goals (SDGs): A case study from the Arab region. Sustain. Sci. 2017, 12, 975–989. [Google Scholar] [CrossRef]
- Allen, C.; Metternicht, G.; Wiedmann, T. Initial progress in implementing the Sustainable Development Goals (SDGs): A review of evidence from countries. Sustain. Sci. 2018, 13, 1453–1467. [Google Scholar] [CrossRef]
- Nilsson, M.; Griggs, D.; Visbeck, M. Policy: Map the interactions between Sustainable Development Goals. Nature 2016, 534, 320–322. [Google Scholar] [CrossRef] [PubMed]
- Stafford-Smith, M.; Griggs, D.; Gaffney, O.; Ullah, F.; Reyers, B.; Kanie, N.; Stigson, B.; Shrivastava, P.; Leach, M.; O’Connell, D. Integration: The key to implementing the sustainable development goals. Sustain. Sci. 2017, 12, 911–919. [Google Scholar] [CrossRef] [PubMed]
- Abson, D.J.; Fischer, J.; Leventon, J.; Newig, J.; Schomerus, T.; Vilsmaier, U.; von Wehrden, H.; Abernethy, P.; Ives, C.D.; Jager, N.W. Leverage points for sustainability transformation. Ambio 2017, 46, 30–39. [Google Scholar] [CrossRef] [PubMed]
- Singh, G.G.; Cisneros-Montemayor, A.M.; Swartz, W.; Cheung, W.; Guy, J.A.; Kenny, T.-A.; McOwen, C.J.; Asch, R.; Geffert, J.L.; Wabnitz, C.C. A rapid assessment of co-benefits and trade-offs among sustainable development goals. Mar. Policy 2018, 93, 223–231. [Google Scholar] [CrossRef]
- Schmidt-Traub, G.; Kroll, C.; Teksoz, K.; Durand-Delacre, D.; Sachs, J.D. National baselines for the Sustainable Development Goals assessed in the SDG Index and Dashboards. Nat. Geosci. 2017, 10, 547–555. [Google Scholar] [CrossRef]
- Le Blanc, D. Towards integration at last? The sustainable development goals as a network of targets. Sustain. Dev. 2015, 23, 176–187. [Google Scholar] [CrossRef]
- Gao, L.; Bryan, B.A. Finding pathways to national-scale land-sector sustainability. Nature 2017, 544, 217–222. [Google Scholar] [CrossRef]
- Rasul, G. Managing the food, water, and energy nexus for achieving the Sustainable Development Goals in South Asia. Environ. Dev. 2016, 18, 14–25. [Google Scholar] [CrossRef]
- Allen, C.; Metternicht, G.; Wiedmann, T. National pathways to the Sustainable Development Goals (SDGs): A comparative review of scenario modelling tools. Environ. Sci. Policy 2016, 66, 199–207. [Google Scholar] [CrossRef]
- Jayaraman, R.; Colapinto, C.; La Torre, D.; Malik, T. Multi-criteria model for sustainable development using goal programming applied to the United Arab Emirates. Energy Policy 2015, 87, 447–454. [Google Scholar] [CrossRef]
- Reyers, B.; Stafford-Smith, M.; Erb, K.-H.; Scholes, R.J.; Selomane, O. Essential Variables help to focus Sustainable Development Goals monitoring. Curr. Opin. Environ. Sustain. 2017, 26, 97–105. [Google Scholar] [CrossRef]
- Saltelli, A.; Giampietro, M. What is wrong with evidence based policy, and how can it be improved? Futures 2017, 91, 62–71. [Google Scholar] [CrossRef]
- UN. Transforming Our World: The UN 2030 Agenda for Sustainable Development; Resolution Adopted by the General Assembly on 25 September 2015, A/RES/70/1; UN: New York, NY, USA, 2015. [Google Scholar]
- United Nations. Sustainable Development Goals: 17 Goals to Transform our World. Available online: http://www.un.org/sustainabledevelopment/sustainable-development-goals/ (accessed on 26 May 2017).
- Barbier, E.B.; Burgess, J.C. The sustainable development goals and the systems approach to sustainability. Econ. Open-Assess. E-J. 2017, 11, 1–23. [Google Scholar] [CrossRef]
- Newton, A.C. The green economy and the knowledge economy: Exploring the interface. Int. J. Green Econ. 2011, 5, 231. [Google Scholar] [CrossRef]
- Ivković, A.F.; Ham, M.; Mijoč, J. Measuring Objective Well-Being and Sustainable Development Management. J. Knowl. Manag. Econ. Inf. Technol. 2014, 4, 1–8. [Google Scholar]
- UNEP. Decoupling Natural Resource Use and Environmental Impacts from Economic Growth; A Report of the Working Group on Decoupling to the International Resource Panel; UNEP: Nairobi, Kenya, 2011. [Google Scholar]
- UNDESA. A Guidebook to the Green Economy; Issue 2: Exploring Green Economy Principles; UNDESA: New York, NY, USA, 2012; p. 24. [Google Scholar]
- OECD. Green Growth in Cities. OECD Green Growth Studies; OECD: Paris, France, 2013; p. 136. [Google Scholar]
- World Bank. Inclusive Green Growth: The Pathway to Sustainable Development; World Bank: Washington, DC, USA, 2012. [Google Scholar]
- Paris Agreement. United Nations Treaty Collection. The Voluntary National Reviews. Available online: https://treaties.un.org/Pages/ViewDetails.aspx?src=IND&mtdsg_no=XXVII-7-d&chapter=27&clang=_en (accessed on 1 July 2019).
- He, L.; Zhang, L.; Zhong, Z.; Wang, D.; Wang, F. Green credit, renewable energy investment and green economy development: Empirical analysis based on 150 listed companies of China. J. Clean. Prod. 2019, 208, 363–372. [Google Scholar] [CrossRef]
- Unay-Gailhard, I.; Bojnec, Š. The impact of green economy measures on rural employment: Green jobs in farms. J. Clean. Prod. 2019, 208, 541–551. [Google Scholar] [CrossRef]
- Yaduma, N. Investigating the oil curse in OECD and Non-OECD oil-exporting economies using green measures of income. Environ. Dev. Sustain. 2018, 20, 2725–2745. [Google Scholar] [CrossRef]
- Aldieri, L.; Vinci, C.P. Green Economy and Sustainable Development: The Economic Impact of Innovation on Employment. Sustainability 2018, 10, 3541. [Google Scholar] [CrossRef]
- Kazancoglu, Y.; Kazançoğlu, I.; Sagnak, M. A new holistic conceptual framework for green supply chain management performance assessment based on circular economy. J. Clean. Prod. 2018, 195, 1282–1299. [Google Scholar] [CrossRef]
- Marco-Fondevila, M.; Abadía, J.M.M.; Scarpellini, S. CSR and green economy: Determinants and correlation of firms’ sustainable development. Corp. Soc. Responsib. Environ. Manag. 2018, 25, 756–771. [Google Scholar] [CrossRef]
- Pan, S.Y.; Gao, M.Y.; Kim, H.; Shah, K.J.; Pei, S.L.; Chiang, P.C. Advances and challenges in sustainable tourism toward a green economy. Sci. Total Environ. 2018, 635, 452–469. [Google Scholar] [CrossRef] [PubMed]
- Sinnandavar, C.M.; Wong, W.P.; Soh, K.L. Dynamics of supply environment and information system: Integration, green economy and performance. Transp. Res. D 2018, 62, 536–550. [Google Scholar] [CrossRef]
- Knuth, S. “Breakthroughs” for a green economy? Financialization and clean energy transition. Energy Res. Soc. Sci. 2018, 41, 220–229. [Google Scholar] [CrossRef]
- Quintas, M.A.; Martínez-Senra, A.I.; Sartal, A. The Role of SMEs’ Green Business Models in the Transition to a Low-Carbon Economy: Differences in Their Design and Degree of Adoption Stemming from Business Size. Sustainability 2018, 10, 2109. [Google Scholar] [CrossRef]
- Rudneva, L.; Pchelintseva, I.; Gureva, M. Scenario Modelling of the “Green” Economy in an Economic Space. Resources 2018, 7, 29. [Google Scholar] [CrossRef]
- Asiyanbi, A.P. Financialisation in the green economy: Material connections, markets-in-the-making and Foucauldian organising actions. Environ. Plan. A Econ. Space 2018, 50, 531–548. [Google Scholar] [CrossRef]
- Chen, C.F.; Lan, Q.X.; Gao, M.; Sun, Y.W. Green Total Factor Productivity Growth and Its Determinants in China’s Industrial Economy. Sustainability 2018, 10, 1052. [Google Scholar] [CrossRef]
- Owen, R.; Brennan, G.; Lyon, F. Enabling investment for the transition to a low carbon economy: Government policy to finance early stage green innovation. Curr. Opin. Environ. Sustain. 2018, 31, 137–145. [Google Scholar] [CrossRef]
- United Nations Environment Programme (UNEP). Measuring Progress towards a Green Economy; Draft Working Paper; United Nations Environment Programme: Nairobi, Kenya, 2012. [Google Scholar]
- Nhamo, G. Green economy readiness in South Africa: A focus on the national sphere of government. Int. J. Afr. Renaiss. Stud. 2013, 8, 115–142. [Google Scholar] [CrossRef]
- Kasztelan, A. Green Growth, Green Economy and Sustainable Development: Terminological and Relational Discourse. Prague Econ. Pap. 2017, 26, 487–499. [Google Scholar] [CrossRef]
- GEC. Global Meeting Report 2017: Supporting Green Enterprises to Drive the Transition to Inclusive Green Economies; GEC: Canari, France, 2017. [Google Scholar]
- Loiseau, E.; Saikku, L.; Antikainen, R.; Droste, N.; Hansjürgens, B.; Pitkänen, K.; Leskinen, P.; Kuikman, P.; Thomsen, M. Green economy and related concepts: An overview. J. Clean. Prod. 2016, 139, 361–371. [Google Scholar] [CrossRef]
- Al-Tmeemy, S.M.H.; Rahman, H.A.; Harun, Z. Contractors’ perception of the use of costs of quality system in Malaysian building construction projects. Int. J. Proj. Manag. 2012, 30, 827–838. [Google Scholar] [CrossRef]
- Tzeng, G.-H.; Chiang, C.-H.; Li, C.-W. Evaluating intertwined effects in e-learning programs: A novel hybrid MCDM model based on factor analysis and DEMATEL. Expert Syst. Appl. 2007, 32, 1028–1044. [Google Scholar] [CrossRef]
- Chiu, Y.J.; Chen, H.C.; Tzeng, G.H.; Shyu, J.Z. Marketing strategy based on customer behavior for the LCD-TV. Int. J. Manag. Decis. Mak. 2006, 7, 143–165. [Google Scholar]
- Saaty, T.L.; Cillo, B. The Encyclicon, Volume 2: A Dictionary of Complex Decisions Using the Analytic Network Process; RWS Publications: Pittsburgh, PA, USA, 2009. [Google Scholar]
- Saaty, T.L. Some mathematical concepts of the analytic hierarchy process. Behaviormetrika 1991, 18, 1–9. [Google Scholar] [CrossRef]
- IIED; CAFOD. Securing Social Justice in the Green Economy. 2014. Available online: https://pubs.iied.org/17219IIED/ (accessed on 15 August 2019).
- Global Green Growth Institute; Green Economy Coalition; IIED. Pro-Poor, Inclusive Green Growth: Experience and a New Agenda. 2016. Available online: https://pubs.iied.org/pdfs/G04050.pdf (accessed on 15 August 2019).


© 2019 by the authors. Licensee MDPI, Basel, Switzerland. This article is an open access article distributed under the terms and conditions of the Creative Commons Attribution (CC BY) license (http://creativecommons.org/licenses/by/4.0/).