Methodological Insights to Measure the Agenda 2030 at Urban Level in Italy
Abstract
1. Introduction
2. Methodological Approach
2.1. Criteria Weighting
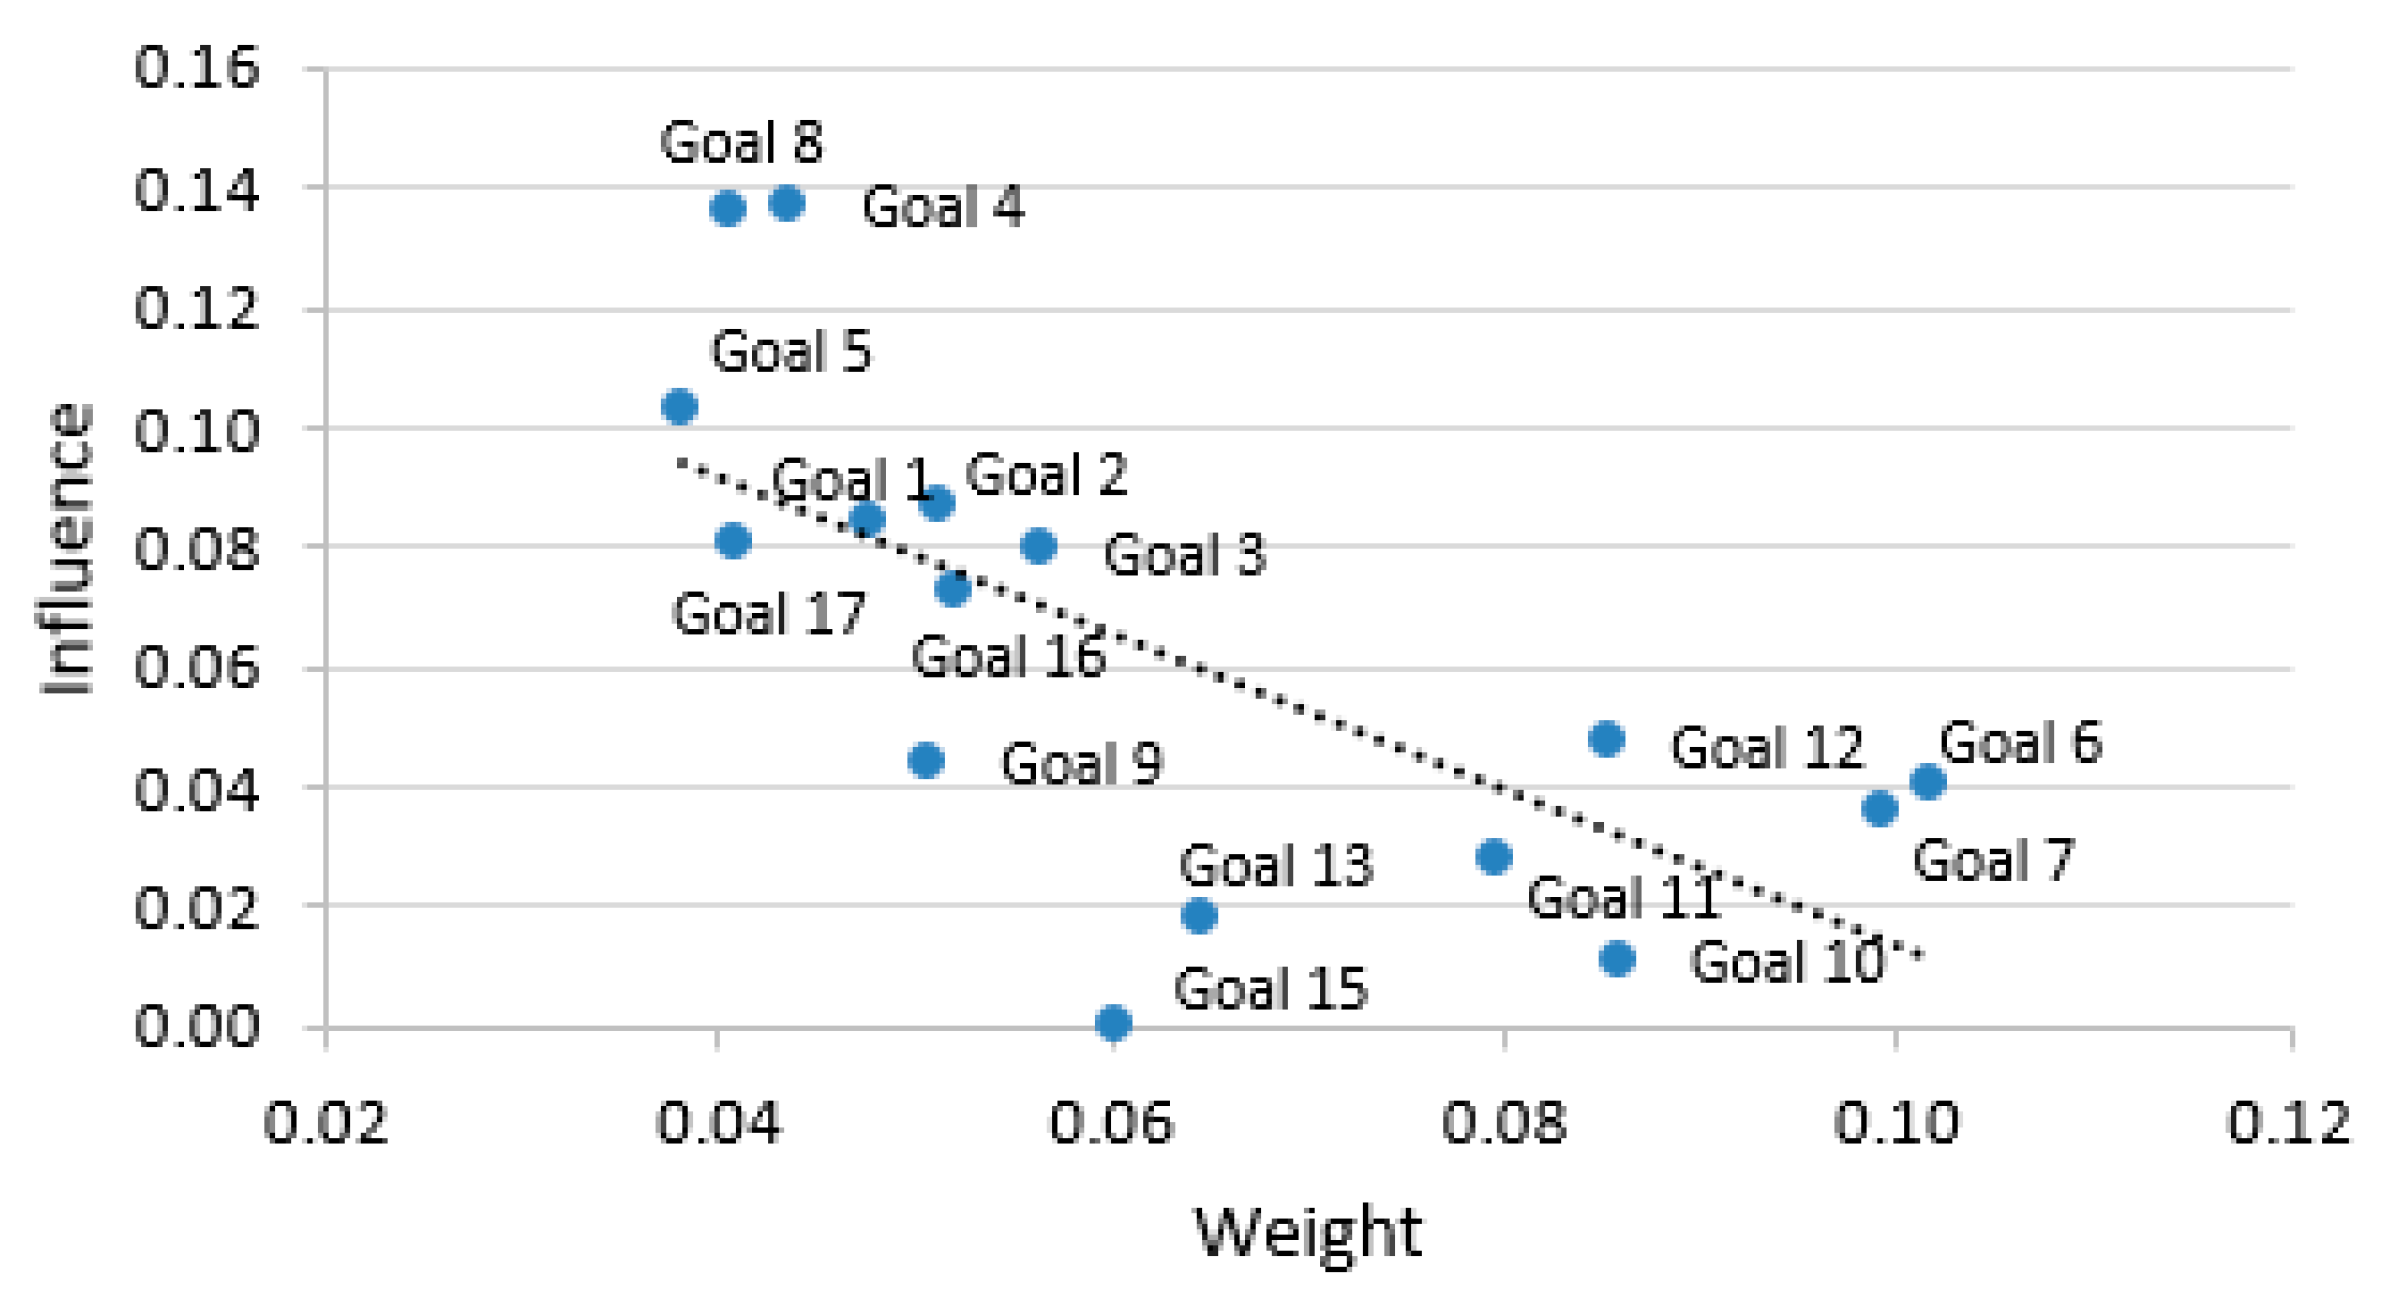
2.2. Final Goal’s Influence on the Composite Index
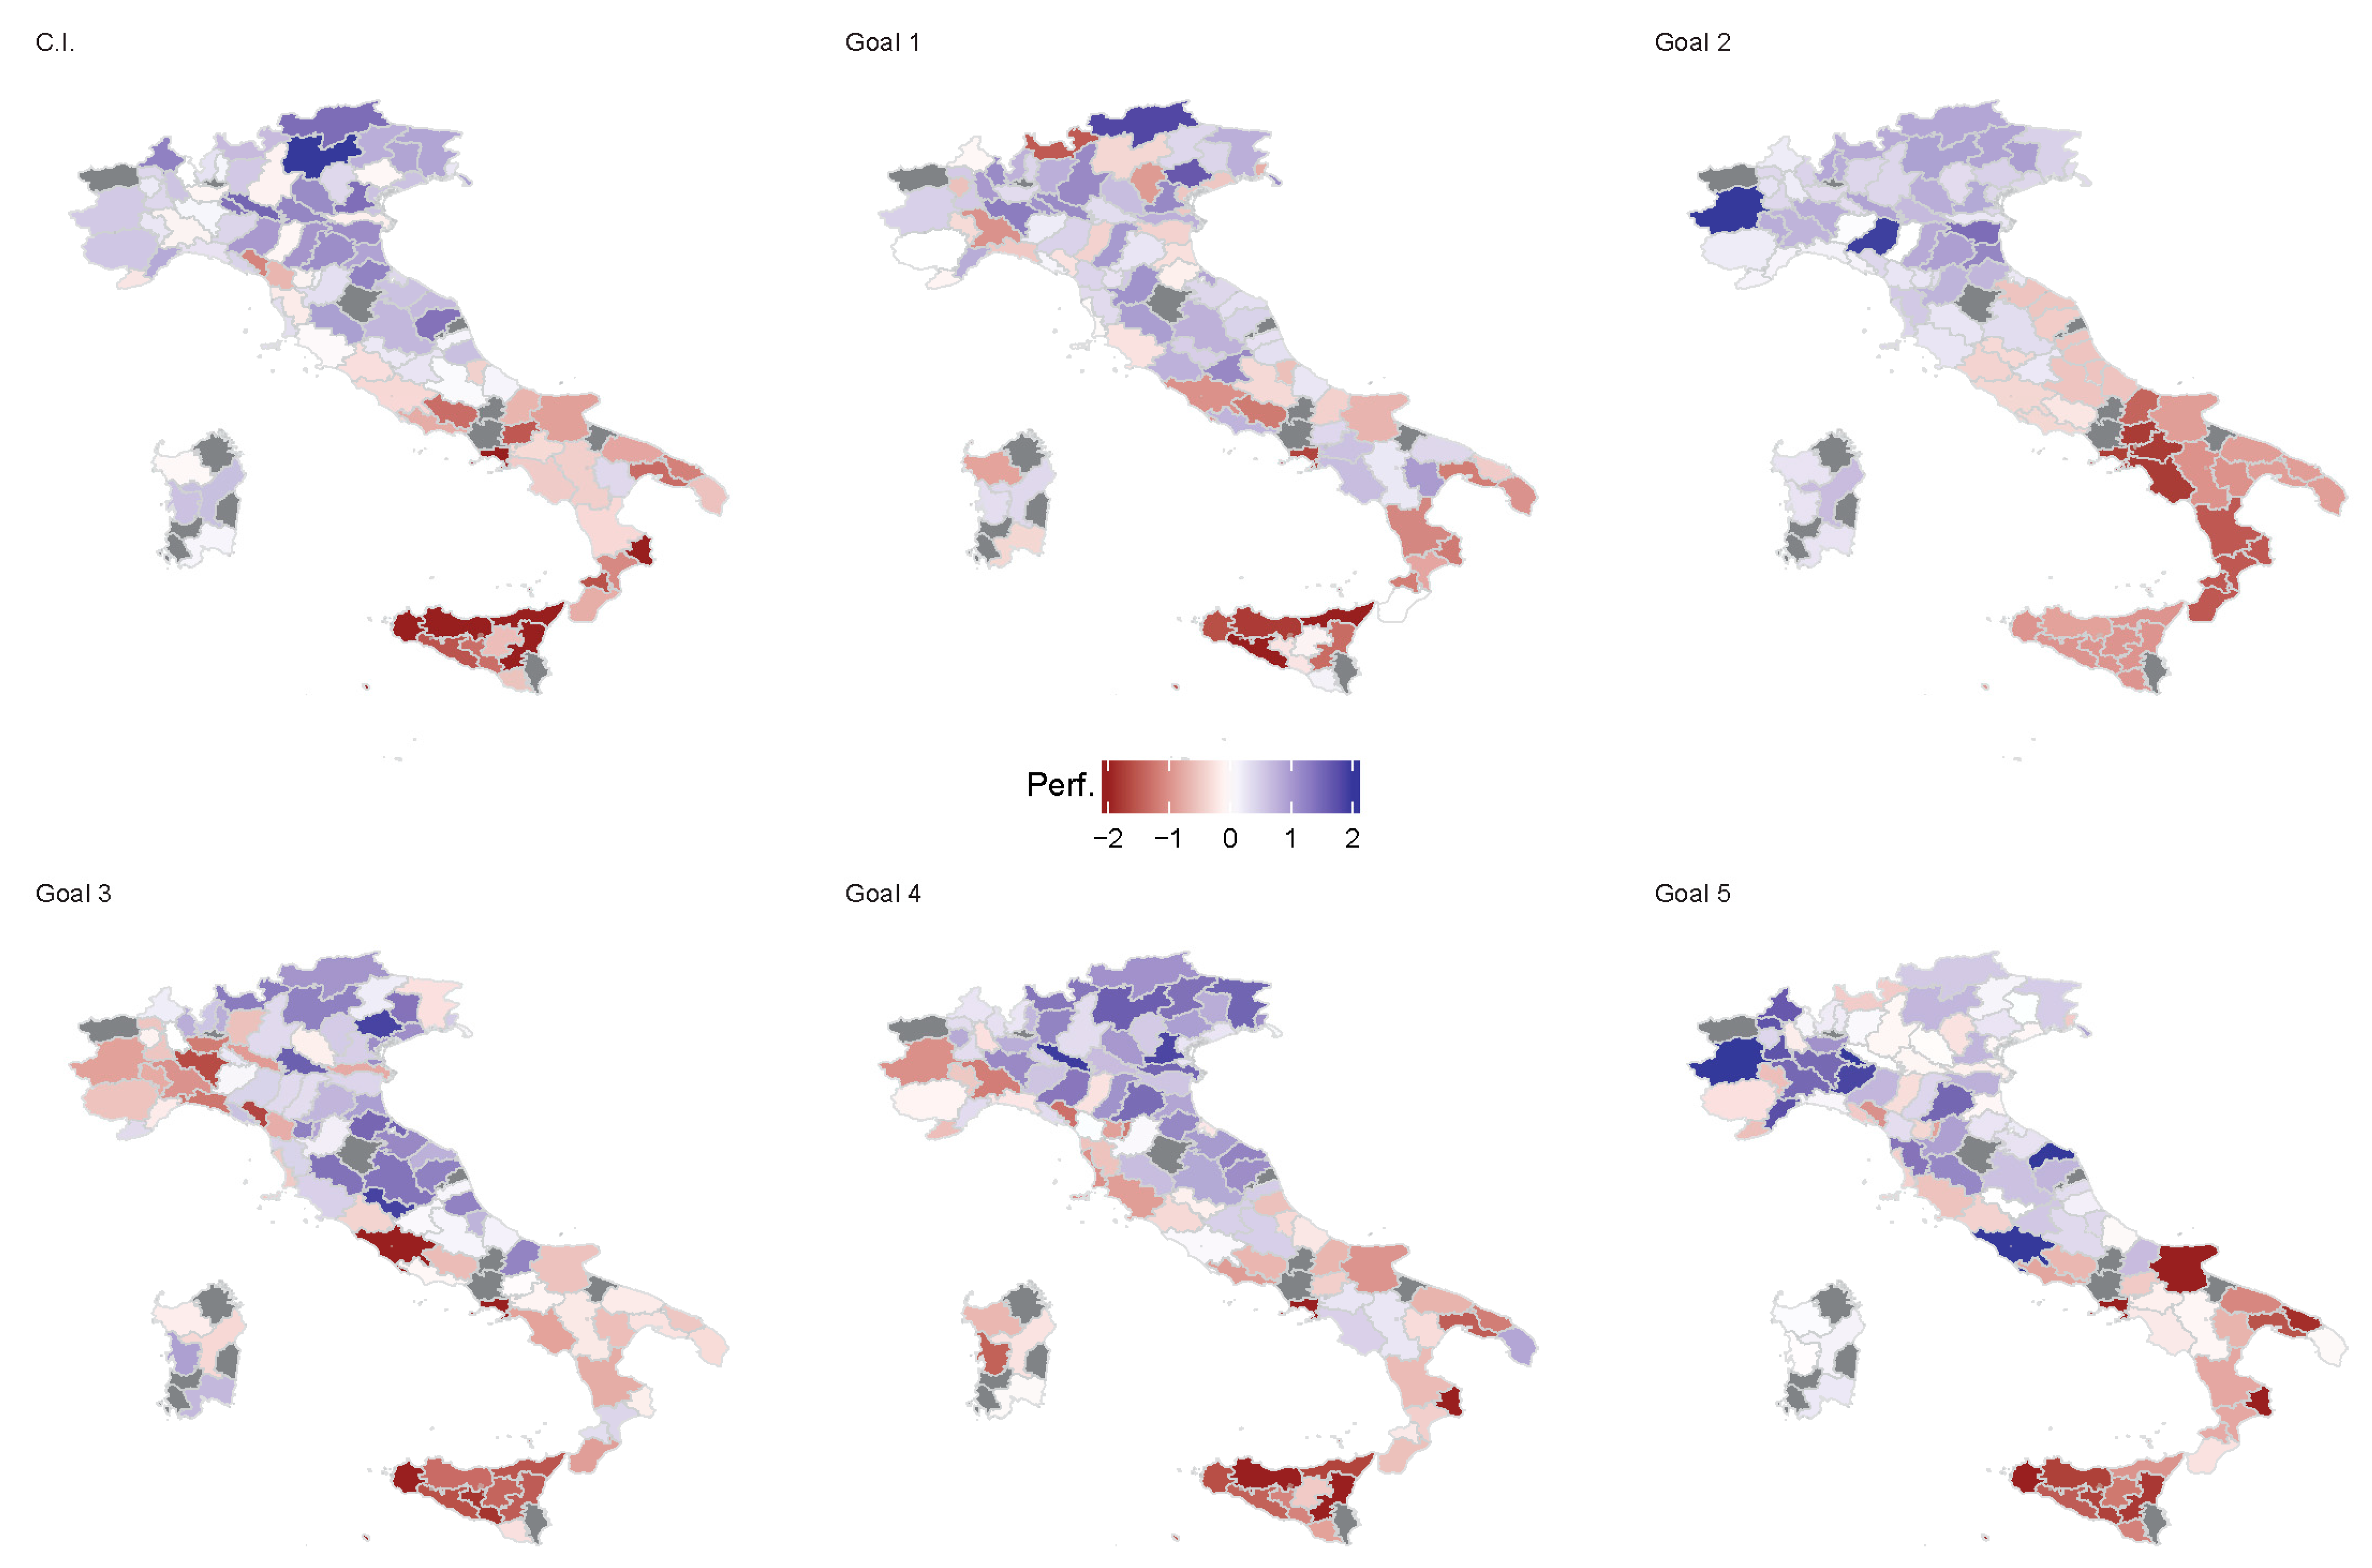
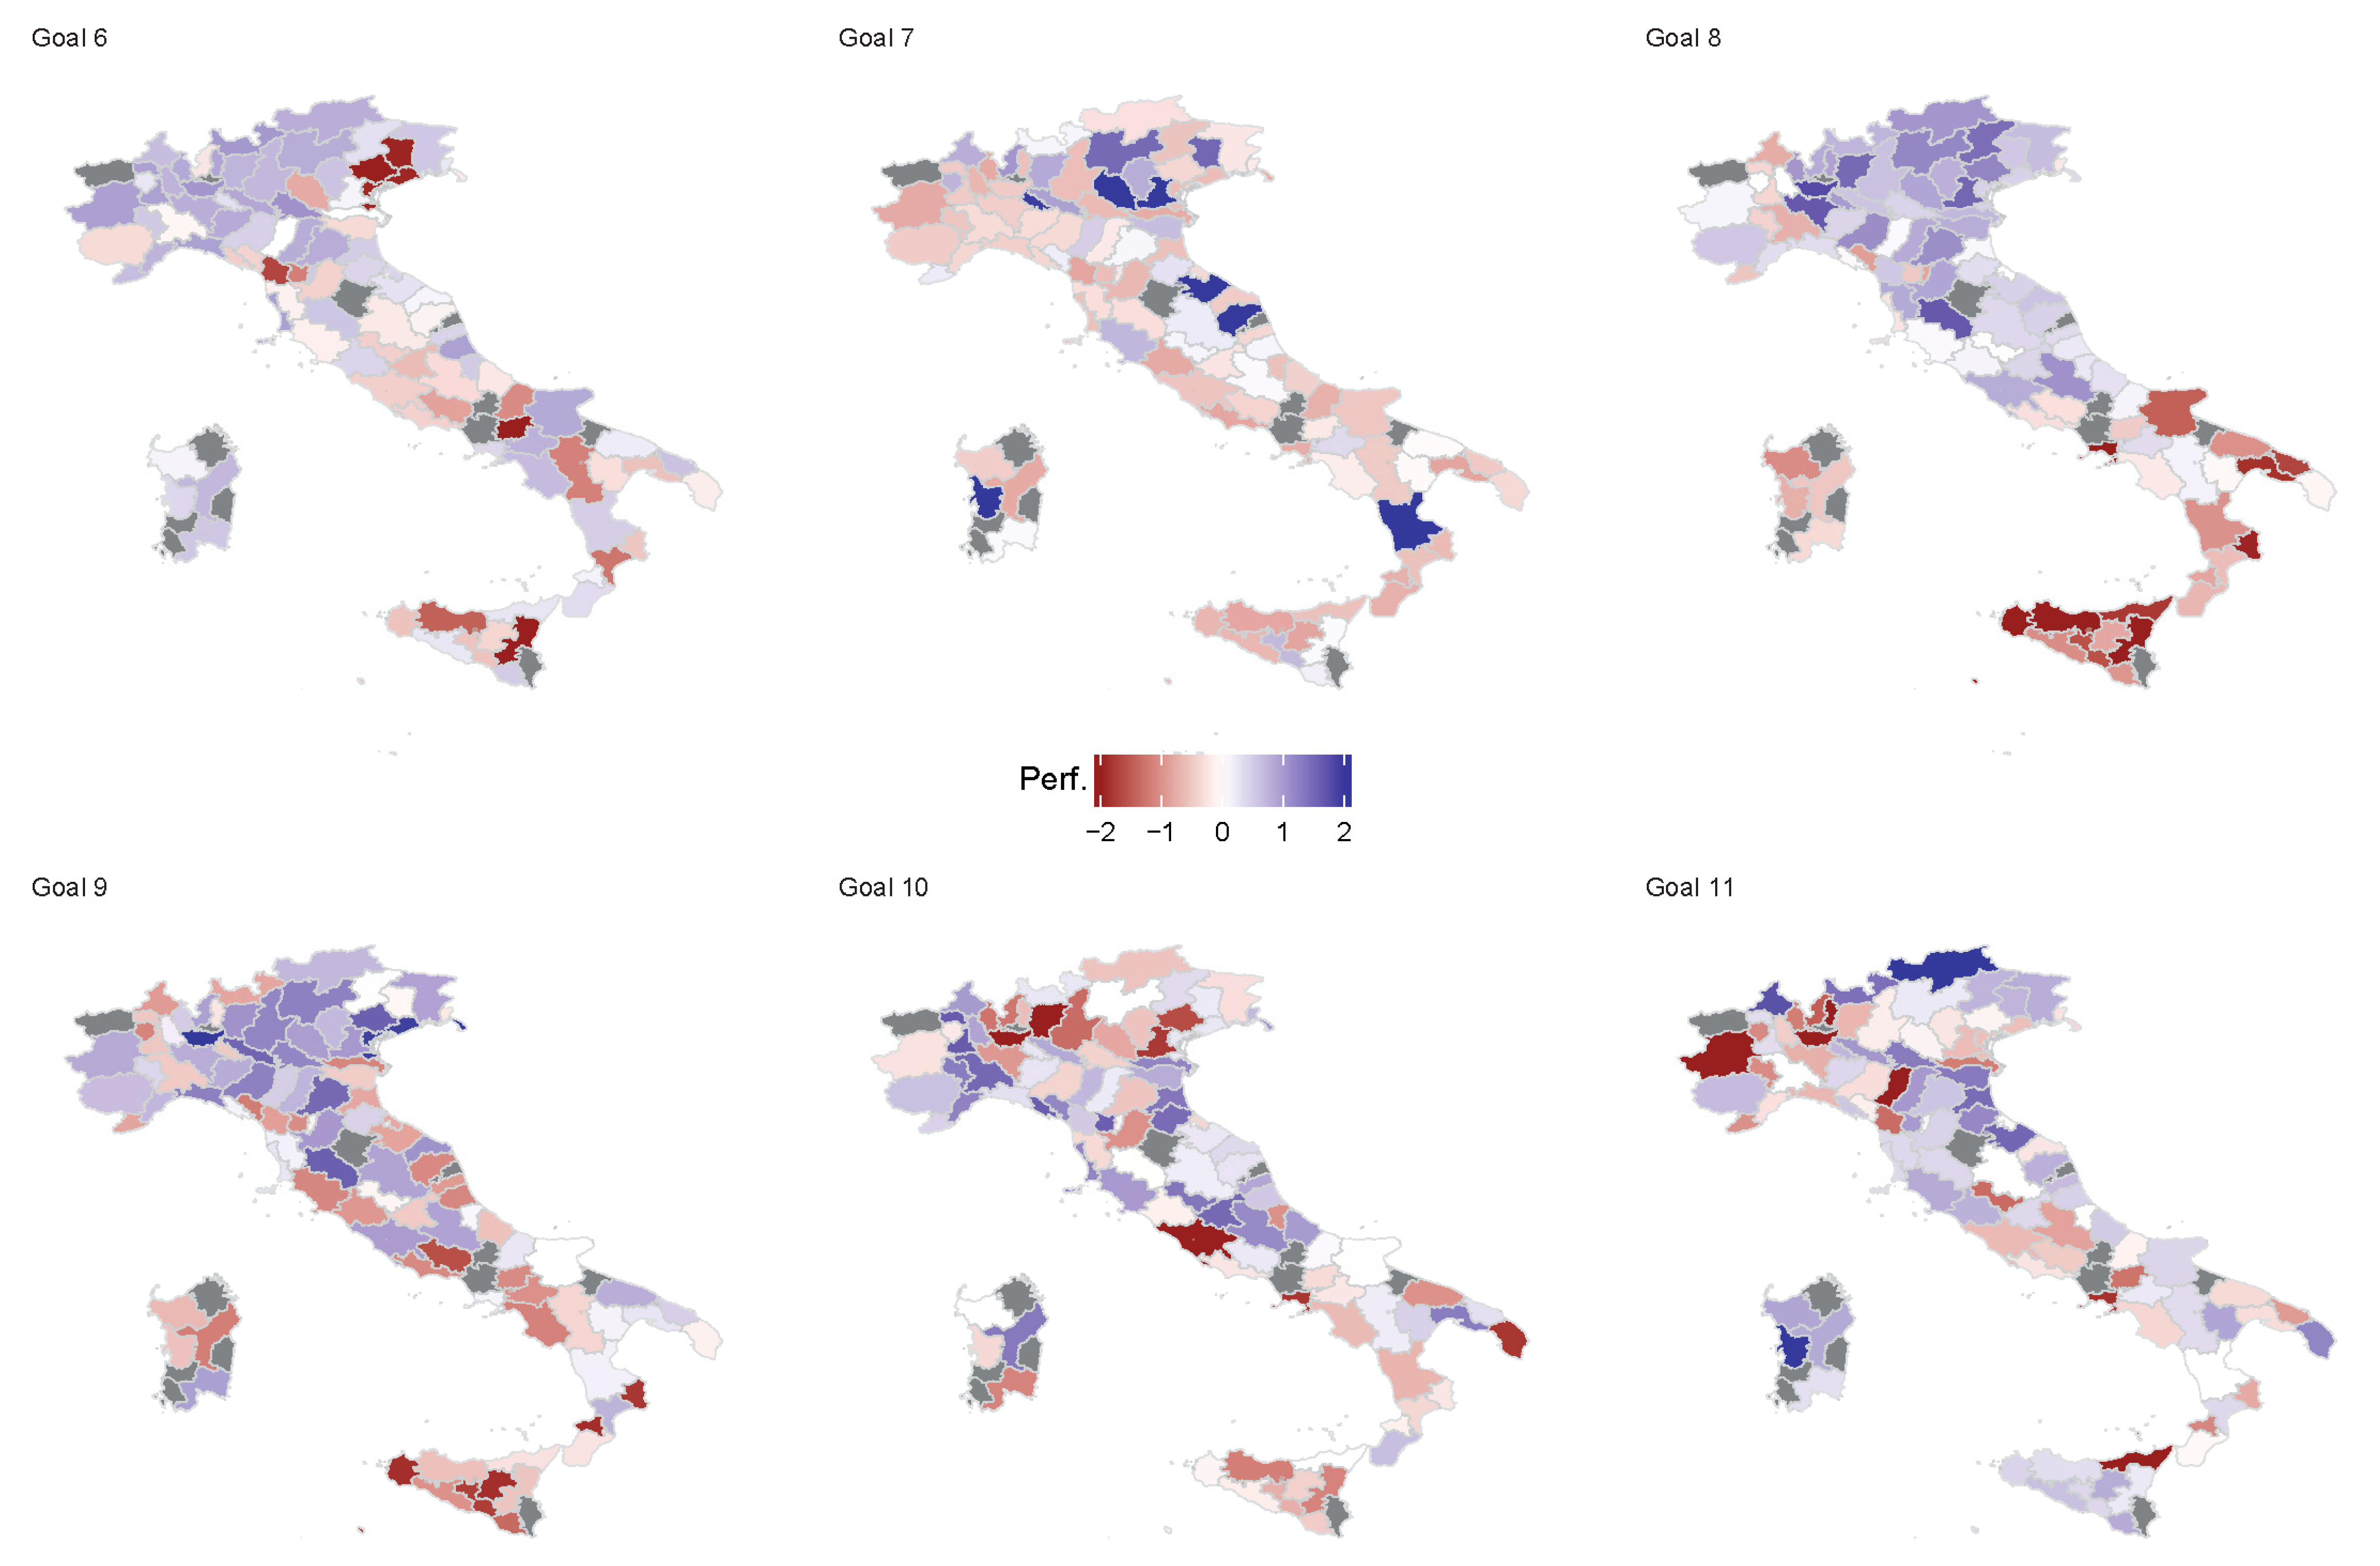
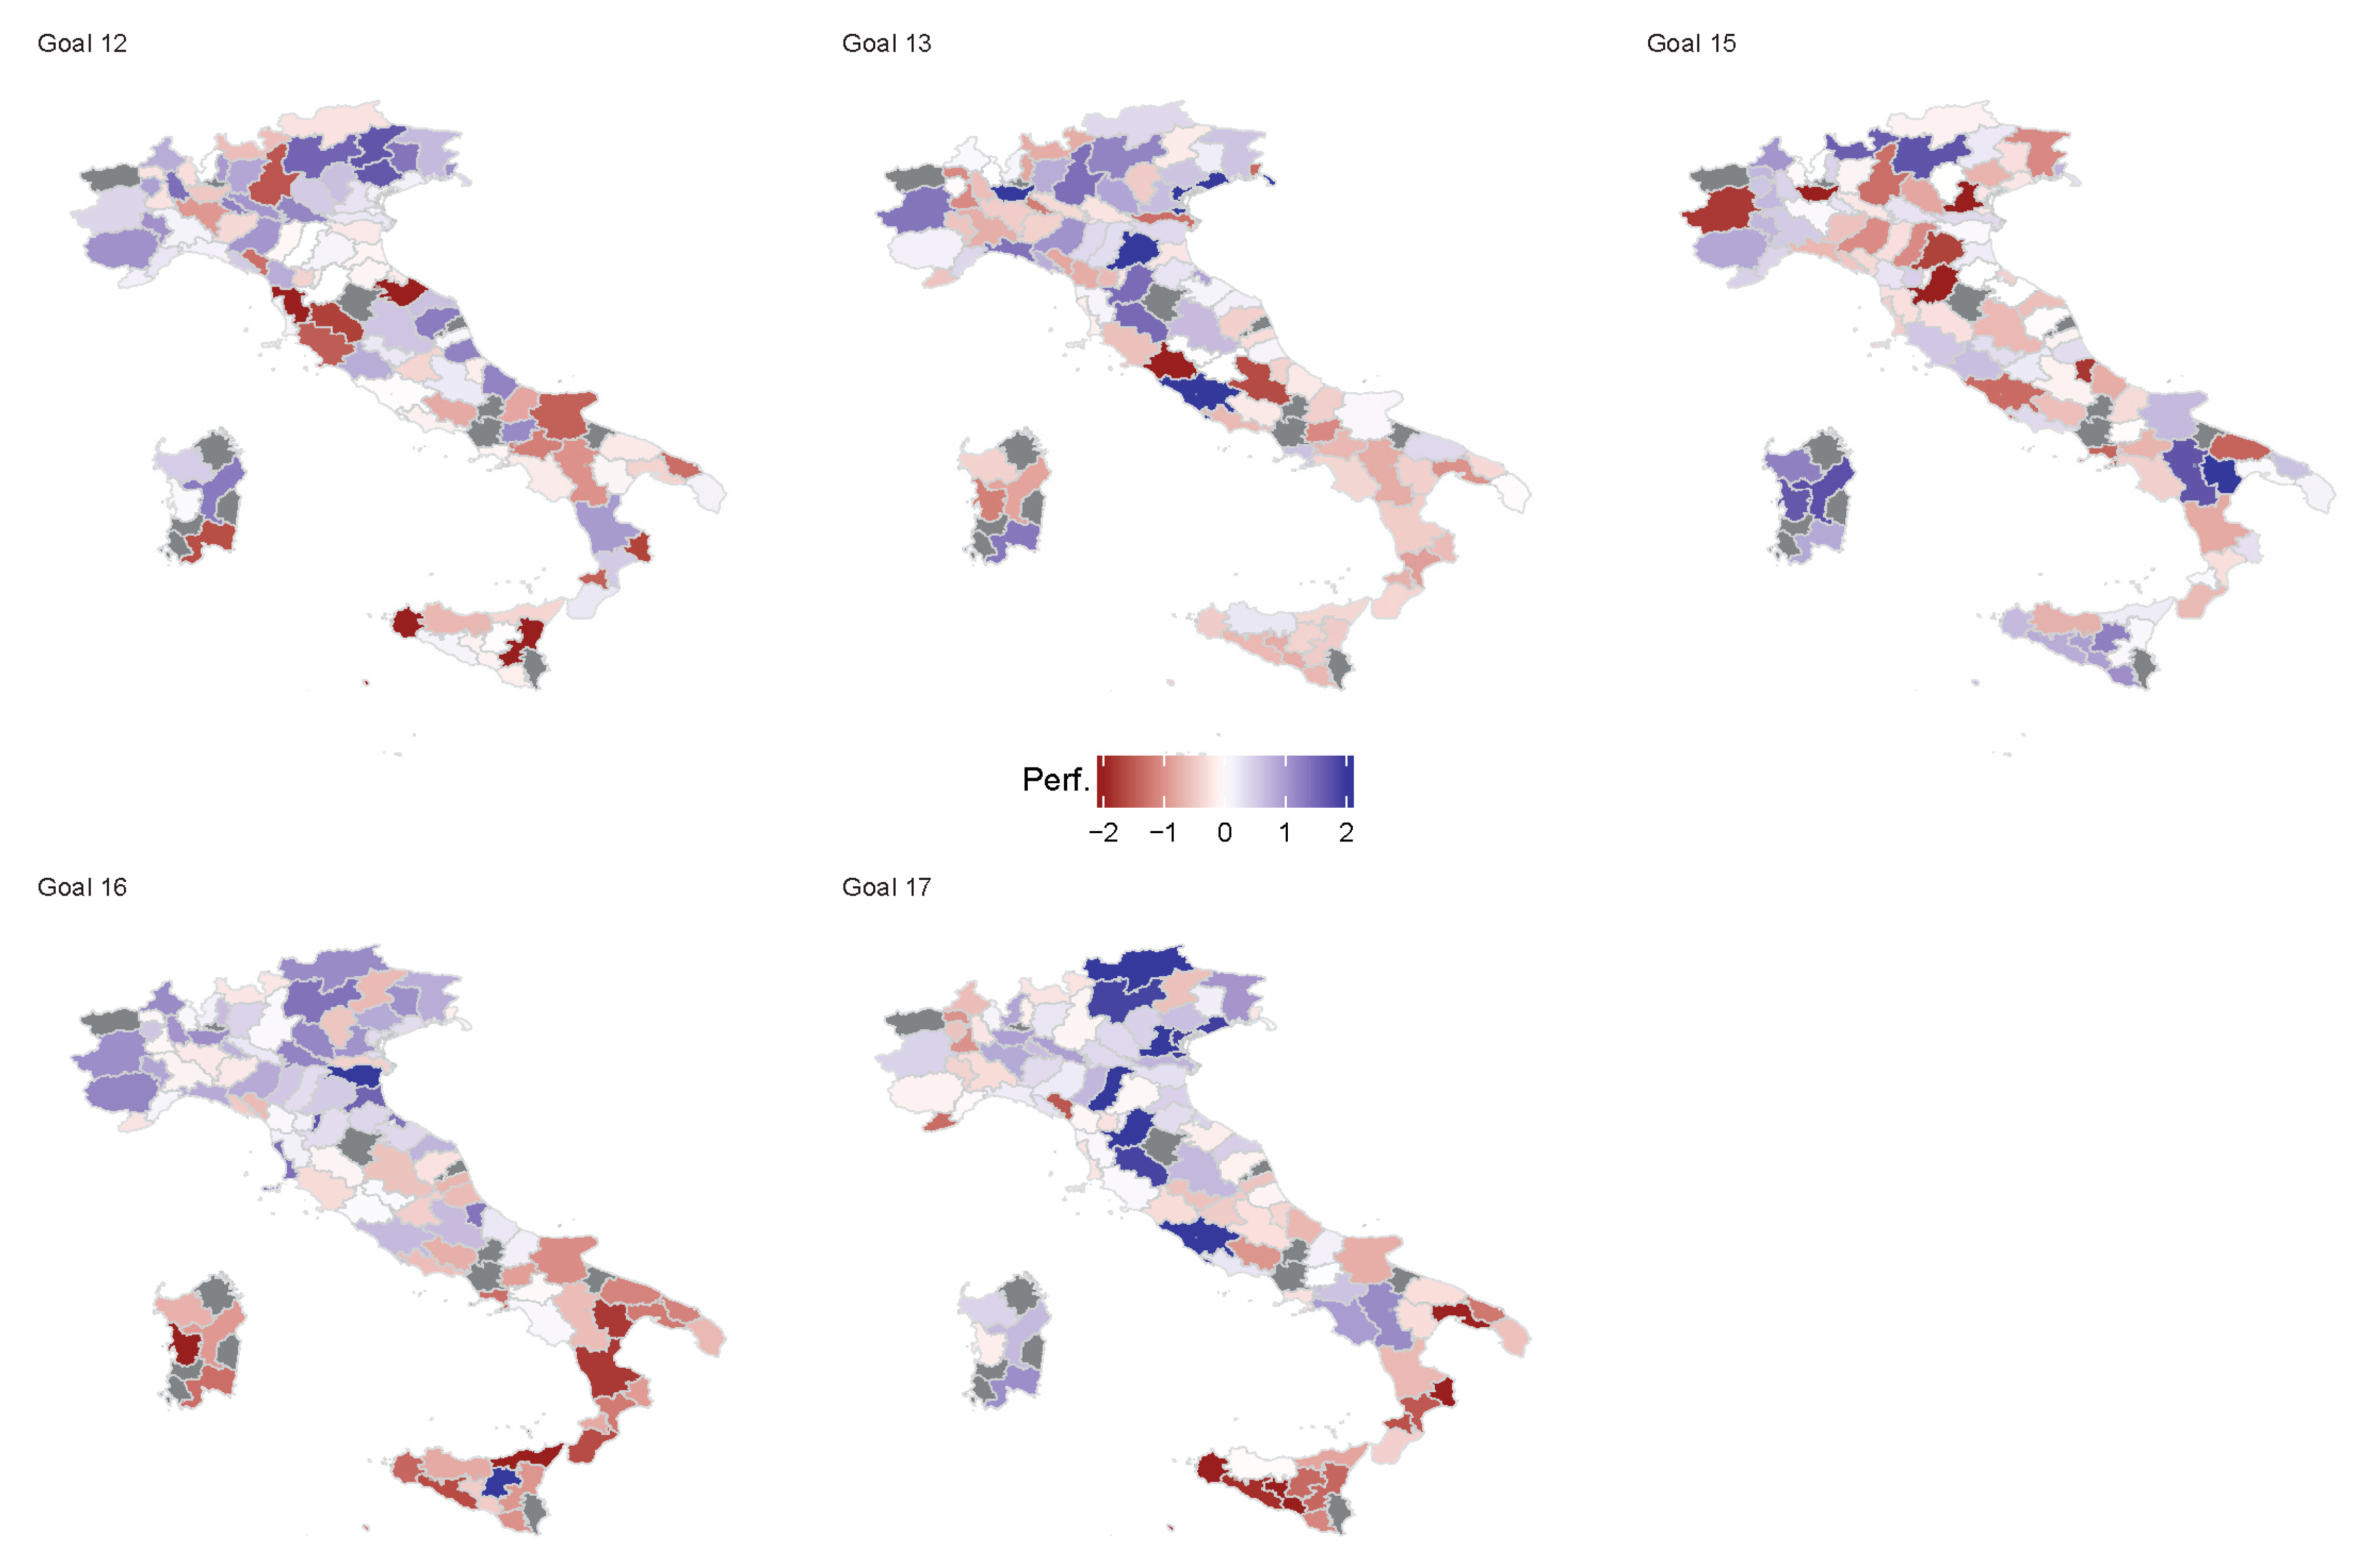
3. Results
4. Discussion and Conclusions
Author Contributions
Funding
Conflicts of Interest
Appendix A
| Indicator | Source | Year | SDGs | Polarity |
|---|---|---|---|---|
| Elderly people dependence index | ISTAT | 2017 | 1 | negative |
| Economic distress | MEF | 2013 | 1 | negative |
| Individuals in low-working intensity families | ISTAT | 2011 | 1 | negative |
| Urban bio gardens | URBES | 2013 | 2 | positive |
| Obesity rate | ISS | 2016 | 2 | negative |
| Healthy life expectancy at birth | ISTAT | 2016 | 3 | positive |
| Healthy life expectancy at 65 years | ISTAT | 2016 | 3 | positive |
| Deaths and injuries in road accidents | ISTAT | 2016 | 3 | negative |
| Support to elderly people | ISTAT | 2015 | 3 | positive |
| Suicide rate | URBES | 2011 | 3 | negative |
| Infant mortality rate | URBES | 2011 | 3 | negative |
| Nursery services for children aged 0–36 | ISTAT | 2013 | 4 | positive |
| Student literary competence | URBES | 2013/14 | 4 | positive |
| Student numerical competence | URBES | 2013/14 | 4 | positive |
| People with university degree | ISTAT | 2011 | 4 | positive |
| Population with low school license (isced 3) | ISTAT | 2011 | 4 | positive |
| Enrolled population at school aged 0–16 | ISTAT | 2011 | 4 | positive |
| Schools with ramps for people with disabilities | URBES | 2013 | 4 | positive |
| School with technologies | MIUR | 2015 | 4 | positive |
| Population with pre-university education | ISTAT | 2015 | 4 | positive |
| Employment gender balance | ISTAT | 2016 | 5 | positive |
| Woman mayor in the last 10 years | DATI.GOV.IT | 2016 | 5 | positive |
| Women educational level compared to men | URBES | 2011 | 5 | positive |
| Water losses | ISTAT | 2015 | 6 | negative |
| Population connected to urban wasted water treatment plants | ISTAT | 2015 | 6 | positive |
| Population served by sewerage | ISTAT | 2015 | 6 | positive |
| Solar PV installed | Legambiente | 2017 | 7 | positive |
| Average taxable income per capita | MEF | 2015 | 8 | positive |
| Neet (15–29) | URBES | 2011 | 8 | negative |
| Youngs aged 18–24 not enrolled in any educational course | URBES | 2011 | 8 | negative |
| Public transportation availability | Legambiente | 2017 | 9 | positive |
| Green firms | UNIONCAMERE | 2015 | 9 | positive |
| Connection infrastructure | Infratel | 2015 | 9 | positive |
| Gini index | MEF | 2014 | 10 | negative |
| Cycling road | Legambiente | 2017 | 11 | positive |
| People with no toilet | URBES | 2011 | 11 | negative |
| Pm 2.5 emission | ISPRA | 2017 | 11 | negative |
| Recycled waste | ISPRA | 2016 | 12 | positive |
| Urban waste | ISPRA | 2016 | 12 | negative |
| Incentive to recycling garden waste | ISPRA | 2016 | 12 | positive |
| Public transportation mobility | Legambiente | 2017 | 13 | positive |
| Bike sharing | ISTAT | 2015 | 13 | positive |
| Propensity to public transportation | ISTAT | 2015 | 13 | positive |
| CO2 emission | OECD | 2008 | 13 | negative |
| Share area utilization | SINAnet | 2016 | 15 | negative |
| Green urban areas per population | Legambiente | 2017 | 15 | positive |
| Ecolabel licenses | ISPRA | 2017 | 15 | positive |
| Political electoral participation | Min. dell’Interno | 2013 | 16 | positive |
| Tribunal efficiency | FPA | 2012 | 16 | negative |
| Firms rating | ISTAT | 2015 | 16 | positive |
| Broadband penetration rate | ISTAT | 2011 | 17 | positive |
| Propensity to association | ANCITEL | 2015 | 17 | positive |
| Social cooperatives | ISPRA | 2015 | 17 | positive |
| Municipality | S.I. | Municipality | Goal_1 | Municipality | Goal_2 | Municipality | Goal_3 | Municipality | Goal_4 | Municipality | Goal_5 |
|---|---|---|---|---|---|---|---|---|---|---|---|
| Trento | 2.30 | Bolzano | 1.83 | Torino | 5.61 | Terni | 1.91 | Cremona | 1.96 | Roma | 2.46 |
| Cremona | 1.51 | Treviso | 1.64 | Parma | 1.93 | Treviso | 1.89 | Padova | 1.85 | Lodi | 2.16 |
| Bolzano | 1.43 | Pavia | 1.27 | Ferrara | 1.43 | Mantova | 1.57 | Trento | 1.59 | Torino | 2.12 |
| Padova | 1.42 | Rieti | 1.16 | Ravenna | 1.18 | Rimini | 1.51 | Udine | 1.53 | Ancona | 2.06 |
| Lodi | 1.39 | Padova | 1.15 | Pordenone | 0.95 | Forli’ | 1.49 | Rovigo | 1.51 | Piacenza | 1.87 |
| Macerata | 1.37 | Brescia | 1.15 | Bologna | 0.94 | Siena | 1.38 | Bologna | 1.44 | Savona | 1.76 |
| Verbania | 1.23 | Trieste | 1.14 | Trento | 0.91 | Pordenone | 1.38 | Belluno | 1.39 | Vercelli | 1.70 |
| Forli’ | 1.21 | Varese | 1.13 | Cremona | 0.90 | Perugia | 1.37 | Sondrio | 1.35 | Verbania | 1.64 |
| Mantova | 1.18 | Cremona | 1.13 | Belluno | 0.90 | Sondrio | 1.29 | Parma | 1.33 | Bologna | 1.50 |
| Verona | 1.12 | Lodi | 1.05 | Bolzano | 0.87 | Trento | 1.23 | Ancona | 1.21 | Alessandria | 1.48 |
| Ferrara | 1.11 | Firenze | 1.05 | Como | 0.86 | Macerata | 1.23 | Bergamo | 1.20 | Pavia | 1.47 |
| Bologna | 1.10 | Novara | 0.99 | Padova | 0.85 | Pistoia | 1.23 | Forli’ | 1.16 | Pisa | 1.35 |
| Modena | 1.02 | Modena | 0.98 | Modena | 0.83 | Teramo | 1.22 | Pavia | 1.15 | Siena | 1.17 |
| Parma | 0.99 | Matera | 0.96 | Sondrio | 0.82 | Campobasso | 1.20 | Gorizia | 1.11 | Milano | 1.06 |
| Siena | 0.93 | Siena | 0.95 | Lecco | 0.81 | Pesaro | 1.16 | Macerata | 1.11 | Firenze | 0.92 |
| Catanzaro | −0.87 | Alessandria | −0.99 | Trapani | −0.97 | Cremona | −0.91 | Torino | −1.01 | Messina | −0.97 |
| Massa | −1.08 | Lecce | −0.99 | Agrigento | −0.97 | Alessandria | −0.99 | Caltanissetta | −1.13 | Massa | −1.00 |
| Brindisi | −1.12 | Roma | −0.99 | Messina | −0.97 | Milano | −1.20 | Brindisi | −1.18 | Bari | −1.09 |
| Caltanissetta | −1.15 | Cosenza | −1.08 | Matera | −0.98 | Genova | −1.25 | Alessandria | −1.18 | Ragusa | −1.15 |
| Frosinone | −1.32 | Taranto | −1.19 | Potenza | −0.98 | Palermo | −1.35 | Prato | −1.21 | Enna | −1.23 |
| Taranto | −1.33 | Vibo valentia | −1.19 | Campobasso | −1.41 | Enna | −1.41 | Massa | −1.30 | Agrigento | −1.49 |
| Benevento | −1.34 | Crotone | −1.20 | Reggio di Calabria | −1.52 | Catania | −1.49 | Agrigento | −1.44 | Taranto | −1.56 |
| Agrigento | −1.51 | Frosinone | −1.21 | Catanzaro | −1.52 | Messina | −1.55 | Oristano | −1.44 | Caltanissetta | −1.72 |
| Vibo valentia | −1.56 | Catania | −1.34 | Cosenza | −1.52 | Agrigento | −1.59 | Taranto | −1.47 | Palermo | −1.73 |
| Palermo | −1.57 | Sondrio | −1.51 | Vibo valentia | −1.52 | Pavia | −1.63 | Trapani | −1.61 | Catania | −1.80 |
| Crotone | −2.14 | Trapani | −1.60 | Crotone | −1.52 | Massa | −1.68 | Messina | −1.70 | Brindisi | −1.88 |
| Messina | −2.19 | Napoli | −1.69 | Napoli | −1.75 | Caltanissetta | −1.84 | Crotone | −2.05 | Foggia | −2.01 |
| Trapani | −2.38 | Palermo | −1.77 | Salerno | −1.77 | Roma | −2.20 | Catania | −2.09 | Napoli | −2.05 |
| Napoli | −2.44 | Agrigento | −4.01 | Avellino | −1.77 | Napoli | −2.87 | Palermo | −2.47 | Crotone | −2.06 |
| Catania | −2.54 | Messina | −4.55 | Benevento | −1.77 | Trapani | −3.12 | Napoli | −2.91 | Trapani | −2.10 |
| Municipality | Goal_6 | Municipality | Goal_7 | Municipality | Goal_8 | Municipality | Goal_9 | Municipality | Goal_10 | Municipality | Goal_11 |
|---|---|---|---|---|---|---|---|---|---|---|---|
| Mantova | 1.07 | Padova | 3.96 | Milano | 1.80 | Milano | 2.78 | Vercelli | 1.63 | Bolzano | 2.07 |
| Milano | 1.02 | Macerata | 3.66 | Pavia | 1.65 | Trieste | 2.19 | La Spezia | 1.60 | Oristano | 2.03 |
| Sondrio | 1.01 | Pesaro | 3.56 | Siena | 1.64 | Venezia | 1.94 | Pistoia | 1.59 | Verbania | 1.73 |
| Livorno | 0.93 | Verona | 3.32 | Padova | 1.52 | Treviso | 1.58 | Rieti | 1.48 | Pesaro | 1.51 |
| Torino | 0.92 | Oristano | 2.27 | Bergamo | 1.47 | Siena | 1.57 | Alessandria | 1.48 | Ravenna | 1.44 |
| Vercelli | 0.92 | Cosenza | 2.16 | Belluno | 1.44 | Cremona | 1.52 | Forli’ | 1.46 | Sondrio | 1.41 |
| Teramo | 0.91 | Lodi | 1.95 | Treviso | 1.20 | Bologna | 1.47 | Terni | 1.35 | Ferrara | 1.31 |
| Genova | 0.91 | Pordenone | 1.52 | Trento | 1.18 | Genova | 1.24 | Ravenna | 1.34 | Mantova | 1.30 |
| Lecco | 0.89 | Trento | 1.47 | Parma | 1.11 | Trento | 1.23 | Nuoro | 1.33 | Lecce | 1.19 |
| Cremona | 0.86 | Como | 1.02 | Bologna | 1.09 | Parma | 1.23 | Asti | 1.28 | Forli’ | 1.17 |
| Foggia | 0.85 | Cremona | 0.92 | L’Aquila | 1.07 | Brescia | 1.19 | Taranto | 1.28 | Cremona | 1.02 |
| Varese | 0.84 | Bergamo | 0.84 | Varese | 1.03 | Mantova | 1.19 | Savona | 1.22 | Modena | 1.00 |
| Piacenza | 0.82 | Vicenza | 0.82 | Bolzano | 1.02 | Bergamo | 1.06 | Rovigo | 1.21 | Pistoia | 0.99 |
| Trento | 0.81 | Verbania | 0.79 | Lodi | 0.98 | Ancona | 1.05 | Livorno | 1.20 | Matera | 0.89 |
| Modena | 0.81 | Biella | 0.73 | Lecco | 0.90 | Firenze | 1.00 | Massa | 1.18 | Sassari | 0.87 |
| Taranto | −0.57 | Vibo valentia | −0.70 | Ragusa | −0.96 | Macerata | −1.08 | Firenze | −1.00 | Asti | −1.06 |
| Rieti | −0.62 | Reggio di Calabria | −0.72 | Cosenza | −0.99 | Teramo | −1.08 | Pescara | −1.01 | Biella | −1.07 |
| Verona | −0.79 | Campobasso | −0.72 | Bari | −0.99 | Grosseto | −1.08 | Cagliari | −1.12 | Vibo valentia | −1.09 |
| Frosinone | −0.86 | Napoli | −0.75 | Agrigento | −1.02 | Rovigo | −1.10 | Catania | −1.13 | Rovigo | −1.19 |
| Campobasso | −1.06 | Trieste | −0.75 | Sassari | −1.04 | Biella | −1.13 | Palermo | −1.17 | Varese | −1.19 |
| Potenza | −1.15 | Rovigo | −0.76 | Foggia | −1.47 | Salerno | −1.14 | Como | −1.24 | Benevento | −1.28 |
| Pistoia | −1.17 | Torino | −0.77 | Caltanissetta | −1.59 | Nuoro | −1.17 | Varese | −1.27 | Lucca | −1.33 |
| Catanzaro | −1.26 | Nuoro | −0.77 | Brindisi | −1.70 | Massa | −1.20 | Brescia | −1.34 | Terni | −1.35 |
| Palermo | −1.47 | Viterbo | −0.78 | Messina | −1.80 | Ragusa | −1.38 | Treviso | −1.62 | Como | −1.46 |
| Lucca | −1.68 | Varese | −0.78 | Taranto | −1.86 | Frosinone | −1.60 | Padova | −1.79 | Napoli | −1.85 |
| Venezia | −1.93 | Latina | −0.79 | Crotone | −1.95 | Caltanissetta | −1.74 | Lecce | −1.82 | Milano | −2.05 |
| Pordenone | −1.95 | Palermo | −0.80 | Trapani | −2.41 | Crotone | −1.81 | Napoli | −1.82 | Lecco | −2.44 |
| Benevento | −3.02 | Lucca | −0.81 | Palermo | −2.52 | Trapani | −1.87 | Roma | −2.15 | Torino | −2.64 |
| Treviso | −4.20 | Enna | −0.83 | Napoli | −2.87 | Enna | −1.87 | Bergamo | −2.49 | Reggio nell’Emilia | −2.66 |
| Catania | −4.85 | Taranto | −0.83 | Catania | −3.15 | Vibo valentia | −1.89 | Milano | −3.93 | Messina | −3.07 |
| Municipality | Goal_12 | Municipality | Goal_13 | Municipality | Goal_15 | Municipality | Goal_16 | Municipality | Goal_17 |
|---|---|---|---|---|---|---|---|---|---|
| Belluno | 1.68 | Venezia | 4.33 | Matera | 5.04 | Enna | 3.05 | Roma | 2.67 |
| Treviso | 1.68 | Milano | 3.75 | Nuoro | 1.76 | Ferrara | 2.45 | Firenze | 2.35 |
| Trento | 1.53 | Roma | 2.17 | Trento | 1.70 | Prato | 1.70 | Padova | 2.26 |
| Novara | 1.42 | Bologna | 2.00 | Potenza | 1.68 | Ravenna | 1.54 | Modena | 2.10 |
| Pordenone | 1.35 | Trieste | 2.00 | Oristano | 1.66 | Livorno | 1.42 | Bolzano | 2.02 |
| Nuoro | 1.31 | Siena | 1.48 | Sondrio | 1.60 | Trento | 1.38 | Venezia | 1.94 |
| Macerata | 1.28 | Firenze | 1.45 | Enna | 1.24 | Rimini | 1.37 | Trento | 1.89 |
| Lodi | 1.26 | Brescia | 1.42 | Sassari | 1.24 | Pescara | 1.36 | Siena | 1.89 |
| Teramo | 1.22 | Genova | 1.39 | Ragusa | 1.08 | Mantova | 1.21 | Potenza | 1.12 |
| Chieti | 1.21 | Torino | 1.35 | Verbania | 1.02 | Cuneo | 1.20 | Cagliari | 1.10 |
| Mantova | 1.18 | Cagliari | 1.34 | Caltanissetta | 0.94 | Verona | 1.17 | Udine | 1.03 |
| Benevento | 1.15 | Trento | 1.21 | Cuneo | 0.86 | Verbania | 1.13 | Salerno | 0.96 |
| Gorizia | 1.09 | Parma | 1.06 | Cagliari | 0.85 | Bolzano | 1.13 | Cremona | 0.94 |
| Asti | 1.07 | Rimini | 0.90 | Agrigento | 0.80 | Milano | 1.11 | Milano | 0.93 |
| Cuneo | 1.07 | Verona | 0.89 | Gorizia | 0.74 | Torino | 1.10 | Como | 0.88 |
| Potenza | −0.99 | Sondrio | −0.76 | Cosenza | −0.79 | Ragusa | −1.01 | Frosinone | −0.96 |
| Avellino | −1.17 | Lucca | −0.76 | Verona | −0.81 | Foggia | −1.03 | Vercelli | −0.99 |
| Brindisi | −1.32 | Massa | −0.80 | Parma | −1.04 | Bari | −1.13 | Ragusa | −1.10 |
| Massa | −1.32 | Lecco | −0.82 | Modena | −1.06 | Brindisi | −1.13 | Brindisi | −1.24 |
| Foggia | −1.44 | Nuoro | −0.85 | Udine | −1.08 | Catanzaro | −1.21 | Imperia | −1.33 |
| Vibo valentia | −1.45 | Catanzaro | −0.89 | Brescia | −1.31 | Taranto | −1.22 | Enna | −1.37 |
| Grosseto | −1.48 | Taranto | −0.99 | Roma | −1.35 | Cagliari | −1.31 | Catania | −1.39 |
| Brescia | −1.54 | Vercelli | −1.07 | Napoli | −1.41 | Napoli | −1.32 | Catanzaro | −1.51 |
| Cagliari | −1.61 | Benevento | −1.08 | Bari | −1.43 | Trapani | −1.39 | Massa | −1.54 |
| Crotone | −1.70 | Oristano | −1.16 | Bologna | −1.71 | Agrigento | −1.62 | Vibo valentia | −1.58 |
| Siena | −1.73 | Lodi | −1.19 | Torino | −1.78 | Reggio di Calabria | −1.63 | Agrigento | −1.88 |
| Pisa | −2.03 | Rovigo | −1.31 | Pescara | −1.81 | Matera | −1.79 | Taranto | −1.97 |
| Trapani | −2.09 | Gorizia | −1.36 | Firenze | −2.03 | Cosenza | −1.79 | Crotone | −2.00 |
| Catania | −2.57 | L’Aquila | −1.64 | Milano | −2.38 | Oristano | −2.21 | Trapani | −2.34 |
| Pesaro | −4.18 | Viterbo | −2.35 | Padova | −2.39 | Messina | −2.92 | Caltanissetta | −2.62 |
References
- Prakash, M.; Teksoz, K.; Espey, J.; Sachs, J.; Shank, M.; Schmidt-Traub, G. Achieving a Sustanable Urban America; SDSN Report; Sustainable Development Solutions Network (SDSN): New York, NY, USA, 2017. [Google Scholar]
- Sachs, J.; Schmidt-Traub, G.; Kroll, C.; Lafortune, G.; Fuller, G. SDG Index and Dashboards Report 2018; Bertelsmann Stiftung and Sustainable Development Solutions Network (SDSN): New York, NY, USA, 2018. [Google Scholar]
- Cavalli, L. Da Agenda 2030 Globale ad Agenda 2030 Locale; FEEM Report; FEEM: Milano, Italy, 2018; Available online: https://www.feem.it/en/publications/reports/agenda-2030-da-globale-a-locale/ (accessed on 3 June 2019).
- OECD. Measuring Distance to the SDG Targets: An Assessment of Where OECD Countries Stand. 2017. Available online: http://www.oecd.org/std/OECD-Measuring-Distanceto-SDG- (accessed on 3 June 2019).
- EUROSTAT. Sustainable Development in the European Union; Overview Progress on the Goals in the EU Context; European Commission: Brussels, Belgium, 2017. [Google Scholar]
- AsviS. L’Italia e gli Obiettivi di Sviluppo Sostenibile; Report; Editron srl: Roma, Italy, 2017. [Google Scholar]
- Campagnolo, L.; Carraro, C.; Eboli, F.; Farnia, L.; Parrado, R.; Pierfederici, R. The Ex-Ante Evaluation of Achieving Sustainable Development Goals. Soc. Indic. Res. 2018, 136, 73–116. [Google Scholar] [CrossRef]
- Alberti, M. Measuring Urban Sustainability. Environ. Impact Assess. Rev. 1996, 16, 381–424. [Google Scholar] [CrossRef]
- Elmqvist, T.; Frantzeskaki, N.; Maddox, D.; Parnell, S.; Simon, D.; Bai, X.; Griffith, C.; McPhearson, T.; Romero-Lankao, P.; Watkins, M. The Urban Planet: Knowledge Towards Sustainable Cities; Cambridge University Press: Cambridge, UK, 2018. [Google Scholar]
- Wong, C. Quantitative Indicators for Urban and Regional Planning: The Interplay of Policy and Methods; Routledge: London, UK, 2006; Available online: www.un.org/sustainabledevelopment/development-agenda/ (accessed on 3 June 2019).
- Wong, C. A Framework for ‘City Prosperity Index’: Linking Indicators, Analysis and Policy. Habitat Int. 2014, 45, 3–9. [Google Scholar] [CrossRef]
- Herva, M.; Franco, A.; Carrasco, E.F.; Roca, E. Review of corporate environmental indicators. J. Clean. Prod. 2011, 19, 1687–1699. [Google Scholar] [CrossRef]
- Sirgy, M.J.; Lee, D.; Miller, C.; Littlefield, J.E. The Impact of Globalization on a Country’s Quality of Life: Toward an Integrated Model. Soc. Ind. Res. 2004, 68, 251–298. [Google Scholar] [CrossRef]
- Prescott-Allen, R. The Wellbeing of Nations: A Contry-by-Country Index of Quality of Life and the Environment; International Development Research Centre, Island Press/Ottawa: Washington, DC, USA, 2001. [Google Scholar]
- Sanchez Rodriguez, R.; Ürge-Vorsatz, D.; Salisu Barau, A. Sustainable Development Goals and climate change adaption in cities. Nat. Clim. Chang. 2018, 8, 181–183. [Google Scholar] [CrossRef]
- Li, X.; Woetzel, J.; Zhang, G.; Zhang, Y. The China Urban Sustainability Index 2013. In Urban China Initiative; Urban China Initiative: Beijing, China, 2014. [Google Scholar]
- Van Dijken, K.; Dorenbos, R.; Kamphof, R. The Reference Framework for Sustainable Cities (RFSC): Testing Results and Recommendations; Nicis Institute: Den Haag, The Netherlands, 2012. [Google Scholar]
- Watson, J. European Green City Index: Assessing the Environmental Impact of Europe’s Major Cities; Economist Intelligence Unit; Siemens: Munich, Germany, 2009. [Google Scholar]
- Mazziotta, M.; Pareto, A. On a Generalized Non-compensatory Composite Index for Measuring Socio-economic Phenomena. Soc. Indic. Res. 2016, 127, 983–1003. [Google Scholar] [CrossRef]
- Munda, G. Social multi-criteria evaluation for urban sustainability policies. Land Use Policy 2006, 23, 86–94. [Google Scholar] [CrossRef]
- Munda, G. Measuring sustainability: A multi-criterion framework. Environ. Dev. Sustain. 2005, 7, 117–134. [Google Scholar] [CrossRef]
- Farnia, L. On the Use of Spectral Value Decomposition for the Construction of Composite Indices; FEEM Working Paper; FEEM: Milano, Italy, 2019. [Google Scholar] [CrossRef]
- Wang, W.; Stanley, J. Differential weighting: A review of methods and empirical studies. Rev. Educ. Res. 1970, 40, 663–705. [Google Scholar] [CrossRef]
- Parulo, P.; Saisana, M.; Saltelli, A. Rating and Rankings: Vodoo or science? J. R. Statist. Soc. 2013, 176, 609–634. [Google Scholar] [CrossRef]
- OECD. Handbook on Constructing Composite Indicators: Methodology and UserGuide; OECD Publishing: Paris, France, 2005. [Google Scholar]
- Nicoletti, G.; Scarpetta, G.; Boylaud, O. Summary Indicators of Product Market Regulation with an Extension to Employment Protection Legislation. In OECD Economics Department Working Papers; OECD Publishing: Paris, France, 2000. [Google Scholar]
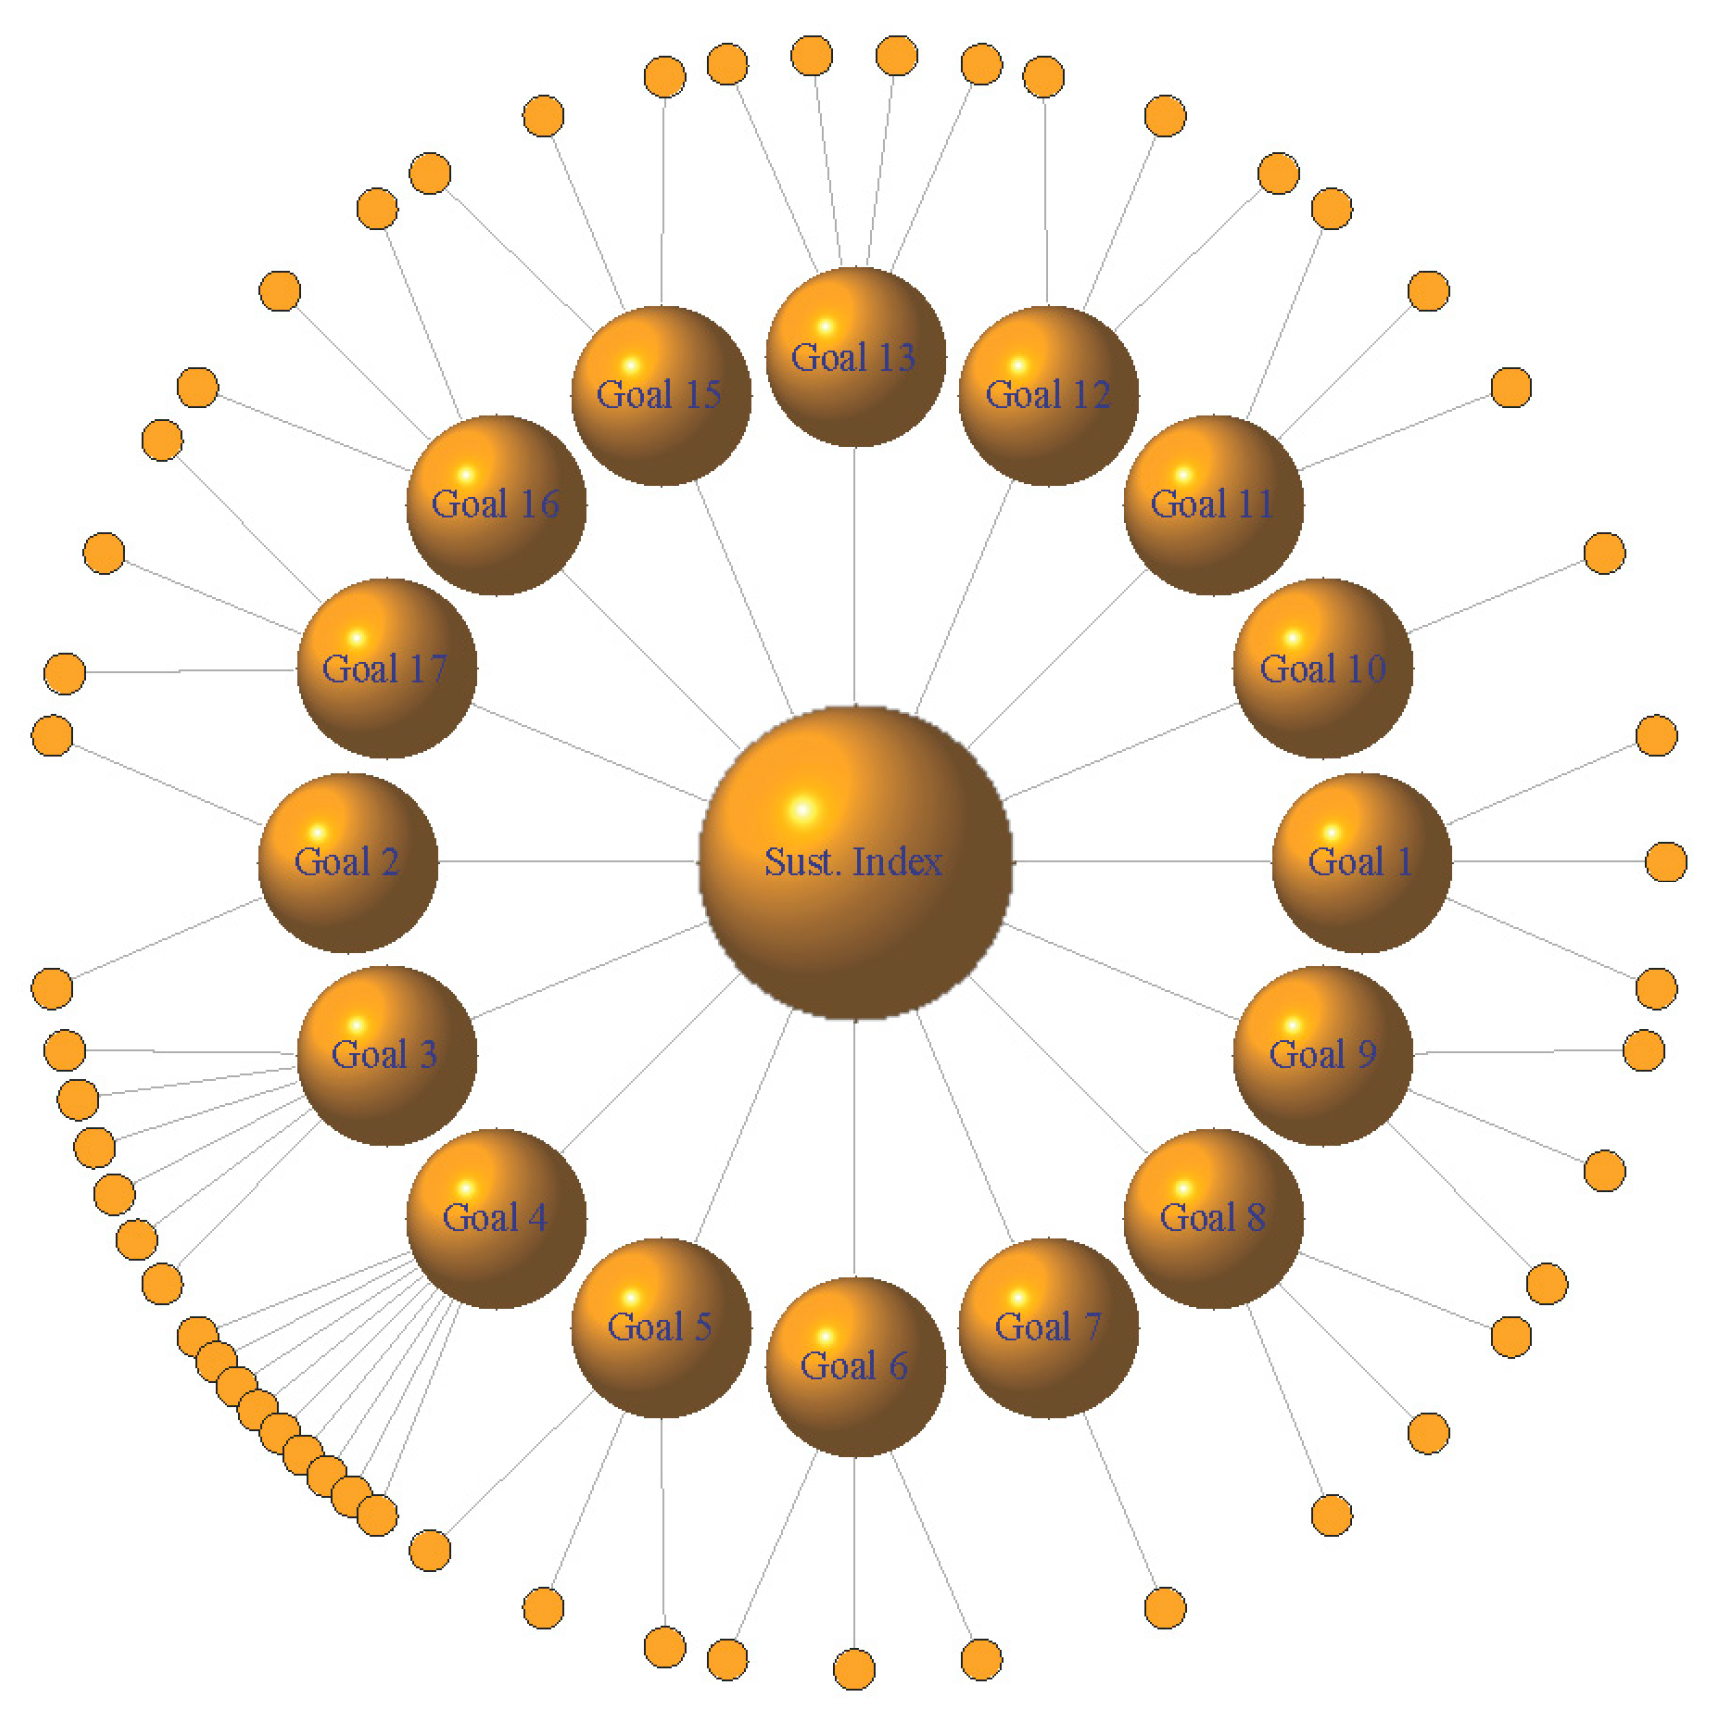

| Goal | Std. Infl. | Weight | Goal | Std. Infl. | Weight |
|---|---|---|---|---|---|
| Goal 4 | 0.137 | 0.044 | Goal 12 | 0.047 | 0.085 |
| Goal 8 | 0.136 | 0.041 | Goal 9 | 0.044 | 0.051 |
| Goal 5 | 0.103 | 0.038 | Goal 6 | 0.040 | 0.102 |
| Goal 2 | 0.087 | 0.051 | Goal 7 | 0.036 | 0.099 |
| Goal 1 | 0.084 | 0.048 | Goal 11 | 0.028 | 0.080 |
| Goal 17 | 0.081 | 0.041 | Goal 13 | 0.018 | 0.065 |
| Goal 3 | 0.079 | 0.057 | Goal 10 | 0.011 | 0.086 |
| Goal 16 | 0.072 | 0.052 | Goal 15 | 0.000 | 0.060 |
© 2019 by the authors. Licensee MDPI, Basel, Switzerland. This article is an open access article distributed under the terms and conditions of the Creative Commons Attribution (CC BY) license (http://creativecommons.org/licenses/by/4.0/).
Share and Cite
Farnia, L.; Cavalli, L.; Lizzi, G.; Vergalli, S. Methodological Insights to Measure the Agenda 2030 at Urban Level in Italy. Sustainability 2019, 11, 4598. https://doi.org/10.3390/su11174598
Farnia L, Cavalli L, Lizzi G, Vergalli S. Methodological Insights to Measure the Agenda 2030 at Urban Level in Italy. Sustainability. 2019; 11(17):4598. https://doi.org/10.3390/su11174598
Chicago/Turabian StyleFarnia, Luca, Laura Cavalli, Giula Lizzi, and Sergio Vergalli. 2019. "Methodological Insights to Measure the Agenda 2030 at Urban Level in Italy" Sustainability 11, no. 17: 4598. https://doi.org/10.3390/su11174598
APA StyleFarnia, L., Cavalli, L., Lizzi, G., & Vergalli, S. (2019). Methodological Insights to Measure the Agenda 2030 at Urban Level in Italy. Sustainability, 11(17), 4598. https://doi.org/10.3390/su11174598


